creation - Queen Mary University of London
39
Abstract This paper is the first one to examine empirically whether ethnic, cultural and immigrant population diversity within countries is favourable for entrepreneurship and job creation. Building on existing, yet disjointed theories on diversity, the paper provides insights as to why different types of diversity may have different effects on entrepreneurship. We test our predictions using multilevel modelling and the Global Entrepreneurship Monitor survey of over 1.5 million people across 88 countries. We find that diversity boosts the number start- ups and new businesses. Also, businesses hire more employees in countries that have a higher population share of skilled or unskilled immigrants due to skill complementarity. However, businesses are more likely to close down in countries with higher cultural or immigration diversity, likely due to market fragmentation. Our results show that small changes in diversity lead to significant changes in the probability of business survival and job creation. These results have important policy implications for countries seeking to toughen their immigration policies. Since societies will continue to become more diverse, considering the multiple dimensions of diversity will become ever more relevant for research and policymaking. Keywords: Ethnolinguistic diversity; culture; immigration, entrepreneurship; start- ups; job creation; GEM survey; cross-country analysis. JEL codes: F22, M13, M14, M21, M51, L26, R11. Version – April 2020 CGR WORKING PAPER SERIES School of Business and Management CENTRE FOR GLOBALISATION RESEARCH (CGR) CGR Working Papers Series CGR Blog The contrasting effects of ethnic, cultural and immigrant diversity on entrepreneurship and job creation CGR Working Paper 101 Roxana Gutiérrez-Romero
Transcript of creation - Queen Mary University of London

Abstract
This paper is the first one to examine empirically whether ethnic, cultural and
immigrant population diversity within countries is favourable for
entrepreneurship and job creation. Building on existing, yet disjointed theories on
diversity, the paper provides insights as to why different types of diversity may
have different effects on entrepreneurship. We test our predictions using
multilevel modelling and the Global Entrepreneurship Monitor survey of over 1.5
million people across 88 countries. We find that diversity boosts the number start-
ups and new businesses. Also, businesses hire more employees in countries that
have a higher population share of skilled or unskilled immigrants due to skill
complementarity. However, businesses are more likely to close down in countries
with higher cultural or immigration diversity, likely due to market fragmentation.
Our results show that small changes in diversity lead to significant changes in the
probability of business survival and job creation. These results have important
policy implications for countries seeking to toughen their immigration policies.
Since societies will continue to become more diverse, considering the multiple
dimensions of diversity will become ever more relevant for research and
policymaking.
Keywords: Ethnolinguistic diversity; culture; immigration, entrepreneurship; start-
ups; job creation; GEM survey; cross-country analysis.
JEL codes: F22, M13, M14, M21, M51, L26, R11.
Version – April 2020
CG
R W
OR
KIN
G P
AP
ER
SE
RIE
S
School of Business and Management CENTRE FOR GLOBALISATION RESEARCH (CGR) CGR Working Papers Series CGR Blog
The contrasting effects of ethnic, cultural and
immigrant diversity on entrepreneurship and job
creation
CGR Working Paper 101
Roxana Gutiérrez-Romero
The contrasting effects of ethnic, cultural and immigrant diversity on entrepreneurship
and job creation♣
Roxana Gutiérrez-Romero
This Version: April 2020
This paper is the first one to examine empirically whether ethnic, cultural and
immigrant population diversity within countries is favourable for entrepreneurship
and job creation. Building on existing, yet disjointed theories on diversity, the paper
provides insights as to why different types of diversity may have different effects on
entrepreneurship. We test our predictions using multilevel modelling and the Global
Entrepreneurship Monitor survey of over 1.5 million people across 88 countries. We
find that diversity boosts the number of start-ups and new businesses. Also,
businesses hire more employees in countries that have a higher population share of
skilled or unskilled immigrants due to skill complementarity. However, businesses are
more likely to close down in countries with higher cultural or immigration diversity,
likely due to market fragmentation. Our results show that small changes in diversity
lead to significant changes in the probability of business survival and job creation.
These results have important policy implications for countries seeking to toughen
their immigration policies. Since societies will continue to become more diverse,
considering the multiple dimensions of diversity will become ever more relevant for
research and policymaking.
Keywords: Ethnolinguistic diversity; culture; immigration, entrepreneurship; start-
ups; job creation; GEM survey; cross-country analysis
JEL classifications: F22, M13, M14, M21, M51, L26, R11
♣ Centre for Globalisation Research (GCR) working paper series, School of Business and
Management, London, UK. [email protected].
I acknowledge financial support from the Spanish Ministry of Science and Innovation
(ECO2013-46516-C4-1-R) and the Generalitat of Catalunya (2014 SGR 1279).
1. Introduction
The number of international migrants has more than doubled worldwide since the
1960s, with some areas such as OECD countries experiencing a threefold increase in
the share of foreign-born people in the workforce (Alesina, Harnoss and Rapport,
2016). The higher diversity resulting from historical and recent population mobility
represents many challenges. More diverse countries, for instance, tend to have poor
economic performance, growth, investments and are more prone to conflict (Easterly
and Levine, 1997; Gören, 2014; Montalvo and Reynal-Querol, 2005). However,
contrasting views, stemming mostly from the entrepreneurship literature, suggest that
diversity is not necessarily harmful for growth as it can promote the creation of
businesses and social mobility (Danes et al., 2008).
Several reasons can explain the contrasting views on the effects of diversity.
Much of the literature has focused on short-term impacts of increased diversity, such
as on start-ups, overlooking whether these businesses will survive or create jobs. Also,
ethnic and immigrant groups have typically been analysed in isolation, instead of
assessing the characteristics that these groups may have in common with the rest of
the population (Ram et al., 2010). But perhaps the most important factor limiting our
understanding is that the effects of ethnic, cultural and immigrant diversity have been
analysed separately, while keeping the narratives of how diversity affects
entrepreneurship intertwined (Hlepas, 2013; Vertovec, 2007). The empirical under-
exploration of whether ethnic, cultural and immigrant diversity affect
entrepreneurship differently is also reflected in the lack of theoretical frameworks
examining these dimensions simultaneously. Although the multiple dimensions of
diversity might overlap, their effects on entrepreneurship, and more broadly on
development, might not necessarily be similar (Desmet, Ortuño-Ortín and Wacziarg,
2017).1 For instance, new cross-country data show birthplace immigrant diversity is
surprisingly uncorrelated to ethnic and cultural diversity, contradicting the common
assumption that the effects of higher diversity necessarily go hand in hand (Alesina,
Harnoss and Rapport, 2016).
1 Vertoveck (2007) introduced the concept of ‘superdiversity’ to reflect the
complexities derived from having multiple layers of diversity in ethnicity, country of
origin or culture. These theoretical conceptualizations have been difficult to advance
empirically given lack of data (Yamamura and Lasalle, 2019)

This article makes two important contributions to the empirical literature on
diversity and entrepreneurship. First, the article offers the first systematic analysis of
whether the association between ethnic diversity and entrepreneurial activity differs
from the one observed for cultural or immigrant birthplace diversity. To this end, the
article builds on existing yet disjointed theories on diversity and adds insights as to
why within-country ethnic, cultural and immigrant diversity may have different
effects on business creation and business survival. The goal is not to test whether
ethnic minorities or immigrants are more likely to create businesses, an issue that has
been explored extensively (e.g. Basu and Altinay, 2002; Fritsch and Wyrwich, 2017;
Kerr and Kerr, 2020; Wessendorf, 2018). Instead, we seek to assess the net effect that
within-country diversity has on entrepreneurial activities, while also considering other
important country-level and people’s characteristics. Second, we assess another
important issue overlooked, the impact of within-country diversity on job creation,
that is, the number of employees that businesses hire. Thus, the article provides a
comprehensive overview on whether diversity helps people to identify business
opportunities, whether these are seized, and whether businesses grow and survive.
We analyse the publicly available Global Entrepreneurship Monitor (GEM)
adult population survey of over 1.5 million people across 88 countries from 2001 until
2011. GEM, the largest comparative international survey of entrepreneurial activity,
allows us to test how diversity affects entrepreneurship across a wide range of
institutional and development settings. Using multilevel modelling, we control for
country- and individual-level factors. Thus, in addition to assessing the role of various
aspects of diversity, we consider the population share of immigrants, Gross National
Income (GNI) per capita, institutional variables, as well as respondents’ sex,
education, family income and access to entrepreneurial networks. To measure
diversity, we use three indices at country-level. These are the ethnic fractionalization
index proposed by Alesina et al. (2003), the index of cultural diversity proposed by
Fearon (2003) and the index of immigrant birthplace diversity proposed by Alesina,
Harnoss and Rapport (2016).
Our article offers four key findings. First, we find that ethnic, cultural and
migrant diversity all boost the number of start-ups and new businesses. These
businesses, however, are more likely to die soon in countries with higher cultural or
immigrant birthplace diversity, unlike in more ethnically diverse regions. We argue
that our contrasting findings can be explained by how diversity affects demand

specialisation. We show that businesses embedded in more ethnically diverse settings
specialise in their domestic market, where they are likely to find a higher demand for
their products and services. In contrast, businesses embedded in more cultural and
immigrant diverse settings and with more immigrants have a higher share of exports.
Thus, our findings suggest that when demand is fragmented across various
international communities it is not conducive to business survival, particularly for
small businesses such as those analysed here.
Second, we find that businesses hire more employees in countries that have a
higher population share of skilled and unskilled immigrants. This job-expansion
effect is stronger in industries more intensive in knowledge, suggesting that
immigrants bring critical skills needed by businesses, and supporting theories on skill
complementarity (Ottaviano and Peri, 2006). However, our third important finding
reveals that both ethnic and cultural diversity are not conducive to job creation, as
both reduce the number of employees that businesses hire. We show that this
reduction in job creation can be explained by the fact that ethnic and cultural diversity
dampen domestic investments, in line with theories that suggest heterogeneity of
preferences for private and public goods across groups affects investment
coordination and job creation (Azzimonti, 2011).
Fourth, the article reveals the importance of examining the different
dimensions of ethnic, cultural and immigrant diversity, since these can affect
entrepreneurship differently over time. Hence, our findings suggest that the narratives
as to how diversity affects entrepreneurship should not be generalised, but are
dependent on what aspect of diversity is being examined, as well the stage of
entrepreneurship being analysed. It is this granular view that helps reconcile some of
the seemingly contradictory findings of the economic and entrepreneurship research
on diversity. Our findings are robust to several checks such as using different
controls, model specifications, and alternative indices of diversity. Overall our
findings reveal a solid empirical basis for distinguishing the effects of the different
types of diversity on entrepreneurship and job creation.
The article continues as follows. The next section discusses the literature on
diversity, entrepreneurship and job creation. The following sections then describe the
data sources, show the multilevel results and robustness checks. The last section
presents our conclusions.

2. Diversity, entrepreneurship and job creation
The literature on the relationship between diversity and entrepreneurship has
typically focused on case studies, short-run outcomes, such as start-ups, and a
particular aspect of diversity (either ethnic, cultural or immigrant) while often making
broad generalisations about its findings. 2 In this section, we contribute to the
literature by explicitly uncovering that while diversity in general might boost early-
stage entrepreneurship, not all types of diversity are favourable for business survival
or job creation.
2.1. Ethnic diversity
Ethnicity is understood as the shared social traits and common history that groups
have, or what others think of them as having (Yinger, 1985). Many entrepreneurs in
ethnic economies where people share ethnic identity start out by serving fellow
community members in their ethnic neighborhood as ethnic ties facilitates raising
startup capital, identifying potential clients and providers (Somashkhar, 2019).
Several theoretical and empirical studies have found that ethnic diversity is associated
with a higher rate of business creation and survival. For instance, according to the
ethnocultural theory, ethnic entrepreneurs serve as role models, inspiring others to see
entrepreneurship as a viable occupation (Masurel, Nijkamp and Vindigni, 2004;
nDoen et al., 2000). Also, dealings based on coethnic loyalties can increase the
chance of business creation and mutual survival by providing access to informal
networks and strengthening demand for ethnic products. For this reason, ethnic
businesses tend cluster strategically, in urbanised settings, according to the mixed
2 This issue is exacerbated as empirical studies focused on ethnic diversity often use
indices more suitable for measuring cultural diversity and vice versa (see Kemeny
(2017) for a recent review). Similarly, some studies seeking to assess the effects of
increased migration often use ethnic and cultural diversity indicators. Although ethnic
and cultural diversity undoubtedly capture some of the effects directly associated
with immigration, these studies not necessarily fully capture the effect of
immigration diversity. For instance, people born in different countries have been
educated under different systems, possessing perhaps different skills and
entrepreneurial values than groups raised and educated in the same country (Alesina,
Harnoss and Rapport, 2016).

embeddedness theory. Nonetheless, these businesses have slim chances of generating
jobs as they face tough competition from other similar small firms (Aldrich et al.,
1983; Volery, 2007).3 Moreover, since ethnic minorities are often denied credit, their
businesses tend to be smaller than those of native entrepreneurs and rely more on
self-employment or family members (Bruder, Neuberger and Räthke-Döppner, 2011;
Cavalluzzo and Wolken, 2005).
2.2. Cultural diversity
Entrepreneurial differences across groups stem not only from differences in their
ethnicity but also because of differences in their cultural values (Sowell, 1981).4
Culture is understood as the set of shared values and beliefs that guide individual and
collective behaviour (Hofstede, 1984). Several theoretical and empirical studies have
found that cultural diversity is associated with business creation. For instance, the
knowledge spill-over theory of entrepreneurship (KSTE) has argued that cultural
diversity may boost business creation, as people can learn more easily about different
consumer preferences and products, which facilitates identifying business
opportunities (Acs, Audretsch and Lehman, 2013). Several empirical studies have
found support for this theory (Cheng and Li 2012; Rodríguez-Pose and Hardy, 2015;
Sobel, Dutta and Roy 2010). While some studies point towards a ‘cultural diversity
dividend’ (Niebuhr, 2010), the literature also stresses that there are cultural diversity
trade-offs (Nikolova and Simroth, 2013; Sobel, Dutta and Roy 2010). Cultural
diversity, for instance, may lead to higher communication barriers, mistrust and social
instability, which are not necessarily conducive to business survival nor job
expansion (Caprar et al., 2015; Nathan and Lee, 2013; Nettle et al., 2007; Rodríguez-
Pose and Hardy, 2015).
3 The clustering of entrepreneurs observed in urban settings is one of the reasons why
the literature has focused on analysing diversity in cities (Karlsson, Rickardsson, and
Wincent, 2020; Kemeny, 2017).
4 Cultural differences have also been found to lead to persistent variance in
performance among countries (Spolaore and Warcziarg, 2013), workers and firms
(Gibbons and Henderson, 2013).
2.3. Immigrant diversity and share of immigrants
Despite the rich and vibrant research on diversity and the sharp increase in migration
flows, surprisingly not much is known about the net effect that immigrants and the
associated increase in population diversity have on entrepreneurship over time
(Kemeny, 2017). Instead the literature has focused on short-term impacts of recent
immigration flows, finding that recent immigrants are more likely to have their own
business than native population. 5 For instance, among the studies using the KTSE
theoretical framework show that as immigrant diversity increases, so do new markets
offering traditional products, and skill complementarity all beneficial for productivity
and entrepreneurship of both immigrants and the native population (Rodríguez-Pose
and Hardy, 2015; Saxena, 2014). A burgeoning literature has also explored the rise of
migrant diversity and transnational entrepreneurship, where immigrants are involved
in border crossing business activities involving their country of origin and destination,
might have positive effects for both the country of origin and recipient country of
migration flows (e.g. Portes, Haller and Guarnizo, 2002; Zapata-Barrero and Rezaei,
2019). However, other studies are more cautious about the potential effect of
immigrant diversity. As the discrimination theory points out, the ‘immigrant
entrepreneur’ phenomenon can be explained out of constrained choices, such as the
labour discrimination that immigrants often face (Vandor and Franke, 2006). Since
immigrants also often face credit constraints, their businesses tend to be smaller than
those of the native population, and also have low chances of surviving (Cavalluzzo
and Wolken, 2005). Even though immigrant entrepreneurs might benefit from
coethnic networks, these bonds might be insufficient for entrepreneurial success
(Moyo, 2014). Business survival will be threatened, for instance, if their market is
fragmented without the critical mass required, or if the purchasing power of their
clients, such as other minority groups, is weak (Aldrich and Waldinger, 1990).
5 Several other studies show that immigrants are three times as likely as native
citizens to become entrepreneurs in the UK, twice as likely in the USA and many
other countries (Burn-Callander, 2016; Vandor and Franke, 2006). There are
exceptions too, as recent immigrants coming from countries with an overall low rate
of entrepreneurship tend to have a low likelihood of setting up businesses elsewhere
(Desiderio and Salth, 2010).

Interestingly, some case studies suggest that increased immigrant diversity
might have different outcomes to those produced by having a higher share of
immigrants. For instance, Ottaviano and Peri (2006) find that a higher share of the
immigrant population in metropolitan areas in the USA led to an increase in salary of
native workers, thanks to the boost in productivity derived from the skill
complementarity that immigrants brought. Similarly, Kahane et al. (2013), using data
on the National Hockey League (NHL) teams in the USA, find that teams with a
higher share of immigrant players boost performance due to increased skill
complementarity. However, as diversity in immigrant players increases, performance
surprisingly worsens. This finding is in line with other management studies that have
also found immigrant diversity has decreasing returns, as it worsens team cohesion
and coordination costs (Milliken and Martins, 1996).6
Based on all the theories and evidence reviewed, we formulate the following
three hypotheses. We also explain below which indices we will use to disentangle the
various effects of diversity.
Hypothesis 1: Diversity (ethnic, cultural or immigrant birthplace) increases early-
stage entrepreneurial activity.
Hypothesis 2: Unlike cultural or immigrant birthplace diversity, ethnic diversity
helps business survival.
Hypothesis 3: A higher share of skilled immigrants in the population helps
businesses create more jobs because of skill complementarity. In contrast, diversity
(ethnic, cultural or immigrant birthplace) hinders job expansion.
2.4. Measuring ethnic diversity
We use the ethnic fractionalization index proposed by Alesina et al. (2003) which has
dominated the analysis of ethnic diversity. As shown in Equation (1), this index uses
the Herfindahl measure, which captures the probability that two people drawn
6 Decreasing returns of immigrant diversity have also been found for innovation (Lee,
2015).

randomly from within a country are from different ethnic groups.7 The index ranges
from zero, when all belong to the same ethnic group, to a maximum of one, where
everyone belongs to different groups. Ethnic groups are identified on the basis of both
linguistic characteristics (for most of Africa and Europe) and racial characteristics
(for most of Latin America), an approach commonly used by ethnologists and
anthropologists.8
, (1)
where sgj is the share of group g (g=1…N) in country j.
2.5. Measuring cultural diversity
Despite several studies recognising that ethnic and cultural diversity capture different
aspects, these have commonly been measured using the same ethnolinguistic indices
(Hlepas, 2013).9 In contrast, here we measure cultural diversity using the index
proposed by Fearon (2003). This index gives a sense of the cultural distance between
7 Alesina et al. (2003) used multiple sources but mainly the Encyclopaedia Britannica
(for 124 out of 190 countries) and the CIA World Factbook (for 25 countries).
8 Other measures of ethnic diversity have been suggested. For instance, Easterly and
Levine (1997) proposed to measure ethnic diversity based on the linguistic
classification of the 1964 Atlas Narodov Mira, also using the Herfindahl index.
Measuring ethnic diversity based solely on linguistic distinctions has received
criticism, as it obscures other aspects of ethnic diversity such as skin colour or racial
origin. For this reason, the ethno-linguistic index proposed by Alesina et al. (2003)
tends to be more broadly used. Fearon (2003) also proposed an index that is highly
correlated with that of Alesina et al. (2003), since both use the Herfindahl measure
and have overlaps in some data sources. Similarly, Montalvo and Reynal-Querol
(2005) proposed a polarisation index designed to study conflict. All the alternative
ethnic diversity indices perform similarly in cross-country regressions, showing that
ethnic diversity leads to lower trust, growth and more political instability.
9 An alternative approach in the international business literature is to measure culture
diversity using the Hofstede model (Hofstede, 1984) which measures differences in
cultural practices across countries, but with the main disadvantage of ignoring the
likely subnational cultures within each country.
groups based on the structural distances between the groups’ mother tongue.
Linguists believe the languages we have today evolved from a distant common
ancestral language. Tree diagrams are used to typify the structural relationships
among languages, which are classified into family branches; it is assumed, the closer
the branch, the closer the cultural proximity. As shown in Equation (2) this cultural
diversity index ranges from zero, when the entire population speaks the same
language, to one, where all groups in the country speak structurally unrelated
languages.
, (2)
Where l is the level or branch at which group i’s and j’s languages diverge. M is the
highest number of common classifications in the linguistic dataset (14 in the data
Fearon used), the k parameter is set to 0.5 to yield an analogous measure to the
ethnolinguistic index.
2.6. Measuring birthplace immigration diversity
To measure immigrant diversity we use the index proposed by Alesina, Harnoss and
Rapport (2016). This index is based on people’s birthplace, for the workforce of 195
countries in the years 1990 and 2000. The index also uses the Herfindahl measure,
hence, it estimates the likelihood that two people drawn randomly from the
population have two different countries of birth. Immigrants are identified as foreign-
born people aged 25 or older.10
This birthplace immigration index can be separated into two: the birthplace
immigrant diversity and the share of immigrants in the population. Both these
statistics can be further broken down for skilled and unskilled immigrants. Alesina,
Harnoss and Rapport (2016) show that contrary to widely made assumptions, the
immigrant diversity index is uncorrelated to ethnic or cultural diversity indices (see
Figure 1). This lack of correlation might explain why, in contrast to ethnic or cultural
diversity indices, the population share of immigrants has been found to be positively
associated with income per capita in cross-country regressions. To the best of our
10 This immigration index uses the Artuc et al. (2015) dataset, which provides bilateral
data on migration across 195 countries.

knowledge, no cross-country analysis has previously used this new immigration
diversity index to analyse the impact on entrepreneurship and job creation.
United States
Russia
Egypt
South Africa
Greece
Netherlands
Belgium
France
Spain
HungaryItaly
Romania
Switzerland
AustriaUnited KingdomDenmark
SwedenNorway
Poland
Germany
Peru
Mexico
Argentina
Brazil
Chile
ColombiaMalaysia
Australia
Indonesia
Philippines
New ZealandSingapore
Thailand
Japan
China
Turkey
India
PakistanIran
Canada
Morocco
Algeria
Tunisia
Ghana
Nigeria
Angola
Barbados
Uganda
Zambia
Portugal
IrelandIceland
Finland
Lithuania
LatviaSerbia
Croatia
Slovenia
Bosnia and Herzegovina
Macedonia
Czech Republic
Guatemala
Costa Rica
Panama
Bolivia
Ecuador
Uruguay
Tonga
Kazakhstan
Hong Kong
Trinidad and Tobago
Jamaica
Bangladesh
Lebanon
Jordan
Syria
Saudi Arabia
Yemen
United Arab Emirates
Israel
Domenican Republic
0.2
.4.6
.81
Eth
nic
fra
ctionaliz
ation index
0 .2 .4 .6 .8 1Birthplace immigration diversity
Panel A
United States
Russia
Egypt
South Africa
GreeceNetherlands
Belgium
FranceSpain
Hungary
Italy
Romania
Switzerland
Austria
United Kingdom
Denmark
Sweden
Norway
Poland
Germany
Peru
Mexico
ArgentinaBrazil
Chile
Colombia
Malaysia
Australia
Indonesia
Philippines
New ZealandSingapore
Thailand
Japan
China
Turkey
India
Pakistan
Iran
Canada
Morocco
Algeria
Tunisia
Ghana
Nigeria
Angola
Uganda
Zambia
Portugal
IrelandFinland
Lithuania
Latvia
Serbia
CroatiaSlovenia
Bosnia and Herzegovina
Macedonia
Czech Republic
Guatemala
Costa Rica Panama
Bolivia
Ecuador
Uruguay
Kazakhstan
Trinidad and Tobago
Jamaica
Bangladesh
Lebanon
Jordan
Syria
Saudi Arabia
Yemen
United Arab Emirates
Israel
Domenican Republic0.2
.4.6
.8
Culture
div
ers
ity
0 .2 .4 .6 .8 1Birthplace immigration diversity
Panel B
Figure 1. Ethnic and immigrant diversity.
Note that all diversity indices used are for the year 2000, that is right before
the period of analysis. As Alesina et al. (2003) explain, this is reasonable, and a sound
approach given that population diversity is sufficiently stable over a 20-year horizon.
Thus, although we will not fully capture how recent changes in diversity brought by
constant migration movements affect entrepreneurship, by using diversity measures
that immediately precede the entrepreneurial statistics we sidestep potential
endogeneity issues.
3. Data and method
We test our three hypotheses using the Global Entrepreneurship Monitor (GEM)
adult population survey. GEM is the largest comparable cross-country survey on
entrepreneurship, drawing nationally representative samples each year. In total we
analyse 88 out of the 89 countries that have taken part in these surveys for at least one
year during the 2001–2011 period, capturing both developed and developing
regions.11
3.1. Dependent variables
To test hypothesis 1, we use as a dependent variable whether the GEM respondent is
engaged in early-stage entrepreneurial activity. Separately, to test hypothesis 2, we
use as a dependent variable whether the respondent has an established business.
Early-stage and established businesses are defined by GEM as follows (Reynolds et
al., 2005):
• Early-Stage Entrepreneurial Activity includes entrepreneurs aged 18–64 who
either have a start-up or a young business. Start-ups are people who are
actively setting up a new business that they will own and manage, but who
have not received salaries or any other payments for more than three months.
Young businesses are those who have paid salaries or any other payments to
their owners for more than three months and up to 3.5 years.
• Established businesses are those who have paid salaries, or any other
payments, to their owners for more than 3.5 years.
11 We excluded Montenegro, as it has no indices on ethnic nor cultural diversity.

We test hypothesis 3 using as dependent variable the number of employees hired
by young businesses, and separately the number of employees hired by established
businesses. Both of these variables exclude the owners of the firm.
As shown in Table 1, 1,524,407 people were interviewed by the GEM network
across the 88 countries considered. From those, 70,410 have a start-up (5% of the
sample). A further 56,813 own a young business (4% of the sample), and 100,538
people own an established business (7% of the sample). The average number of
employees hired by young businesses is 5.9, while the number for established
businesses is slightly lower at 5.6.
Table 1. GEM survey summary statistics.
Observations Percentage Std. Dev.Actively involved as owner of a start-up 1,524,407 0.05 0.21
Manages and owns a business younger than 3.5 years 1,524,407 0.04 0.19
Manages and owns a business older than 3.5 years 1,524,407 0.07 0.25
Entrepreneurial networking: Personally knows someone who started a business 2 years ago 1,234,953 0.37 0.48
Is business angel (over past 3 years lent to non-family members funds for a new business) 1,524,407 0.01 0.11
Female 1,524,094 0.53 0.50
Believes have knowledge, skill and experience required to start a new business 1,206,878 0.49 0.50
Has post-secondary education 1,524,407 0.15 0.36
Number of employees working for business younger than 3.5 years old (excluding the owners) 14,435 5.90 18.45
Number of employees working for business older than 3.5 years old (excluding the owners) 100,326 5.57 20.41
Unweighted descriptive statistics
3.2. Independent variables
3.2.1. Diversity
The publicly available GEM surveys analysed here do not include respondents’
ethnicity, birthplace nor their area of residency within the country. Thus, we
complement the GEM survey with three external diversity indices for each country.
As mentioned above, these are the ethnic fractionalization index as estimated by
Alesina et al. (2003), the index of cultural diversity by Fearon (2003), and the
birthplace immigration diversity index by Alesina, Harnoss and Rapport (2016).
All these indices offer a measure of diversity near the year 2000, right at the
beginning of our analysis. Previous cross-country studies using these diversity indices
treat them as exogenous, that is, pre-dating the dependent variable without capturing
changes in diversity over time (Alesina et al. 2003). We follow the same approach
here.
3.2.2. Country-level variables
We also consider countries’ GNI per capita in constant terms at purchasing power
parity (PPP), which serves as a proxy for the country’s market size and level of
development. We include this control as it is known that the correlation between the
ethnic fractionalization index and development measures (such as illiteracy, infant
mortality and infrastructure quality) lose significance when considering countries’
income per capita (Alesina and La Ferrara, 2005). To avoid endogeneity with our
entrepreneurship measures, we include the GNI per capita for the year 2000 only.
We also add the origin of the country’s legal code, that is, whether it comes
from the English common law tradition, or the civil tradition (stemming from the
French, Socialist, German or Scandinavian legal tradition). We include this variable
as the relationship between diversity and development is likely to depend on the
quality of institutions, and there are significant differences in how legal traditions
protect businesses. For instance, the French legal tradition actively protects workers’
rights. In contrast, in the German legal tradition, the ‘communitarian conception of
the enterprise’ is the primary driver of legislation, resulting in more favourable
regulation for businesses, according to La Porta, Lopez-de-Silanes and Shleifer
(2008). The extensive research of these authors has also shown that the origin of the
legal code influences the regulation of the labour market, firm entry, investments and
job creation, all of which are relevant for our analysis.
We also control for regional fixed effects (whether in Africa, Asia, Europe,
Latin America, North America, Oceania, or the Middle East), as ethnic diversity is
correlated regionally (Alesina et al., 2003). We add fixed-year effects to take into
account other time-variant factors, such as shocks to the economy, which might have
occurred during the period of analysis.
3.2.3. Individual-level control variables
At the respondent-level, we include whether the respondent has entrepreneurial
networks. To this end, we use a binary variable based on the ‘yes’ or ‘no’ response to
the GEM survey question: ‘Do you personally know someone who started a business
in the past two years?’. We include this variable, as role models contribute to
enriching people’s social capital and increasing the chances of business survival
(Burt, 2005).

We also add a binary variable identifying whether the respondent is a
moneylender, better known as a business angel in the GEM literature. We do so as
informal financial networks are vital for business survival, particularly in diverse
environments (Bruder, Neuberger and Räthke-Döppner, 2011). We identify business
angels as respondents who ‘over the past three years, provided funds for a new
business’ and ‘lent these funds to non-family members’.
We include the respondents’ gender and age, since they influence access to
financial networks and entrepreneurial engagement (Runyan, Huddleston and
Swinney, 2006). We also add the respondents’ family household income, as previous
research shows this variable affects whether businesses are created, survive and
expand (Dollinger, 2003). GEM records income in tertiles, meaning whether
respondents stated their family income falls in the lowest, middle or top third of the
family income distribution of the country and year where the interview took place.
Following the literature on human capital, we include respondents’ education
level. This variable measures whether respondents have post-secondary education or
not. We do not predict how education will affect entrepreneurship, as the
international evidence is rather mixed (Lee and Tsang, 2001). Last, we include
people’s self-reported business skills, known to be essential for business survival and
job expansion (Cuervo, 2005). This variable is based on the ‘yes’ or ‘no’ answer to
the following GEM question: ‘Do you have the knowledge, skill and experience
required to start a new business?’.
Tables 2 and 3 show the summary statistics and correlations among the diversity
indices used. Table A.1 shows the diversity and entrepreneurship statistics used for
each of the 88 countries analysed.

Table 2. Diversity indices statistics.
Variable Obs Mean Std. Dev. Min Max
Ethnic fractionalization, Alesina 88 0.36 0.25 0.00 0.93
Cultural diversity, Fearon 81 0.25 0.20 0.00 0.67
Language diversity, Alesina 88 0.30 0.27 0.00 0.92
Ethnic diversity, Fearon 80 0.40 0.25 0.00 0.93
Birthplace Diversity, all immigrants 81 0.77 0.20 0.06 0.96
Birthplace Diversity, skilled immigrants 81 0.81 0.18 0.09 0.97
Birthplace Diversity, unskilled immigrants 81 0.76 0.21 0.05 0.96
Population share of all immigrants 81 0.08 0.11 0.00 0.65
Population share of skilled immigrants 81 0.11 0.16 0.00 0.98
Population share of unskilled immigrants 81 0.08 0.11 0.00 0.61
Table 3. Correlation among diversity indices.
(1) (2) (3) (4) (5) (6) (7)
(1) Ethnic fractionalization, Alesina 1.00
(2) Cultural diversity, Fearon 0.67 1.00
(3) Language diversity, Alesina 0.68 0.64 1.00
(4) Ethnic diversity, Fearon 0.86 0.75 0.64 1.00
(5) Birthplace diversity, all immigrants -0.12 -0.09 -0.09 -0.06 1.00
(6) Birthplace diversity, skilled immigrants -0.13 -0.10 -0.15 -0.08 0.93 1.00
(7) Birthplace diversity, unskilled immigrants -0.12 -0.08 -0.05 -0.05 0.99 0.88 1.00
4. Multilevel analysis
Survey respondents are more likely to behave similarly to respondents living in the
same country than with respondents in other countries. This dependency invalidates
commonly used regression models such as Ordinary Least Squares (OLS), as they
require the errors to be unrelated across units or levels (Mehmetoglu and Jakobsen,
2016). Thus, to test the impact of diversity on business participation we use a series
of multilevel probit regression models, suitable to handle the nature of our nested
data. Equation (3) shows the level-1 (individual) and level-2 (country) characteristics
considered.
Pr(Entrepreneurijk=1)= φ (β0+ β1Xijk + β2Yeark + γCj + uj + eijk) (3)
Our dependent variable Entrepreneur takes the value of 1 in case the
respondent i in country j at year k is engaged in early-stage entrepreneurship, and
takes the value of 0 if not. Separately, we also analyse respondents who own
established businesses. φ is the cumulative distribution function of the standard
normal distribution, u and e are the error terms at country and individual level. We

add X, a set of respondents’ characteristics and Year fixed effects. Vector C
represents the country’s characteristics. This vector includes the origin of the
country’s legal code, GNI per capita, regional fixed effects. We also add the ethnic
fractionalization index, the cultural and immigrants’ birthplace diversity indices.
Following Alesina, Harnoss and Rapport (2016), we include all these diversity
indices and the population share of immigrants simultaneously in some of our models
to capture their potential distinct effects.
5. Results
5.1. Entrepreneurship and diversity
Table 4 displays the probit marginal effect coefficients of the two-level multilevel
regression shown in Equation (3). The individual and institutional variables
considered are in line with our expectations. Moreover, supporting hypotheses 1 and
2, the ethnic fractionalization index is positively associated with both the country’s
average probability that people will have an early-stage business (columns 1-5) as
well as an established business (columns 6-10). This positive association is robust to
adding the cultural and immigrant birthplace diversity indices and the population
share of immigrants.
Also supporting hypothesis 1, we find that the cultural and the immigrant
birthplace diversity (all, skilled and unskilled) indices are positively associated with
the country’s average probability that people will have an early-stage business
(columns 1-5). In line with hypothesis 2, all the cultural and the immigrant birthplace
diversity indices reduce the average probability of people having an established
business (columns 6-10), suggesting that a higher degree of diversity is not conducive
for business survival.
We also find that a higher population share of skilled immigrants is
favourable for early-stage entrepreneurship (column 4), unlike a higher share of
unskilled immigrants (column 5). There are several reasons for these findings. Skilled
immigrants are likely to have more knowledge and experience to set up their own
business than unskilled immigrants. Also, skilled workers, for instance, might offer
valuable productive labour to businesses.
Moreover, we also find that both the share of skilled and unskilled immigrants
reduces the country’s average probability of people having an established business

(columns 9 and 10). These findings suggest that immigrants’ ability to run businesses
over time are limited, perhaps due to credit constraints, or tough competition in their
main market. We explore these potential reasons next.
Table 4. Multilevel probit marginal effects of diversity on business participation.
(1) (2) (3) (4) (5) (6) (7) (8) (9) (10)
Level 1-Variables
Is business angel (over past 3 years lent to non-family
members funds for a new business) 0.043*** 0.043*** 0.044*** 0.044*** 0.044*** 0.020*** 0.021*** 0.021*** 0.021*** 0.021**
(0.002) (0.002) (0.002) (0.002) (0.002) (0.002) (0.002) (0.002) (0.002) (0.002)
Entrepreneurial network: Personally knows someone
who started a business 2 years ago 0.045*** 0.045*** 0.045*** 0.045*** 0.045*** 0.017*** 0.017*** 0.017*** 0.017*** 0.017***
(0.001) (0.001) (0.001) (0.001) (0.001) (0.001) (0.001) (0.001) (0.001) (0.001)
Believes have knowledge, skill and experience required
to start a new business 0.099*** 0.098*** 0.098*** 0.098*** 0.098*** 0.079*** 0.079*** 0.079*** 0.079*** 0.079***
(0.001) (0.001) (0.001) (0.001) (0.001) (0.001) (0.001) (0.001) (0.001) (0.001)
Female -0.014*** -0.014*** -0.014*** -0.014*** -0.014*** -0.026*** -0.025*** -0.026*** -0.026*** -0.026***
(0.001) (0.001) (0.001) (0.001) (0.001) (0.001) (0.001) (0.001) (0.001) (0.001)
Has post-secondary education 0.004*** 0.004*** 0.004*** 0.004*** 0.004*** -0.006*** -0.005*** -0.006*** -0.006*** -0.006***
(0.001) (0.001) (0.001) (0.001) (0.001) (0.001) (0.001) (0.001) (0.001) (0.001)
Age (Baseline aged 18-28)
Aged 29-38 0.011*** 0.011*** 0.011*** 0.011*** 0.011*** 0.054*** 0.053*** 0.053*** 0.053*** 0.053***
(0.001) (0.001) (0.001) (0.001) (0.001) (0.001) (0.001) (0.001) (0.001) (0.001)
Aged 39-48 0.000 0.001 -0.001 -0.001 -0.001 0.080*** 0.078*** 0.079*** 0.079*** 0.079***
(0.001) (0.001) (0.001) (0.001) (0.001) (0.001) (0.001) (0.001) (0.001) (0.001)
Aged 49-58 -0.017*** -0.017*** -0.017*** -0.017*** -0.017*** 0.089*** 0.087*** 0.088*** 0.088*** 0.088***
(0.001) (0.001) (0.001) (0.001) (0.001) (0.001) (0.001) (0.001) (0.001) (0.001)
Older than 58 -0.052*** -0.052*** -0.052*** -0.052*** -0.052*** 0.074*** 0.073*** 0.074*** 0.074*** 0.074***
(0.001) (0.001) (0.001) (0.001) (0.001) (0.001) (0.001) (0.001) (0.001) (0.001)
Family household income (baseline bottom 33%centile)
Middle 33%centile 0.002*** 0.002*** 0.002*** 0.002*** 0.002*** 0.013*** 0.012*** 0.013*** 0.013*** 0.013***
(0.001) (0.001) (0.001) (0.001) (0.001) (0.001) (0.001) (0.001) (0.001) (0.001)
Top 33% centile 0.011*** 0.011*** 0.011*** 0.011*** 0.011*** 0.030*** 0.029*** 0.030*** 0.030*** 0.030***
(0.001) (0.001) (0.001) (0.001) (0.001) (0.001) (0.001) (0.001) (0.001) (0.001)
Level 2-Variables
Fearon cultural diversity index 0.016*** 0.050** -0.012 -0.041***
(0.002) (0.002) (0.020) (0.002)
Alesina et al. ethnic fractionalization index 0.022*** 0.023*** 0.022*** 0.023*** 0.043*** 0.021*** 0.019*** 0.021***
(0.002) (0.002) (0.002) (0.002) (0.002) (0.002) (0.002) (0.002)
Birthplace diversity, all immmigrants 0.032*** 0.028*** -0.009*** -0.008***
(0.002) (0.002) (0.002) (0.002)
Population share of all immigrants -0.045*** -0.022*** -0.069*** -0.073***
(0.006) (0.005) (0.005) (0.005)
Birthplace diversity, skilled immigrants 0.025*** -0.006**
(0.003) (0.003)
Population share of skilled immigrants 0.009** -0.037***
(0.004) (0.004)
Birthplace diversity, unskilled immigrants 0.027*** -0.009***
(0.002) (0.002)
Population share of unskilled immigrants -0.030*** -0.082****
(0.006) (0.005)
GNI per capita 2000 0.000*** 0.000*** 0.000*** 0.000*** 0.000*** 0.000*** 0.000*** 0.000*** 0.000***
(0.000) (0.000) (0.000) (0.000) (0.000) (0.000) (0.000) (0.000) (0.000)
Origin of legal code (English common law)
French -0.014*** -0.018*** -0.018*** -0.016*** -0.018*** -0.010*** -0.015*** -0.013*** -0.013*** -0.012***
(0.001) (0.001) (0.001) (0.001) (0.001) (0.001) (0.001) (0.001) (0.001) (0.001)
Socialist -0.022*** -0.019*** -0.019*** -0.017*** -0.019*** -0.032*** -0.033** -0.030*** -0.031*** -0.029***
(0.002) (0.002) (0.002) (0.002) (0.002) (0.002) (0.002) (0.002) (0.002) (0.002)
German 0.013*** 0.008*** 0.009*** 0.011*** 0.009*** 0.005*** 0.002*** 0.007*** 0.006*** 0.008***
(0.001) (0.001) (0.002) (0.002) (0.002) (0.001) (0.001) (0.001) (0.001) (0.001)
Scandinavian -0.002 -0.005** 0.005*** 0.009*** 0.005*** 0.004*** 0.001 0.004*** 0.004*** 0.005***
(0.001) (0.002) (0.001) (0.001) (0.001) (0.001) (0.001) (0.001) (0.001) (0.001)
Region fixed effects Yes Yes Yes Yes Yes Yes Yes Yes Yes Yes
Year fixed effects (2001-2011) Yes Yes Yes Yes Yes Yes Yes Yes Yes Yes
Observations 750755 734111 747219 747219 747219 750755 734111 747219 747219 747219
Random-effects parameters
/lnsig2u -4.464*** -4.011*** -4.275*** -4.224*** -4.291*** -3.571*** -3.615*** -3.839*** -3.800*** -3.851***
(0.304) (0.199) (0.253) (0.241) (0.257) (0.138) (0.147) (0.179) (0.172) (0.181)
sigma_u 0.107*** 0.135*** 0.118*** 0.121*** 0.117*** 0.012*** 0.164*** 0.147*** 0.150*** 0.1468***
(0.016) (0.013) (0.015) (0.015) (0.015) (0.146) (0.012) (0.013) (0.013) (0.013)
rho 0.011*** 0.018*** 0.014*** 0.014*** 0.014*** 0.027*** 0.026*** 0.021*** 0.022*** 0.021***
(0.003) (0.003) (0.003) (0.003) (0.003) (0.004) (0.004) (0.004) (0.004) (0.004)
Observations 750755 734111 747219 747219 747219 750755 734111 747219 747219 747219
Total Early-Stage Entrepreneurship Established business older than 3.5 years
Note: Standard errors in parentheses.
Significance level *** p<0.01, ** p<0.05, * p<0.1.

5.1.1. Why does ethnic diversity boost entrepreneurship, unlike other types of
diversity?
How diversity affects business survival might depend on how ethnicity, culture and
migration affect intergroup trade relationships. As mentioned earlier, ethnically
diverse societies are likely to rely more on intergroup trading and domestic markets
than societies with more cultural or immigrant diversity. To formally test whether
diversity affects the extent to which businesses rely on international markets, we use
as the dependent variable the share of the production and services that early-stage and
established businesses claim to export. Since the GEM survey provides this
information as a continuous variable, we use a multilevel linear model instead of a
probit one. We keep the same controls as before, but we add the industrial sector (e.g.
services, consumer oriented, transformative or extractive), since it might influence
dependence on national and external markets.
As shown in Table 5, businesses embedded in more ethnically diverse settings
export less, suggesting these businesses enjoy intergroup trading domestically
(columns 1-6). In contrast, also as expected, businesses embedded in more culturally
diverse settings (columns 1-6), or with a higher share of immigrants (columns 1 and
3), have a higher share of exports.
We also find the higher the immigrant diversity is, the higher the country’s
average probability that early-stage businesses export more (column 1). However,
immigrant diversity has the opposite effect for established business, as their average
probability of exporting decreases (column 3). These findings suggest that diversity
of immigrants motivates new businesses to establish international trade networks.
Over time, as immigrants become more familiar with the host country, they rely more
on domestic networks, hence export less, but this is no guarantee for business
survival.
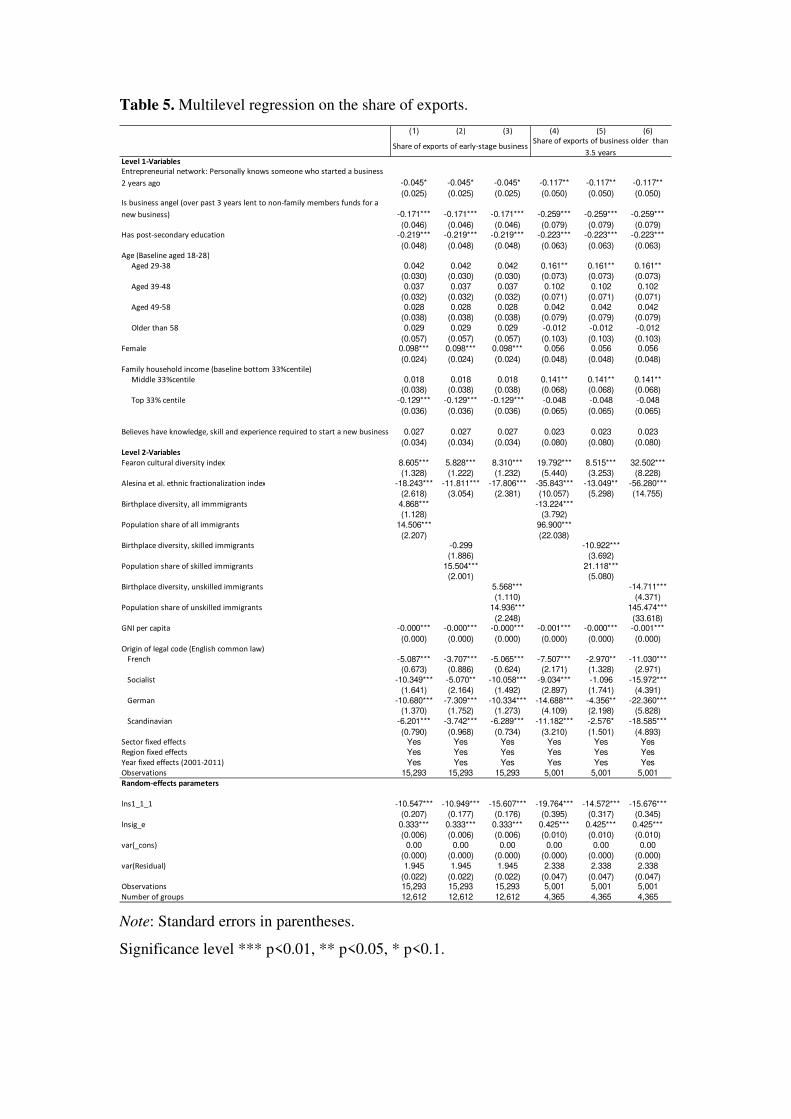
Table 5. Multilevel regression on the share of exports.
(1) (2) (3) (4) (5) (6)
Level 1-Variables
Entrepreneurial network: Personally knows someone who started a business
2 years ago -0.045* -0.045* -0.045* -0.117** -0.117** -0.117**
(0.025) (0.025) (0.025) (0.050) (0.050) (0.050)Is business angel (over past 3 years lent to non-family members funds for a
new business) -0.171*** -0.171*** -0.171*** -0.259*** -0.259*** -0.259***
(0.046) (0.046) (0.046) (0.079) (0.079) (0.079)Has post-secondary education -0.219*** -0.219*** -0.219*** -0.223*** -0.223*** -0.223***
(0.048) (0.048) (0.048) (0.063) (0.063) (0.063)Age (Baseline aged 18-28)
Aged 29-38 0.042 0.042 0.042 0.161** 0.161** 0.161**
(0.030) (0.030) (0.030) (0.073) (0.073) (0.073)
Aged 39-48 0.037 0.037 0.037 0.102 0.102 0.102
(0.032) (0.032) (0.032) (0.071) (0.071) (0.071)
Aged 49-58 0.028 0.028 0.028 0.042 0.042 0.042
(0.038) (0.038) (0.038) (0.079) (0.079) (0.079)
Older than 58 0.029 0.029 0.029 -0.012 -0.012 -0.012
(0.057) (0.057) (0.057) (0.103) (0.103) (0.103)Female 0.098*** 0.098*** 0.098*** 0.056 0.056 0.056
(0.024) (0.024) (0.024) (0.048) (0.048) (0.048)Family household income (baseline bottom 33%centile)
Middle 33%centile 0.018 0.018 0.018 0.141** 0.141** 0.141**
(0.038) (0.038) (0.038) (0.068) (0.068) (0.068)
Top 33% centile -0.129*** -0.129*** -0.129*** -0.048 -0.048 -0.048
(0.036) (0.036) (0.036) (0.065) (0.065) (0.065)
Believes have knowledge, skill and experience required to start a new business 0.027 0.027 0.027 0.023 0.023 0.023
(0.034) (0.034) (0.034) (0.080) (0.080) (0.080)Level 2-Variables
Fearon cultural diversity index 8.605*** 5.828*** 8.310*** 19.792*** 8.515*** 32.502***
(1.328) (1.222) (1.232) (5.440) (3.253) (8.228)
Alesina et al. ethnic fractionalization index -18.243*** -11.811*** -17.806*** -35.843*** -13.049** -56.280***
(2.618) (3.054) (2.381) (10.057) (5.298) (14.755)
Birthplace diversity, all immmigrants 4.868*** -13.224***
(1.128) (3.792)
Population share of all immigrants 14.506*** 96.900***
(2.207) (22.038)Birthplace diversity, skilled immigrants -0.299 -10.922***
(1.886) (3.692)
Population share of skilled immigrants 15.504*** 21.118***
(2.001) (5.080)
Birthplace diversity, unskilled immigrants 5.568*** -14.711***
(1.110) (4.371)
Population share of unskilled immigrants 14.936*** 145.474***
(2.248) (33.618)GNI per capita -0.000*** -0.000*** -0.000*** -0.001*** -0.000*** -0.001***
(0.000) (0.000) (0.000) (0.000) (0.000) (0.000)Origin of legal code (English common law)
French -5.087*** -3.707*** -5.065*** -7.507*** -2.970** -11.030***
(0.673) (0.886) (0.624) (2.171) (1.328) (2.971)
Socialist -10.349*** -5.070** -10.058*** -9.034*** -1.096 -15.972***
(1.641) (2.164) (1.492) (2.897) (1.741) (4.391)
German -10.680*** -7.309*** -10.334*** -14.688*** -4.356** -22.360***
(1.370) (1.752) (1.273) (4.109) (2.198) (5.828)
Scandinavian -6.201*** -3.742*** -6.289*** -11.182*** -2.576* -18.585***
(0.790) (0.968) (0.734) (3.210) (1.501) (4.893)Sector fixed effects Yes Yes Yes Yes Yes Yes
Region fixed effects Yes Yes Yes Yes Yes Yes
Year fixed effects (2001-2011) Yes Yes Yes Yes Yes Yes
Observations 15,293 15,293 15,293 5,001 5,001 5,001
Random-effects parameters
lns1_1_1 -10.547*** -10.949*** -15.607*** -19.764*** -14.572*** -15.676***
(0.207) (0.177) (0.176) (0.395) (0.317) (0.345)
lnsig_e 0.333*** 0.333*** 0.333*** 0.425*** 0.425*** 0.425***
(0.006) (0.006) (0.006) (0.010) (0.010) (0.010)
var(_cons) 0.00 0.00 0.00 0.00 0.00 0.00
(0.000) (0.000) (0.000) (0.000) (0.000) (0.000)
var(Residual) 1.945 1.945 1.945 2.338 2.338 2.338
(0.022) (0.022) (0.022) (0.047) (0.047) (0.047)Observations 15,293 15,293 15,293 5,001 5,001 5,001
Number of groups 12,612 12,612 12,612 4,365 4,365 4,365
Share of exports of early-stage businessShare of exports of business older than
3.5 years
Note: Standard errors in parentheses.
Significance level *** p<0.01, ** p<0.05, * p<0.1.

5.2. Job creation
To test hypothesis 3, whether diversity affects job creation, we use as dependent
variable the number of employees hired. We analyse the number of employees hired
by young businesses, and separately those hired by established businesses. Since our
dependent variable is continuous, we use a linear multilevel model (instead of a
probit one), as shown in Equation (4).
Number of employeesijk= α0+ α1Xijk + α2Yeark + γCj + uj + eijk (4)
Following GEM’s definition, the number of employees hired excludes the
owner(s) of the firm. So, for businesses with no extra employees, the dependent
variable takes the value of zero, meaning self-employed. We exclude from this
analysis respondents who do not have any existing business, as well as start-ups, as
these firms are in too early a stage. In our multilevel analysis we use the same
controls as before, including the industrial sector as this might influence the number
of employees needed.
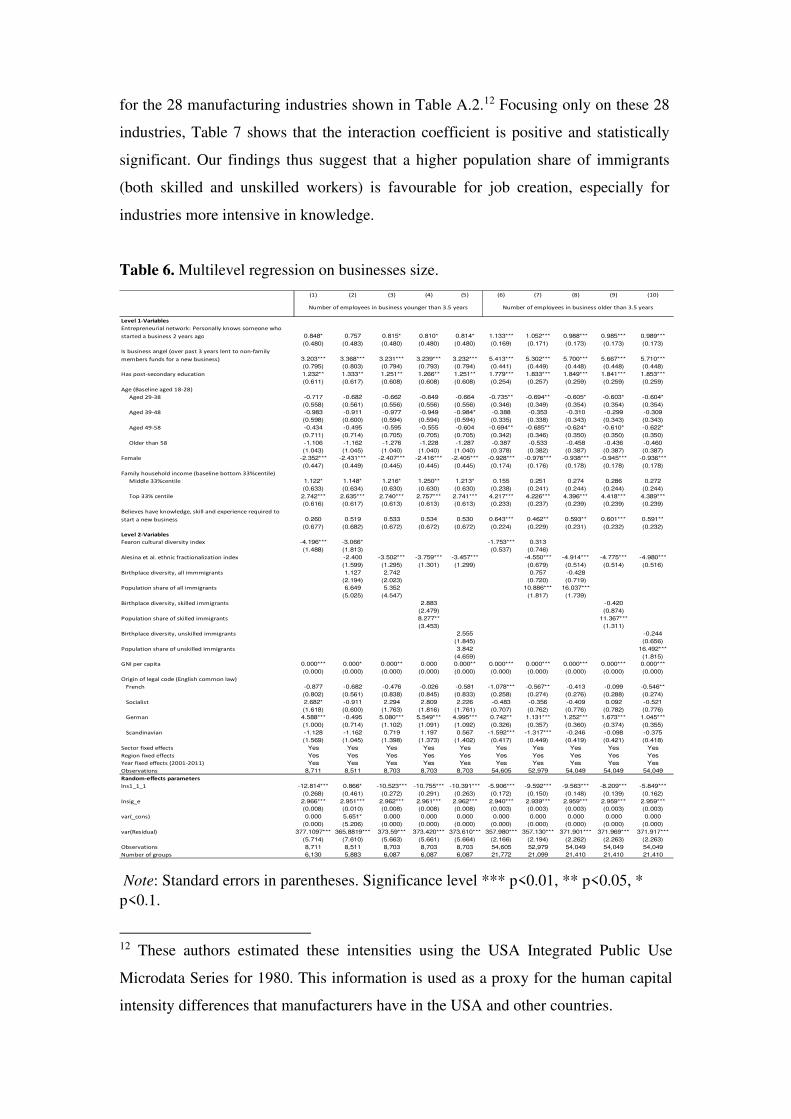
Table 6 shows the multilevel linear coefficients. Again, the individual and the
institutional variables considered provide results consistent with our expectations.
With regards to diversity, the indices of ethnic fractionalization and cultural diversity
are negatively associated with the number of employees hired by young and
established businesses. Both diversity indices are among the most influential factors
associated with the number of employees hired. But when both indices are added in
the regression simultaneously (columns 2 and 7) one coefficient absorbs the effect of
the other, likely given their strong correlation.
The regression coefficients of the diversity indices estimate what would be the
change in the country’s average number of employees hired by businesses, for a unit
increase in the corresponding diversity index. This change implies going from the
diversity index’s minimum value of zero to its highest value of one. Another way to
assess the extent of this impact is to consider a country that goes from the 25th
percentile of the ethnic fractionalization index to the 75th percentile across the 88
countries analysed. This change represents an increase of 0.46 units in the ethnic
fractionalization index. A difference of this extent is the one found in Japan and the
USA, for instance. By multiplying this number by the coefficient in Table 6, column
3, we find that this increase in the ethnic fractionalization index leads to a decrease of

slightly more than one employee hired by new businesses (0.46*-3.502=-1.74). The
effect of the ethnic fractionalization index is slightly larger for established businesses
(column 8), reducing the average number of employees by more than two employees
(0.46*-4.914=-2.44).
With regards to immigrant birthplace diversity (all, skilled and unskilled), we
find it positively associated with the number of employees hired, though this
association is statistically insignificant. Overall, however, considering the effects of
ethnic fractionalization, and cultural diversity, we find support for hypothesis 3.
We also find that a higher share of skilled immigrants increases job expansion
of both young and established businesses. To assess the extent of this effect, consider
a country that goes from the 25th percentile of the share of skilled immigrants (such
as Poland) to the 75th percentile (such as the UK). This increase of 0.107 units in the
share of skilled immigrants leads young businesses to hire almost one extra worker
(0.107*8.277= 0.89), and established businesses to hire 1.22 extra workers
(0.107*11.367).
The population share of unskilled immigrants has a statistically insignificant
association on young businesses, but a statistically significant and positive effect on
established businesses hiring more employees. To assess the extent of this effect,
consider a country that goes from the 25th percentile of the share of unskilled
immigrants (such as Egypt) to the 75th percentile (such as the USA). This increase of
0.09 units in the population share of unskilled immigrants leads established
businesses to have 1.5 extra workers (0.09*16.492).
5.2.1. Why does immigration boost job creation?
Our findings suggest that a higher population share of immigrants is favourable for
job creation, perhaps due to skill complementarities, as suggested by Roback (1982).
To more formally test this theory, we add into our regressions an interaction term.
This term interacts the population share of immigrants and a variable that measures
the business industry’s intensity on employees with at least sixteen years of
schooling. Ciccone and Papaioannou (2009) estimated this intensity in human capital
for the 28 manufacturing industries shown in Table A.2.12 Focusing only on these 28
industries, Table 7 shows that the interaction coefficient is positive and statistically
significant. Our findings thus suggest that a higher population share of immigrants
(both skilled and unskilled workers) is favourable for job creation, especially for
industries more intensive in knowledge.
Table 6. Multilevel regression on businesses size.
(1) (2) (3) (4) (5) (6) (7) (8) (9) (10)
Level 1-Variables
Entrepreneurial network: Personally knows someone who
started a business 2 years ago 0.848* 0.757 0.815* 0.810* 0.814* 1.133*** 1.052*** 0.988*** 0.985*** 0.989***
(0.480) (0.483) (0.480) (0.480) (0.480) (0.169) (0.171) (0.173) (0.173) (0.173)
Is business angel (over past 3 years lent to non-family
members funds for a new business) 3.203*** 3.368*** 3.231*** 3.239*** 3.232*** 5.413*** 5.302*** 5.700*** 5.667*** 5.710***
(0.795) (0.803) (0.794) (0.793) (0.794) (0.441) (0.449) (0.448) (0.448) (0.448)
Has post-secondary education 1.232** 1.333** 1.251** 1.266** 1.251** 1.779*** 1.833*** 1.849*** 1.841*** 1.853***
(0.611) (0.617) (0.608) (0.608) (0.608) (0.254) (0.257) (0.259) (0.259) (0.259)
Age (Baseline aged 18-28)
Aged 29-38 -0.717 -0.682 -0.662 -0.649 -0.664 -0.735** -0.694** -0.605* -0.603* -0.604*
(0.558) (0.561) (0.556) (0.556) (0.556) (0.346) (0.349) (0.354) (0.354) (0.354)
Aged 39-48 -0.983 -0.911 -0.977 -0.949 -0.984* -0.388 -0.353 -0.310 -0.299 -0.309
(0.598) (0.600) (0.594) (0.594) (0.594) (0.335) (0.338) (0.343) (0.343) (0.343)
Aged 49-58 -0.434 -0.495 -0.595 -0.555 -0.604 -0.694** -0.685** -0.624* -0.610* -0.622*
(0.711) (0.714) (0.705) (0.705) (0.705) (0.342) (0.346) (0.350) (0.350) (0.350)
Older than 58 -1.106 -1.162 -1.276 -1.228 -1.287 -0.387 -0.533 -0.458 -0.436 -0.460
(1.043) (1.045) (1.040) (1.040) (1.040) (0.378) (0.382) (0.387) (0.387) (0.387)
Female -2.352*** -2.431*** -2.407*** -2.416*** -2.405*** -0.928*** -0.976*** -0.938*** -0.945*** -0.936***
(0.447) (0.449) (0.445) (0.445) (0.445) (0.174) (0.176) (0.178) (0.178) (0.178)
Family household income (baseline bottom 33%centile)
Middle 33%centile 1.122* 1.148* 1.216* 1.250** 1.213* 0.155 0.251 0.274 0.286 0.272
(0.633) (0.634) (0.630) (0.630) (0.630) (0.238) (0.241) (0.244) (0.244) (0.244)
Top 33% centile 2.742*** 2.635*** 2.740*** 2.757*** 2.741*** 4.217*** 4.226*** 4.396*** 4.418*** 4.389***
(0.616) (0.617) (0.613) (0.613) (0.613) (0.233) (0.237) (0.239) (0.239) (0.239)
Believes have knowledge, skill and experience required to
start a new business 0.260 0.519 0.533 0.534 0.530 0.643*** 0.462** 0.593** 0.601*** 0.591**
(0.677) (0.682) (0.672) (0.672) (0.672) (0.224) (0.229) (0.231) (0.232) (0.232)
Level 2-Variables
Fearon cultural diversity index -4.196*** -3.066* -1.753*** 0.313
(1.488) (1.813) (0.537) (0.746)
Alesina et al. ethnic fractionalization index -2.400 -3.502*** -3.759*** -3.457*** -4.550*** -4.914*** -4.775*** -4.980***
(1.599) (1.295) (1.301) (1.299) (0.679) (0.514) (0.514) (0.516)
Birthplace diversity, all immmigrants 1.127 2.742 0.757 -0.428
(2.194) (2.023) (0.720) (0.719)
Population share of all immigrants 6.649 5.352 10.886*** 16.037***
(5.025) (4.547) (1.817) (1.739)
Birthplace diversity, skilled immigrants 2.883 -0.420
(2.479) (0.874)
Population share of skilled immigrants 8.277** 11.367***
(3.453) (1.311)
Birthplace diversity, unskilled immigrants 2.555 -0.244
(1.845) (0.656)
Population share of unskilled immigrants 3.842 16.492***
(4.659) (1.815)
GNI per capita 0.000*** 0.000* 0.000** 0.000 0.000** 0.000*** 0.000*** 0.000*** 0.000*** 0.000***
(0.000) (0.000) (0.000) (0.000) (0.000) (0.000) (0.000) (0.000) (0.000) (0.000)
Origin of legal code (English common law)
French -0.877 -0.682 -0.476 -0.026 -0.581 -1.078*** -0.567** -0.413 -0.099 -0.546**
(0.802) (0.561) (0.838) (0.845) (0.833) (0.258) (0.274) (0.276) (0.288) (0.274)
Socialist 2.682* -0.911 2.294 2.809 2.226 -0.483 -0.356 -0.409 0.092 -0.521
(1.618) (0.600) (1.763) (1.816) (1.761) (0.707) (0.762) (0.776) (0.782) (0.776)
German 4.588*** -0.495 5.080*** 5.549*** 4.995*** 0.742** 1.131*** 1.252*** 1.673*** 1.045***
(1.000) (0.714) (1.102) (1.091) (1.092) (0.326) (0.357) (0.360) (0.374) (0.355)
Scandinavian -1.128 -1.162 0.719 1.197 0.567 -1.592*** -1.317*** -0.246 -0.098 -0.375
(1.569) (1.045) (1.398) (1.373) (1.402) (0.417) (0.449) (0.419) (0.421) (0.418)
Sector fixed effects Yes Yes Yes Yes Yes Yes Yes Yes Yes Yes
Region fixed effects Yes Yes Yes Yes Yes Yes Yes Yes Yes Yes
Year fixed effects (2001-2011) Yes Yes Yes Yes Yes Yes Yes Yes Yes Yes
Observations 8,711 8,511 8,703 8,703 8,703 54,605 52,979 54,049 54,049 54,049
Random-effects parameters
lns1_1_1 -12.814*** 0.866* -10.523*** -10.755*** -10.391*** -5.906*** -9.592*** -9.563*** -8.209*** -5.849***
(0.268) (0.461) (0.272) (0.291) (0.263) (0.172) (0.150) (0.148) (0.139) (0.162)
lnsig_e 2.966*** 2.951*** 2.962*** 2.961*** 2.962*** 2.940*** 2.939*** 2.959*** 2.959*** 2.959***
(0.008) (0.010) (0.008) (0.008) (0.008) (0.003) (0.003) (0.003) (0.003) (0.003)
var(_cons) 0.000 5.651* 0.000 0.000 0.000 0.000 0.000 0.000 0.000 0.000
(0.000) (5.206) (0.000) (0.000) (0.000) (0.000) (0.000) (0.000) (0.000) (0.000)
var(Residual) 377.1097*** 365.8819*** 373.59*** 373.420*** 373.610*** 357.980*** 357.130*** 371.901*** 371.969*** 371.917***
(5.714) (7.610) (5.663) (5.661) (5.664) (2.166) (2.194) (2.262) (2.263) (2.263)
Observations 8,711 8,511 8,703 8,703 8,703 54,605 52,979 54,049 54,049 54,049
Number of groups 6,130 5,883 6,087 6,087 6,087 21,772 21,099 21,410 21,410 21,410
Number of employees in business younger than 3.5 years Number of employees in business older than 3.5 years
Note: Standard errors in parentheses. Significance level *** p<0.01, ** p<0.05, * p<0.1.
12 These authors estimated these intensities using the USA Integrated Public Use
Microdata Series for 1980. This information is used as a proxy for the human capital
intensity differences that manufacturers have in the USA and other countries.

Table 7. Multilevel regression on manufacturing size and human capital intensity.
(1) (2) (3) (4)
Level 1-Variables
Entrepreneurial network: Personally knows someone who started a business 2
years ago 0.217 0.180 1.681*** 1.672***
(1.680) (1.682) (0.637) (0.637)
Is business angel (over past 3 years lent to non-family members funds for a new
business) 2.319 2.190 9.330*** 9.286***
(2.749) (2.753) (1.733) (1.733)
Has post-secondary education -1.282 -1.148 4.546*** 4.559***
(2.330) (2.331) (1.067) (1.066)
Age (Baseline aged 18-28)
Aged 29-38 0.586 0.411 -1.580 -1.601
(2.037) (2.039) (1.310) (1.309)
Aged 39-48 2.273 2.188 -1.009 -1.018
(2.106) (2.110) (1.259) (1.259)
Aged 49-58 5.145** 4.852* -0.858 -0.888
(2.505) (2.502) (1.289) (1.288)
Older than 58 0.755 0.746 0.282 0.256
(3.696) (3.702) (1.443) (1.443)
Female -2.602 -2.700* -1.951*** -1.947***
(1.614) (1.615) (0.660) (0.660)
Family household income (baseline bottom 33%centile)
Middle 33%centile 3.210 3.213 1.044 1.061
(2.225) (2.228) (0.914) (0.913)
Top 33% centile 2.984 3.007 6.714*** 6.697***
(2.207) (2.210) (0.895) (0.895)
Believes have knowledge, skill and experience required to start a new business -8.728*** -8.583*** 1.310 1.249
(2.577) (2.578) (0.860) (0.860)
Level 2-Variables
Alesina et al. ethnic fractionalization index -5.549 -4.924 -5.738*** -6.152***
(4.728) (4.834) (1.897) (1.906)
Birthplace diversity, skilled immigrants 1.332 3.358
(8.242) (3.121)
Industry human capital intensity X Share of skilled immigrants 210.826** 61.005*
(95.374) (36.951)
Birthplace diversity, unskilled immigrants 1.889 2.742
(6.191) (2.344)
Industry human capital intensity X Share of unskilled immigrants 205.251 123.237***
(129.404) (47.686)
GNI per capita -0.000 0.000 0.000 -0.000
(0.000) (0.000) (0.000) (0.000)
Origin of legal code (English common law)
French 1.889 0.900 -0.099 -0.163
(3.244) (3.230) (1.111) (1.083)
Socialist 13.097** 11.718** 0.879 0.536
(5.589) (5.417) (2.580) (2.555)
German 15.167*** 14.302*** 4.391*** 4.309***
(4.158) (4.250) (1.486) (1.449)
Scandinavian 6.393 5.780 1.105 0.992
(4.952) (5.054) (1.656) (1.675)
Sector fixed effects Yes Yes Yes Yes
Region fixed effects Yes Yes Yes Yes
Year fixed effects (2001-2011) Yes Yes Yes Yes
Observations 957 957 5,903 5,903
Random-effects parameters
lns1_1_1 1.737*** 1.738*** 0.372 0.323
(0.294) (0.293) (1.167) (1.274)
lnsig_e 3.068*** 3.069*** 3.154*** 3.153***
(0.030) (0.030) (0.010) (0.010)
var(_cons) 0.000 0.000 5.011 4.684
(0.000) (0.000) (5.593) (5.576)
var(Residual) 494.953*** 496.178*** 545.589*** 545.563***
(22.627) (22.683) (11.433) (11.429)
Observations 957 957 5,903 5,903
Number of groups 665 665 2,515 2,515
Number of employees in business
younger than 3.5 years
Number of employees in business
older than 3.5 years
Notes: The share of immigrants is interacted with the industry’s intensity on
employees with at least sixteen years of schooling (college) for 28 large
manufacturing industries. Standard errors in parentheses.
Significance level *** p<0.01, ** p<0.05, * p<0.1.

5.2.2. Why does ethnic and cultural diversity dampen job creation?
Supporting hypothesis 3, we have found that ethnic fractionalization and cultural
diversity are associated with a smaller number of employees hired by businesses. One
potential reason for this finding is that ethnic and cultural diversity might make
investment coordination more difficult, thus hindering job expansion, as suggested by
Easterly and Levine (1997). We test this potential mechanism next.
Since the GEM survey does not provide information on overall investments,
we test whether diversity dampens investments, using instead as dependent variable
the gross capital formation (formerly known as gross domestic investments) in USA
dollars aggregated at the country level from 2001 until 2016, as shown in Equation
(5). We obtained this information from the World Bank.
To test whether diversity dampens investments, we aggregate all the
investment information at the country level, thus we no longer use multilevel
analysis. Instead, we use panel random effects, clustering the standard errors at the
country level, as shown in Equation (5).
Investmentjk= γ0+ γ1Cj + γ2Yeark + uj + ejk (5)
As before, Cj represents the controls aggregated at country level, which
includes country’s GNI per capita for the year 2000 and the origin of the legal
tradition, as both variables are known to affect investments (La Porta, Lopez-de-
Silanes and Shleifer, 2008). We also include the indices of diversity, region and year-
fixed effects to consider time-invariant regional differences and swings the countries
might have experienced.
Table 8 shows that ethnic fractionalization and cultural diversity are
associated with lower level of investments, as expected. It is known that reductions in
domestic investments often lead to rises in unemployment (Smith and Zoega, 2009),
which might explain why we also found that ethnic and cultural diversity dampens
job creation. In contrast, also as expected, immigrant birthplace diversity (skilled and
unskilled) is associated with the country receiving more investments.

Table 8. Diversity and investment, panel random effects. (1) (2) (3) (4) (5) (6)
Fearon cultural diversity index -0.313* 0.031
(0.169) (0.184)
Alesina et al. ethnic fractionalization index -0.312** -0.440** -0.371*** -0.360** -0.371***
(0.140) (0.192) (0.143) (0.140) (0.144)
Birthplace diversity, all immigrants 0.287 0.311*
(0.195) (0.179)
Birthplace diversity, skilled immigrants 0.403**
(0.199)
Birthplace Diversity, unskilled immigrants 0.240
(0.174)
GNI per capita 0.000 -0.000 -0.000 -0.000 -0.000 -0.000
(0.000) (0.000) (0.000) (0.000) (0.000) (0.000)
Origin of legal code (English common law)
French 0.033 0.078 0.011 0.033 0.030 0.042
(0.065) (0.059) (0.061) (0.062) (0.060) (0.062)
Socialist 0.111 0.119 0.016 0.041 0.060 0.041
(0.110) (0.115) (0.105) (0.102) (0.102) (0.104)
German 0.485** 0.502** 0.479** 0.502** 0.507** 0.512**
(0.238) (0.235) (0.228) (0.230) (0.227) (0.233)
Scandinavian -0.056 -0.065 -0.118 -0.110 -0.094 -0.105
(0.105) (0.099) (0.092) (0.094) (0.092) (0.096)
Constant 0.055 0.106 -0.017 -0.073 -0.167 -0.015
(0.087) (0.104) (0.185) (0.160) (0.178) (0.162)
Region fixed effects Yes Yes Yes Yes Yes Yes
Year fixed effects (2001-2011) Yes Yes Yes Yes Yes Yes
Overall R2-squared 0.56 0.55 0.52 0.51 0.52 0.51
Number of countries 73 78 72 75 75 75
Total number of observations (country x year) 777 832 766 799 799 799
Investment in USA billion dollars
Note: Robust standard errors in parentheses, clustered by country.
Significance level *** p<0.01, ** p<0.05, * p<0.1.
6. Robustness analysis
We assess in this section whether our results are robust to different specifications,
controls and alternative measures of diversity. We use five main checks, all
confirming the validity of the results presented.
6.1. Alternative controls
First, we re-run all our regressions including additional controls including inequality
measures such as the Gini index, data on private credit, population size, and
institutional variables such as red tape needed to open businesses. None of these
changed our results, thus are omitted, but are available upon request.13
13 The multilevel literature recommends not to add too many level-2 variables
(country-variables in our case), as otherwise the models become computationally
challenging or impossible to estimate. Multilevel regressions require at least 25-30
level-2 units (countries) to yield reliable confidence intervals and to add at least ten
level-2 units for each control variable included at that level (Mehmetoglu and
6.2. Alternative diversity indices
As a second check, we added the squared value of our diversity indices to test for
diminishing returns. None of these squared terms were statistically significant, hence
suggesting the detrimental effect of diversity on business surival is not simply due to
diminishing returns. Instead, our findings suggest that the benefits that diversity
offers for new businesses are outweighed by its associated costs over time for
established businesses.
As a third check, we used alternative measures of diversity such as the
linguistic fractionalization index estimated by Alesina et al. (2003), which identifies
groups based on linguistic distinctions. We also used the ethnic fractionalization
index by Fearon (2003). Both alternative indices give the same results on the sign and
statistical significance to those presented earlier on, hence are omitted.
6.3 Different specifications
As a fourth check, we re-run all our specifications but using the linear OLS model
instead of multilevel modelling. Again, we found the same associations between
diversity and entrepreneurship and job creation. We omit presenting these results but
are available upon request.
A potential criticism of the results presented is that we have used large cross-
country surveys, which could boost statistical significance. Thus, as a fifth robustness
check, we aggregated the data by country. Again, we found the same associations
between diversity and entrepreneurship. For instance, Figure A.1 in the online
Appendix shows the positive correlation between the indices on ethnic, cultural and
immigration diversity, and the average early-stage entrepreneurship rate of each
country between 2001 and 2011. Similarly, Figure A.2 shows the negative association
between our diversity indices and the country’s average number of employees hired
by established businesses.
Jakobsen, 2016). Since we have 88 countries, we could reasonably include up to six
country-level variables.

7. Conclusion and discussion
Unlike previous diversity studies on entrepreneurship, this article simultaneously
analysed the effects that diversity in ethnic, cultural and immigrant birthplace have on
business creation, survival and job expansion. Building on existing, yet disjointed
theories on diversity, the paper provides insights as to why different types of diversity
may have different effects on entrepreneurship. We tested our hypotheses using the
Global Entrepreneurship Monitor adult population survey across 88 countries.
The paper offered four key findings. First, diversity (whether ethnic, cultural
or birthplace immigration) increases the number of start-ups and new businesses.
However, businesses are more likely to survive in more ethnically diverse countries
only, while the opposite is the case for countries with higher cultural or immigration
diversity. We also showed that how diversity affects demand specialisation is likely to
play a role in our contrasting results. For instance, ethnically diverse countries tend to
specialise in their domestic market, while businesses embedded in more culturally and
immigrant diverse settings have a higher share of exports, which perhaps makes them
more vulnerable to both competition and fluctuations.
Recent studies have found that immigration is beneficial for long-run growth.
For instance, areas that received more immigrants during the Age of Mass Migration
(1850–1920) in the USA are significantly more prosperous today, with higher rates of
industrialisation, agricultural productivity, innovation and local growth (Rodríguez-
Pose and von Berlepsch, 2017; Sequeira, Nunn and Qian, 2017). Our findings on the
impact of immigration diversity on business survival do not necessarily contradict
these recent studies. Our findings instead highlight that the pressures and constraints
of receiving a large inflow of immigrants might be overcome overtime, once
immigrants or their offspring integrate and find an adequate market niche to survive.
This potential long-term outcome might explain why we found that ethnic diversity is
beneficial for business survival (in contrast to cultural or immigration diversity).
Moreover, our second key finding revealed that a higher share of immigrants,
whether skilled or unskilled, is actually beneficial for businesses creating more jobs.
For instance, consider a country that goes from the 25th percentile of the share of
skilled immigrants (such as Poland) to the 75th percentile (such as the UK). This
increase in the share of skilled immigrants (of 0.107 units) drives young businesses to
hire one extra worker, and older businesses to hire 1.22 extra workers. This effect is
large, particularly considering that the businesses analysed have an average of five

workers. This finding supports other studies which suggest immigration boosts
productivity and growth (Alesina, Harnoss and Rapport, 2016).
Third, we showed that ethnic and cultural diversity hinders job creation as well
as investments in the country. Lastly, the article revealed the importance of
examining the different dimensions of diversity. Our findings help explain why
ethnic, cultural and immigration diversity might have contrasting effects, thereby
providing a more complete and nuanced understanding of diversity, with important
implications for policy making. Our results, therefore, advance the discussion of
entrepreneurship and diversity, showing how small changes in diversity can lead to
significant changes in business survival and job creation. These results have important
policy implications for countries seeking to toughen their immigration policies.
Immigration policies need to consider their consequences on employment,
productivity, and on entrepreneurship, all key drivers of economic growth. Since
societies will continue to become more diverse, considering the multiple dimensions
of diversity will become ever more relevant for research and policymaking.
Disclosure statement
There are no potential conflict of interests to report.
References
Acs, Z. J., Audretsch, D. B., and Lehman, E. (2013) The Knowledge Spillover Theory
of Entrepreneurship. Small Business Economics, 41: 757–774.
Aldrich, H. E., Cater, J. C., Jones, T. P., and McEvoy, D. (1983) From Periphery to
Peripheral: The South Asian Petite Bourgeoisie in England. In I. H. Simpson
& R. Simpson (eds.), Research in the Sociology of Work. Greenwich: JAI
Press.
Aldrich, H., and Waldinger, R. (1990) Ethnicity and Entrepreneurship. Annual Review
of Sociology, 16: 111–135.
Alesina, A., and La Ferrara, E. (2005) Ethnic Diversity and Economic Performance.
Journal of Economic Literature, 43: 762–800.
Alesina, A., Devleeschauwer, A., Easterly, W., Kurlat, S. and Wacziarg, R. (2003)
Fractionalization. Journal of Economic Growth, 8: 155–194.
Alesina, A., Harnoss, J. and Rapport, H. (2016) Birthplace Diversity and Economic
Prosperity. Journal of Economic Growth, 21: 101–138.

Artuc, E., Docquier, F., Özden, Ç. and Parsons, C. (2015) A Global Assessment of
Human Capital Mobility: The Role of Non-OECD Destinations. World
Development, 65: 6–26.
Azzimonti, M. (2011) Barriers to Investment in Polarized Societies. American
Economic Review, 101: 2182–2204.
Basu, A., and Altinay, E. (2002) The Interaction Between Culture and
Entrepreneurship in London’s Immigrant Businesses. International Small
Business Journal, 20: 371–393.
Bruder, J., Neuberger, D. and Räthke-Döppner, S. (2011) Financial Constraints of
Ethnic Entrepreneurship: Evidence from Germany. International Journal of
Entrepreneurial Behavior & Research, 17: 296–313.
Burn-Callander, R. (2016) Immigrants Far More Likely to be Entrepreneurial than
British Born. Telegraph Business, 12 May.
Burt, R. S. (2005) Brokerage and Closure: An Introduction to Social Capital. Oxford:
Oxford University Press.
Caprar, D., Devinney, T., Kirkman, B. and Caligiuri, P. (2015) Conceptualizing and
Measuring Culture in International Business and Management: From
Challenges to Potential Solutions. Journal of International Business Studies,
46: 1011–1027.
Cavalluzzo, K., and Wolken, J. (2005) Small Business Loan Turndowns, Personal
Wealth and Discrimination. Journal of Business, 78: 2153–2178.
Cheng, S., and Li, H. (2012) New Firm Formation Facing Cultural and Racial
Diversity. Papers in Regional Science, 91: 759–774.
Ciccone, A. and Papaioannou, E. (2009) Human Capital, the Structure of Production,
and Growth. Review of Economics and Statistics, 91: 66–82.
Cuervo, A. (2005) Individual and Environmental Determinants of Entrepreneurship.
International Entrepreneurship and Management Journal, 1: 293–311.
Danes, S., Lee, J., Stafford, K. and Heck, R. K. Z. (2008) The Effects of Ethnicity,
Families and Culture on Entrepreneurial Experience: An Extension of
Sustainable Family Business Theory. Journal of Development
Entrepreneurship, 13: 229–268.
Desiderio, M. V. and Salt, J. (2010) Main Findings of the Conference on
Entrepreneurship and Employment Creation of Immigrants in OECD
Countries. Paris: OECD.

Desmet, K., Ortuño-Ortín, I. and Wacziarg, R. (2017) Culture, Ethnicity and
Diversity. American Economic Review, 107: 2479–2513.
Dollinger, M. J. (2003) Entrepreneurship: Strategies and Resources, 3rd ed. Upper
Saddle River, NJ: Prentice Hall.
Easterly, W., and Levine, R. (1997) Africa’s Growth Tragedy: Policies and Ethnic
Divisions. The Quarterly Journal of Economics, 112: 1203–1250.
Fearon, J. (2003) Ethnic and Cultural Diversity by Country. Journal of Economic
Growth, 8: 195–222.
Fritsch, M. and Wyrwich, M. (2017) The Effect of Entrepreneurship on Economic
Development – An Empirical Analysis Using Regional Entrepreneurship
Culture. Journal of Economic Geography, 17: 157–189.
Gibbons, R., and Henderson, R. (2013). What Do Managers Do? Exploring Persistent
Performance Differences Among Seemingly Similar Enterprises. Harvard
Business School. Working Paper No. 13–20.
Gören, E. (2014) How Ethnic Diversity Affects Economic Growth. World
Development, 59: 275–297.
Hlepas, N. (2013) Cultural Diversity and National Performance. Search Working
Paper 5/06.
Hofstede, G. (1984) Culture’s Consequences: International Differences in Work-
Related Values. Newbury Park, CA: Sage.
Karlsson, C., Rickardsson, J. and Wincent, J. (2020) Diversity, innovation, and
Entrepreneurship: Where are we and Where should We Go in Future Studies?
Small Business Economics, in print.
Kahane, L., Longley, N. and Simmons, R. (2013) The Effects of Coworker
Heterogeneity on Firm-Level Output: Assessing the Impacts of Cultural and
Language Diversity in the National Hockey League. The Review of Economics
and Statistics, 95: 302–314.
Kemeny, T. (2017) Immigrant Diversity and Economic Performance in Cities.
International Regional Science Review, 40: 164–208.
Kerr, S. P., and Kerr, W. (2020) Immigrant Entrepreneurship in America: Evidence
from the Survey of Business Owners 2007 & 2012. Research Policy, 49: in
print.
La Porta, R., Lopez-de-Silanes, F. and Shleifer, A. (2008) The Economic
Consequences of Legal Origins. Journal of Economic Literature, 46: 285–332.
Lee, D.Y., and Tsang, E. W. (2001) The Effects of Entrepreneurial Personality,
Background and Network Activities on Venture Growth. Journal of
Management Studies, 38: 583–602.
Lee, N. (2015) Migrants and Ethnic Diversity, Cities and Innovation: Firm Effects or
City Effects? Journal of Economic Geography, 4: 769–796.
Masurel, E., Nijkamp, P. and Vindigni, G. (2004) Breeding Places for Ethnic
Entrepreneurs: A Comparative Marketing Approach. Entrepreneurship &
Regional Development, 16: 77–86.
Mehmetoglu, M., and Jakobsen, G. (2016) Applied statistics Using Stata: A Guide for
the Social Sciences. United Kingdom: Sage Publications.
Milliken, F., and Martins, J. L. (1996) Searching for Common Threads:
Understanding the Multiple Effects of Diversity in Organizational Groups.
Academy of Management Review, 21: 402–433.
Montalvo, G. J., and Reynal-Querol, M. (2005) Ethnic Diversity and Economic
Development. Journal of Development Economics, 76: 293–323.
Moyo, I. (2014) A Case Study of Lack African Immigrant Entrepreneurship in Inner
City Johannesburg Using the Mixed Embeddedness Approach. Journal of
Immigrant & Refugee Studies, 12: 250–273.
Nathan, M., and Lee, N. (2013) Cultural Diversity, Innovation, and Entrepreneurship:
Firm-Level Evidence from London. Economic Geography, 89: 367–394.
nDoen, M. L., Gorter, C., Nijkamp, P. and Rietveld, P. (2000) Ethnic
Entrepreneurship and Migration: A Survey from Developing Countries.
Tinbergen Institute, Working Paper.
Nettle, D., Grace, J. B. Choisy, M. Cornell., H. V. Guégan, J. F. and Hochberg, M. E.
(2007) Cultural Diversity, Economic Development and Societal Instability.
PLoS One, 2: e929.
Niebuhr, A. (2010) Migration and Innovation: Does Cultural Diversity Matter for
Regional R&D Activity?" Papers in Regional Science, 89: 563–585.
Nikolova, E., and Simroth, D. (2013) Does Cultural Diversity Help or Hinder
Entrepreneurship? Evidence from Eastern Europe and Central Asia. European
Bank for Reconstruction and Development (EBRD) Working Paper 158.
Ottaviano, G., and Peri, G. (2006) The Economic Value of Cultural Diversity:
Evidence from US Cities. Journal of Economic Geography, 6: 9–44.
Portes, A., Haller, W. G. and Guarnizo, L. E. (2002) Transnational Entrepreneurs: An
Alternative Form of Immigrant Economic Adaptation. American Sociological
Review, 67: 278–298
Ram, M., Sanghera, B. Abbas, T. Barlow, G. and Jones, T. (2010) Ethnic Minority
Business in Comparative Perspective: The Case of the Independent Restaurant
Sector. Journal of Ethnic and Migration Studies, 26: 495–510.
Reynolds, P., Bosma, N. Autio, E. Hunt, S., De Bono, N. Servais, I. and Lopez-
Garcia, P. (2005) Global Entrepreneurship Monitor: Data Collection Design
and Implementation 1998–2003. Small Business Economics, 24: 205–231.
Roback, J. (1982) Wages, Rents, and the Quality of Life. The Journal of Political
Economy, 90: 1257–1278.
Rodríguez-Pose, A., and Hardy, D. (2015) Cultural Diversity and Entrepreneurship in
England and Wales. Environment and Planning A, 47: 392–411.
Rodríguez-Pose, A., and von Berlepsch, V. (2017) Does Population Diversity Matter
for Economic Development in the Very Long-Term? Historic Migration,
Diversity and County Wealth in the US. CEPR Discussion Paper 12347.
Runyan, R. C., Huddleston, P. and Swinney, J. (2006) Entrepreneurial Orientation and
Social Capital as Small Firm Strategies: A Study of Gender Differences from a
Resource-Based View. International Entrepreneurship and Management
Journal, 2: 455–477.
Saxena, A. (2014) Workforce Diversity: A Key to Improve Productivity. Procedia
Economics and Finance, 11: 76–85.
Smith, R., and Zoega, G. (2009) Keynes, Investment, Unemployment and
Expectations. International Review of Applied Economics, 23: 427–444.
Sobel, R., Dutta, N. and Roy, S. (2010) Does Cultural Diversity Increase the Rate of
Entrepreneurship? Review of Austrian Economics, 15: 269–286.
Sowell, T. (1981) Ethnic America: A History. New York: Basic Books.
Spolaore, E., and Wacziarg, R. (2013) How Deep Are the Roots of Economic
Development? Journal of Economic Literature, 51: 325–369.
Vandor, P., and Franke, N. (2006) See Paris and… Found a Business? The Impact of
Cross-Cultural Experience on Opportunity Recognition Capabilities. Journal
of Business Venturing, 31: 388–407.
Volery, T. (2007) Ethnic Entrepreneurship: A Theoretical Framework. In: L. P. Dana
(ed.) Handbook of Research on Ethnic Minority Entrepreneurship: A Co-
evolutionary View on Resource Management. Cheltenham: Edward Elgar.
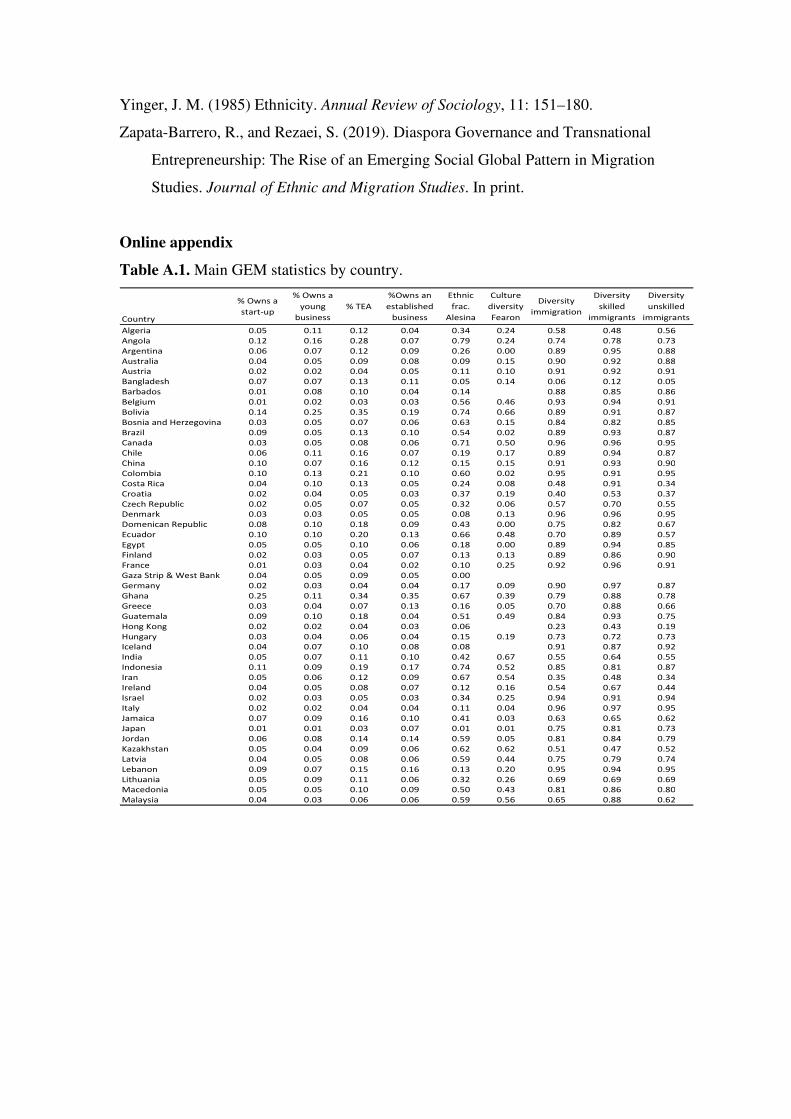
Yinger, J. M. (1985) Ethnicity. Annual Review of Sociology, 11: 151–180.
Zapata-Barrero, R., and Rezaei, S. (2019). Diaspora Governance and Transnational
Entrepreneurship: The Rise of an Emerging Social Global Pattern in Migration
Studies. Journal of Ethnic and Migration Studies. In print.
Online appendix
Table A.1. Main GEM statistics by country.
Country
% Owns a
start-up
% Owns a
young
business
% TEA
%Owns an
established
business
Ethnic
frac.
Alesina
Culture
diversity
Fearon
Diversity
immigration
Diversity
skilled
immigrants
Diversity
unskilled
immigrants
Algeria 0.05 0.11 0.12 0.04 0.34 0.24 0.58 0.48 0.56
Angola 0.12 0.16 0.28 0.07 0.79 0.24 0.74 0.78 0.73
Argentina 0.06 0.07 0.12 0.09 0.26 0.00 0.89 0.95 0.88
Australia 0.04 0.05 0.09 0.08 0.09 0.15 0.90 0.92 0.88
Austria 0.02 0.02 0.04 0.05 0.11 0.10 0.91 0.92 0.91
Bangladesh 0.07 0.07 0.13 0.11 0.05 0.14 0.06 0.12 0.05
Barbados 0.01 0.08 0.10 0.04 0.14 0.88 0.85 0.86
Belgium 0.01 0.02 0.03 0.03 0.56 0.46 0.93 0.94 0.91
Bolivia 0.14 0.25 0.35 0.19 0.74 0.66 0.89 0.91 0.87
Bosnia and Herzegovina 0.03 0.05 0.07 0.06 0.63 0.15 0.84 0.82 0.85
Brazil 0.09 0.05 0.13 0.10 0.54 0.02 0.89 0.93 0.87
Canada 0.03 0.05 0.08 0.06 0.71 0.50 0.96 0.96 0.95
Chile 0.06 0.11 0.16 0.07 0.19 0.17 0.89 0.94 0.87
China 0.10 0.07 0.16 0.12 0.15 0.15 0.91 0.93 0.90
Colombia 0.10 0.13 0.21 0.10 0.60 0.02 0.95 0.91 0.95
Costa Rica 0.04 0.10 0.13 0.05 0.24 0.08 0.48 0.91 0.34
Croatia 0.02 0.04 0.05 0.03 0.37 0.19 0.40 0.53 0.37
Czech Republic 0.02 0.05 0.07 0.05 0.32 0.06 0.57 0.70 0.55
Denmark 0.03 0.03 0.05 0.05 0.08 0.13 0.96 0.96 0.95
Domenican Republic 0.08 0.10 0.18 0.09 0.43 0.00 0.75 0.82 0.67
Ecuador 0.10 0.10 0.20 0.13 0.66 0.48 0.70 0.89 0.57
Egypt 0.05 0.05 0.10 0.06 0.18 0.00 0.89 0.94 0.85
Finland 0.02 0.03 0.05 0.07 0.13 0.13 0.89 0.86 0.90
France 0.01 0.03 0.04 0.02 0.10 0.25 0.92 0.96 0.91
Gaza Strip & West Bank 0.04 0.05 0.09 0.05 0.00
Germany 0.02 0.03 0.04 0.04 0.17 0.09 0.90 0.97 0.87
Ghana 0.25 0.11 0.34 0.35 0.67 0.39 0.79 0.88 0.78
Greece 0.03 0.04 0.07 0.13 0.16 0.05 0.70 0.88 0.66
Guatemala 0.09 0.10 0.18 0.04 0.51 0.49 0.84 0.93 0.75
Hong Kong 0.02 0.02 0.04 0.03 0.06 0.23 0.43 0.19
Hungary 0.03 0.04 0.06 0.04 0.15 0.19 0.73 0.72 0.73
Iceland 0.04 0.07 0.10 0.08 0.08 0.91 0.87 0.92
India 0.05 0.07 0.11 0.10 0.42 0.67 0.55 0.64 0.55
Indonesia 0.11 0.09 0.19 0.17 0.74 0.52 0.85 0.81 0.87
Iran 0.05 0.06 0.12 0.09 0.67 0.54 0.35 0.48 0.34
Ireland 0.04 0.05 0.08 0.07 0.12 0.16 0.54 0.67 0.44
Israel 0.02 0.03 0.05 0.03 0.34 0.25 0.94 0.91 0.94
Italy 0.02 0.02 0.04 0.04 0.11 0.04 0.96 0.97 0.95
Jamaica 0.07 0.09 0.16 0.10 0.41 0.03 0.63 0.65 0.62
Japan 0.01 0.01 0.03 0.07 0.01 0.01 0.75 0.81 0.73
Jordan 0.06 0.08 0.14 0.14 0.59 0.05 0.81 0.84 0.79
Kazakhstan 0.05 0.04 0.09 0.06 0.62 0.62 0.51 0.47 0.52
Latvia 0.04 0.05 0.08 0.06 0.59 0.44 0.75 0.79 0.74
Lebanon 0.09 0.07 0.15 0.16 0.13 0.20 0.95 0.94 0.95
Lithuania 0.05 0.09 0.11 0.06 0.32 0.26 0.69 0.69 0.69
Macedonia 0.05 0.05 0.10 0.09 0.50 0.43 0.81 0.86 0.80
Malaysia 0.04 0.03 0.06 0.06 0.59 0.56 0.65 0.88 0.62

Table A.1. Main GEM statistics by country, continuation.
Country
% Owns a
start-up
% Owns a
young
business
% TEA
%Owns an
established
business
Ethnic
frac.
Alesina
Culture
diversity
Fearon
Diversity
immigration
Diversity
skilled
immigrants
Diversity
unskilled
immigrantsMexico 0.03 0.07 0.10 0.03 0.54 0.43 0.83 0.88 0.78
Morocco 0.09 0.07 0.16 0.15 0.48 0.36 0.83 0.83 0.83
Netherlands 0.02 0.02 0.05 0.05 0.11 0.08 0.90 0.88 0.90
New Zealand 0.06 0.08 0.13 0.09 0.40 0.36 0.83 0.83 0.83
Nigeria 0.10 0.33 0.35 0.09 0.85 0.66 0.87 0.90 0.86
Norway 0.03 0.04 0.06 0.06 0.06 0.10 0.96 0.95 0.96
Pakistan 0.02 0.07 0.09 0.04 0.71 0.29 0.09 0.09 0.09
Panama 0.06 0.10 0.15 0.05 0.55 0.08 0.88 0.91 0.86
Peru 0.09 0.22 0.29 0.10 0.66 0.51 0.95 0.95 0.94
Philippines 0.16 0.05 0.20 0.20 0.24 0.12 0.91 0.91 0.90
Poland 0.03 0.05 0.07 0.05 0.12 0.04 0.76 0.77 0.76
Portugal 0.03 0.03 0.06 0.06 0.05 0.04 0.91 0.93 0.90
Puerto Rico 0.02 0.02 0.03 0.02 0.00
Romania 0.02 0.03 0.04 0.03 0.31 0.27 0.92 0.95 0.90
Russia 0.02 0.02 0.04 0.02 0.25 0.31 0.83 0.83 0.83
Saudi Arabia 0.03 0.04 0.07 0.04 0.18 0.41 0.89 0.89 0.89
Serbia 0.03 0.03 0.06 0.07 0.57 0.39 0.60 0.63 0.60
Singapore 0.03 0.04 0.06 0.04 0.39 0.39 0.61 0.70 0.58
Slovakia 0.05 0.12 0.14 0.10 0.25 0.29
Slovenia 0.02 0.03 0.05 0.05 0.22 0.17 0.71 0.76 0.69
South Africa 0.02 0.04 0.06 0.02 0.75 0.53 0.89 0.89 0.86
South Korea 0.06 0.04 0.09 0.11 0.00 0.00
Spain 0.03 0.03 0.06 0.07 0.42 0.26 0.94 0.95 0.94
Sweden 0.02 0.02 0.03 0.06 0.06 0.19 0.92 0.95 0.91
Switzerland 0.03 0.03 0.06 0.08 0.53 0.42 0.92 0.92 0.91
Syria 0.05 0.03 0.08 0.07 0.54 0.24 0.26 0.31 0.25
Taiwan 0.04 0.04 0.07 0.07 0.27 0.17
Thailand 0.14 0.09 0.21 0.20 0.63 0.43 0.70 0.71 0.66
Tonga 0.11 0.07 0.17 0.03 0.09 0.91 0.89 0.91
Trinidad and Tobago 0.07 0.12 0.17 0.07 0.65 0.38 0.75 0.87 0.73
Tunisia 0.06 0.02 0.08 0.10 0.04 0.03 0.76 0.84 0.75
Turkey 0.04 0.04 0.08 0.08 0.32 0.30 0.71 0.76 0.68
Uganda 0.20 0.13 0.32 0.20 0.93 0.65 0.80 0.82 0.79
United Arab Emirates 0.04 0.05 0.08 0.03 0.63 0.65 0.82 0.82 0.82
United Kingdom 0.03 0.03 0.05 0.05 0.12 0.18 0.96 0.96 0.95
United States 0.04 0.06 0.09 0.06 0.49 0.27 0.92 0.97 0.84
Uruguay 0.04 0.08 0.11 0.06 0.25 0.00 0.83 0.86 0.81
Vanuatu 0.28 0.31 0.52 0.23 0.04
Venezuela 0.06 0.15 0.20 0.06 0.50 0.02
Yemen 0.01 0.23 0.24 0.03 0.00 0.08 0.93 0.91 0.93
Zambia 0.16 0.16 0.31 0.09 0.78 0.19 0.84 0.90 0.83 Note: Data weighted by GEM population survey.
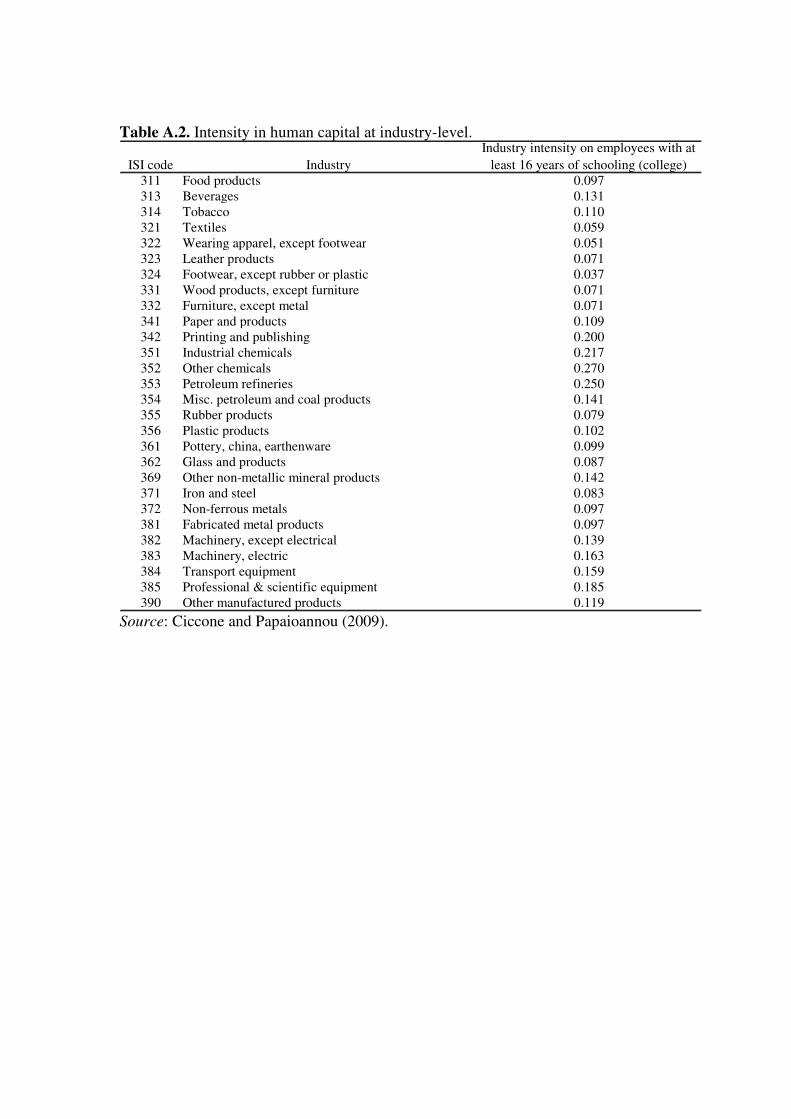
Table A.2. Intensity in human capital at industry-level.
ISI code IndustryIndustry intensity on employees with at
least 16 years of schooling (college)311 Food products 0.097313 Beverages 0.131314 Tobacco 0.110321 Textiles 0.059322 Wearing apparel, except footwear 0.051323 Leather products 0.071324 Footwear, except rubber or plastic 0.037331 Wood products, except furniture 0.071332 Furniture, except metal 0.071341 Paper and products 0.109342 Printing and publishing 0.200351 Industrial chemicals 0.217352 Other chemicals 0.270353 Petroleum refineries 0.250354 Misc. petroleum and coal products 0.141355 Rubber products 0.079356 Plastic products 0.102361 Pottery, china, earthenware 0.099362 Glass and products 0.087369 Other non-metallic mineral products 0.142371 Iron and steel 0.083372 Non-ferrous metals 0.097381 Fabricated metal products 0.097382 Machinery, except electrical 0.139383 Machinery, electric 0.163384 Transport equipment 0.159385 Professional & scientific equipment 0.185390 Other manufactured products 0.119
Source: Ciccone and Papaioannou (2009).

United States
Russia
Egypt
South AfricaGreece
NetherlandsBelgiumFrance
SpainHungary
Italy RomaniaSwitzerland
AustriaUnited KingdomDenmarkSweden
NorwayPoland
Germany
Peru
MexicoArgentina Brazil
Chile
Colombia
MalaysiaAustralia
IndonesiaPhilippines
New Zealand
Singapore
Thailand
Japan
South Korea
China
Turkey
India
Pakistan
Iran
Canada
Morocco
Algeria
Tunisia
GhanaNigeria
Angola
Barbados
Uganda
Zambia
PortugalIreland
Iceland
Finland
Lithuania
Latvia
SerbiaCroatiaSloveniaBosnia and Herzegovina
MacedoniaCzech Republic
SlovakiaGuatemala
Costa RicaPanama
Venezuela
Bolivia
Ecuador
Uruguay
Tonga
Vanuatu
Kazakhstan
Puerto RicoHong Kong
Trinidad and TobagoJamaica
Bangladesh
Taiwan
Lebanon Jordan
SyriaSaudi Arabia
Yemen
Gaza Strip & West BankUnited Arab Emirates
Israel
Domenican Republic0
.2.4
.6
% T
ota
l E
arly-S
tage E
ntrepre
neurs
hip
2001-2
011
0 .2 .4 .6 .8 1Ethnic fractionalization index
Panel A
United States
Russia
Egypt
South AfricaGreece
NetherlandsBelgiumFrance
SpainHungary
Italy RomaniaSwitzerland
Austria United KingdomDenmarkSweden
NorwayPoland
Germany
Peru
MexicoArgentinaBrazil
Chile
Colombia
MalaysiaAustralia
IndonesiaPhilippines
New Zealand
Singapore
Thailand
Japan
South Korea
China
Turkey
India
Pakistan
Iran
Canada
Morocco
Algeria
Tunisia
GhanaNigeria
Angola
Uganda
Zambia
PortugalIreland
Finland
Lithuania
Latvia
CroatiaSloveniaBosnia and Herzegovina
MacedoniaCzech Republic
SlovakiaGuatemala
Costa RicaPanama
Venezuela
Bolivia
Ecuador
UruguayKazakhstan
Trinidad and TobagoJamaica
Bangladesh
Taiwan
LebanonJordan
Syria Saudi Arabia
Yemen
United Arab Emirates
Israel
Domenican Republic
0.2
.4.6
% T
ota
l E
arly-S
tage E
ntrepre
neurs
hip
2001-2
011
0 .2 .4 .6 .8Culture diversity
Panel B
United States
Russia
Egypt
South AfricaGreece
NetherlandsBelgiumFrance
SpainHungary
ItalyRomaniaSwitzerland
AustriaUnited KingdomDenmarkSweden
NorwayPoland
Germany
Peru
MexicoArgentinaBrazilChile
Colombia
MalaysiaAustralia
IndonesiaPhilippines
New Zealand
Singapore
Thailand
Japan
China
Turkey
India
Pakistan
Iran
Canada
Morocco
Algeria
Tunisia
GhanaNigeria
Angola
Barbados
Uganda
Zambia
PortugalIreland
Iceland
Finland
Lithuania
Latvia
SerbiaCroatia SloveniaBosnia and Herzegovina
MacedoniaCzech Republic
Guatemala
Costa RicaPanama
Bolivia
Ecuador
Uruguay
Tonga
Kazakhstan
Hong Kong
Trinidad and TobagoJamaica
BangladeshLebanonJordan
Syria Saudi Arabia
Yemen
United Arab Emirates
Israel
Domenican Republic
0.2
.4.6
% T
ota
l E
arly-S
tage E
ntrepre
neurs
hip
2001-2
011
0 .2 .4 .6 .8 1Birthplace immigrants diversity
Panel C
Figure A.1. Diversity and early-stage entrepreneurship.
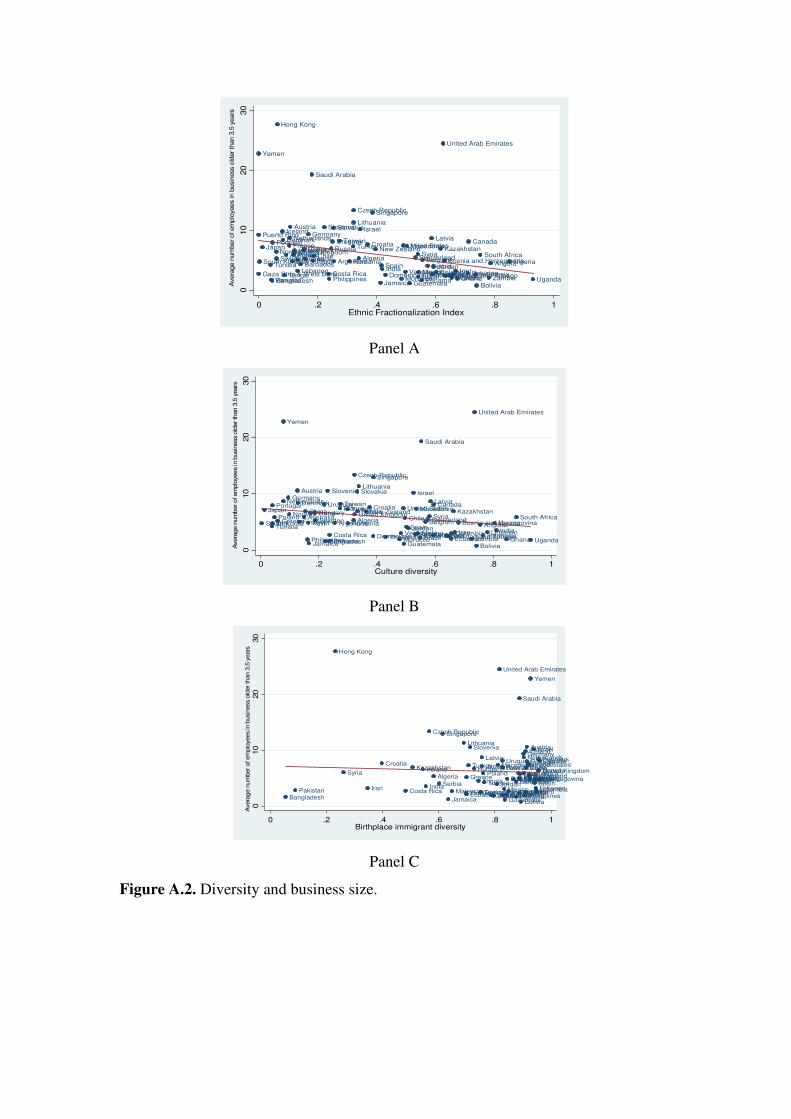
United StatesRussia
EgyptSouth Africa
Greece
Netherlands
Belgium
France
Spain
Hungary
Italy RomaniaSwitzerland
Austria
United Kingdom
Denmark
SwedenNorway
Poland
Germany
PeruMexico
Argentina
Brazil
Chile
ColombiaMalaysia
Australia
IndonesiaPhilippines
New Zealand
Singapore
Thailand
Japan
South Korea
China Turkey
IndiaPakistanIran
Canada
Morocco
AlgeriaTunisia
Ghana
NigeriaAngolaBarbados
UgandaZambia
Portugal
Ireland
Iceland
Finland
Lithuania
Latvia
Serbia
Croatia
Slovenia
Bosnia and Herzegovina
Macedonia
Czech Republic
Slovakia
Guatemala
Costa RicaPanama
Venezuela
Bolivia
Ecuador
Uruguay
TongaVanuatu
Kazakhstan
Puerto Rico
Hong Kong
Trinidad and TobagoJamaicaBangladesh
Taiwan
LebanonJordan
Syria
Saudi Arabia
Yemen
Gaza Strip & West Bank
United Arab Emirates
Israel
Domenican Republic
010
20
30
Avera
ge n
um
ber of em
plo
yees in b
usin
ess o
lder th
an 3
.5 y
ears
0 .2 .4 .6 .8 1Ethnic Fractionalization Index
Panel A
United StatesRussia
EgyptSouth Africa
Greece
Netherlands
Belgium
France
Spain
Hungary
Italy RomaniaSwitzerland
Austria
United Kingdom
Denmark
SwedenNorway
Poland
Germany
PeruMexico
Argentina
Brazil
Chile
ColombiaMalaysia
Australia
IndonesiaPhilippines
New Zealand
Singapore
Thailand
Japan
South Korea
China Turkey
IndiaPakistan Iran
Canada
Morocco
AlgeriaTunisia
Ghana
NigeriaAngola
UgandaZambia
Portugal
Ireland
Finland
Lithuania
LatviaCroatia
Slovenia
Bosnia and Herzegovina
Macedonia
Czech Republic
Slovakia
Guatemala
Costa RicaPanama
Venezuela
Bolivia
Ecuador
UruguayKazakhstan
Trinidad and TobagoJamaicaBangladesh
Taiwan
LebanonJordan
Syria
Saudi Arabia
Yemen
United Arab Emirates
Israel
Domenican Republic
010
20
30
Avera
ge n
um
ber of em
plo
yees in b
usin
ess o
lder th
an 3
.5 y
ears
0 .2 .4 .6 .8 1Culture diversity
Panel B
United StatesRussia
EgyptSouth Africa
Greece
Netherlands
Belgium
France
Spain
Hungary
ItalyRomaniaSwitzerland
Austria
United Kingdom
Denmark
SwedenNorway
Poland
Germany
PeruMexico
Argentina
Brazil
Chile
ColombiaMalaysia
Australia
IndonesiaPhilippines
New Zealand
Singapore
Thailand
Japan ChinaTurkey
IndiaPakistan Iran
Canada
Morocco
AlgeriaTunisia
Ghana
NigeriaAngola Barbados
UgandaZambia
Portugal
Ireland
Iceland
Finland
Lithuania
Latvia
Serbia
Croatia
Slovenia
Bosnia and Herzegovina
Macedonia
Czech Republic
Guatemala
Costa RicaPanama
Bolivia
Ecuador
Uruguay
Tonga
Kazakhstan
Hong Kong
Trinidad and TobagoJamaicaBangladesh
LebanonJordan
Syria
Saudi Arabia
Yemen
United Arab Emirates
Israel
Domenican Republic
010
20
30
Avera
ge n
um
ber of em
plo
yees
in b
usin
ess o
lder th
an 3
.5 y
ears
0 .2 .4 .6 .8 1Birthplace immigrant diversity
Panel C
Figure A.2. Diversity and business size.