Microsoft ® Office PowerPoint ® 2007 Training Get visual with SmartArt graphics.
Upload
stephen-pattersonCategory
view
216download
1
Creating SmartArt GraphicsLesson 7
© 2014, John Wiley & Sons, Inc.
Microsoft Official Academic Course, Powerpoint 2013
1
Microsoft Powerpoint 2013

Objectives
© 2014, John Wiley & Sons, Inc.
Microsoft Official Academic Course, Powerpoint 2013
2

Step by Step: Create SmartArt • GET READY. Before you begin these steps, make sure
that your computer is on. Log on, if necessary.1. START PowerPoint, if the program is not already
running.2. Locate and open the Litware presentation and
save it as Litware Final.3. Go to slide 3, and click the Insert SmartArt
Graphic icon in the center of the content placeholder. The Choose a SmartArt Graphic dialog box opens.
4. Click Hierarchy in the type list in the left side of the dialog box. The layouts for the Hierarchy type are displayed.
© 2014, John Wiley & Sons, Inc.
Microsoft Official Academic Course, Powerpoint 2013
3

Step by Step: Create SmartArt 5. Click the first layout in the first row, the
Organization Chart. Read the description of the Organization Chart layout in the right pane of the dialog box (see the figure below).
© 2014, John Wiley & Sons, Inc.
Microsoft Official Academic Course, Powerpoint 2013
4

Step by Step: Create SmartArt
6. Click OK to insert the chart. The chart appears on the slide (see the figure below).
7. SAVE the presentation.• PAUSE. LEAVE the presentation open for the next
exercise.
© 2014, John Wiley & Sons, Inc.
Microsoft Official Academic Course, Powerpoint 2013
5

Step by Step: Add Text to SmartArt • USE the Litware Final presentation that is still open from
the previous exercise.1. Click Text Pane on the SmartArt Tools Design tab. This
opens the Text pane. 2. At the top of the text pane, type Ted Hicks to enter
the name in the top-level shape. Notice that as you type the text in the Text pane, it appears in the top shape (see the figure below), and that the text automatically resizes to fit in the shape.
© 2014, John Wiley & Sons, Inc.
Microsoft Official Academic Course, Powerpoint 2013
6

Step by Step: Add Text to SmartArt
3. Click in the bullet item below Ted Hicks in the Text pane, then type Rose Lang. Rose Lang is an assistant to Ted Hicks, and as such, she has an assistant shape on a level between the top-level shape and the subordinate shapes.
4. Click in the next bullet item in the Text pane and type Marcus Short. Marcus Short is a subordinate to Ted Hicks.
5. Click in the next bullet item and type Ellen Camp.
6. Click in the last bullet item and type Pat Cramer. 7. Click the Close button (X) in the Text pane to hide
it. You will complete the text entry by typing directly in the shapes.© 2014, John Wiley & Sons,
Inc.Microsoft Official Academic Course, Powerpoint
20137

Step by Step: Add Text to SmartArt
8. Click just to the right of the name Hicks in the top-level shape, press Enter, and type Director. Notice that the text size adjusts in all the shapes to account for the additional entry in the top-level shape.
9. Click after the name Lang in the assistant shape, press Enter, and type Assistant Director.
10. Use the same process to type the title Reading Products for Marcus Short, Linguistics Products for Ellen Camp, and Writing Products for Pat Cramer.
© 2014, John Wiley & Sons, Inc.
Microsoft Official Academic Course, Powerpoint 2013
8

Step by Step: Add Text to SmartArt
1. Click away from the SmartArt to deselect it. Your slide should look similar to the figure at right.
2. SAVE the presentation.
• PAUSE. LEAVE the presentation open to use in the next exercise.
© 2014, John Wiley & Sons, Inc.
Microsoft Official Academic Course, Powerpoint 2013
9
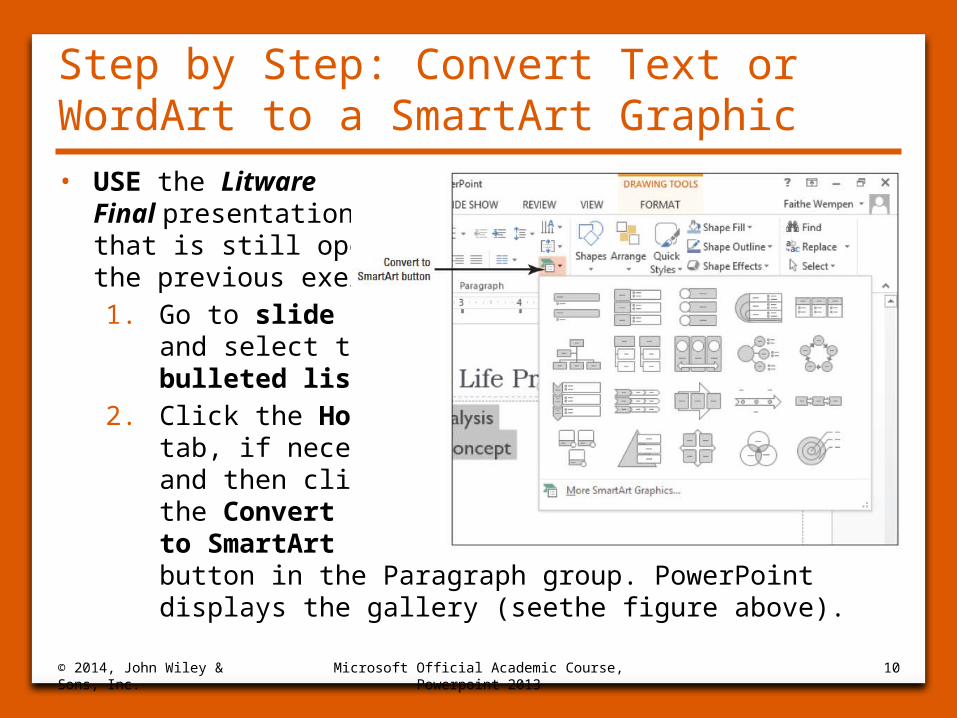
Step by Step: Convert Text or WordArt to a SmartArt Graphic• USE the Litware
Final presentation that is still open from the previous exercise.1. Go to slide 4
and select the bulleted list.
2. Click the Home tab, if necessary, and then click the Convert to SmartArt button in the Paragraph group. PowerPoint displays the gallery (seethe figure above).
© 2014, John Wiley & Sons, Inc.
Microsoft Official Academic Course, Powerpoint 2013
10

Step by Step: Convert Text or WordArt to a SmartArt Graphic
3. Click More SmartArt Graphics… at the bottom of the gallery. The Choose a SmartArt Graphic dialog box opens.
4. Click Cycle, and then click the Block Cycle layout (third layout in the first row). Read the description of how best to use the Block Cycle layout.
5. Click OK. The bulleted list is converted to a cycle graphic (see the figure above).
© 2014, John Wiley & Sons, Inc.
Microsoft Official Academic Course, Powerpoint 2013
11

Step by Step: Convert Text or WordArt to a SmartArt Graphic
6. Go to slide 1, and triple-click the Developer Orientation WordArt object to select it.
7. On the Home tab, click Convert to SmartArt, then click Vertical Bullet List (the first layout in the first row). The WordArt text is converted to a single-item SmartArt object (see the figure below).
8. SAVE the presentation.• PAUSE. LEAVE the presentation open to use in the next
exercise.
© 2014, John Wiley & Sons, Inc.
Microsoft Official Academic Course, Powerpoint 2013
12

Step by Step: Apply a Style to SmartArt • USE the Litware Final
presentation that is still open from the previous exercise.1. Go to slide 3 and click once
on the SmartArt graphic to select it. Take care to select the SmartArt itself, and not a particular shape within it.
2. Click the SmartArt Tools Design tab to activate it.
3. Click the More button in the SmartArt Styles group. The SmartArt Style gallery appears (see the figure above).
© 2014, John Wiley & Sons, Inc.
Microsoft Official Academic Course, Powerpoint 2013
13

Step by Step: Apply a Style to SmartArt
4. Click the Cartoon style. (It is the third style in the first row of the 3-D section.) PowerPoint applies the style (see the figure at right).
5. Go to slide 1, click the SmartArt object, andrepeat steps 2-4 to apply the same style.
© 2014, John Wiley & Sons, Inc.
Microsoft Official Academic Course, Powerpoint 2013
14

Step by Step: Apply a Style to SmartArt
6. Go to slide 4, click the SmartArt object, and repeat steps 2-4 to apply the same style.
7. SAVE the presentation.• PAUSE. LEAVE the presentation open to use in the next
exercise.
© 2014, John Wiley & Sons, Inc.
Microsoft Official Academic Course, Powerpoint 2013
15

Step by Step: Apply a Color Theme to a SmartArt Graphic• By default, SmartArt uses variants of a single theme
color. Use the Change Colors gallery to apply a different theme color.
• USE the Litware Final presentation that is still open from the previous exercise.1. Go to slide 3 and click the SmartArt graphic to
select it. Click the SmartArt Tools Design tab.2. Click the Change Colors button in the SmartArt
Styles group. The Change Colors gallery opens.
© 2014, John Wiley & Sons, Inc.
Microsoft Official Academic Course, Powerpoint 2013
16
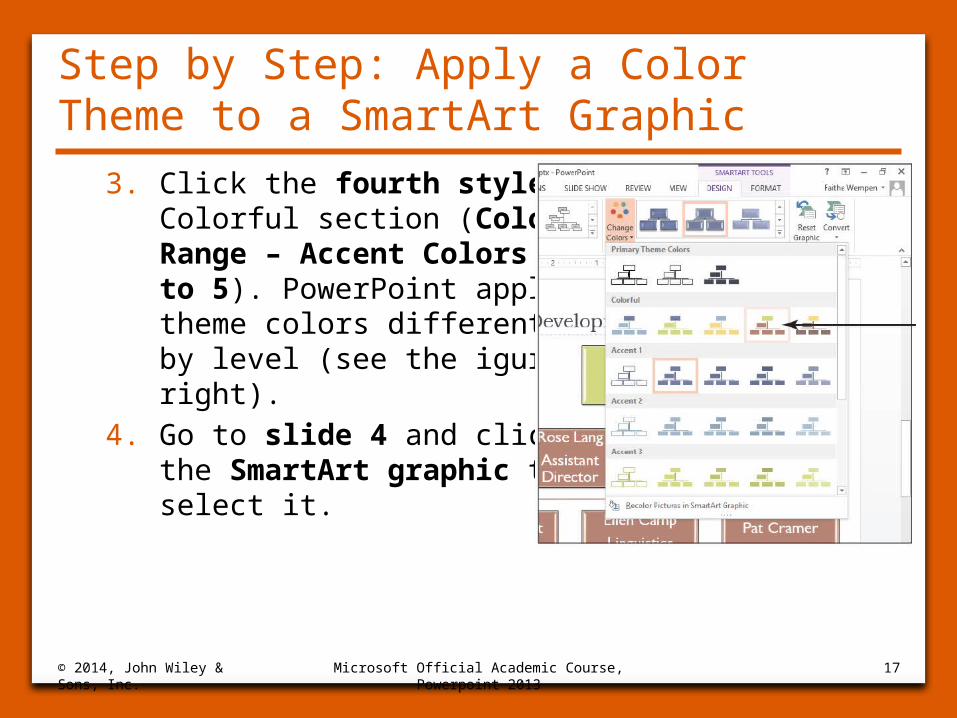
Step by Step: Apply a Color Theme to a SmartArt Graphic
3. Click the fourth style in the Colorful section (Colorful Range – Accent Colors 4 to 5). PowerPoint applies theme colors differentiated by level (see the igure at right).
4. Go to slide 4 and click the SmartArt graphic to select it.
© 2014, John Wiley & Sons, Inc.
Microsoft Official Academic Course, Powerpoint 2013
17

Step by Step: Apply a Color Theme to a SmartArt Graphic
5. Click the Change Colors button in the SmartArt Styles group, opening the Change Colors Gallery, and then click the first style in the Colorful section (Colorful Accent Colors). PowerPoint uses theme colors to apply different tints to each shape.
6. SAVE the presentation.• PAUSE. LEAVE the presentation open to use in the
next exercise.
© 2014, John Wiley & Sons, Inc.
Microsoft Official Academic Course, Powerpoint 2013
18

Step by Step: Change a SmartArt Layout • USE the Litware Final presentation that is still open
from the previous exercise.1. Click the SmartArt graphic on slide 4 to select it, if
necessary. Make sure you select the outer frame of the graphic—not an individual shape.
2. Click the More button in the Layouts group to display the Layouts gallery.
© 2014, John Wiley & Sons, Inc.
Microsoft Official Academic Course, Powerpoint 2013
19

Step by Step: Change a SmartArt Layout
3. Click Continuous Cycle (see the figure below). It is the first layout in the second row. PowerPoint applies the new cycle layout to the current chart (see the figure on the next slide).
4. SAVE the presentation.• PAUSE. LEAVE the presentation open to use in the next
exercise.
© 2014, John Wiley & Sons, Inc.
Microsoft Official Academic Course, Powerpoint 2013
20

Step by Step: Change a SmartArt Layout
© 2014, John Wiley & Sons, Inc.
Microsoft Official Academic Course, Microsoft Word 2013
21

Step by Step: Add a Shape to a SmartArt Graphic• USE the Litware Final presentation that is still open
from the previous exercise.1. Go to slide 3 and click the SmartArt graphic to
select it. Make sure you select the graphic’s outer frame, and not a specific shape within it.
2. Click the SmartArt Tools Design tab.3. Click the last shape in the last row (Pat Cramer)
to select it.
© 2014, John Wiley & Sons, Inc.
Microsoft Official Academic Course, Powerpoint 2013
22

Step by Step: Add a Shape to a SmartArt Graphic
4. Click the Add Shape drop-down arrow in the Create Graphic group. PowerPoint displays a menu of optionsfor adding a shape relative to the current shape (see thefigure at right).
5. Click Add Shape Below. PowerPoint adds a sub-ordinate shape to the Pat Cramer shape.
© 2014, John Wiley & Sons, Inc.
Microsoft Official Academic Course, Powerpoint 2013
23
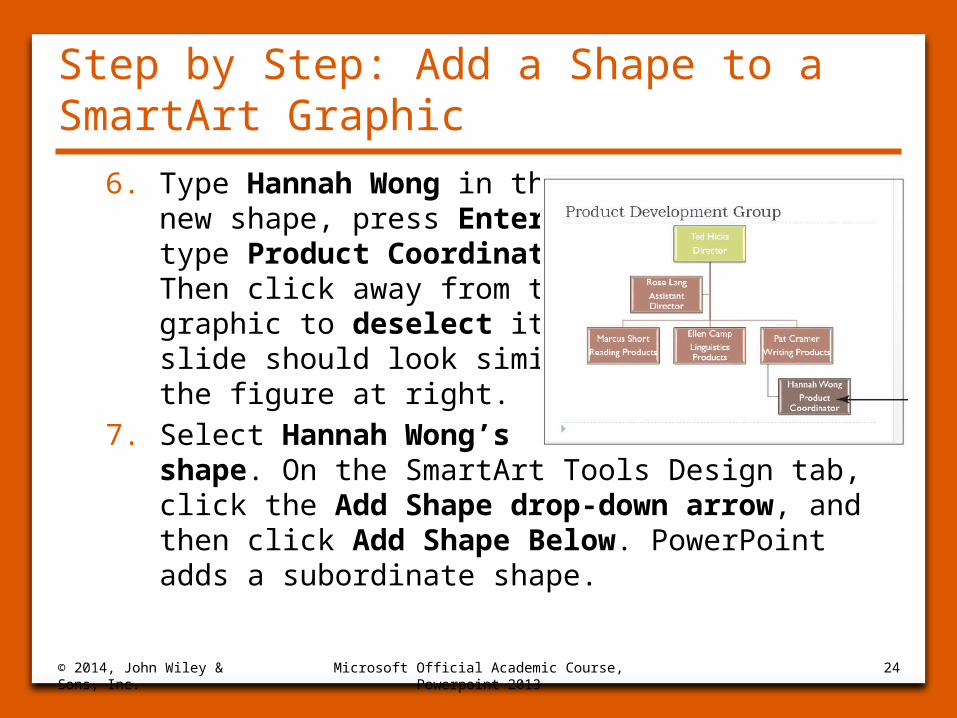
Step by Step: Add a Shape to a SmartArt Graphic
6. Type Hannah Wong in the new shape, press Enter, and type Product Coordinator. Then click away from thegraphic to deselect it. The slide should look similar to the figure at right.
7. Select Hannah Wong’s shape. On the SmartArt Tools Design tab, click the Add Shape drop-down arrow, and then click Add Shape Below. PowerPoint adds a subordinate shape.
© 2014, John Wiley & Sons, Inc.
Microsoft Official Academic Course, Powerpoint 2013
24

Step by Step: Add a Shape to a SmartArt Graphic
8. Type Allan Morgan into the new shape, press Enter, and type Software Design.
9. With Allan Morgan’s shape still selected, click the Add Shape drop-down arrow, and then click Add Shape After. PowerPoint adds a shape on the same level.
10. Type Kyle Porter in the new shape, press Enter, and type Package Design.
© 2014, John Wiley & Sons, Inc.
Microsoft Official Academic Course, Powerpoint 2013
25

Step by Step: Add a Shape to a SmartArt Graphic
11. Click away from the graphic to deselect it. Your slide should look similar to the figure at right.
12.SAVE the presentation.• PAUSE. LEAVE the
presentation open to use in the next exercise.
© 2014, John Wiley & Sons, Inc.
Microsoft Official Academic Course, Powerpoint 2013
26

Step by Step: Remove a Shape from a SmartArt Graphic • USE the Litware Final presentation that is still open from
the previous exercise.1. Go to slide 4, and click the
SmartArt graphic to select it.2. Click the Update shape to select it.
Make sure you select the shape, and not the text within it.
3. Press Delete. PowerPoint removes the shape and reconfigures the SmartArt graphic (see the figure above).
4. SAVE the presentation.• PAUSE. LEAVE the presentation open to use in the next
exercise.
© 2014, John Wiley & Sons, Inc.
Microsoft Official Academic Course, Powerpoint 2013
27

Step by Step: Reverse Direction• USE the Litware Final presentation that is still open
from the previous exercise.1. Go to slide 3 and click the SmartArt graphic to
select it. Make sure you select the entire graphic.2. Click the SmartArt Tools Design tab, if it is not
already displayed.
© 2014, John Wiley & Sons, Inc.
Microsoft Official Academic Course, Powerpoint 2013
28

Step by Step: Reverse Direction
3. Click the Right to Left button in the Create Graphic group. PowerPoint flips the graphic horizontally so that shapes on the right side are now on the left side (see the figureat right).
4. Click in the top-level shape (Ted Hicks). Make sure you select the shape, and not the text within it.
© 2014, John Wiley & Sons, Inc.
Microsoft Official Academic Course, Powerpoint 2013
29
Step by Step: Reverse Direction
© 2014, John Wiley & Sons, Inc.
Microsoft Official Academic Course, Powerpoint 2013
30
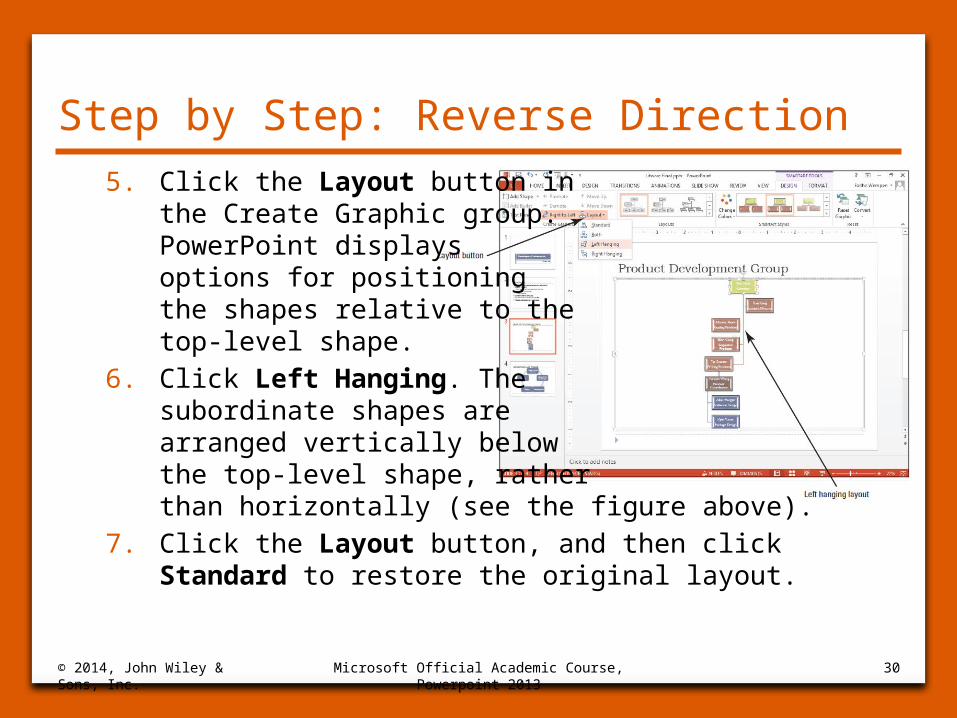
5. Click the Layout button in the Create Graphic group. PowerPoint displays options for positioning the shapes relative to the top-level shape.
6. Click Left Hanging. The subordinate shapes are arranged vertically below the top-level shape, rather than horizontally (see the figure above).
7. Click the Layout button, and then click Standard to restore the original layout.

Step by Step: Reverse Direction
8. Click the Hannah Wong shape, click the Layout button, and then click Both. The subordinate shapes display horizontally rather than vertically (see the figure at right).
9. SAVE the presentation.
• PAUSE. LEAVE the presentation open to use in the next exercise.
© 2014, John Wiley & Sons, Inc.
Microsoft Official Academic Course, Powerpoint 2013
31

Step by Step: Move a SmartArt Shape • USE the Litware Final presentation that is still open
from the previous exercise.1. Go to slide 4 and click the SmartArt graphic to
select it.2. Click the Testing shape.3. On the SmartArt Tools Design tab, click Move
Down. The shape moves one position in a clockwise direction. Note that in this example, Move Down actually moves the shape upward in the graphic.
4. Click Move Up. The shape moves one position in a counter-clockwise direction.
5. SAVE the presentation.• PAUSE. LEAVE the presentation open to use in the
next exercise.© 2014, John Wiley & Sons, Inc.
Microsoft Official Academic Course, Powerpoint 2013
32
Step by Step: Promote a Shape• USE the Litware Final presentation that is still open
from the previous exercise.1. Click the SmartArt graphic on slide 3 to select it,
if necessary.2. If the text pane is not already open, click the Text
Pane button on the SmartArt Tools Design tab.3. In the Text pane, click the Hannah Wong
bulleted item. Notice in the Text pane that this item is indented below the Pat Cramer bulleted item.
© 2014, John Wiley & Sons, Inc.
Microsoft Official Academic Course, Powerpoint 2013
33

Step by Step: Promote a Shape
4. Click the Promote button in the Create Graphic group. Hannah Wong’s shape jumps up one level, and her two subordinates are also promoted (see the figure at right).
5. Click the Text Pane button to hide the text pane again.
6. SAVE the presentation.• PAUSE. LEAVE the presentation open to use in the
next exercise.© 2014, John Wiley & Sons, Inc.
Microsoft Official Academic Course, Powerpoint 2013
34
Step by Step: Choose a Different SmartArt Type and Layout• USE the Litware Final presentation that is still open
from the previous exercise.1. Go to slide 4 and click the SmartArt graphic to
select it.2. Click the More… button in the Layouts group, and
then click More Layouts at the bottom of the gallery to open the Choose a SmartArt Graphic dialog box.
3. Click the Process type in the left pane, then click the Upward Arrow layout in the center pane.
© 2014, John Wiley & Sons, Inc.
Microsoft Official Academic Course, Powerpoint 2013
35

Step by Step: Choose a Different SmartArt Type and Layout
4. Click OK. PowerPoint converts the SmartArt graphic to the Upward Arrow type (see the figure at right).
5. SAVE the presentation.• PAUSE. LEAVE the presentation
open to use in the next exercise.
© 2014, John Wiley & Sons, Inc.
Microsoft Official Academic Course, Powerpoint 2013
36

Step by Step: Change Shape Size• USE the Litware Final presentation that is still open
from the previous exercise.1. Close the Text pane if it is open.2. Select the SmartArt graphic on slide 4 if it is not
already selected, and then click the Needs/Market Analysis circle (the circle nearest the thin end of the arrow graphic) to select it. Make sure you select the circle, not the text.
3. Click the SmartArt Tools Format tab.4. Click the Larger button in the Shapes group twice
to increase the size of the smallest circle.5. Click the Design/Proof of Concept circle shape,
and then click the Larger button once to increase the shape’s size.
© 2014, John Wiley & Sons, Inc.
Microsoft Official Academic Course, Powerpoint 2013
37

Step by Step: Change Shape Size
6. Click the Roll-out circle shape, and then click the Smaller button in the Shapes group once to decrease the shape size. Then click away from the graphic to deselect it. Your SmartArt graphic should look like the figure below.
© 2014, John Wiley & Sons, Inc.
Microsoft Official Academic Course, Powerpoint 2013
38
Step by Step: Change Shape Size
7. SAVE the presentation.• PAUSE. LEAVE the presentation open to use in the
next exercise.
© 2014, John Wiley & Sons, Inc.
Microsoft Official Academic Course, Powerpoint 2013
39

Step by Step: Change Text Formatting• USE the Litware Final presentation that is still open
from the previous exercise.1. On slide 4, select the
outer frame of the SmartArt graphic (not a specific shape within it).
2. On the Home tab, click the Font Size drop-down arrow, and then click 20. PowerPoint changes the size of all text in the graphic to 20 point (see the figure above).
© 2014, John Wiley & Sons, Inc.
Microsoft Official Academic Course, Powerpoint 2013
40

Step by Step: Change Text Formatting
3. Click the Needs/Market analysis text box and drag its border to reduce its width slightly so that the word Market moves completely to the second line.
4. Click the Design/Proof of concept text box and expand its width so that the word Proof displays completely on the first line.
5. With the Design/Proof of concept text box selected, press the right arrow key on the keyboard three times to move the text box slightly to the right so its text does not overlap the circle shape.
© 2014, John Wiley & Sons, Inc.
Microsoft Official Academic Course, Powerpoint 2013
41

Step by Step: Change Text Formatting
6. Widen the Development text box so the word fits on a single line, and move the text box to the right slightly, as you did in step 5. Then click away from the graphic to deselect it. Your completed graphic should look similar to the figure at right.
© 2014, John Wiley & Sons, Inc.
Microsoft Official Academic Course, Powerpoint 2013
42

Step by Step: Change Text Formatting
7. Go to slide 3 and click the SmartArt graphic to select it.
8. Click the outside edge of the Ted Hicks shape.9. Click the Font Color drop-down arrow on the
Home tab, and then click Black, Text 1. The text in that shape is now easier to read against the light green fill.
© 2014, John Wiley & Sons, Inc.
Microsoft Official Academic Course, Powerpoint 2013
43

Step by Step: Change Text Formatting
10. Click the Bold button on the Home tab. All text in the shape is bolded. Then click away from the graphic to deselect it. Your graphic should look like the figure at right.
11. SAVE the presentation.• PAUSE. LEAVE the
presentation open to use in the next exercise.
© 2014, John Wiley & Sons, Inc.
Microsoft Official Academic Course, Powerpoint 2013
44

Step by Step: Convert SmartArt • USE the Litware Final presentation that is still open
from the previous exercise.1. Go to slide 4 and select the SmartArt object.2. On the SmartArt Tools Design tab, click the
Convert button, then click Convert to Text from the menu that appears. The SmartArt is converted to a bulleted list.
3. Go to slide 3 and select the SmartArt object.4. On the SmartArt Tools Design tab, click the
Convert button, and then click Convert to Shapes. The diagram changes to a set of shapes.
© 2014, John Wiley & Sons, Inc.
Microsoft Official Academic Course, Powerpoint 2013
45

Step by Step: Convert SmartArt
5. Click inside the diagram to confirm that the SmartArt tabs on the Ribbon do not appear.
6. Click one of the diagram's shapes. Notice that the Drawing Tools Format tab becomes available, indicating it is a drawn shape object.
7. SAVE the presentation and CLOSE it.• EXIT PowerPoint.
© 2014, John Wiley & Sons, Inc.
Microsoft Official Academic Course, Powerpoint 2013
46

Skill Summary
© 2014, John Wiley & Sons, Inc.
Microsoft Official Academic Course, Powerpoint 2013
47