CRADLE-TO-GATE LIFE CYCLE ANALYSIS OF LINEAR LOW- DENSITY …
49
CRADLE-TO-GATE LIFE CYCLE ANALYSIS OF LINEAR LOW- DENSITY POLYETHLENE (LLDPE) RESIN Final Report Submitted to: American Chemistry Council (ACC) Plastics Division Submitted by: Franklin Associates, A Division of ERG October, 2020
Transcript of CRADLE-TO-GATE LIFE CYCLE ANALYSIS OF LINEAR LOW- DENSITY …
CRADLE-TO-GATE LIFE CYCLE ANALYSIS OF LINEAR LOW-
DENSITY POLYETHLENE (LLDPE) RESIN
Final Report
Submitted to:
American Chemistry Council (ACC) Plastics Division
Submitted by:
Franklin Associates, A Division of ERG
October, 2020
PREFACE This life cycle assessment of LLDPE resin was commissioned and funded by the American Chemical Council (ACC) Plastics Division to update the original data in the 2011 report, Cradle-to-Gate Life Cycle Inventory of Nine Plastic Resins and Four Polyurethane Precursors, as well as the U.S. LCI plastics database. The report was made possible through the cooperation of ACC member companies, who provided data for the production of olefins and LLDPE resin. This report was prepared for ACC by Franklin Associates, A Division of Eastern Research Group, Inc. as an independent contractor. This project was managed by Melissa Huff, Senior LCA Analyst and Project Manager. Anne Marie Molen assisted with data collection tasks, modeling, and report and appendix preparation. Mariya Absar aided with research and modeling. Caitlin Chiquelin assisted with analysis and report preparation. Ben Young assisted with research. Franklin Associates gratefully acknowledges the significant contribution to this project by Mike Levy, Keith Christman, and Prapti Muhuri of ACC in leading this project. Also acknowledged are the following companies: Chevron Phillips Chemical Corporation, ExxonMobil Corporation, NOVA Chemical Corporation, and Dow, who graciously provided primary Life Cycle Inventory data for LLDPE resin production. Their effort in collecting data has added considerably to the quality of this LCA report. Finally, thank you to the subset of ACC members who thoroughly reviewed this report. Franklin Associates makes no statements other than those presented within the report. October, 2020
CLIENT\ACCPlasticsDiv\KC202756
10.19.20 4031.00.002 iii
TABLE OF CONTENTS
INTRODUCTION ..................................................................................................................................................... 1
STUDY GOAL AND SCOPE ....................................................................................................................................... 2
STUDY GOAL AND INTENDED USE ................................................................................................................................ 3 FUNCTIONAL UNIT .................................................................................................................................................. 3 SCOPE AND BOUNDARIES.......................................................................................................................................... 3
Technological Scope – Low Pressure Reactor Technologies ............................................................................. 5 Temporal and Geographic Scope ................................................................................................................... 5 Exclusions from the Scope .............................................................................................................................. 6
INVENTORY AND IMPACT ASSESSMENT RESULTS CATEGORIES ............................................................................................ 7 DATA SOURCES ...................................................................................................................................................... 9 DATA QUALITY ASSESSMENT ................................................................................................................................... 10 DATA ACCURACY AND UNCERTAINTY ......................................................................................................................... 11 METHOD ............................................................................................................................................................ 12
Raw Materials Use for Internal Energy in Steam Crackers............................................................................. 12 Coproduct Allocation ................................................................................................................................... 12 Electricity Grid Fuel Profile ........................................................................................................................... 14 Electricity/Heat Cogeneration ...................................................................................................................... 14
LIFE CYCLE INVENTORY AND IMPACT ASSESSMENT RESULTS ............................................................................... 16
ENERGY DEMAND ................................................................................................................................................. 16 Cumulative Energy Demand ......................................................................................................................... 16 Energy Demand by Fuel Type ....................................................................................................................... 19
SOLID WASTE ...................................................................................................................................................... 20 WATER CONSUMPTION .......................................................................................................................................... 22 GLOBAL WARMING POTENTIAL ................................................................................................................................ 24 ACIDIFICATION POTENTIAL ...................................................................................................................................... 25 EUTROPHICATION POTENTIAL .................................................................................................................................. 26 OZONE DEPLETION POTENTIAL................................................................................................................................. 28 PHOTOCHEMICAL SMOG FORMATION ........................................................................................................................ 29
COMPARISON OF 2020 AND 2011 LCI AND LCIA RESULTS .................................................................................... 30
ENERGY COMPARISON ........................................................................................................................................... 31 SOLID WASTE COMPARISON .................................................................................................................................... 32 GLOBAL WARMING POTENTIAL COMPARISON .............................................................................................................. 33
APPENDIX: LINEAR LOW-DENSITY POLYETHYLENE (LLDPE) MANUFACTURE ........................................................ 35
HYDROGEN PRODUCTION FROM STEAM CRACKING ........................................................................................................ 35 LINEAR LOW-DENSITY POLYETHYLENE (LLDPE) PRODUCTION .......................................................................................... 40 REFERENCES ........................................................................................................................................................ 44
CLIENT\ACCPlasticsDiv\KC202756
10.19.20 4031.00.002 iv
LIST OF ACRONYMS
(Alphabetical)
ACC AMERICAN CHEMISTRY COUNCIL
AP ACIDIFICATION POTENTIAL
API AMERICAN PETROLEUM INSTITUTE
BOD BIOCHEMICAL OXYGEN DEMAND
BTEX BENZENE, TOLUENE, ETHYLBENZENE, AND XYLENE
COD CHEMICAL OXYGEN DEMAND
CFC CHLOROFLUOROCARBON
EGRID EMISSIONS & GENERATION RESOURCE INTEGRATED DATABASE
EIA ENERGY INFORMATION ADMINISTRATION
EP EUTROPHICATION POTENTIAL
ERG EASTERN RESEARCH GROUP, INC
EQ EQUIVALENTS
GHG GREENHOUSE GAS
GHGRP GREENHOUSE GAS REPORTING PROGRAM
GJ GIGAJOULE
GREET GREENHOUSE GASES, REGULATED EMISSIONS, AND ENERGY USE IN TRANSPORTATION
GWP GLOBAL WARMING POTENTIAL
IPCC INTERGOVERNMENTAL PANEL ON CLIMATE CHANGE
ISO INTERNATIONAL ORGANIZATION FOR STANDARDIZATION
LCA LIFE CYCLE ASSESSMENT
LCI LIFE CYCLE INVENTORY
LCIA LIFE CYCLE IMPACT ASSESSMENT
LLDPE LINEAR LOW-DENSITY POLYETHYLENE
LPG LIQUEFIED PETROLEUM GAS
MJ MEGAJOULE
MM MILLION
NAICS NORTH AMERICAN INDUSTRY CLASSIFICATION SYSTEM

CLIENT\ACCPlasticsDiv\KC202756
10.19.20 4031.00.002 v
NAPAP NATIONAL ACID PRECIPITATION ASSESSMENT PROGRAM
NGL NATURAL GAS LIQUID
NMVOC NON-METHANE VOLATILE ORGANIC COMPOUNDS
NREL NATIONAL RENEWABLE ENERGY LABORATORY
ODP OZONE DEPLETION POTENTIAL
POCP PHOTOCHEMICAL SMOG FORMATION (HISTORICALLY PHOTOCHEMICAL OXIDANT CREATION POTENTIAL)
RCRA RESOURCE CONSERVATION AND RECOVERY ACT
SI INTERNATIONAL SYSTEM OF UNITS
TRACI TOOL FOR THE REDUCTION AND ASSESSMENT OF CHEMICAL AND OTHER ENVIRONMENTAL IMPACTS
TRI TOXIC RELEASE INVENTORY
WTE WASTE-TO-ENERGY INCINERATION

CLIENT\ACCPlasticsDiv\KC202756
10.19.20 4031.00.002 1
CRADLE-TO-GATE LIFE CYCLE ASSESSMENT OF LINEAR LOW-DENSITY POLYETHYLENE (LLDPE) RESIN
INTRODUCTION This study provides the American Chemical Council (ACC), their members, users of the U.S. LCI Database, and the public at large with information about the life cycle inventory and impacts for the production of Linear Low-density Polyethylene (LLDPE) resin, which is used in the production of a variety of materials including stretch wrap, bags, liners, and flexible tubes in North America. Life cycle assessment (LCA) is recognized as a scientific method for making comprehensive, quantified evaluations of the environmental benefits and tradeoffs commonly for the entire life cycle of a product system, beginning with raw material extraction and continuing through disposition at the end of its useful life as shown in Figure 1 below. This cradle-to-gate LCA includes the life cycle stages shown in the dashed box including the “Raw Materials Acquisition” and “Materials Manufacture” boxes in the figure.
Figure 1. General materials flow for “cradle-to-grave” analysis of a product system. The dashed box indicates the boundaries of this analysis.
The results of this analysis are useful for understanding production-related impacts and are provided in a manner suitable for incorporation into full life cycle assessment studies. The information from an LCA can be used as the basis for further study of the potential improvement of resource use and environmental impacts associated with product systems. It can also pinpoint areas (e.g., material components or processes) where changes would be most beneficial in terms of reducing energy use or potential impacts. A life cycle assessment commonly examines the sequence of steps in the life cycle of a product system, beginning with raw material extraction and continuing through material production, product fabrication, use, reuse, or recycling where applicable, and final

CLIENT\ACCPlasticsDiv\KC202756
10.19.20 4031.00.002 2
disposition. This cradle-to-gate life cycle inventory (LCI) and life cycle impact assessment (LCIA) quantifies the total energy requirements, energy sources, water consumption, atmospheric pollutants, waterborne pollutants, and solid waste resulting from the production of LLDPE resin. It is considered a cradle-to-gate boundary system because this analysis ends with the LLDPE resin production. The system boundaries stop at the LLDPE resin production so that the resin data can be linked to a fabrication process where it is an input material, and end-of-life data to create full life cycle inventories for a variety of products, such as films, flexible tubing, and other packaging. The method used for this inventory has been conducted following internationally accepted standards for LCI and LCA methodology as outlined in the International Organization for Standardization (ISO) 14040 and 14044 standard documents1. This LCA boundary ends at material production. An LCA consists of four phases: • Goal and scope definition
• Life cycle inventory (LCI)
• Life cycle impact assessment (LCIA)
• Interpretation of results
The LCI identifies and quantifies the material inputs, energy consumption, water consumption, and environmental emissions (atmospheric emissions, waterborne wastes, and solid wastes) over the defined scope of the study. The LCI data for the LLDPE unit process is shown separately in the attached Appendix. The LCI data for the olefins system is shown in the appendix of a separate report, Cradle-to-Gate Life Cycle Analysis of Olefins2. All unit processes will be made available to the National Renewable Energy Laboratory (NREL) who maintains the U.S. LCI Database. In the LCIA phase, the inventory of emissions is classified into categories in which the emissions may contribute to impacts on human health or the environment. Within each impact category, the emissions are then normalized to a common reporting basis, using characterization factors that express the impact of each substance relative to a reference substance.
STUDY GOAL AND SCOPE In this section, the goal and scope of the study is defined, including information on data sources used and methodology.
1 International Standards Organization. ISO 14040:2006 Environmental management—Life cycle
assessment—Principles and framework, ISO 14044:2006, Environmental management – Life cycle assessment – Requirements and guidelines.
2 Cradle-to-Gate Life Cycle Analysis of Olefins. Franklin Associates, a Division of ERG. Submitted to the Plastics Division of the American Chemistry Council (ACC). April, 2020.

CLIENT\ACCPlasticsDiv\KC202756
10.19.20 4031.00.002 3
STUDY GOAL AND INTENDED USE The purpose of this LCA is to document the LCI data and then evaluate the environmental profile of LLDPE resin. The intended use of the study results is twofold:
• To provide the LCA community and other interested parties with average North American LCI data for LLDPE resin and
• To provide information about the environmental burdens associated with the production of LLDPE resin. The LCA results for LLDPE production can be used as a benchmark for evaluating future updated LLDPE results for North America.
According to ISO 14040 and 14044 standards, a peer review is not required as no comparative assertions of competing materials or products are made in this study. This report is the property of ACC and may be used by the trade association or members or the general public at ACC’s discretion.
FUNCTIONAL UNIT
The function of LLDPE resin is its forming into various products, for example, plastic bags and stretch wrap. As the study boundary concludes at the LLDPE resin, a mass functional unit has been chosen. Results for this analysis are shown on a basis of both 1,000 pounds and 1,000 kilograms of LLDPE produced.
SCOPE AND BOUNDARIES
This LCA quantifies energy and resource use, water consumption, solid waste, and environmental impacts for the following steps in the life cycle of the LLDPE resin manufacture:
• Raw material extraction (e.g., extraction of petroleum and natural gas as feedstocks) through olefins production, and incoming transportation for each process, and
• LLDPE resin manufacture, including incoming transportation for each material.
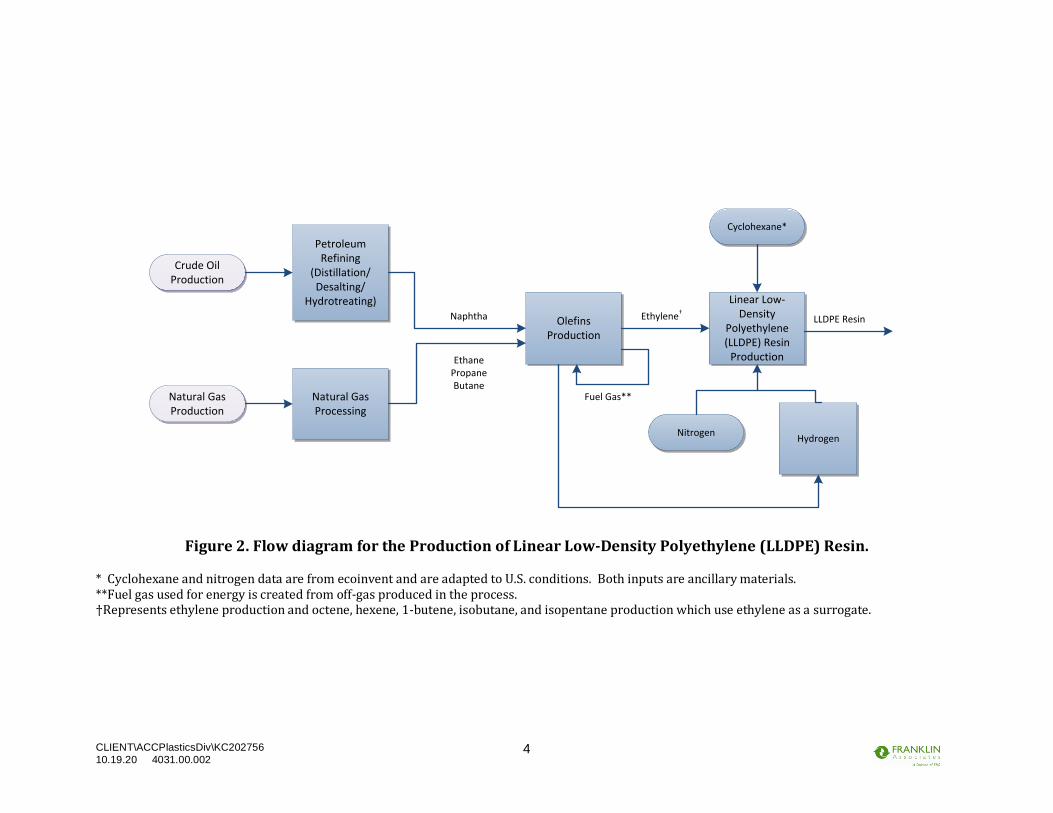
This report presents LCI results, as well as LCIA results, for the production of LLDPE resin manufacture. Figure 2 presents the flow diagram for the production of LLDPE resin. A unit process description and tables for each box shown in the flow diagram can be found in the attached appendix or in the olefins report previously released.
CLIENT\ACCPlasticsDiv\KC202756
10.19.20 4031.00.002 4
Crude Oil Production
Natural Gas Production
Petroleum Refining
(Distillation/Desalting/
Hydrotreating)
Natural Gas Processing
Olefins Production
Linear Low-Density
Polyethylene (LLDPE) Resin
Production
Ethylene†
Nitrogen
LLDPE Resin
Fuel Gas**
Naphtha
EthanePropaneButane
Hydrogen
Cyclohexane*
Figure 2. Flow diagram for the Production of Linear Low-Density Polyethylene (LLDPE) Resin. * Cyclohexane and nitrogen data are from ecoinvent and are adapted to U.S. conditions. Both inputs are ancillary materials. **Fuel gas used for energy is created from off-gas produced in the process. †Represents ethylene production and octene, hexene, 1-butene, isobutane, and isopentane production which use ethylene as a surrogate.

CLIENT\ACCPlasticsDiv\KC202756
10.19.20 4031.00.002 5
Technological Scope – Low Pressure Reactor Technologies The LLDPE resin is commonly polymerized in low pressure reactors. LLDPE is most commonly manufactured by either a solution process or a gas phase process but may also be produced using the slurry loop process. All three types of reactors were used by data providers with the largest portion of LLDPE created using the solution process. Normally a Phillips, Ziegler-Natta and/or metallocene catalysts are required during these technologies. These catalysts were not included after creating a sensitivity analysis and reviewing the results, which were all less than 1 percent of the LCA categories. The gas-phase reactor is able to produce both HDPE and LLDPE in the same reactor and is the leading technology for new plants since the 1980s.3 This is usually done in a fluidized bed reactor. Here a gas stream containing monomer recycles through the bed of polymer. Catalyst activators, comonomers, and hydrogen are fed through the bed. The reaction temperatures range from 70 to 115 C and at a pressure of 15 to 30 atm.4 Polymer is discharged occasionally into a tank system to separate gas from solid. In the solution reactor, the catalyst and monomers are dissolved in a solvent. The reaction temperatures range from 160 to 220 C and at a pressure ranging from 500 to 5000 psig5, which keeps the polymer dissolved. The liquid polymer is removed and the solvent is recycled. The slurry loop reactor is a continuous stirred-tank reactor. In this technology, the slurry includes undissolved polymer as well as diluent, ethylene, comonomer, catalyst(s), and hydrogen. These components are continuously supplied through the loop. Some of the slurry, containing high amounts of solid, are discharged and the solids are separated while the remaining fluid is recycled back into the reactor. Chrome, Ziegler-Natta, and metallocene catalysts can be used in this technology. Temporal and Geographic Scope For the LLDPE resin primary data, companies were requested to provide data for the year 2015, the most recent full year of LLDPE resin production prior to the project initiation date. Companies providing data were given the option to collect data from the year preceding or following 2015 if either year would reflect more typical production conditions. Three companies provided data for the year 2015, and one company provided data for the year 2016. After reviewing individual company data in comparison to the average, each
3 Chatterjee, Ananda, and Mark A. Spalding (Eds.) (2003). Handbook of Industrial Polyethylene and Technology. Wiley. 4 Ibid. 5 Malpass, Dennis B. (2010). Introduction to Industrial Polyethylene: Properties, Catalysts, Processes. Scrivener
Publishing LLC.

CLIENT\ACCPlasticsDiv\KC202756
10.19.20 4031.00.002 6
manufacturer verified data from 2015-2016 was representative of an average year for LLDPE resin production at their company. The geographic scope of the analysis is the manufacture of LLDPE resin in North America. All LLDPE resin data collected were from plants in the United States and Canada and modeled using North American databases such as the U.S. LCI database and Franklin Associates’ private database. The U.S. electricity grid from 2016 was taken from information in Emissions & Generation Resource Integrated Database (eGRID) 2016 database. Exclusions from the Scope The following are not included in the study:
• Miscellaneous materials and additives. Selected materials such as catalysts, pigments, ancillary materials, or other additives which total less than one percent by weight of the net process inputs are typically not included in assessments. Omitting miscellaneous materials and additives keeps the scope of the study focused. It is possible that production of some substances used in small amounts may be energy and resource intensive or may release toxic emissions; however, the impacts would have to be very large in proportion to their mass in order to significantly affect overall results and conclusions. For this study, no use of resource-intensive or high-toxicity chemicals or additives was identified. Therefore, the results for the resin are not expected to be understated by any significant amount due to substances that may be used in small amounts.
• Capital equipment, facilities, and infrastructure. The energy and wastes associated with the manufacture of buildings, roads, pipelines, motor vehicles, industrial machinery, etc. are not included. The energy and emissions associated with production of capital equipment, facilities, and infrastructure generally become negligible when averaged over the total output of product or service provided over their useful lifetimes.
• Space conditioning. The fuels and power consumed to heat, cool, and light manufacturing establishments are omitted from the calculations when possible. For manufacturing plants that carry out thermal processing or otherwise consume large amounts of energy, space conditioning energy is quite low compared to process energy. The data collection forms developed for this project specifically requested that the data provider either exclude energy use for space conditioning or indicate if the reported energy requirements included space conditioning. Energy use for space conditioning, lighting, and other overhead activities is not expected to make a significant contribution to total energy use for the resin system.
• Support personnel requirements. The energy and wastes associated with research and development, sales, and administrative personnel or related activities have not been included in this study. Similar to space conditioning, energy requirements and related emissions are assumed to be quite small for support personnel activities.
CLIENT\ACCPlasticsDiv\KC202756
10.19.20 4031.00.002 7
INVENTORY AND IMPACT ASSESSMENT RESULTS CATEGORIES
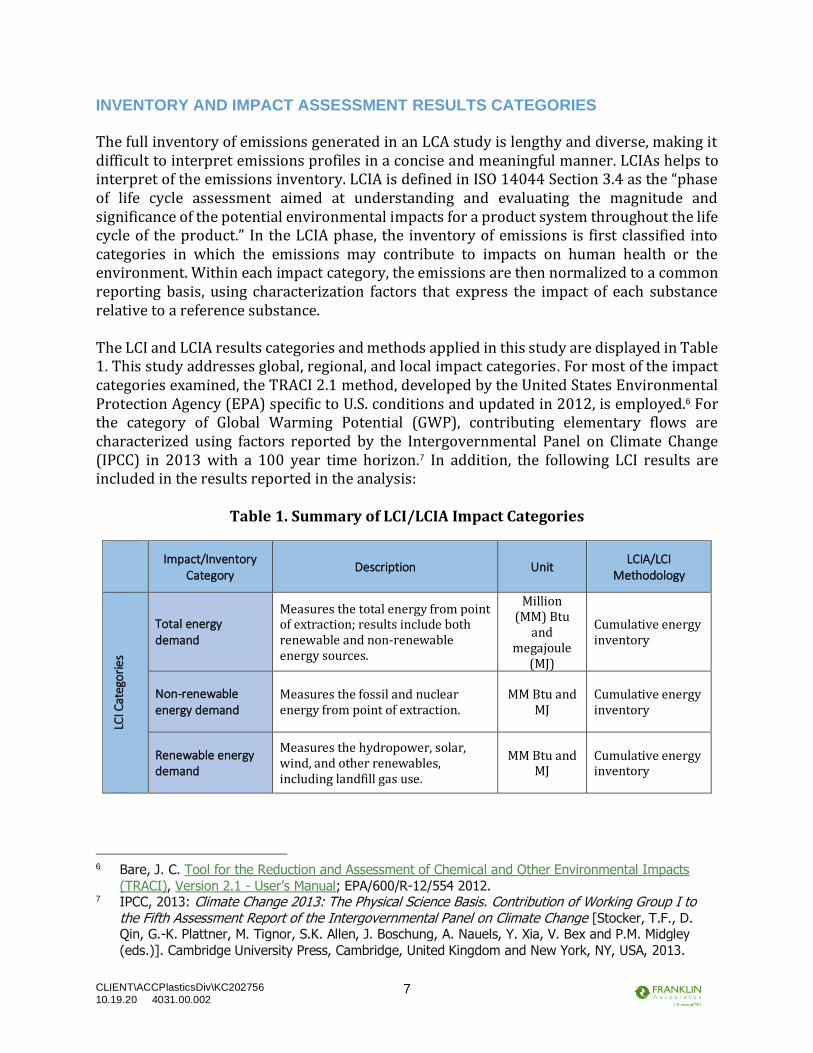
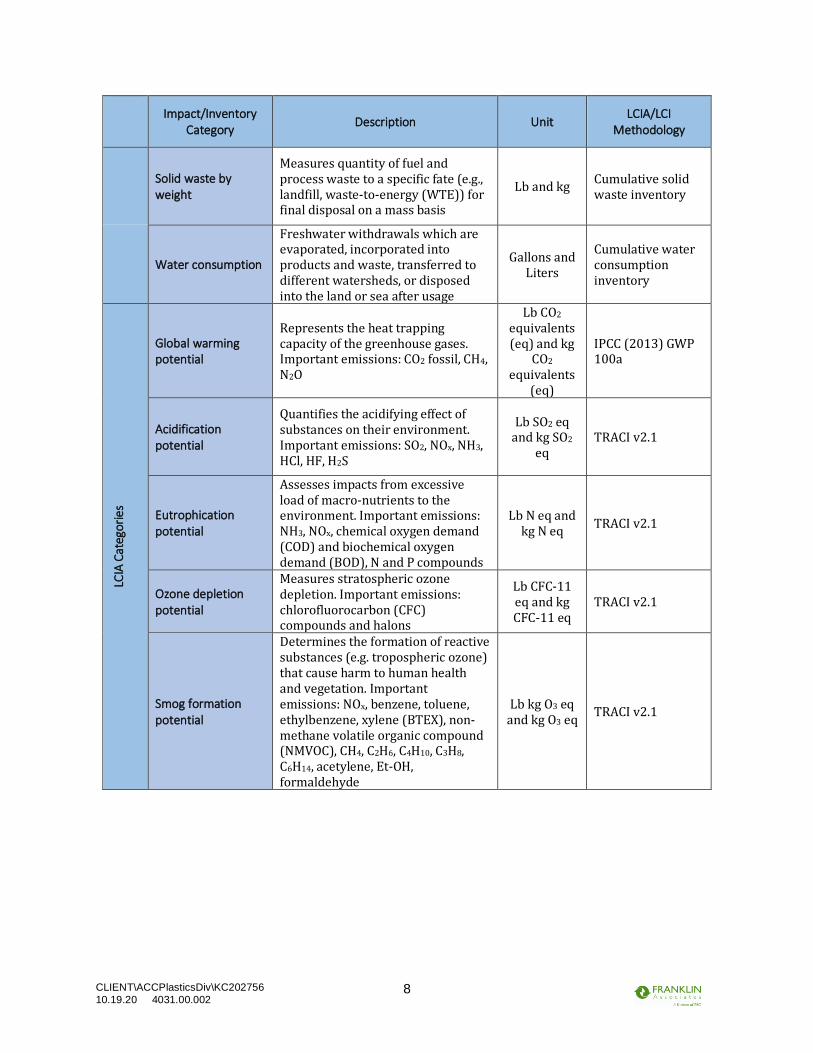
The full inventory of emissions generated in an LCA study is lengthy and diverse, making it difficult to interpret emissions profiles in a concise and meaningful manner. LCIAs helps to interpret of the emissions inventory. LCIA is defined in ISO 14044 Section 3.4 as the “phase of life cycle assessment aimed at understanding and evaluating the magnitude and significance of the potential environmental impacts for a product system throughout the life cycle of the product.” In the LCIA phase, the inventory of emissions is first classified into categories in which the emissions may contribute to impacts on human health or the environment. Within each impact category, the emissions are then normalized to a common reporting basis, using characterization factors that express the impact of each substance relative to a reference substance. The LCI and LCIA results categories and methods applied in this study are displayed in Table 1. This study addresses global, regional, and local impact categories. For most of the impact categories examined, the TRACI 2.1 method, developed by the United States Environmental Protection Agency (EPA) specific to U.S. conditions and updated in 2012, is employed.6 For the category of Global Warming Potential (GWP), contributing elementary flows are characterized using factors reported by the Intergovernmental Panel on Climate Change (IPCC) in 2013 with a 100 year time horizon.7 In addition, the following LCI results are included in the results reported in the analysis:
Table 1. Summary of LCI/LCIA Impact Categories
Impact/Inventory
Category Description Unit
LCIA/LCI Methodology
LCI C
ateg
ori
es
Total energy demand
Measures the total energy from point of extraction; results include both renewable and non-renewable energy sources.
Million (MM) Btu
and megajoule
(MJ)
Cumulative energy inventory
Non-renewable energy demand
Measures the fossil and nuclear energy from point of extraction.
MM Btu and MJ
Cumulative energy inventory
Renewable energy demand
Measures the hydropower, solar, wind, and other renewables, including landfill gas use.
MM Btu and MJ
Cumulative energy inventory
6 Bare, J. C. Tool for the Reduction and Assessment of Chemical and Other Environmental Impacts
(TRACI), Version 2.1 - User’s Manual; EPA/600/R-12/554 2012. 7 IPCC, 2013: Climate Change 2013: The Physical Science Basis. Contribution of Working Group I to
the Fifth Assessment Report of the Intergovernmental Panel on Climate Change [Stocker, T.F., D. Qin, G.-K. Plattner, M. Tignor, S.K. Allen, J. Boschung, A. Nauels, Y. Xia, V. Bex and P.M. Midgley
(eds.)]. Cambridge University Press, Cambridge, United Kingdom and New York, NY, USA, 2013.
CLIENT\ACCPlasticsDiv\KC202756
10.19.20 4031.00.002 8
Impact/Inventory
Category Description Unit
LCIA/LCI Methodology
Solid waste by weight
Measures quantity of fuel and process waste to a specific fate (e.g., landfill, waste-to-energy (WTE)) for final disposal on a mass basis
Lb and kg Cumulative solid waste inventory
Water consumption
Freshwater withdrawals which are evaporated, incorporated into products and waste, transferred to different watersheds, or disposed into the land or sea after usage
Gallons and Liters
Cumulative water consumption inventory
LCIA
Cat
egor
ies
Global warming potential
Represents the heat trapping capacity of the greenhouse gases. Important emissions: CO2 fossil, CH4, N2O
Lb CO2 equivalents (eq) and kg
CO2 equivalents
(eq)
IPCC (2013) GWP 100a
Acidification potential
Quantifies the acidifying effect of substances on their environment. Important emissions: SO2, NOx, NH3, HCl, HF, H2S
Lb SO2 eq and kg SO2
eq TRACI v2.1
Eutrophication potential
Assesses impacts from excessive load of macro-nutrients to the environment. Important emissions: NH3, NOx, chemical oxygen demand (COD) and biochemical oxygen demand (BOD), N and P compounds
Lb N eq and kg N eq
TRACI v2.1
Ozone depletion potential
Measures stratospheric ozone depletion. Important emissions: chlorofluorocarbon (CFC) compounds and halons
Lb CFC-11 eq and kg CFC-11 eq
TRACI v2.1
Smog formation potential
Determines the formation of reactive substances (e.g. tropospheric ozone) that cause harm to human health and vegetation. Important emissions: NOx, benzene, toluene, ethylbenzene, xylene (BTEX), non-methane volatile organic compound (NMVOC), CH4, C2H6, C4H10, C3H8, C6H14, acetylene, Et-OH, formaldehyde
Lb kg O3 eq and kg O3 eq
TRACI v2.1

CLIENT\ACCPlasticsDiv\KC202756
10.19.20 4031.00.002 9
• Energy demand: this method is a cumulative inventory of all forms of energy used for processing energy, transportation energy, and feedstock energy. This analysis reports both total energy demand and non-renewable energy demand. Renewable and non-renewable energy demand are reported separately to assess consumption of fuel resources that can be depleted, while total energy demand is used as an indicator of overall consumption of resources with energy value. Energy is also categorized by individual fuel types, as well as by process/fuel vs. feedstock energy.
• Total solid waste is assessed as a sum of the inventory values associated with this category. This category is also broken into hazardous and non-hazardous wastes and their end-of-life (e.g. incineration, waste-to-energy, or landfill).
• Water consumption is assessed as a sum of the inventory values associated with this category and does not include any assessment of water scarcity issues.
DATA SOURCES The purpose of this study is to develop a life cycle profile for LLDPE resin using the most recent data available for each process. A weighted average was calculated for the LLDPE resin data (production for the year 2015-2016) collected for this analysis. The ethylene data was also calculated from an average of primary datasets for 2015. Secondary data was researched in 2017 for crude oil extraction and refining and natural gas production and processing. All included processes are shown in Figure 2. LCI data for the production of LLDPE resin were collected from four producers (six plants) in North America –in the United States and Canada. All companies provided data for the years 2015-2016. A weighted average was calculated from the data collected and used to develop the LCA model. The captured LLDPE resin production amount is approximately 33 percent8 of the LLDPE resin production in the U.S. in 2015. Only small amounts of off-spec product and chemical isomers are coproducts of LLDPE resin production, and a mass basis was used to allocate the credit for the coproducts. For octene, hexene, and butene (comonomers used), ethylene was used as a surrogate dataset. LCI data for the production of olefins, including ethylene, were collected from three producers (ten plants) in North America – in the United States and Canada. All companies provided data for the year 2015. A weighted average was calculated from the data collected and used to develop the LCA model. Propylene is a coproduct of ethylene production, and a mass basis was used to allocate the environmental burdens among these coproducts. The data for the remaining materials (natural gas, cyclohexane, and nitrogen) used to produce LLDPE resin are from secondary sources. The LLDPE process description and LCI data are provided in the Appendix at the end of this report. Other unit processes can be found in the separate report, Cradle-to-Gate Life Cycle Analysis of Olefins.
8 Franklin Associates calculations using 2015 resin production amounts from
https://www.statista.com/statistics/975585/us-lldpe-production-volume/.
CLIENT\ACCPlasticsDiv\KC202756
10.19.20 4031.00.002 10
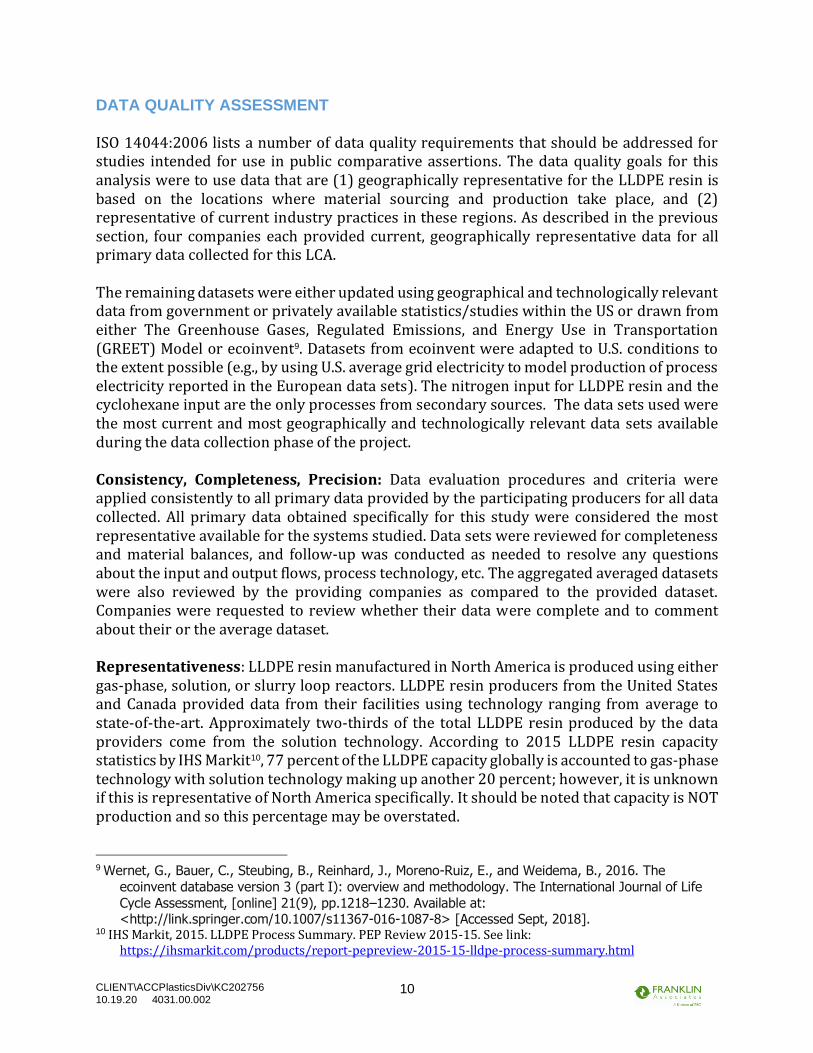
DATA QUALITY ASSESSMENT ISO 14044:2006 lists a number of data quality requirements that should be addressed for studies intended for use in public comparative assertions. The data quality goals for this analysis were to use data that are (1) geographically representative for the LLDPE resin is based on the locations where material sourcing and production take place, and (2) representative of current industry practices in these regions. As described in the previous section, four companies each provided current, geographically representative data for all primary data collected for this LCA. The remaining datasets were either updated using geographical and technologically relevant data from government or privately available statistics/studies within the US or drawn from either The Greenhouse Gases, Regulated Emissions, and Energy Use in Transportation (GREET) Model or ecoinvent9. Datasets from ecoinvent were adapted to U.S. conditions to the extent possible (e.g., by using U.S. average grid electricity to model production of process electricity reported in the European data sets). The nitrogen input for LLDPE resin and the cyclohexane input are the only processes from secondary sources. The data sets used were the most current and most geographically and technologically relevant data sets available during the data collection phase of the project. Consistency, Completeness, Precision: Data evaluation procedures and criteria were applied consistently to all primary data provided by the participating producers for all data collected. All primary data obtained specifically for this study were considered the most representative available for the systems studied. Data sets were reviewed for completeness and material balances, and follow-up was conducted as needed to resolve any questions about the input and output flows, process technology, etc. The aggregated averaged datasets were also reviewed by the providing companies as compared to the provided dataset. Companies were requested to review whether their data were complete and to comment about their or the average dataset. Representativeness: LLDPE resin manufactured in North America is produced using either gas-phase, solution, or slurry loop reactors. LLDPE resin producers from the United States and Canada provided data from their facilities using technology ranging from average to state-of-the-art. Approximately two-thirds of the total LLDPE resin produced by the data providers come from the solution technology. According to 2015 LLDPE resin capacity statistics by IHS Markit10, 77 percent of the LLDPE capacity globally is accounted to gas-phase technology with solution technology making up another 20 percent; however, it is unknown if this is representative of North America specifically. It should be noted that capacity is NOT production and so this percentage may be overstated.
9 Wernet, G., Bauer, C., Steubing, B., Reinhard, J., Moreno-Ruiz, E., and Weidema, B., 2016. The
ecoinvent database version 3 (part I): overview and methodology. The International Journal of Life Cycle Assessment, [online] 21(9), pp.1218–1230. Available at: <http://link.springer.com/10.1007/s11367-016-1087-8> [Accessed Sept, 2018].
10 IHS Markit, 2015. LLDPE Process Summary. PEP Review 2015-15. See link: https://ihsmarkit.com/products/report-pepreview-2015-15-lldpe-process-summary.html
CLIENT\ACCPlasticsDiv\KC202756
10.19.20 4031.00.002 11
Primary data were collected from olefin manufacturers from the year 2015 and 2016. Companies providing data were given the option to collect data from the year preceding or following 2015 if either year would reflect more typical production conditions. After reviewing individual company data in comparison to the average, each manufacturer verified data from 2015 or 2016 was a representative year for olefin production in North America. LCI data from the sources of input materials specific to each company providing data was not available for this analysis. Average U.S. statistics were used were used for refined petroleum products and processed natural gas to develop the average olefins unit process data. As impacts from crude oil and natural gas may vary depending on transportation requirements some variability in data and impact on LCA results should be expected. The average LLDPE resin unit process data was based on the best available data at the time the study was conducted. As in all LCA studies, the ability to develop a representative average is determined by the number of companies willing to participate. Data from this analysis was used to develop the most representative average for LLDPE resin production in 2015-2016 as was possible. Reproducibility: To maximize transparency and reproducibility, the report identifies specific data sources, assumptions, and approaches used in the analysis to the extent possible; however, reproducibility of study results is limited to some extent by the need to protect certain data sets that were judged to be high quality and representative data sets for modeling purposes but could not be shown due to confidentiality. Uncertainty: Uncertainty issues and uncertainty thresholds applied in interpreting study results are described in the following section. DATA ACCURACY AND UNCERTAINTY In LCA studies with thousands of numeric data points used in the calculations, the accuracy of the data and how it affects conclusions is truly a complex subject, and one that does not lend itself to standard error analysis techniques. Techniques such as Monte Carlo analysis can be used to assess study uncertainty, but the greatest challenge is the lack of uncertainty data or probability distributions for key parameters, which are often only available as single point estimates. However, steps are taken to ensure the reliability of data and results, as previously described. The accuracy of the environmental results depends on the accuracy of the numbers that are combined to arrive at that conclusion. For some processes, the data sets are based on actual plant data reported by plant personnel, while other data sets may be based on engineering estimates or secondary data sources. Primary data collected from actual facilities are considered the best available data for representing industry operations. In this study, primary data were used to model the LLDPE resin and steam cracking of the olefins and hydrogen. All data received were carefully evaluated before compiling the production-

CLIENT\ACCPlasticsDiv\KC202756
10.19.20 4031.00.002 12
weighted average data sets used to generate results. Supporting background data were drawn from credible, widely used databases including the US LCI database, GREET, and ecoinvent. METHOD
The LCA has been conducted following internationally accepted standards for LCA as outlined in the ISO 14040 and 14044 standards, which provide guidance and requirements for conducting LCA studies. However, for some specific aspects of LCA, the ISO standards have some flexibility and allow for choices to be made. The following sections describe the approach to each issue used in this study. Many of these issues are specific to the olefins produced at the steam crackers. Raw Materials Use for Internal Energy in Steam Crackers Some of the raw material inputs to the steam cracker create gases that are combusted to provide energy for the steam cracker, decreasing the amount of purchased energy required for the reaction. Data providers listed this energy as fuel gas or off-gas and, in many cases, supplied the heating value of this gas. Using this information, Franklin Associates calculated the amount of raw material combusted within the steam cracker to produce this utilized energy source. This internally-created energy is included in the analysis by including the production of the raw materials combusted to produce the energy as well as the energy amount attributed to the combustion of those raw materials. Unlike the raw materials that become part of the product output mass, no material feedstock energy is assigned to the raw materials inputs that are combusted within the process. Coproduct Allocation An important feature of life cycle inventories is that the quantification of inputs and outputs are related to a specific amount of useful output from a process. However, it is sometimes difficult or impossible to identify which inputs and outputs are associated with individual products of interest resulting from a single process (or process sequence) that produces multiple useful products. The practice of allocating inputs and outputs among multiple products from a process is often referred to as coproduct allocation. Co-product credit is done out of necessity when raw materials and emissions cannot be directly attributed to one of several product outputs from a system. It has long been recognized that the practice of allocating the environmental burdens among the coproducts is less desirable than being able to identify which inputs lead to specific outputs. In this study, co-product allocations are necessary because of multiple useful outputs from the “upstream” chemical process involved in producing LLDPE resin and olefins. Franklin Associates follows the guidelines for allocating the environmental burdens among the coproducts as shown in the ISO 14044:2006 standard on life cycle assessment

CLIENT\ACCPlasticsDiv\KC202756
10.19.20 4031.00.002 13
requirements and guidelines11. In this standard, the preferred hierarchy for handling allocation is (1) avoid allocation where possible, (2) allocate flows based on direct physical relationships to product outputs, (3) use some other relationship between elementary flows and product output. No single allocation method is suitable for every scenario. As described in ISO 14044 section 4.3.4.2, when allocation cannot be avoided, the preferred partitioning approach should reflect the underlying physical relationships between the different products or functions. Material Coproducts Some processes lend themselves to physical allocation because they have physical parameters that provide a good representation of the environmental burdens of each co-product. Examples of various allocation methods are mass, stoichiometric, elemental, reaction enthalpy, and economic allocation. Simple mass and enthalpy allocation have been chosen as the common forms of allocation in this analysis. However, these allocation methods were not chosen as a default choice but made on a case by case basis after due consideration of the chemistry and basis for production. Material coproducts were created in all the intermediate chemical process steps collected for this analysis, as well as the primary LLDPE resin production. The material coproducts from ethylene production for all plants included propylene, pyrolysis gasoline, butadiene, ethane, hydrogen, acetylene, crude benzene, and small amounts of various heavy end products. The material coproducts from LLDPE resin production include off-spec product and chemical isomers
A portion of the inputs and outputs calculated for the coproducts were removed from the total inputs and outputs, so that the remaining inputs and outputs only represented the main product in each unit process. The ratio of the mass of the coproduct over the total mass output was removed from the total inputs and outputs of the process, and the remaining inputs and outputs are allocated over the material products (Equation 1).
[𝐼𝑂] × (1 − 𝑀𝐶𝑃
𝑀𝑇𝑜𝑡𝑎𝑙) = [𝐼𝑂] 𝑎𝑡𝑡𝑟𝑖𝑏𝑢𝑡𝑒𝑑 𝑡𝑜 𝑟𝑒𝑚𝑎𝑖𝑛𝑖𝑛𝑔 𝑝𝑟𝑜𝑑𝑢𝑐𝑡𝑠 (Equation 1)
where IO = Input/Output Matrix to produce all products/coproducts MCP = Mass of Coproduct MTotal = Mass of all Products and Coproducts Energy Coproducts Exported from System Boundaries Some of the unit processes produce energy either as a fuel coproduct or as steam created from the process that is sent to another plant for use. To the extent possible, system expansion to avoid allocation was used as the preferred approach in the ISO 14044:2006
11 International Standards Organization. ISO 14044:2006, Environmental management – Life cycle
assessment – Requirements and guidelines.

CLIENT\ACCPlasticsDiv\KC202756
10.19.20 4031.00.002 14
standard. Fuels or steam exported from the boundaries of the system would replace purchased fuels for another process outside the system. System expansion credits were given for avoiding the energy-equivalent quantity of fuel production and combustion displaced by the exported coproduct energy. Electricity Grid Fuel Profile Electricity production and distribution systems in North America are interlinked. Users of electricity, in general, cannot specify the fuels used to produce their share of the electric power grid. Data for this analysis was collected mostly from plants in the United States with one LLDPE plant in Canada. The U.S. average fuel consumption by electrical utilities was used for the electricity within this analysis. This electricity data set uses the Emissions & Generation Resource Integrated Database (eGRID) 2016 database 12. Electricity generated on-site at a manufacturing facility is represented in the process data by the fuels used to produce it. If a portion of on-site generated electricity is sold to the electricity grid, credits for sold on-site electricity are accounted for in the calculations for the fuel mix. Electricity/Heat Cogeneration Cogeneration is the use of steam for generation of both electricity and heat. The most common configuration is to generate high temperature steam in a cogeneration boiler and use that steam to generate electricity. The steam exiting the electricity turbines is then used as a process heat source for other operations. Significant energy savings occur because in a conventional operation, the steam exiting the electricity generation process is condensed, and the heat is dissipated to the environment. For LCI purposes, the fuel consumed and the emissions generated by the cogeneration boiler need to be allocated to the two energy-consuming processes: electricity generation and subsequent process steam. An energy basis was used for allocation in this analysis. In order to allocate fuel consumption and environmental emissions to both electricity and steam generation, the share of the two forms of energy (electrical and thermal) produced must be correlated to the quantity of fuel consumed by the boiler. Data on the quantity of fuel consumed and the associated environmental emissions from the combustion of the fuel, the amount of electricity generated, and the thermal output of the steam exiting electricity generation must be known in order to allocate fuel consumption and environmental emissions accordingly. These three types of data are discussed below.
1. Fuels consumed and emissions generated by the boiler: The majority of data providers for this study reported natural gas as the fuel used for cogeneration. According to 2016 industry statistics, natural gas accounted for
12 Online database found at: https://www.epa.gov/energy/emissions-generation-resource-integrated-
database-egrid
CLIENT\ACCPlasticsDiv\KC202756
10.19.20 4031.00.002 15
75 percent of industrial cogeneration, while coal and biomass accounted for the largest portion of the remaining fuels used13.
2. Kilowatt-Hours of Electricity Generated: In this analysis, the data providers
reported the kilowatt-hours of electricity from cogeneration. The Btu of fuel required for this electricity generation was calculated by multiplying the kilowatt-hours of electricity by 6,826 Btu/kWh (which utilizes a thermal to electrical conversion efficiency of 50 percent). This Btu value was then divided by the Btu value of fuel consumed in the cogeneration boiler to determine the electricity allocation factor.
The 50 percent conversion efficiency was an estimate after reviewing EIA fuel consumption and electricity net generation data from cogeneration plants in 2016.14 The straight average conversion efficiency for 2016 for electricity production in cogeneration plants within this database is a little more than 55 percent; however, the range of efficiency calculated per individual cogeneration plant was 23% to 87%. The 50 percent estimate of conversion efficiency was used previously in the 2011 database and so was estimated for continued use within this analysis, due to the variability of the individual cogeneration plants. Unit process data for cogeneration of electricity is provided by kWh, so that a change of efficiency could easily be applied during modeling.
3. Thermal Output of Steam Exiting Electricity Generation: In this analysis,
the data providers stated the pounds and pressure of steam from cogeneration. The thermal output (in Btu) of this steam was calculated from enthalpy tables (in most cases steam ranged from 1,000 to 1,200 Btu/lb). An efficiency of 80 percent was used for the industrial boiler to calculate the amount of fuel used. This Btu value was then divided by the Btu value of fuel consumed in the cogeneration boiler to determine the steam allocation factor. The 80 percent efficiency used is common for a conventional natural gas boiler, which should not change when considering the steam portion of the cogeneration system. Pounds of steam, temperature and pressure were provided by participating plants. Steam tables were used to calculate energy amounts, which was divided by the efficiency and converted to natural gas amounts in cubic feet.
13 U.S. Department of Energy. Combined Heat and Power (CHP) Technical Potential in the United States. March
2016. 14 U.S. Department of Energy, The Energy Information Administration (EIA). EIA-923 Monthly Generation and
Fuel Consumption Time Series File, 2016 Final Revision

CLIENT\ACCPlasticsDiv\KC202756
10.19.20 4031.00.002 16
LIFE CYCLE INVENTORY AND IMPACT ASSESSMENT RESULTS This section presents baseline results for the following LCI and LCIA results for both 1,000 pounds and 1,000 kilograms of LLDPE:
Life cycle inventory results: • Cumulative energy demand • Non-renewable energy demand • Renewable energy demand • Total energy by fuel type • Solid waste by weight • Water consumption
Life cycle impact assessment results: • Global warming potential • Acidification potential • Eutrophication potential • Ozone depletion potential • Smog formation potential Throughout the results sections, the tables and figures break out system results into the following unit processes, for LLDPE: • Cradle-to-incoming materials – includes the raw materials through the production of
ethylene, cyclohexane, and hydrogen • LLDPE resin production – is the gate-to-gate LLDPE resin unit process and includes
nitrogen production for use at the plant and fuel production and combustion for the unit process.
Tables and figures are provided for LLDPE in each inventory and impact category section in this report. The phrases “cradle-to- “and “system” are defined as including all of the raw and intermediate chemicals required for the production of the chemical/resin stated in the term (e.g. cradle-to-LLDPE and LLDPE system are interchangeable). The phrase “gate-to-gate” is defined as including only the onsite process/fuels and no upstream or downstream material inputs and emissions.
ENERGY DEMAND
Cumulative Energy Demand
Cumulative energy demand results include all renewable and non-renewable energy sources used for process and transportation energy, as well as material feedstock energy. Process energy includes direct use of fuels, including the use of fossil fuels, hydropower, nuclear, wind, solar, and other energy sources to generate electricity used by processes. Fuel energy is the energy necessary to create and transport the fuels to the processes. The feedstock

CLIENT\ACCPlasticsDiv\KC202756
10.19.20 4031.00.002 17
energy is the energy content of the resources removed from nature and used as material feedstocks for the olefins production (e.g., the energy content of oil and gas used as material feedstocks), which is the main input to LLDPE resin. The average total energy required to produce LLDPE is 31.3 million Btu per 1,000 pounds of LLDPE resin or 72.8 GJ per 1,000 kilograms of LLDPE resin. Table 2 shows total energy demand for the life cycle of LLDPE resin production. The LLDPE resin production energy has been split out from the energy required for incoming materials, including the production of olefins/hydrogen, cyclohexane, natural gas production and processing, and petroleum extraction and refining. Only 5.0 percent of the total energy is required to produce the LLDPE resin itself. The remaining 95 percent is used to create the incoming materials and their raw materials.
Table 2. Total Energy Demand for LLDPE Resin
Total Energy
Non-
Renewable
Energy
Renewable
Energy
MM Btu MM Btu MM Btu
Cradle-to-Incoming Materials 29.7 29.7 0.032
Virgin LLDPE Resin Production 1.57 1.52 0.049
31.3 31.2 0.081
Total Energy
Non-
Renewable
Energy
Renewable
Energy
GJ GJ GJ
Cradle-to-Incoming Materials 69.2 69.1 0.075
Virgin LLDPE Resin Production 3.65 3.54 0.11
72.8 72.6 0.19
Total Energy
Non-
Renewable
Energy
Renewable
Energy
% % %
Cradle-to-Incoming Materials 95.0% 94.9% 0.1%
Virgin LLDPE Resin Production 5.0% 4.9% 0.2%
100% 99.7% 0.3%
Total
Total
Total
Basis: 1,000 pounds
Basis: 1,000 kilograms
Percentage
CLIENT\ACCPlasticsDiv\KC202756
10.19.20 4031.00.002 18
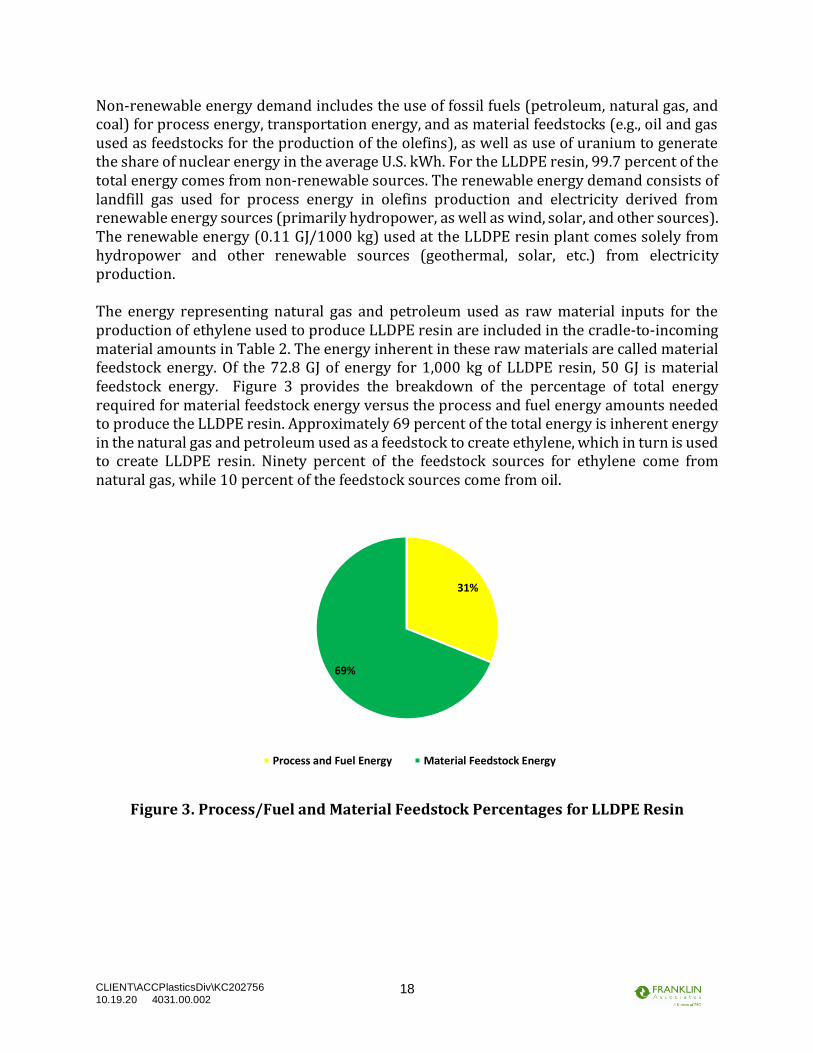
Non-renewable energy demand includes the use of fossil fuels (petroleum, natural gas, and coal) for process energy, transportation energy, and as material feedstocks (e.g., oil and gas used as feedstocks for the production of the olefins), as well as use of uranium to generate the share of nuclear energy in the average U.S. kWh. For the LLDPE resin, 99.7 percent of the total energy comes from non-renewable sources. The renewable energy demand consists of landfill gas used for process energy in olefins production and electricity derived from renewable energy sources (primarily hydropower, as well as wind, solar, and other sources). The renewable energy (0.11 GJ/1000 kg) used at the LLDPE resin plant comes solely from hydropower and other renewable sources (geothermal, solar, etc.) from electricity production. The energy representing natural gas and petroleum used as raw material inputs for the production of ethylene used to produce LLDPE resin are included in the cradle-to-incoming material amounts in Table 2. The energy inherent in these raw materials are called material feedstock energy. Of the 72.8 GJ of energy for 1,000 kg of LLDPE resin, 50 GJ is material feedstock energy. Figure 3 provides the breakdown of the percentage of total energy required for material feedstock energy versus the process and fuel energy amounts needed to produce the LLDPE resin. Approximately 69 percent of the total energy is inherent energy in the natural gas and petroleum used as a feedstock to create ethylene, which in turn is used to create LLDPE resin. Ninety percent of the feedstock sources for ethylene come from natural gas, while 10 percent of the feedstock sources come from oil.
Figure 3. Process/Fuel and Material Feedstock Percentages for LLDPE Resin
31%
69%
Process and Fuel Energy Material Feedstock Energy
CLIENT\ACCPlasticsDiv\KC202756
10.19.20 4031.00.002 19
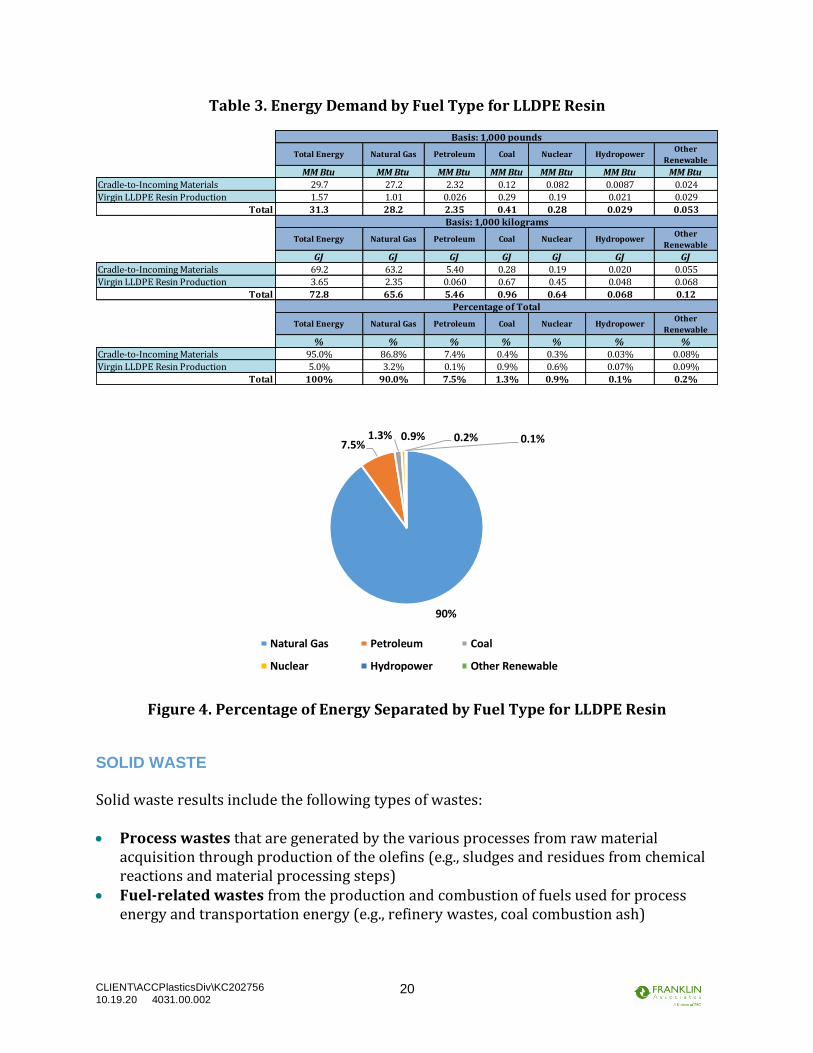
Energy Demand by Fuel Type The total energy demand by fuel type for LLDPE is shown in Table 3 and the percentage mix is shown in Figure 4. Natural gas and petroleum together make up over 97 percent of the total energy used. As shown in Figure 3, this is partially due to the material feedstock energy used to create the olefins, which is the main input to LLDPE resin. These material feedstock fuels are part of the energy shown in the natural gas and petroleum split out in the following table and figure. The gate-to-gate production energy for LLDPE resin in the following table and figure represents the energy required for transportation of raw materials to LLDPE manufacturers, the energy required to produce the LLDPE resin, and the production of the fuels needed to manufacture the LLDPE.
Petroleum-based fuels (e.g. diesel fuel) are the dominant energy source for transportation. Natural gas, coal, and other fuel types, such as hydropower, nuclear and other (geothermal, wind, etc.) are used to generate purchased electricity. Other renewables include a small amount of landfill gas used for process energy in olefins production. Of the results for LLDPE resin production shown in Table 3 and Figure 4, 90 percent of the energy used (65.6 GJ/72.8 GJ) is from natural gas. At the LLDPE resin plant, nearly 66 percent of the energy used (2.35 GJ/3.65 GJ) comes from natural gas. Of that natural gas used at the LLDPE resin plant, approximately two-thirds is required to create electricity off-site, while one-third is combusted on-site. Petroleum comprises approximately 7.5 percent (5.46 GJ/72.8 GJ) of the fuel used for the LLDPE resin production system; much of this is material resource energy. Sixty percent of the petroleum for the LLDPE plant is combusted to create electricity, while a third used during transport of the incoming materials. The coal use shown is combusted for electricity use. The 2016 U.S. electricity grid is used for this study. In this grid, approximately 30 percent of the electricity production in the US uses coal as a fuel source, while a third of the grid comes from natural gas and 20 percent from uranium. The hydropower, nuclear, and other energy are all used to create electricity, with the exception of a small amount of landfill gas used in the olefins production shown within other renewables.
CLIENT\ACCPlasticsDiv\KC202756
10.19.20 4031.00.002 20
Table 3. Energy Demand by Fuel Type for LLDPE Resin
Figure 4. Percentage of Energy Separated by Fuel Type for LLDPE Resin
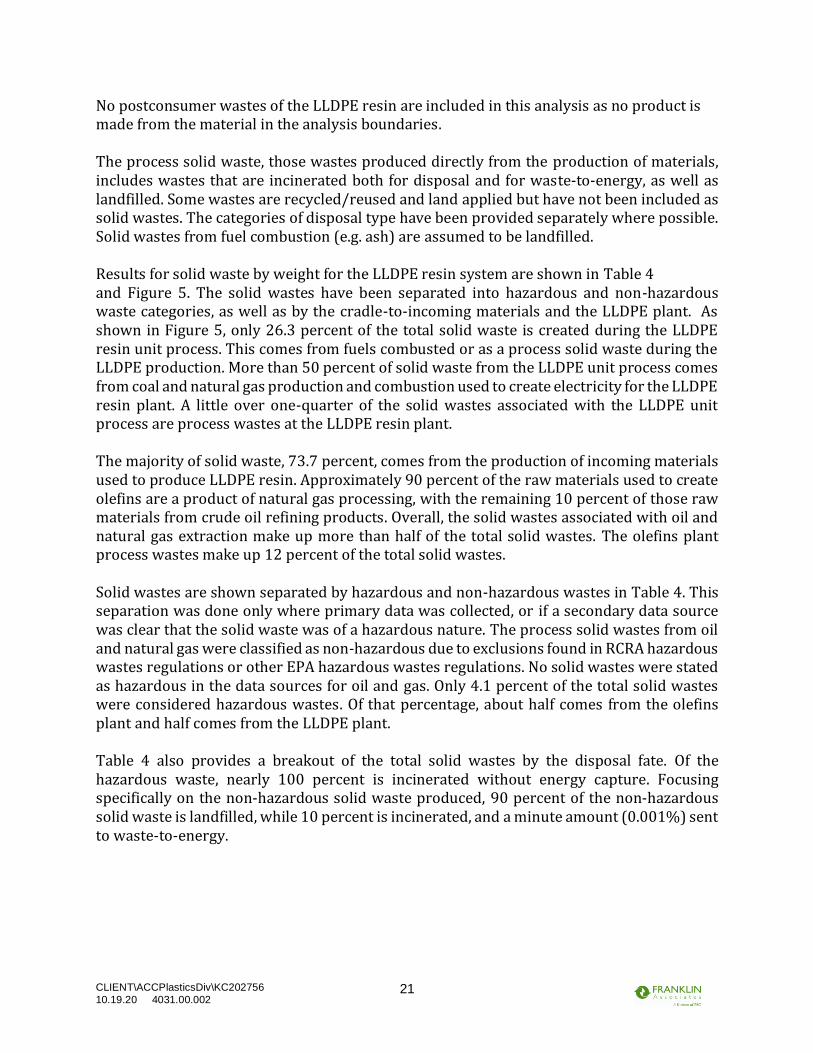
SOLID WASTE Solid waste results include the following types of wastes: • Process wastes that are generated by the various processes from raw material
acquisition through production of the olefins (e.g., sludges and residues from chemical reactions and material processing steps)
• Fuel-related wastes from the production and combustion of fuels used for process energy and transportation energy (e.g., refinery wastes, coal combustion ash)
Total Energy Natural Gas Petroleum Coal Nuclear HydropowerOther
Renewable
MM Btu MM Btu MM Btu MM Btu MM Btu MM Btu MM Btu
Cradle-to-Incoming Materials 29.7 27.2 2.32 0.12 0.082 0.0087 0.024
Virgin LLDPE Resin Production 1.57 1.01 0.026 0.29 0.19 0.021 0.029
31.3 28.2 2.35 0.41 0.28 0.029 0.053
Total Energy Natural Gas Petroleum Coal Nuclear HydropowerOther
Renewable
GJ GJ GJ GJ GJ GJ GJ
Cradle-to-Incoming Materials 69.2 63.2 5.40 0.28 0.19 0.020 0.055
Virgin LLDPE Resin Production 3.65 2.35 0.060 0.67 0.45 0.048 0.068
72.8 65.6 5.46 0.96 0.64 0.068 0.12
Total Energy Natural Gas Petroleum Coal Nuclear HydropowerOther
Renewable
% % % % % % %
Cradle-to-Incoming Materials 95.0% 86.8% 7.4% 0.4% 0.3% 0.03% 0.08%
Virgin LLDPE Resin Production 5.0% 3.2% 0.1% 0.9% 0.6% 0.07% 0.09%
100% 90.0% 7.5% 1.3% 0.9% 0.1% 0.2%
Total
Total
Total
Basis: 1,000 pounds
Basis: 1,000 kilograms
Percentage of Total
90%
7.5%1.3% 0.9% 0.1%0.2%
Natural Gas Petroleum Coal
Nuclear Hydropower Other Renewable
CLIENT\ACCPlasticsDiv\KC202756
10.19.20 4031.00.002 21
No postconsumer wastes of the LLDPE resin are included in this analysis as no product is made from the material in the analysis boundaries. The process solid waste, those wastes produced directly from the production of materials, includes wastes that are incinerated both for disposal and for waste-to-energy, as well as landfilled. Some wastes are recycled/reused and land applied but have not been included as solid wastes. The categories of disposal type have been provided separately where possible. Solid wastes from fuel combustion (e.g. ash) are assumed to be landfilled. Results for solid waste by weight for the LLDPE resin system are shown in Table 4 and Figure 5. The solid wastes have been separated into hazardous and non-hazardous waste categories, as well as by the cradle-to-incoming materials and the LLDPE plant. As shown in Figure 5, only 26.3 percent of the total solid waste is created during the LLDPE resin unit process. This comes from fuels combusted or as a process solid waste during the LLDPE production. More than 50 percent of solid waste from the LLDPE unit process comes from coal and natural gas production and combustion used to create electricity for the LLDPE resin plant. A little over one-quarter of the solid wastes associated with the LLDPE unit process are process wastes at the LLDPE resin plant. The majority of solid waste, 73.7 percent, comes from the production of incoming materials used to produce LLDPE resin. Approximately 90 percent of the raw materials used to create olefins are a product of natural gas processing, with the remaining 10 percent of those raw materials from crude oil refining products. Overall, the solid wastes associated with oil and natural gas extraction make up more than half of the total solid wastes. The olefins plant process wastes make up 12 percent of the total solid wastes. Solid wastes are shown separated by hazardous and non-hazardous wastes in Table 4. This separation was done only where primary data was collected, or if a secondary data source was clear that the solid waste was of a hazardous nature. The process solid wastes from oil and natural gas were classified as non-hazardous due to exclusions found in RCRA hazardous wastes regulations or other EPA hazardous wastes regulations. No solid wastes were stated as hazardous in the data sources for oil and gas. Only 4.1 percent of the total solid wastes were considered hazardous wastes. Of that percentage, about half comes from the olefins plant and half comes from the LLDPE plant. Table 4 also provides a breakout of the total solid wastes by the disposal fate. Of the hazardous waste, nearly 100 percent is incinerated without energy capture. Focusing specifically on the non-hazardous solid waste produced, 90 percent of the non-hazardous solid waste is landfilled, while 10 percent is incinerated, and a minute amount (0.001%) sent to waste-to-energy.

CLIENT\ACCPlasticsDiv\KC202756
10.19.20 4031.00.002 22
Table 4. Total Solid Wastes for LLDPE Resin
Figure 5. Percentage of Total Solid Wastes for LLDPE Resin System
WATER CONSUMPTION Consumptive use of water in this study includes freshwater that is withdrawn from a water source or watershed and not returned to that source. Consumptive water use includes water consumed in chemical reactions, water that is incorporated into a product or waste stream, water that becomes evaporative loss, and water that is discharged to a different watershed or water body than the one from which it was withdrawn. Water consumption results shown for each life cycle stage include process water consumption as well as water consumption associated with production of the electricity and fuels used in that stage. Electricity-related water consumption includes evaporative losses associated with thermal generation of
Total Solid Waste Waste-to-
EnergyIncineration Landfill
Hazardous
Waste Total
Waste-to-
EnergyIncineration Landfill
Non-Hazardous
Waste Total
lb lb lb lb lb lb lb lb lb
Cradle-to-Incoming Materials 48.4 0 1.40 0.0031 1.40 6.1E-04 6.00 41.0 47.0
Virgin LLDPE Resin Production 17.3 0 1.300 0.0007 1.30 2.4E-07 0.042 15.9 16.0
65.7 0 2.70 0.004 2.70 6.1E-04 6.04 57.0 63.0
Total Solid Waste Waste-to-
EnergyIncineration Landfill
Hazardous
Waste Total
Waste-to-
EnergyIncineration Landfill
Non-Hazardous
Waste Total
kg kg kg kg kg kg kg kg kg
Cradle-to-Incoming Materials 48.4 0 1.40 0.0031 1.40 6.1E-04 6.00 41.0 47.0
Virgin LLDPE Resin Production 17.3 0 1.300 0.0007 1.30 2.4E-07 0.042 15.9 16.0
65.7 0 2.70 0.004 2.70 6.1E-04 6.04 57.0 63.0
Total Solid WasteWaste-to-
EnergyIncineration Landfill
Hazardous
Waste Total
Waste-to-
EnergyIncineration Landfill
Non-Hazardous
Waste Total
% % % % % % % % %
Cradle-to-Incoming Materials 73.7% 0% 2.1% 0.005% 2.1% 0.001% 9.1% 62.4% 71.6%
Virgin LLDPE Resin Production 26.3% 0% 2.0% 0.001% 2.0% 0.000% 0.1% 24.2% 24.3%
100% 0% 4.1% 0.01% 4.1% 0.001% 9.2% 86.7% 95.9%
Total
Total
Total
Basis: 1,000 poundsHazardous Wastes Non-Hazardous Wastes
Hazardous Wastes Non-Hazardous Wastes
Basis: 1,000 kilogramsHazardous Wastes Non-Hazardous Wastes
Percentage of Total

CLIENT\ACCPlasticsDiv\KC202756
10.19.20 4031.00.002 23
electricity from fossil and nuclear fuels, as well as evaporative losses due to establishment of dams for hydropower. Water consumption results for LLDPE resin production are shown in Table 5 and Figure 6. The majority of consumption of water within the LLDPE resin is comes from the cradle-to-incoming materials (72 percent). When looking at the individual unit processes, about 47 percent of the total is consumed at the olefins plant. The primary water consumption data for olefins does include some plants that release water to a different watershed than the initial water source, which is considered consumption in the methodology used. The LLDPE resin average data also includes some plants that release water to a different watershed. The LLDPE resin plant water consumption amount and the water consumed during natural gas extraction and processing each comprise 17 percent of the total. Another large contributor for water consumption is the electricity used during all processes due to evaporative losses in the use of hydropower, which makes up approximately 14 percent of the total water consumption. The remaining water consumption comes from the refining of crude oil and production of other fuels used.
Table 5. Water Consumption for LLDPE Resin
Figure 6. Water Consumption for LLDPE Resin
Basis: 1,000 PoundsBasis: 1,000
kilograms
Percentage of
Total
Gallons Liters %
Cradle-to-Incoming Materials 639 5,330 72.2%
Virgin LLDPE Resin Production 246 2,053 27.8%
885 7,383 100%
Total Water Consumption
Total
CLIENT\ACCPlasticsDiv\KC202756
10.19.20 4031.00.002 24
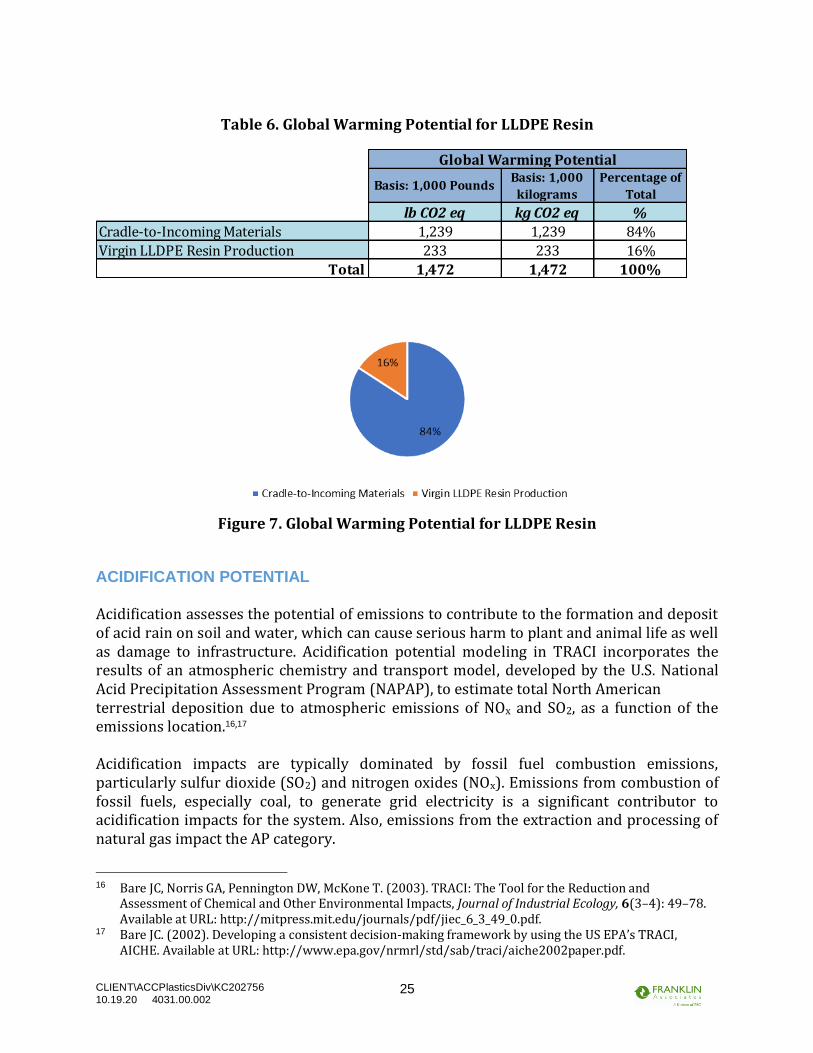
GLOBAL WARMING POTENTIAL The primary atmospheric emissions reported in this analysis that contribute over 99 percent of the total global warming potential for each system are fossil fuel-derived carbon dioxide, methane, and nitrous oxide. Other contributors include some HCFCs and CFCs, but these contribute less than 1 percent of the total shown. The main greenhouse gas emissions are mainly combustion. In the primary data collected for olefins and LLDPE resin, combustion emissions from flare have been included as process emissions and so their totals may be overstated by small amounts due to the inclusion of combustion of fuel used during the flare. Data providers were asked to estimate percentages of greenhouse gases from flare from that of the combustion of fuels. Any non-fossil carbon dioxide emissions, such as those from the burning of wood-derived fuel, is a return of carbon dioxide to the atmosphere in the same form as it was originally removed from the atmosphere during the biomass growth cycle; therefore, any carbon dioxide emissions from combustion or decomposition of biomass-derived products are not considered a net contributor to global warming. The 100-year global warming potential (GWP) factors for each of these substances as reported in the Intergovernmental Panel on Climate Change (IPCC) 201315 are: fossil carbon dioxide 1, fossil methane 28, and nitrous oxide 265. The GWP factor for a substance represents the relative global warming contribution of a pound of that substance compared to a pound of carbon dioxide. The weights of each greenhouse gas are multiplied by its GWP factor to arrive at the total GWP results. Although normally GWP results are closely related to the energy results, the feedstock energy is not associated with GWP due to the sequestration of the feedstock material within the plastic. It is the potential energy associated with the feedstock material, which is not combusted to create greenhouse gases. Table 6 and Figure 7 show life cycle GWP results for the LLDPE resin system. Of the total, 84 percent of the GWP are attributed to emissions from the incoming materials, including cyclohexane, natural gas and petroleum input materials and olefins/hydrogen production, with the remaining associated with the production of the LLDPE resin. The largest amount of the GWP is created by the production of ethylene, which accounts for 47 percent of the total GWP, which comes directly from the release of greenhouse gases at the olefins plant. Almost 20 percent of the total GWP are emissions associated with fuel use and combustion of coal and natural gas in industrial and utility boilers. The natural gas extraction, processing, and transport used as a material input to the olefins plant comprises 26 percent of the total GWP. The process greenhouse gases released at the LLDPE resin plants are less than 1 percent of the total; this is due to flaring, which is considered a mix of process and fuel-based emissions.
15 IPCC, 2013: Climate Change 2013: The Physical Science Basis. Contribution of Working Group I to
the Fifth Assessment Report of the Intergovernmental Panel on Climate Change [Stocker, T.F., D. Qin, G.-K. Plattner, M. Tignor, S.K. Allen, J. Boschung, A. Nauels, Y. Xia, V. Bex and P.M. Midgley (eds.)]. Cambridge University Press, Cambridge, United Kingdom and New York, NY, USA, 2013.
CLIENT\ACCPlasticsDiv\KC202756
10.19.20 4031.00.002 25
Table 6. Global Warming Potential for LLDPE Resin
Figure 7. Global Warming Potential for LLDPE Resin
ACIDIFICATION POTENTIAL Acidification assesses the potential of emissions to contribute to the formation and deposit of acid rain on soil and water, which can cause serious harm to plant and animal life as well as damage to infrastructure. Acidification potential modeling in TRACI incorporates the results of an atmospheric chemistry and transport model, developed by the U.S. National Acid Precipitation Assessment Program (NAPAP), to estimate total North American
terrestrial deposition due to atmospheric emissions of NOx and SO2, as a function of the emissions location.16,17
Acidification impacts are typically dominated by fossil fuel combustion emissions, particularly sulfur dioxide (SO2) and nitrogen oxides (NOx). Emissions from combustion of fossil fuels, especially coal, to generate grid electricity is a significant contributor to acidification impacts for the system. Also, emissions from the extraction and processing of natural gas impact the AP category.
16 Bare JC, Norris GA, Pennington DW, McKone T. (2003). TRACI: The Tool for the Reduction and
Assessment of Chemical and Other Environmental Impacts, Journal of Industrial Ecology, 6(3–4): 49–78. Available at URL: http://mitpress.mit.edu/journals/pdf/jiec_6_3_49_0.pdf.
17 Bare JC. (2002). Developing a consistent decision-making framework by using the US EPA’s TRACI, AICHE. Available at URL: http://www.epa.gov/nrmrl/std/sab/traci/aiche2002paper.pdf.
Basis: 1,000 PoundsBasis: 1,000
kilograms
Percentage of
Total
lb CO2 eq kg CO2 eq %
Cradle-to-Incoming Materials 1,239 1,239 84%
Virgin LLDPE Resin Production 233 233 16%
1,472 1,472 100%
Global Warming Potential
Total

CLIENT\ACCPlasticsDiv\KC202756
10.19.20 4031.00.002 26
Table 7 shows total acidification potential (AP) results for the LLDPE resin system. Results are shown graphically in Figure 8. In the AP category, 17 percent of the AP coming from LLDPE resin production and about 83 percent comes from the raw and intermediate material unit processes. Most of the AP amount (71 percent) comes from the extraction and processing of natural gas for materials and fuels, which is used to create 90 percent of the material inputs to the olefins plants. About 17 percent, comes from the combustion of coal for electricity. Almost 5 percent of the AP results come from emissions related to the production of ethylene. Less than 1 percent of the total AP comes directly from the LLDPE resin production. Almost all of the 17 percent shown in Table 7 comes from electricity, fuel combustion or transport.
Table 7. Acidification Potential for LLDPE Resin
Figure 8. Acidification Potential for LLDPE Resin EUTROPHICATION POTENTIAL Eutrophication occurs when excess nutrients (nitrates, phosphates) are introduced to surface water causing the rapid growth of aquatic plants. Excess releases of these substances may provide undesired effects on the waterways.18 The TRACI characterization factors for
18 Bare, J. C. Tool for the Reduction and Assessment of Chemical and Other Environmental Impacts
(TRACI), Version 2.1 - User’s Manual; EPA/600/R-12/554 2012.
Basis: 1,000 PoundsBasis: 1,000
kilograms
Percentage of
Total
lb SO2 eq kg SO2 eq %
Cradle-to-Incoming Materials 3.87 3.87 83%
Virgin LLDPE Resin Production 0.81 0.81 17%
4.69 4.69 100%
Acidification Potential
Total
CLIENT\ACCPlasticsDiv\KC202756
10.19.20 4031.00.002 27
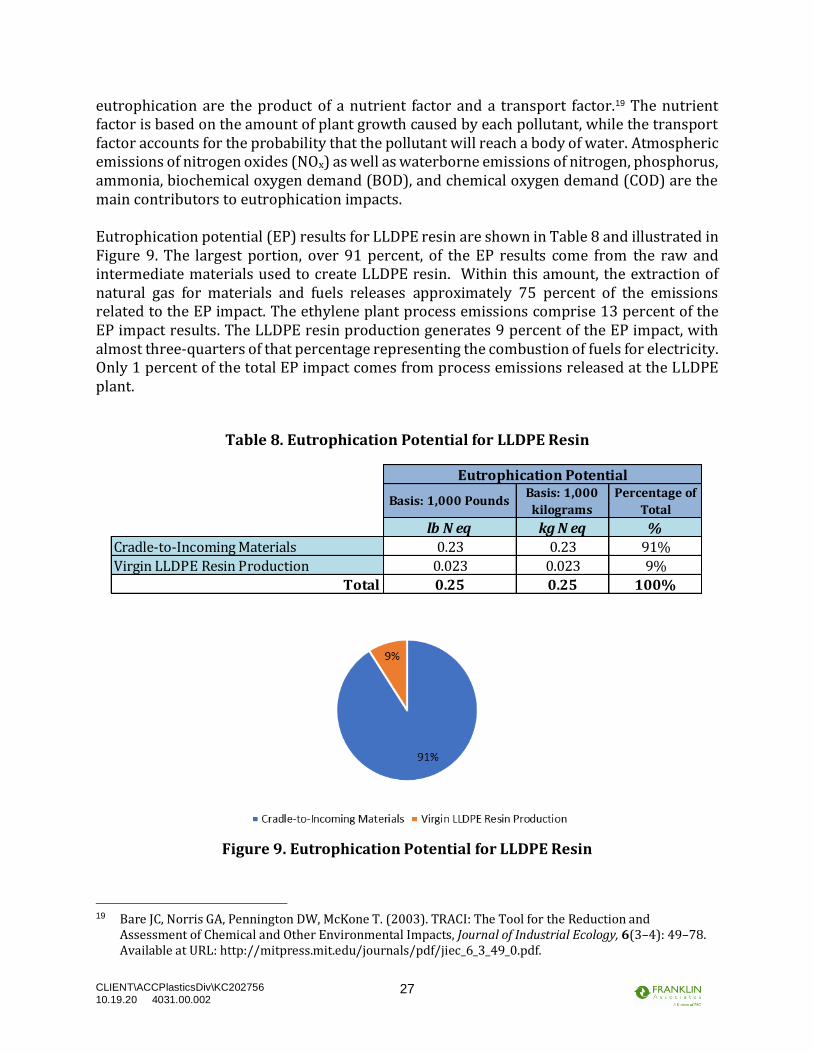
eutrophication are the product of a nutrient factor and a transport factor.19 The nutrient factor is based on the amount of plant growth caused by each pollutant, while the transport factor accounts for the probability that the pollutant will reach a body of water. Atmospheric emissions of nitrogen oxides (NOx) as well as waterborne emissions of nitrogen, phosphorus, ammonia, biochemical oxygen demand (BOD), and chemical oxygen demand (COD) are the main contributors to eutrophication impacts. Eutrophication potential (EP) results for LLDPE resin are shown in Table 8 and illustrated in Figure 9. The largest portion, over 91 percent, of the EP results come from the raw and intermediate materials used to create LLDPE resin. Within this amount, the extraction of natural gas for materials and fuels releases approximately 75 percent of the emissions related to the EP impact. The ethylene plant process emissions comprise 13 percent of the EP impact results. The LLDPE resin production generates 9 percent of the EP impact, with almost three-quarters of that percentage representing the combustion of fuels for electricity. Only 1 percent of the total EP impact comes from process emissions released at the LLDPE plant.
Table 8. Eutrophication Potential for LLDPE Resin
Figure 9. Eutrophication Potential for LLDPE Resin
19 Bare JC, Norris GA, Pennington DW, McKone T. (2003). TRACI: The Tool for the Reduction and
Assessment of Chemical and Other Environmental Impacts, Journal of Industrial Ecology, 6(3–4): 49–78. Available at URL: http://mitpress.mit.edu/journals/pdf/jiec_6_3_49_0.pdf.
Basis: 1,000 PoundsBasis: 1,000
kilograms
Percentage of
Total
lb N eq kg N eq %
Cradle-to-Incoming Materials 0.23 0.23 91%
Virgin LLDPE Resin Production 0.023 0.023 9%
0.25 0.25 100%
Eutrophication Potential
Total
CLIENT\ACCPlasticsDiv\KC202756
10.19.20 4031.00.002 28
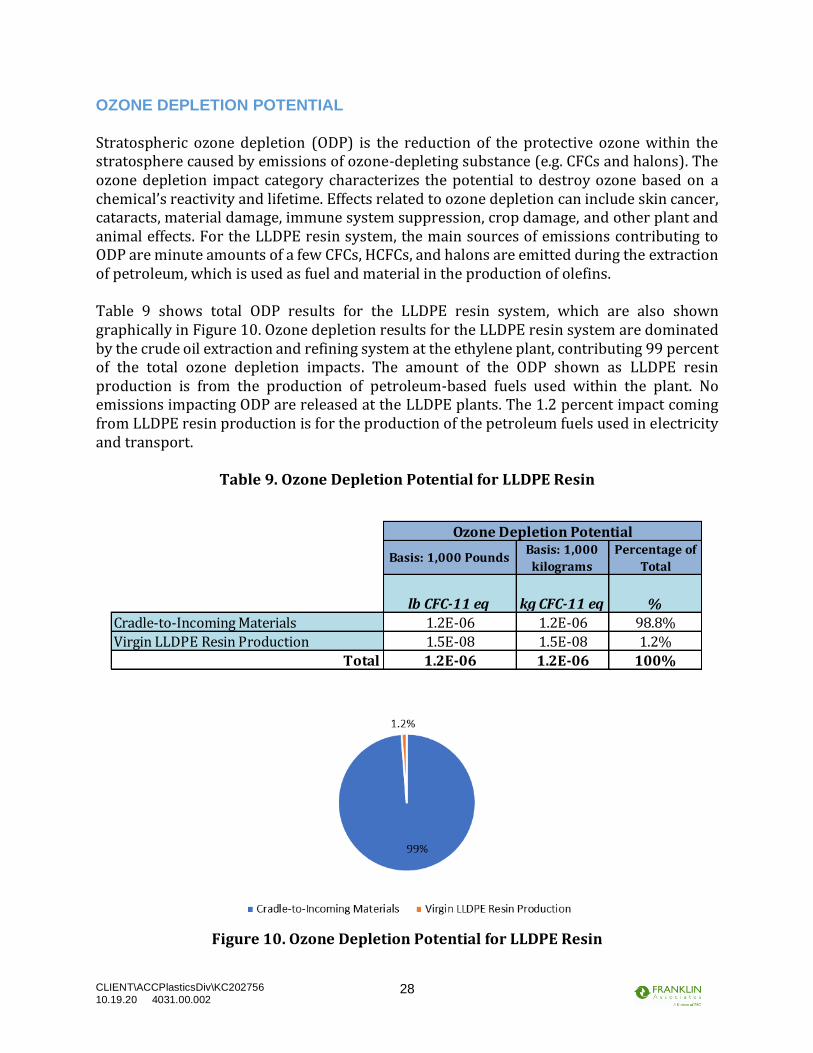
OZONE DEPLETION POTENTIAL Stratospheric ozone depletion (ODP) is the reduction of the protective ozone within the stratosphere caused by emissions of ozone-depleting substance (e.g. CFCs and halons). The ozone depletion impact category characterizes the potential to destroy ozone based on a chemical’s reactivity and lifetime. Effects related to ozone depletion can include skin cancer, cataracts, material damage, immune system suppression, crop damage, and other plant and animal effects. For the LLDPE resin system, the main sources of emissions contributing to ODP are minute amounts of a few CFCs, HCFCs, and halons are emitted during the extraction of petroleum, which is used as fuel and material in the production of olefins. Table 9 shows total ODP results for the LLDPE resin system, which are also shown graphically in Figure 10. Ozone depletion results for the LLDPE resin system are dominated by the crude oil extraction and refining system at the ethylene plant, contributing 99 percent of the total ozone depletion impacts. The amount of the ODP shown as LLDPE resin production is from the production of petroleum-based fuels used within the plant. No emissions impacting ODP are released at the LLDPE plants. The 1.2 percent impact coming from LLDPE resin production is for the production of the petroleum fuels used in electricity and transport.
Table 9. Ozone Depletion Potential for LLDPE Resin
Figure 10. Ozone Depletion Potential for LLDPE Resin
Basis: 1,000 PoundsBasis: 1,000
kilograms
Percentage of
Total
lb CFC-11 eq kg CFC-11 eq %
Cradle-to-Incoming Materials 1.2E-06 1.2E-06 98.8%
Virgin LLDPE Resin Production 1.5E-08 1.5E-08 1.2%
1.2E-06 1.2E-06 100%
Ozone Depletion Potential
Total
CLIENT\ACCPlasticsDiv\KC202756
10.19.20 4031.00.002 29
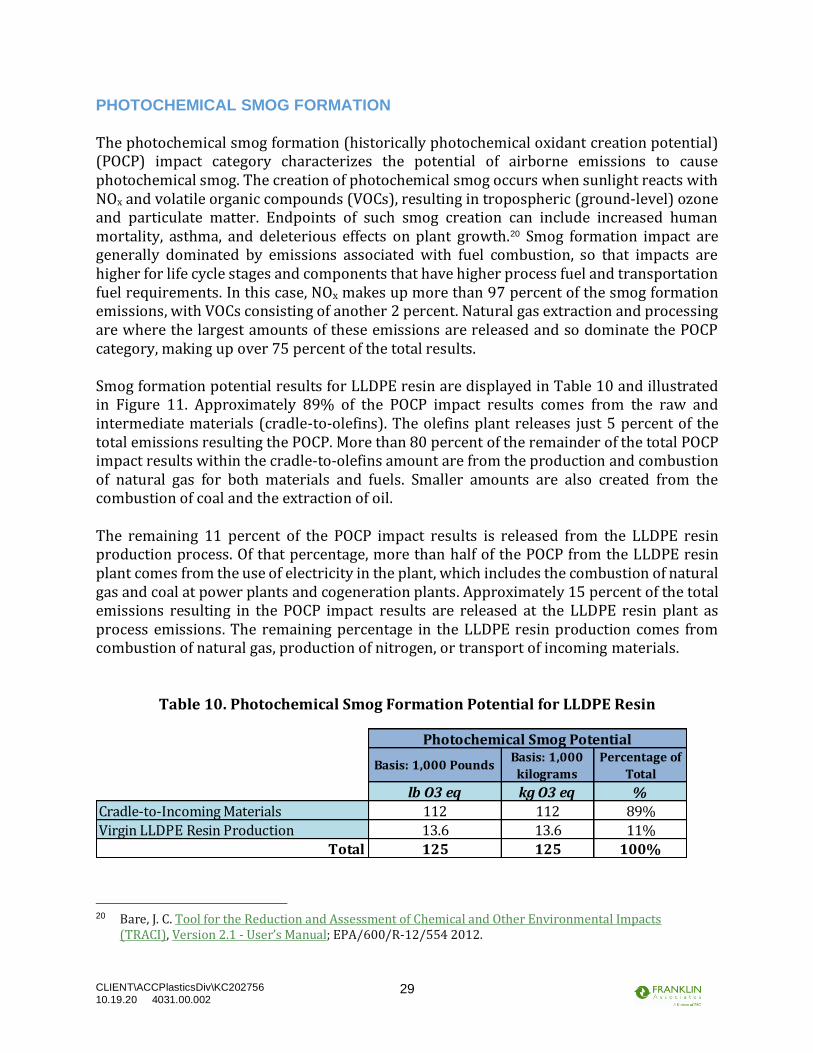
PHOTOCHEMICAL SMOG FORMATION The photochemical smog formation (historically photochemical oxidant creation potential) (POCP) impact category characterizes the potential of airborne emissions to cause photochemical smog. The creation of photochemical smog occurs when sunlight reacts with NOx and volatile organic compounds (VOCs), resulting in tropospheric (ground-level) ozone and particulate matter. Endpoints of such smog creation can include increased human mortality, asthma, and deleterious effects on plant growth.20 Smog formation impact are generally dominated by emissions associated with fuel combustion, so that impacts are higher for life cycle stages and components that have higher process fuel and transportation fuel requirements. In this case, NOx makes up more than 97 percent of the smog formation emissions, with VOCs consisting of another 2 percent. Natural gas extraction and processing are where the largest amounts of these emissions are released and so dominate the POCP category, making up over 75 percent of the total results. Smog formation potential results for LLDPE resin are displayed in Table 10 and illustrated in Figure 11. Approximately 89% of the POCP impact results comes from the raw and intermediate materials (cradle-to-olefins). The olefins plant releases just 5 percent of the total emissions resulting the POCP. More than 80 percent of the remainder of the total POCP impact results within the cradle-to-olefins amount are from the production and combustion of natural gas for both materials and fuels. Smaller amounts are also created from the combustion of coal and the extraction of oil. The remaining 11 percent of the POCP impact results is released from the LLDPE resin production process. Of that percentage, more than half of the POCP from the LLDPE resin plant comes from the use of electricity in the plant, which includes the combustion of natural gas and coal at power plants and cogeneration plants. Approximately 15 percent of the total emissions resulting in the POCP impact results are released at the LLDPE resin plant as process emissions. The remaining percentage in the LLDPE resin production comes from combustion of natural gas, production of nitrogen, or transport of incoming materials.
Table 10. Photochemical Smog Formation Potential for LLDPE Resin
20 Bare, J. C. Tool for the Reduction and Assessment of Chemical and Other Environmental Impacts
(TRACI), Version 2.1 - User’s Manual; EPA/600/R-12/554 2012.
Basis: 1,000 PoundsBasis: 1,000
kilograms
Percentage of
Total
lb O3 eq kg O3 eq %
Cradle-to-Incoming Materials 112 112 89%
Virgin LLDPE Resin Production 13.6 13.6 11%
125 125 100%
Photochemical Smog Potential
Total
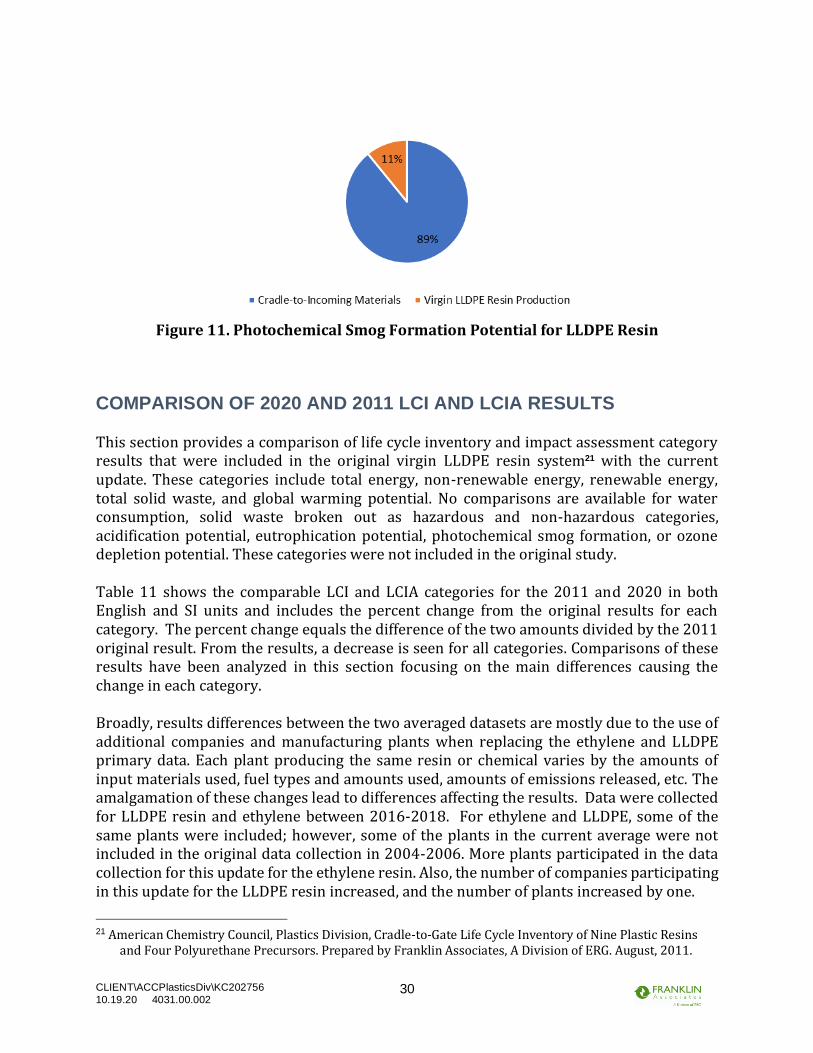
CLIENT\ACCPlasticsDiv\KC202756
10.19.20 4031.00.002 30
Figure 11. Photochemical Smog Formation Potential for LLDPE Resin
COMPARISON OF 2020 AND 2011 LCI AND LCIA RESULTS This section provides a comparison of life cycle inventory and impact assessment category results that were included in the original virgin LLDPE resin system21 with the current update. These categories include total energy, non-renewable energy, renewable energy, total solid waste, and global warming potential. No comparisons are available for water consumption, solid waste broken out as hazardous and non-hazardous categories, acidification potential, eutrophication potential, photochemical smog formation, or ozone depletion potential. These categories were not included in the original study. Table 11 shows the comparable LCI and LCIA categories for the 2011 and 2020 in both English and SI units and includes the percent change from the original results for each category. The percent change equals the difference of the two amounts divided by the 2011 original result. From the results, a decrease is seen for all categories. Comparisons of these results have been analyzed in this section focusing on the main differences causing the change in each category. Broadly, results differences between the two averaged datasets are mostly due to the use of additional companies and manufacturing plants when replacing the ethylene and LLDPE primary data. Each plant producing the same resin or chemical varies by the amounts of input materials used, fuel types and amounts used, amounts of emissions released, etc. The amalgamation of these changes lead to differences affecting the results. Data were collected for LLDPE resin and ethylene between 2016-2018. For ethylene and LLDPE, some of the same plants were included; however, some of the plants in the current average were not included in the original data collection in 2004-2006. More plants participated in the data collection for this update for the ethylene resin. Also, the number of companies participating in this update for the LLDPE resin increased, and the number of plants increased by one.
21 American Chemistry Council, Plastics Division, Cradle-to-Gate Life Cycle Inventory of Nine Plastic Resins
and Four Polyurethane Precursors. Prepared by Franklin Associates, A Division of ERG. August, 2011.

CLIENT\ACCPlasticsDiv\KC202756
10.19.20 4031.00.002 31
. Table 11. Comparison of 2011 and 2020 LCI and LCIA Results for Virgin LLDPE Resin
ENERGY COMPARISON Overall, the total energy for LLDPE resin has decreased 10.8 GJ on a 1,000 kg basis (4.6 MMBtu/1,000 lb). This is a 13 percent decrease in total energy as compared to the original results. When comparing the LLDPE resin unit process average energy data, there is an across the board decrease between data from plants that were collected for both studies. This is true for both electricity and fuels combusted within the plant. It is possible that this decrease within the plant average could be explained by efficiency improvements. Plus, the addition of new plants into the analysis affected the change in energy. Figure 12 provides a graphical perspective of the unit processes associated with this energy decrease from the original energy amounts.
LCIA Results
Total
Energy
Non-
Renewable
Energy
Renewable
Energy
Total Solid
Waste*
Global
Warming
MM Btu MM Btu MM Btu lb lb CO 2 eq
LLDPE 2020 31.3 31.2 0.08 63.0 1,472
LLDPE 2011 35.9 35.8 0.11 81.2 2,201
LCIA Results
Total
Energy
Non-
Renewable
Energy
Renewable
Energy
Total Solid
Waste*
Global
Warming
GJ GJ GJ kg kg CO 2 eq
LLDPE 2020 72.8 72.6 0.19 63.0 1,472
LLDPE 2011 83.6 83.4 0.26 81.2 2,201
Percent Change -13% -13% -27% -22% -33%
1000 pounds of Virgin
Linear Low-Density Polyethylene Resin
LCI Results
1000 kilograms of Virgin
Linear Low-Density Polyethylene Resin
LCI Results
*Total Solid Waste excludes hazardous solid waste for 2020 as this category was not
included as Solid Waste in 2011.

CLIENT\ACCPlasticsDiv\KC202756
10.19.20 4031.00.002 32
Figure 12. Decrease in Energy by Stage per 1,000 kg (GJ)
The energy of material resource, which pertains to the amount of inherent energy from the raw materials stayed steady for LLDPE resin. The transport energy continues to make up less than 1 percent, with the remaining energy coming from the processes. The largest portion of the changes overall come from the process energy. The energy specific to the LLDPE plant decreased by 27 percent of its previous total. This can be accounted for through the differences in plants providing data, which decreased overall. The olefins unit process energy also decreased from the original data collection. Finally, the overall energy use for both the oil and natural gas extraction and processing/refining decreased by small amounts. The difference in renewable energy decreased about 27 percent from the original results. Although this seems quite large, the renewable energy makes up less than one percent of the total energy. This change is mainly due to decreases in the use of electricity (hydropower and other renewable resources for energy) within olefins and LLDPE. SOLID WASTE COMPARISON When compared to the 2011 LLDPE resin total solid waste amount, the current LLDPE resin study creates 18 kg per 1000 kg LLDPE resin less solid waste, which is a 22 percent decrease. Some of this decrease is due to the differences in olefin and LLDPE plant data collected between the 2011 and 2019 reports, as well as their weighting using production amounts. Figure 13 provides a visual of the total solid waste amount split out by the LLDPE unit process and cradle-to-incoming materials. A decrease occurs for both cradle-to-incoming materials and at the LLDPE plant. The LLDPE plant process solid waste increased in process solid waste created at the plant, but decreased in fuel-related solid wastes for energy used at the plant, which overall is shown as a 2 percent decrease for the unit process. The decrease in cradle-to-incoming materials (mostly olefins) is due to an overall decrease in the
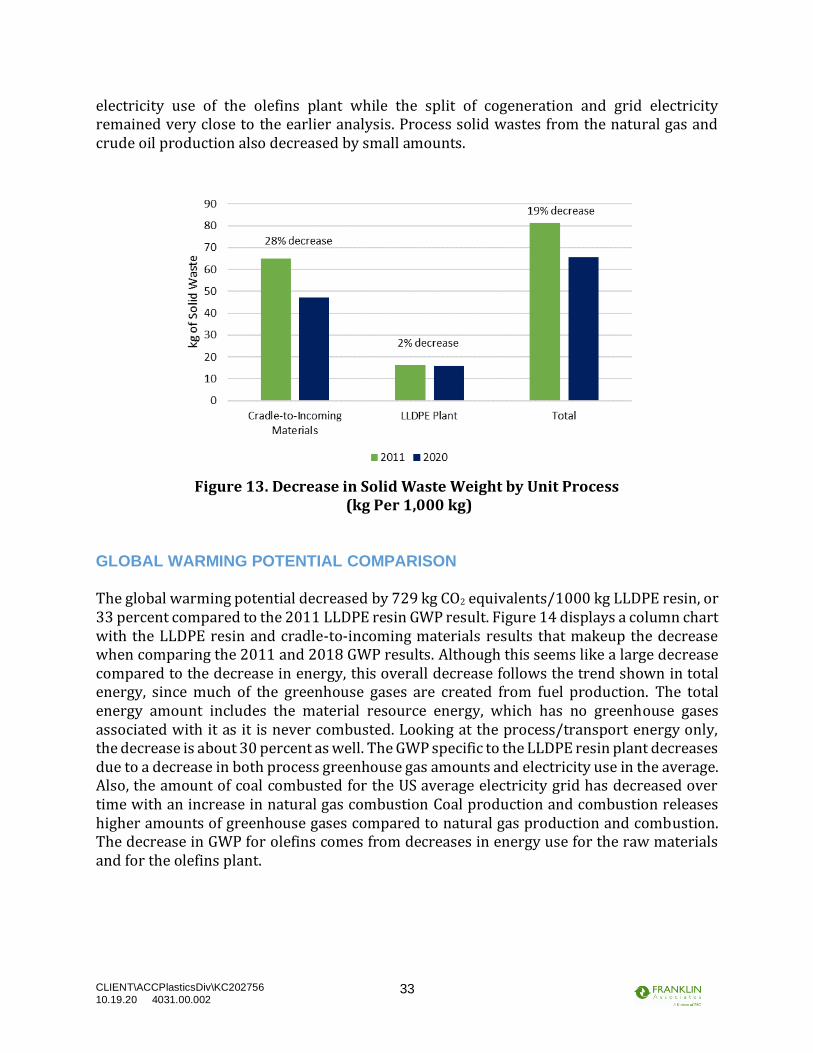
CLIENT\ACCPlasticsDiv\KC202756
10.19.20 4031.00.002 33
electricity use of the olefins plant while the split of cogeneration and grid electricity remained very close to the earlier analysis. Process solid wastes from the natural gas and crude oil production also decreased by small amounts.
Figure 13. Decrease in Solid Waste Weight by Unit Process
(kg Per 1,000 kg) GLOBAL WARMING POTENTIAL COMPARISON The global warming potential decreased by 729 kg CO2 equivalents/1000 kg LLDPE resin, or 33 percent compared to the 2011 LLDPE resin GWP result. Figure 14 displays a column chart with the LLDPE resin and cradle-to-incoming materials results that makeup the decrease when comparing the 2011 and 2018 GWP results. Although this seems like a large decrease compared to the decrease in energy, this overall decrease follows the trend shown in total energy, since much of the greenhouse gases are created from fuel production. The total energy amount includes the material resource energy, which has no greenhouse gases associated with it as it is never combusted. Looking at the process/transport energy only, the decrease is about 30 percent as well. The GWP specific to the LLDPE resin plant decreases due to a decrease in both process greenhouse gas amounts and electricity use in the average. Also, the amount of coal combusted for the US average electricity grid has decreased over time with an increase in natural gas combustion Coal production and combustion releases higher amounts of greenhouse gases compared to natural gas production and combustion. The decrease in GWP for olefins comes from decreases in energy use for the raw materials and for the olefins plant.
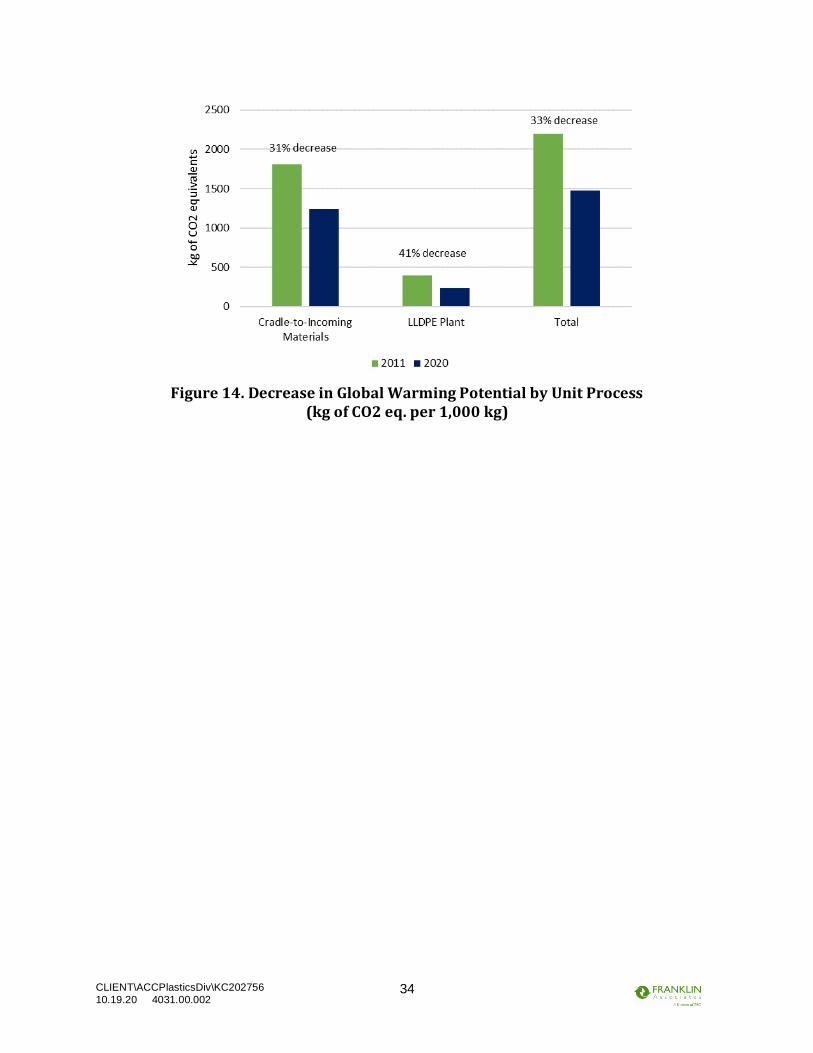
CLIENT\ACCPlasticsDiv\KC202756
10.19.20 4031.00.002 34
Figure 14. Decrease in Global Warming Potential by Unit Process
(kg of CO2 eq. per 1,000 kg)

CLIENT\ACCPlasticsDiv\KC202756
10.19.20 4031.00.002 35
APPENDIX: LINEAR LOW-DENSITY POLYETHYLENE (LLDPE) MANUFACTURE This appendix discusses the manufacture of LLDPE, which is used for many plastics products, including a variety of films, including stretch wrap and bags, as well as flexible tubing. The captured LLDPE production amount is approximately 33 percent of the LLDPE production in the U.S. in 2015 (Statista, 2019). The flow diagram of processes included for LLDPE resin is provided in Figure 15. Individual unit process tables on the bases of 1,000 pounds and 1,000 kilograms are also shown within this appendix. The following processes are included in this appendix:
• Hydrogen from Steam Cracking • Linear Low-density Polyethylene (LLDPE) Production
LCI data for olefins/hydrogen and LLDPE production were collected for this update to the U.S. LCI plastics database by member companies of the American Chemistry Council. Secondary data was used for crude oil extraction and refining and natural gas production and
processing, cyclohexane, and nitrogen. Results and LCI data for the production of olefins, oil, and natural gas can be found in the report, Cradle-to-Gate Life Cycle Analysis of Olefins. LCI data for ancillary input materials, cyclohexane and nitrogen, were adapted from the ecoinvent 3 database. These datasets are not available due to confidentiality issues of that database. The adaptations included the use of the US electricity grid and US transportation. HYDROGEN PRODUCTION FROM STEAM CRACKING This analysis uses the hydrogen production from thermal cracking, or steam cracking, of saturated hydrocarbons such as ethane, propane, naphtha, and other gas oils. Although steam cracking data has been provided for this analysis, hydrogen can be manufactured by several technologies. However, after reviewing the transport data of incoming hydrogen, it is likely that many of the LLDPE producers are purchasing hydrogen from steam crackers within their area. This analysis only uses steam cracking as the source for hydrogen. No additional energy or emissions have been added for the separation/purification of the hydrogen from the steam cracker. The amounts of incoming hydrogen to LLDPE are small, and so the results are not expected to be low by any significant amount.

CLIENT\ACCPlasticsDiv\KC202756
10.19.20 4031.00.002 36
Crude Oil Production
Natural Gas Production
Petroleum Refining
(Distillation/Desalting/
Hydrotreating)
Natural Gas Processing
Olefins Production
Linear Low-Density
Polyethylene (LLDPE) Resin
Production
Ethylene†
Nitrogen
LLDPE Resin
Fuel Gas**
Naphtha
EthanePropaneButane
Hydrogen
Cyclohexane*
Figure 15. Flow diagram for the Production of Linear Low-Density Polyethylene (LLDPE) Resin.
* Cyclohexane and nitrogen data are from ecoinvent and are adapted to U.S. conditions. Both inputs are ancillary materials.
**Fuel gas used for energy is created from off-gas produced in the process. † Represents ethylene production and octene, hexene, 1-butene, isobutane, and isopentane production which
use ethylene as a surrogate.
Typical production of olefins and other coproducts begins when hydrocarbons are fed to the cracking furnace. After being pre-heated by a heat exchanger, mixed with steam and then further heated, the hydrocarbon feed is transferred to a reactor. The temperature is again increased to around 800 Celsius, and the cracked gas products are immediately cooled in quench towers using quench oil or quench water. Fuel oil is separated from the main gas stream in a multi-stage centrifugal compressor. The main gas stream then undergoes acid gas removal and drying to remove any moisture that may remain from the quenching process prior to cracked gas compression. The final step involves fractional distillation of the various reaction products and is achieved using a series of distillation columns and hydrogenation reactors. Within the hydrocracker, an off-gas is produced from the raw materials entering. A portion of this off-gas is processed and used as fuel gas to produce steam for the hydrocracker, while the remaining portion is exported from the hydrocracker as a coproduct. This internally-created energy is included in the analysis by including the production of the raw materials combusted to produce the energy as well as the energy amount attributed to the combustion of those raw materials. Unlike the raw materials that become part of the product output mass, no material feedstock energy is assigned to the raw materials inputs that are combusted within the process. This off-gas used within the process is shown as a weight of natural gas and petroleum input to produce the energy.

CLIENT\ACCPlasticsDiv\KC202756
10.19.20 4031.00.002 37
An individual weighted average for three leading olefins producers (10 thermal cracking units) was calculated using the production amounts from each plant for hydrogen. All companies provided data for the year 2015. A weighted average was calculated for hydrogen from the data collected and used to develop the LCA model. Propylene, ethylene, pyrolysis gasoline and butadiene are among the coproducts of hydrogen production from steam cracking, and a mass basis was used to allocate the credit for the coproducts. Numerous coproduct streams are produced during this process. Fuel gas and off-gas were two of the coproducts produced that were exported to another process for fuel use. For coproducts sold for fuel use in other processes, these were treated as an avoided fuel product and were given credits based on the fuel they would replace. While data was collected from a relatively small sample of plants, the olefins producers who provided data for this module verified that the characteristics of their plants are representative of a variety of ages from older plants to state-of-the-art. Of the ten plants, two plants were using older technology, five plants were using average technology and three plants were using state-of the art technology in 2015. Data providers reviewed their LCI data and provided questions, as necessary. Table 12 shows the averaged energy and emissions data for the production of 1,000 pounds and 1,000 kilograms of hydrogen. As a mass basis was used for the steam cracking unit process allocation, the differences in the individual olefins and hydrogen average data are due to differences in the amounts created at the plants participating as well as the amounts produced at the plants which are used as a weighting. In the case of some emissions, data was provided by fewer than the 3 producers. To indicate known emissions while protecting the confidentiality of individual company responses, some emissions are reported only by the order of magnitude of the average.

CLIENT\ACCPlasticsDiv\KC202756
10.19.20 4031.00.002 38
Table 12. LCI Data for the Production of Hydrogen from Steam Cracking
Material Inputs (1)
Refined Petroleum Products 81 lb 81 kg
(65% naphtha, 35% refinery gases)
Processesed Natural Gas 884 lb 884 kg
(59% ethane, 38% propane, 3% butane)
Internal off-gas (2)
From oil 18.0 lb 18.0 kg
From natural gas 196 lb 196 kg
Energy
Process Energy
Electricity from grid 8.16 kWh 18.0 kWh
Electricity from cogen 14.5 kWh 32.0 kWh
Natural gas 1,746 ft3 109 m3
Fuel Gas 1,746 ft3
109 m3
Landfill gas 14.1 ft3 0.88 m3
Avoided Energy
Oil sold as co-product 0.046 gal 0.38 l
Recovered energy from exported steam 336 ft3 21.0 m3
Off-gas sold 320 ft3 20.0 m3
Transportation Energy
Barge 33.6 ton·mi 108 tonne·km
Pipeline -refinery products 0.25 ton·mi 0.80 tonne·km
Pipeline -natural gas products 203 ton·mi 652 tonne·km
Environmental Emissions
Atmospheric Emissions
Particulates, unspecified 0.010 lb 0.010 kg *
Particulates, < 2.5 um 0.010 lb 0.010 kg
Particulates, > 2.5 um, and < 10um 0.0030 lb 0.0030 kg
Nitrogen oxides 0.26 lb 0.26 kg
NMVOC, non-methane volatile organic compounds, unspecified origin0.12 lb 0.12 kg
VOC, volatile organic compounds 0.010 lb 0.010 kg *
Sulfur oxides 0.025 lb 0.025 kg
Carbon dioxide, fossil 640 lb 640 kg
Methane, fossil 0.10 lb 0.10 kg
Nitrous oxide 0.29 lb 0.29 kg
Carbon monoxide 0.33 lb 0.33 kg
Hydrogen sulfide 1.0E-06 lb 1.0E-06 kg *
Ammonia 0.0010 lb 0.0010 kg *
Chlorine 1.0E-05 lb 1.0E-05 kg *
1,000 lb 1,000 kg
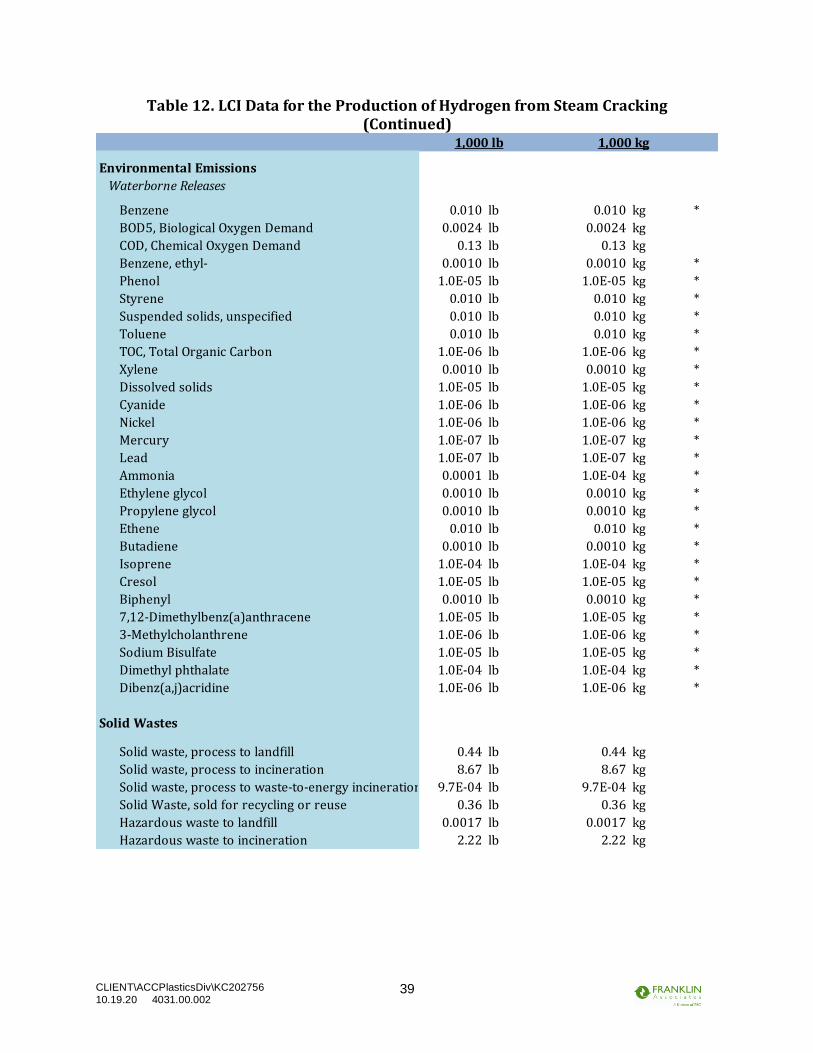
CLIENT\ACCPlasticsDiv\KC202756
10.19.20 4031.00.002 39
Table 12. LCI Data for the Production of Hydrogen from Steam Cracking (Continued)
Environmental Emissions
Waterborne Releases
Benzene 0.010 lb 0.010 kg *
BOD5, Biological Oxygen Demand 0.0024 lb 0.0024 kg
COD, Chemical Oxygen Demand 0.13 lb 0.13 kg
Benzene, ethyl- 0.0010 lb 0.0010 kg *
Phenol 1.0E-05 lb 1.0E-05 kg *
Styrene 0.010 lb 0.010 kg *
Suspended solids, unspecified 0.010 lb 0.010 kg *
Toluene 0.010 lb 0.010 kg *
TOC, Total Organic Carbon 1.0E-06 lb 1.0E-06 kg *
Xylene 0.0010 lb 0.0010 kg *
Dissolved solids 1.0E-05 lb 1.0E-05 kg *
Cyanide 1.0E-06 lb 1.0E-06 kg *
Nickel 1.0E-06 lb 1.0E-06 kg *
Mercury 1.0E-07 lb 1.0E-07 kg *
Lead 1.0E-07 lb 1.0E-07 kg *
Ammonia 0.0001 lb 1.0E-04 kg *
Ethylene glycol 0.0010 lb 0.0010 kg *
Propylene glycol 0.0010 lb 0.0010 kg *
Ethene 0.010 lb 0.010 kg *
Butadiene 0.0010 lb 0.0010 kg *
Isoprene 1.0E-04 lb 1.0E-04 kg *
Cresol 1.0E-05 lb 1.0E-05 kg *
Biphenyl 0.0010 lb 0.0010 kg *
7,12-Dimethylbenz(a)anthracene 1.0E-05 lb 1.0E-05 kg *
3-Methylcholanthrene 1.0E-06 lb 1.0E-06 kg *
Sodium Bisulfate 1.0E-05 lb 1.0E-05 kg *
Dimethyl phthalate 1.0E-04 lb 1.0E-04 kg *
Dibenz(a,j)acridine 1.0E-06 lb 1.0E-06 kg *
Solid Wastes
Solid waste, process to landfill 0.44 lb 0.44 kg
Solid waste, process to incineration 8.67 lb 8.67 kg
Solid waste, process to waste-to-energy incineration 9.7E-04 lb 9.7E-04 kg
Solid Waste, sold for recycling or reuse 0.36 lb 0.36 kg
Hazardous waste to landfill 0.0017 lb 0.0017 kg
Hazardous waste to incineration 2.22 lb 2.22 kg
1,000 kg1,000 lb
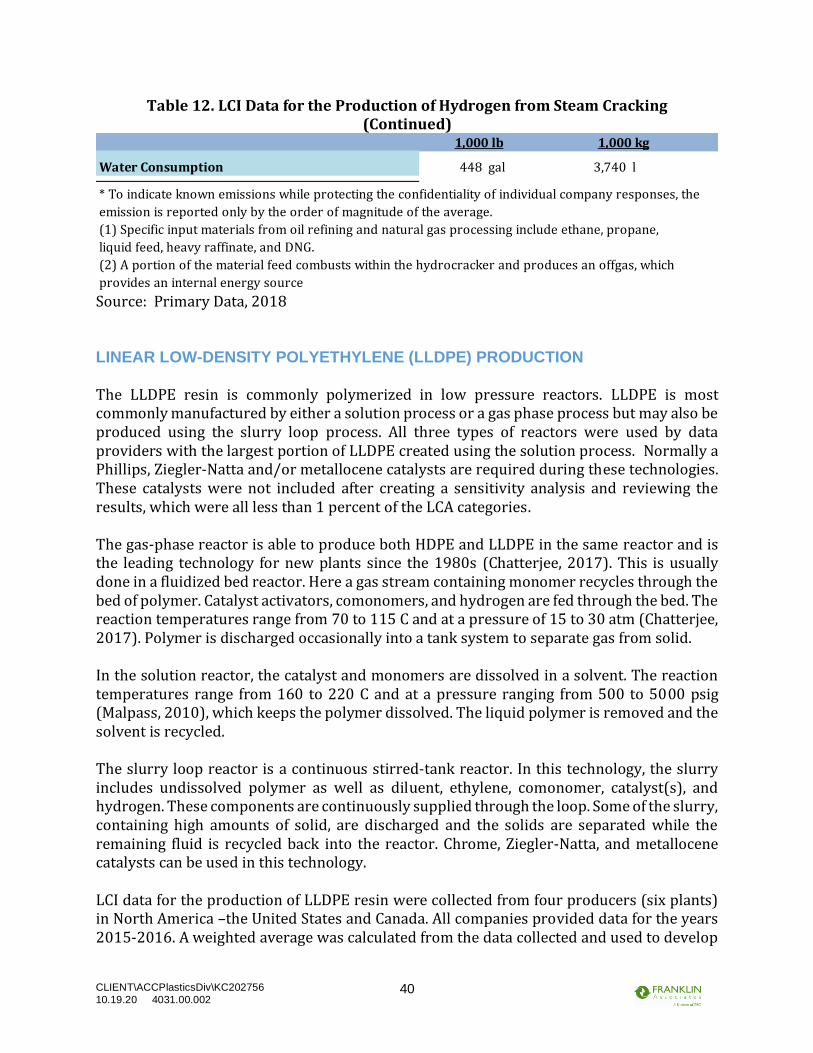
CLIENT\ACCPlasticsDiv\KC202756
10.19.20 4031.00.002 40
Table 12. LCI Data for the Production of Hydrogen from Steam Cracking (Continued)
Source: Primary Data, 2018 LINEAR LOW-DENSITY POLYETHYLENE (LLDPE) PRODUCTION The LLDPE resin is commonly polymerized in low pressure reactors. LLDPE is most commonly manufactured by either a solution process or a gas phase process but may also be produced using the slurry loop process. All three types of reactors were used by data providers with the largest portion of LLDPE created using the solution process. Normally a Phillips, Ziegler-Natta and/or metallocene catalysts are required during these technologies. These catalysts were not included after creating a sensitivity analysis and reviewing the results, which were all less than 1 percent of the LCA categories. The gas-phase reactor is able to produce both HDPE and LLDPE in the same reactor and is the leading technology for new plants since the 1980s (Chatterjee, 2017). This is usually done in a fluidized bed reactor. Here a gas stream containing monomer recycles through the bed of polymer. Catalyst activators, comonomers, and hydrogen are fed through the bed. The reaction temperatures range from 70 to 115 C and at a pressure of 15 to 30 atm (Chatterjee, 2017). Polymer is discharged occasionally into a tank system to separate gas from solid. In the solution reactor, the catalyst and monomers are dissolved in a solvent. The reaction temperatures range from 160 to 220 C and at a pressure ranging from 500 to 5000 psig (Malpass, 2010), which keeps the polymer dissolved. The liquid polymer is removed and the solvent is recycled. The slurry loop reactor is a continuous stirred-tank reactor. In this technology, the slurry includes undissolved polymer as well as diluent, ethylene, comonomer, catalyst(s), and hydrogen. These components are continuously supplied through the loop. Some of the slurry, containing high amounts of solid, are discharged and the solids are separated while the remaining fluid is recycled back into the reactor. Chrome, Ziegler-Natta, and metallocene catalysts can be used in this technology. LCI data for the production of LLDPE resin were collected from four producers (six plants) in North America –the United States and Canada. All companies provided data for the years 2015-2016. A weighted average was calculated from the data collected and used to develop
Water Consumption 448 gal 3,740 l
(1) Specific input materials from oil refining and natural gas processing include ethane, propane,
liquid feed, heavy raffinate, and DNG.
(2) A portion of the material feed combusts within the hydrocracker and produces an offgas, which
provides an internal energy source
* To indicate known emissions while protecting the confidentiality of individual company responses, the
emission is reported only by the order of magnitude of the average.
1,000 lb 1,000 kg

CLIENT\ACCPlasticsDiv\KC202756
10.19.20 4031.00.002 41
the LCA model. The captured LLDPE resin production amount is approximately 33 percent of the LLDPE resin production in the U.S. in 2015 (Statista, 2019). Only small amounts of off-spec product and chemical isomers are coproducts of LLDPE resin production, and a mass basis was used to allocate the credit for the coproducts. For octene, hexene, and butene (comonomers used), ethylene was used as a surrogate dataset. LLDPE resin producers from the United States and Canada provided data from their facilities using technology ranging from average to state-of-the-art. Approximately two-thirds of the total LLDPE resin produced by the data providers come from the solution technology. Primary data were collected from LLDPE manufacturers from the year 2015 and 2016. Companies providing data were given the option to collect data from the year preceding or following 2015 if either year would reflect more typical production conditions. After reviewing individual company data in comparison to the average, each manufacturer verified data from 2015 or 2016 was a representative year for LLDPE production in North America. Data providers reviewed their data as well as the average LLDPE LCI data and provided questions on comments on the average, which Franklin Associates reviewed and responded until all companies understood and accepted the average dataset. Table 13 shows the averaged energy and emissions data for the production of 1,000 pounds and 1,000 kilograms of LLDPE resin. In the case of some emissions, data was provided by fewer than the 3 producers. To indicate known emissions while protecting the confidentiality of individual company responses, some emissions are reported only by the order of magnitude of the average.
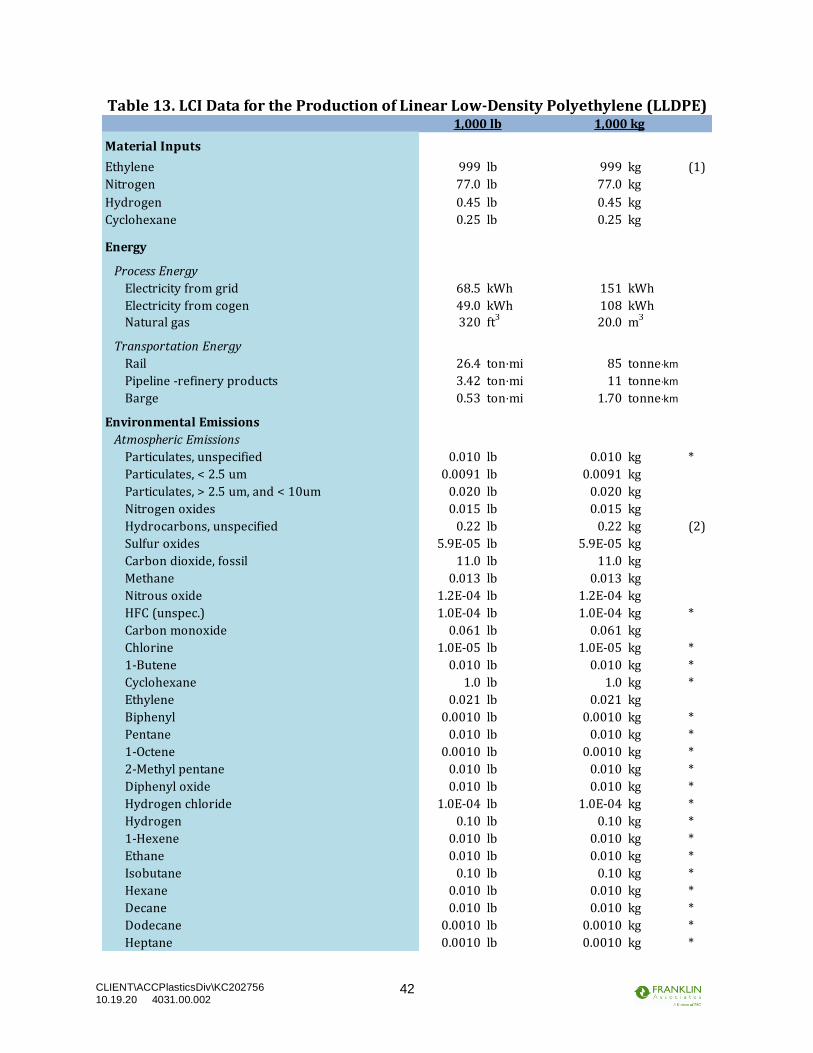
CLIENT\ACCPlasticsDiv\KC202756
10.19.20 4031.00.002 42
Table 13. LCI Data for the Production of Linear Low-Density Polyethylene (LLDPE)
Material Inputs
Ethylene 999 lb 999 kg (1)
Nitrogen 77.0 lb 77.0 kg
Hydrogen 0.45 lb 0.45 kg
Cyclohexane 0.25 lb 0.25 kg
Energy
Process Energy
Electricity from grid 68.5 kWh 151 kWh
Electricity from cogen 49.0 kWh 108 kWh
Natural gas 320 ft3
20.0 m3
Transportation Energy
Rail 26.4 ton·mi 85 tonne·km
Pipeline -refinery products 3.42 ton·mi 11 tonne·km
Barge 0.53 ton·mi 1.70 tonne·km
Environmental Emissions
Atmospheric Emissions
Particulates, unspecified 0.010 lb 0.010 kg *
Particulates, < 2.5 um 0.0091 lb 0.0091 kg
Particulates, > 2.5 um, and < 10um 0.020 lb 0.020 kg
Nitrogen oxides 0.015 lb 0.015 kg
Hydrocarbons, unspecified 0.22 lb 0.22 kg (2)
Sulfur oxides 5.9E-05 lb 5.9E-05 kg
Carbon dioxide, fossil 11.0 lb 11.0 kg
Methane 0.013 lb 0.013 kg
Nitrous oxide 1.2E-04 lb 1.2E-04 kg
HFC (unspec.) 1.0E-04 lb 1.0E-04 kg *
Carbon monoxide 0.061 lb 0.061 kg
Chlorine 1.0E-05 lb 1.0E-05 kg *
1-Butene 0.010 lb 0.010 kg *
Cyclohexane 1.0 lb 1.0 kg *
Ethylene 0.021 lb 0.021 kg
Biphenyl 0.0010 lb 0.0010 kg *
Pentane 0.010 lb 0.010 kg *
1-Octene 0.0010 lb 0.0010 kg *
2-Methyl pentane 0.010 lb 0.010 kg *
Diphenyl oxide 0.010 lb 0.010 kg *
Hydrogen chloride 1.0E-04 lb 1.0E-04 kg *
Hydrogen 0.10 lb 0.10 kg *
1-Hexene 0.010 lb 0.010 kg *
Ethane 0.010 lb 0.010 kg *
Isobutane 0.10 lb 0.10 kg *
Hexane 0.010 lb 0.010 kg *
Decane 0.010 lb 0.010 kg *
Dodecane 0.0010 lb 0.0010 kg *
Heptane 0.0010 lb 0.0010 kg *
1,000 lb 1,000 kg

CLIENT\ACCPlasticsDiv\KC202756
10.19.20 4031.00.002 43
Table 13. LCI Data for the Production of Linear Low-Density Polyethylene (LLDPE) (Continued)
Source: Primary Data, 2018
Atmospheric Emissions (Continued)
Isobutylene 0.0010 lb 0.0010 kg *
N-octane 0.003 lb 0.003 kg *
Propane 7.4E-04 lb 7.4E-04 kg *
Waterborne Releases
Fluoride 1.0E-06 lb 1.0E-06 kg *
Dissolved solids 0.32 lb 0.32 kg *
BOD5, Biological Oxygen Demand 0.0026 lb 0.0026 kg
COD, Chemical Oxygen Demand 7.4E-04 lb 7.4E-04 kg
Phenolics 1.0E-05 lb 1.0E-05 kg *
Sulfide 1.0E-04 lb 1.0E-04 kg *
Oil and Grease 0.0010 lb 0.0010 kg *
Suspended solids, unspecified 0.023 lb 0.023 kg
Cyanide 1.0E-06 lb 1.0E-06 kg *
Chromium 1.0E-06 lb 1.0E-06 kg *
Iron 1.0E-04 lb 1.0E-04 kg *
Aluminium 3.8E-04 lb 3.8E-04 kg
Nickel 1.0E-05 lb 1.0E-05 kg *
Mercury 1.0E-08 lb 1.0E-08 kg *
Lead 1.0E-06 lb 1.0E-06 kg *
Phosphate 1.0E-06 lb 1.0E-06 kg *
Zinc 1.0E-05 lb 1.0E-05 kg *Ammonia 1.0E-05 lb 1.0E-05 kg *
DOC, Dissolved Organic Carbon 0.10 lb 0.10 kg *
Phosphorus 1.0E-04 lb 1.0E-04 kg *
Toluene 1.0E-06 lb 1.0E-06 kg *
Solid Wastes
Solid waste, process to landfill 3.40 lb 3.40 kg
Solid Waste Sold for Recycling or Reuse 0.26 lb 0.26 kg
Solid waste, process to incineration 0.04 lb 0.04 kg
Solid waste process, to WTE 2.4E-07 lb 2.4E-07 kg
Hazardous waste to landfill 6.6E-04 lb 6.6E-04 kg
Hazardous waste to incineration 1.30 lb 1.30 kg
Hazardous waste to WTE 7.6E-06 lb 7.6E-06 kg
Water Consumption 150 gal 1,250 l
(2) Includes hydrocarbons and non-methane hydrocarbons
(1) Ethylene production accounts for 912 lb/1,000 lb LLDPE while the remainder of the amount is from
octene, hexene, 1-butene, isobutane, and isopentane production which use ethylene as a surrogate.
* To indicate known emissions while protecting the confidentiality of individual company responses, the
emission is reported only by the order of magnitude of the average.
1,000 lb 1,000 kg

CLIENT\ACCPlasticsDiv\KC202756
10.19.20 4031.00.002 44
REFERENCES Chatterjee, Ananda, and Mark A. Spalding (Eds.) (2017). Handbook of Industrial Polyethylene and Technology. Wiley. Malpass, Dennis B. (2010). Introduction to Industrial Polyethylene: Properties, Catalysts,
Processes. Scrivener Publishing LLC.
Primary Data (2018). Primary data from 2015 collected from 3 olefins producers by Franklin Associates. 2017-2018 Primary Data (2020). Primary data from 2015-2016 collected from 5 HDPE producers by
Franklin Associates. 2017-2020.
Statista (2019). Franklin Associates calculations using 2015 resin production amounts
from https://www.statista.com/statistics/975585/us-lldpe-production-volume/.