
COVID-19: Economic Scenarios · 2020-04-11 · Moody's Analytics operates independently of the...
23
March 2020 1 Mark Zandi, Cris DeRitis, Edward Friedman, Damien Moore, and Ryan Sweet COVID-19: Economic Scenarios March 27, 2020
Transcript of COVID-19: Economic Scenarios · 2020-04-11 · Moody's Analytics operates independently of the...
March 2020 1Mark Zandi, Cris DeRitis, Edward Friedman, Damien Moore, and Ryan Sweet
COVID-19: Economic Scenarios
March 27, 2020
Moody's Analytics operates independently of the credit ratings activities of Moody's Investors
Service. We do not comment on credit ratings or potential rating changes, and no opinion or
analysis you hear during this presentation can be assumed to reflect those of the ratings agency.

Sudden Stop1
March 2020 4
-3.0
-2.0
-1.0
0.0
Up to 3/15 3/17 3/19 3/21 3/23 3/25
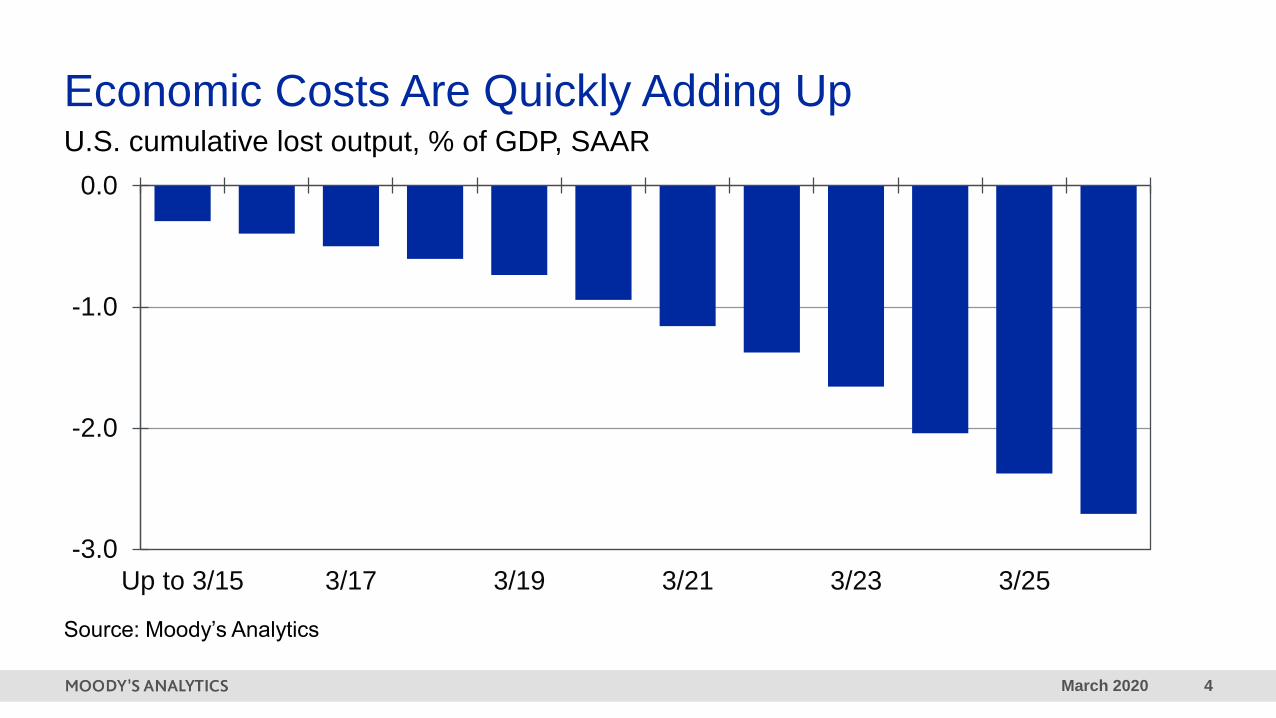
Economic Costs Are Quickly Adding UpU.S. cumulative lost output, % of GDP, SAAR
Source: Moody’s Analytics
March 2020 5
0
500
1,000
1,500
2,000
2,500
3,000
3/4 3/7 3/10 3/13 3/16 3/19 3/22 3/25
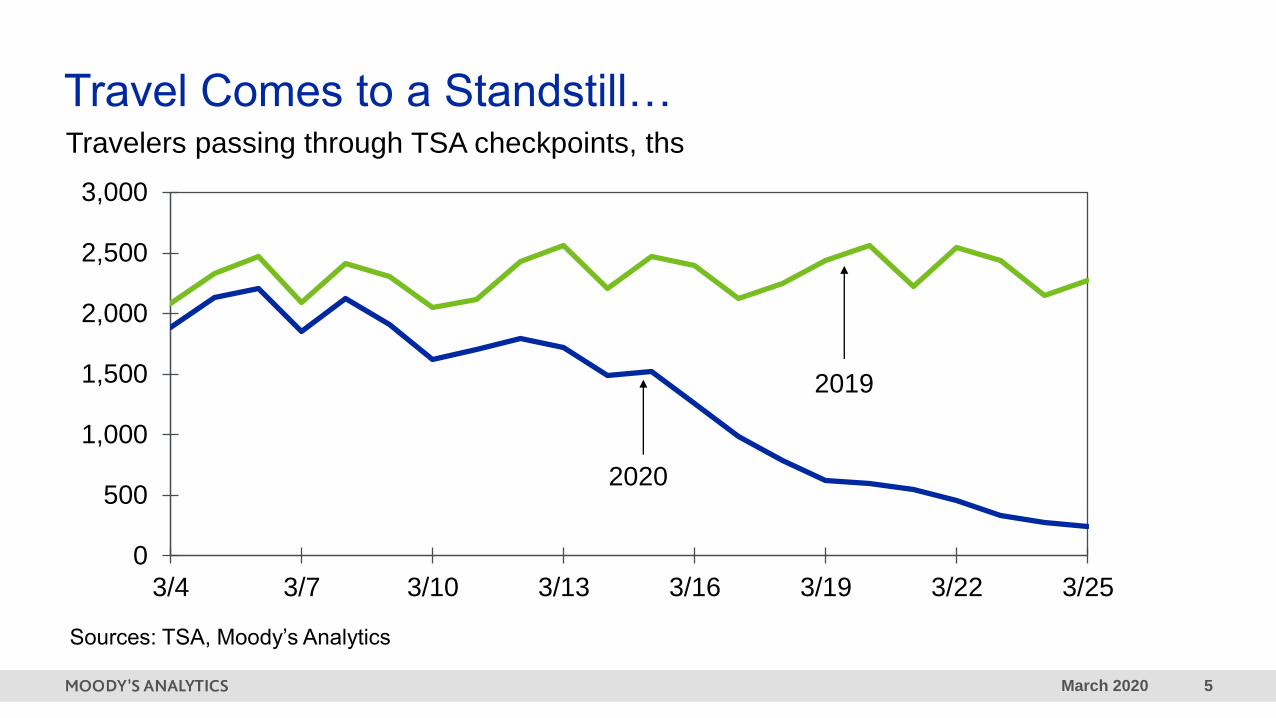
Travel Comes to a Standstill…Travelers passing through TSA checkpoints, ths
Sources: TSA, Moody’s Analytics
2019
2020
March 2020 6
-100
-80
-60
-40
-20
0
20
40
60
80
2/20 2/27 3/5 3/12 3/19 3/26
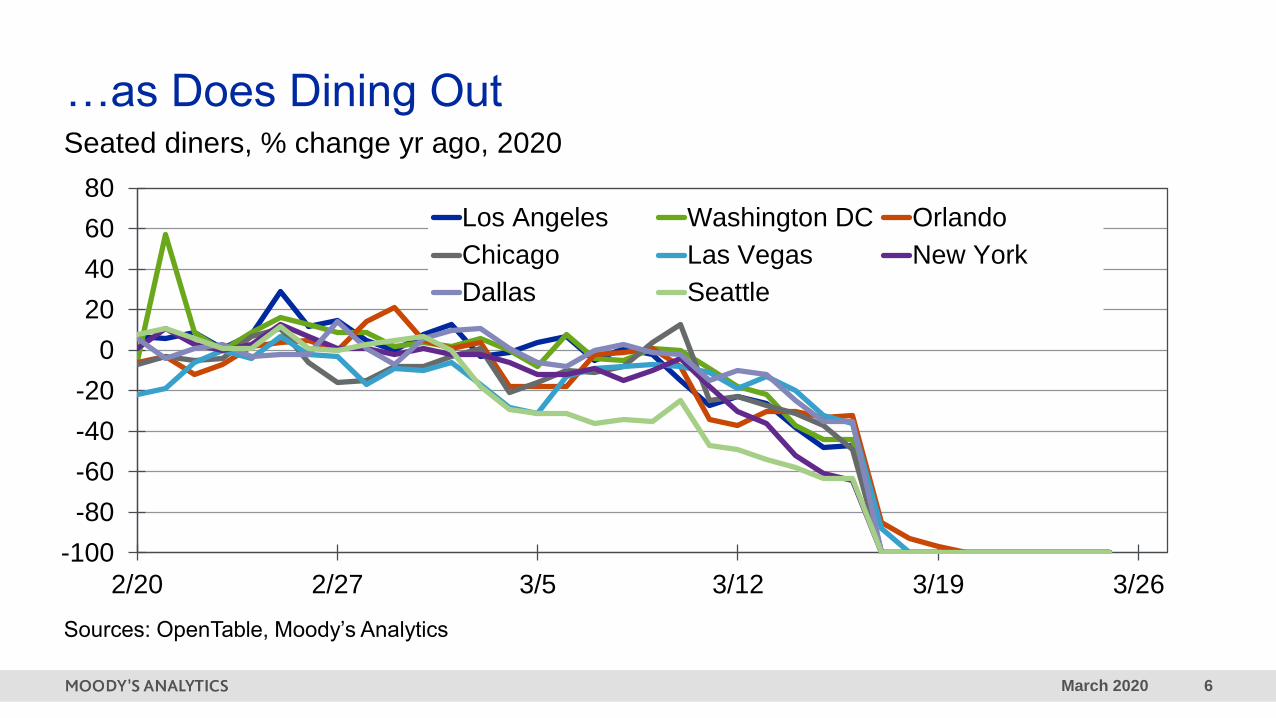
Los Angeles Washington DC Orlando
Chicago Las Vegas New York
Dallas Seattle
…as Does Dining OutSeated diners, % change yr ago, 2020
Sources: OpenTable, Moody’s Analytics
March 2020 7
0
500
1,000
1,500
2,000
2,500
3,000
3,500
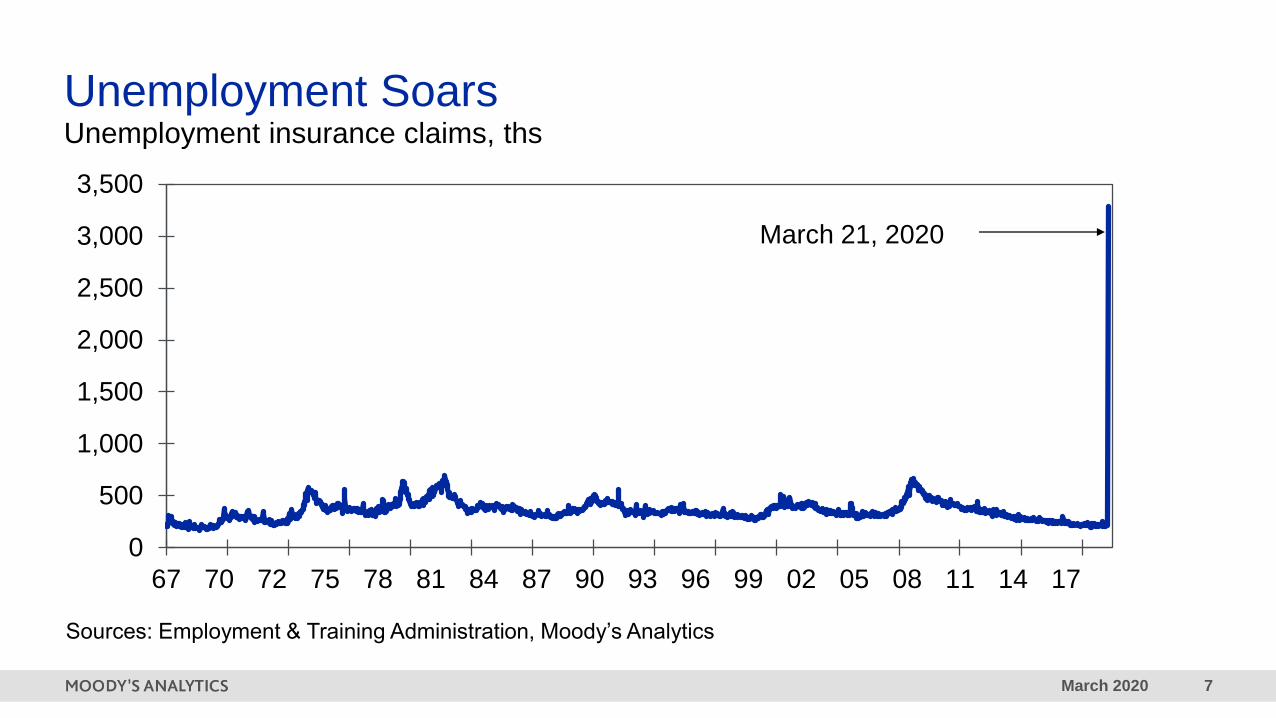
67 70 72 75 78 81 84 87 90 93 96 99 02 05 08 11 14 17
March 21, 2020
Unemployment insurance claims, ths
Sources: Employment & Training Administration, Moody’s Analytics
Unemployment Soars
Global Recession2
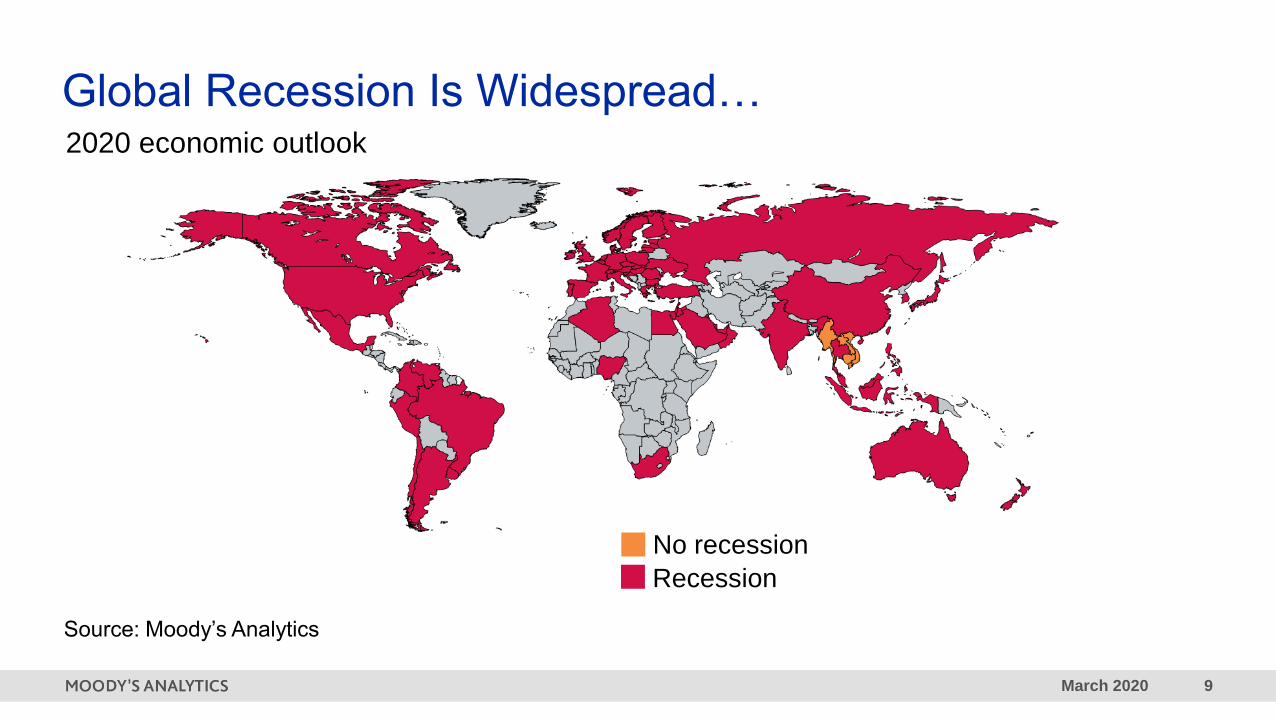
March 2020 9
Source: Moody’s Analytics
No recession
Recession
Global Recession Is Widespread…2020 economic outlook
March 2020 10
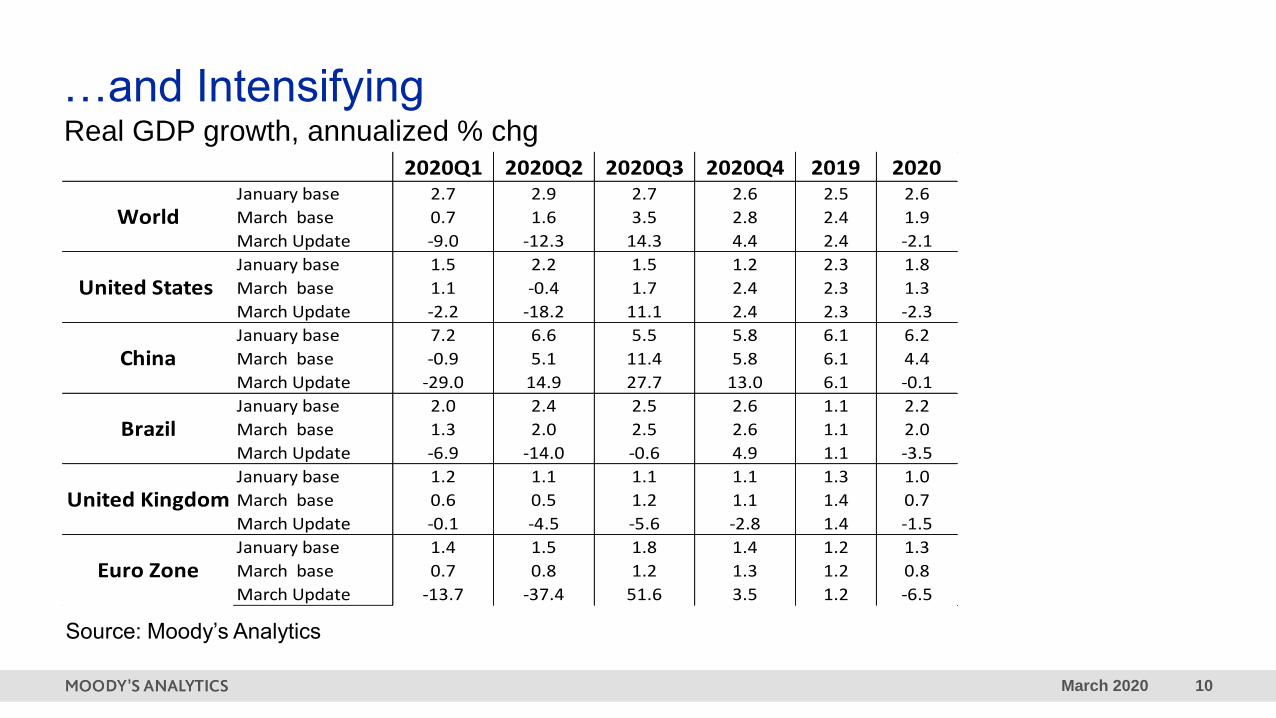
…and Intensifying
Source: Moody’s Analytics
2020Q1 2020Q2 2020Q3 2020Q4 2019 2020January base 2.7 2.9 2.7 2.6 2.5 2.6
March base 0.7 1.6 3.5 2.8 2.4 1.9
March Update -9.0 -12.3 14.3 4.4 2.4 -2.1
January base 1.5 2.2 1.5 1.2 2.3 1.8
March base 1.1 -0.4 1.7 2.4 2.3 1.3
March Update -2.2 -18.2 11.1 2.4 2.3 -2.3
January base 7.2 6.6 5.5 5.8 6.1 6.2
March base -0.9 5.1 11.4 5.8 6.1 4.4
March Update -29.0 14.9 27.7 13.0 6.1 -0.1
January base 2.0 2.4 2.5 2.6 1.1 2.2
March base 1.3 2.0 2.5 2.6 1.1 2.0
March Update -6.9 -14.0 -0.6 4.9 1.1 -3.5
January base 1.2 1.1 1.1 1.1 1.3 1.0
March base 0.6 0.5 1.2 1.1 1.4 0.7
March Update -0.1 -4.5 -5.6 -2.8 1.4 -1.5
January base 1.4 1.5 1.8 1.4 1.2 1.3
March base 0.7 0.8 1.2 1.3 1.2 0.8
March Update -13.7 -37.4 51.6 3.5 1.2 -6.5
Brazil
United Kingdom
Euro Zone
World
United States
China
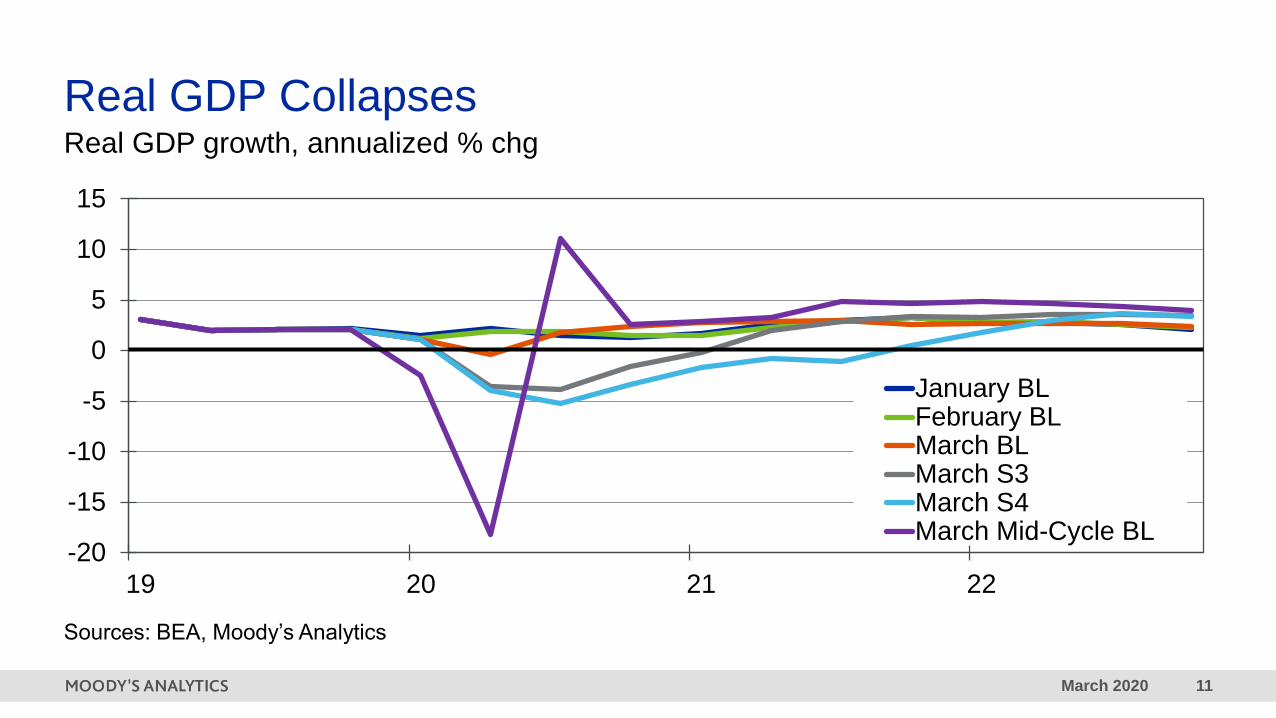
Real GDP growth, annualized % chg
March 2020 11
Real GDP Collapses
Sources: BEA, Moody’s Analytics
-20
-15
-10
-5
0
5
10
15
19 20 21 22
January BLFebruary BLMarch BLMarch S3March S4March Mid-Cycle BL
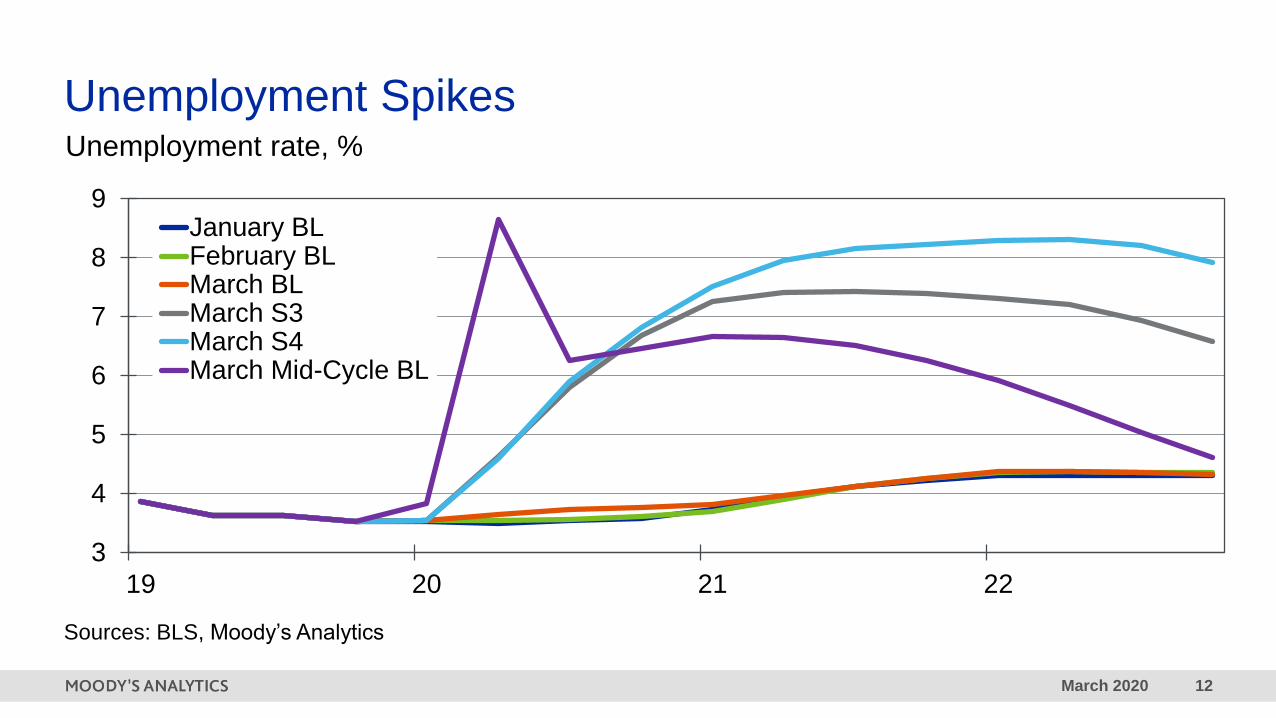
Real GDP growth, annualized % chg
March 2020 12
Unemployment Spikes
Sources: BLS, Moody’s Analytics
3
4
5
6
7
8
9
19 20 21 22
January BLFebruary BLMarch BLMarch S3March S4March Mid-Cycle BL
Unemployment rate, %
Economic Scenarios3
March 2020 14
1
10
100
1,000
10,000
100,000
0 2 4 6 8 10 12 14 16 18 20 22 24 26 28 30 32
Italy
S Korea
US
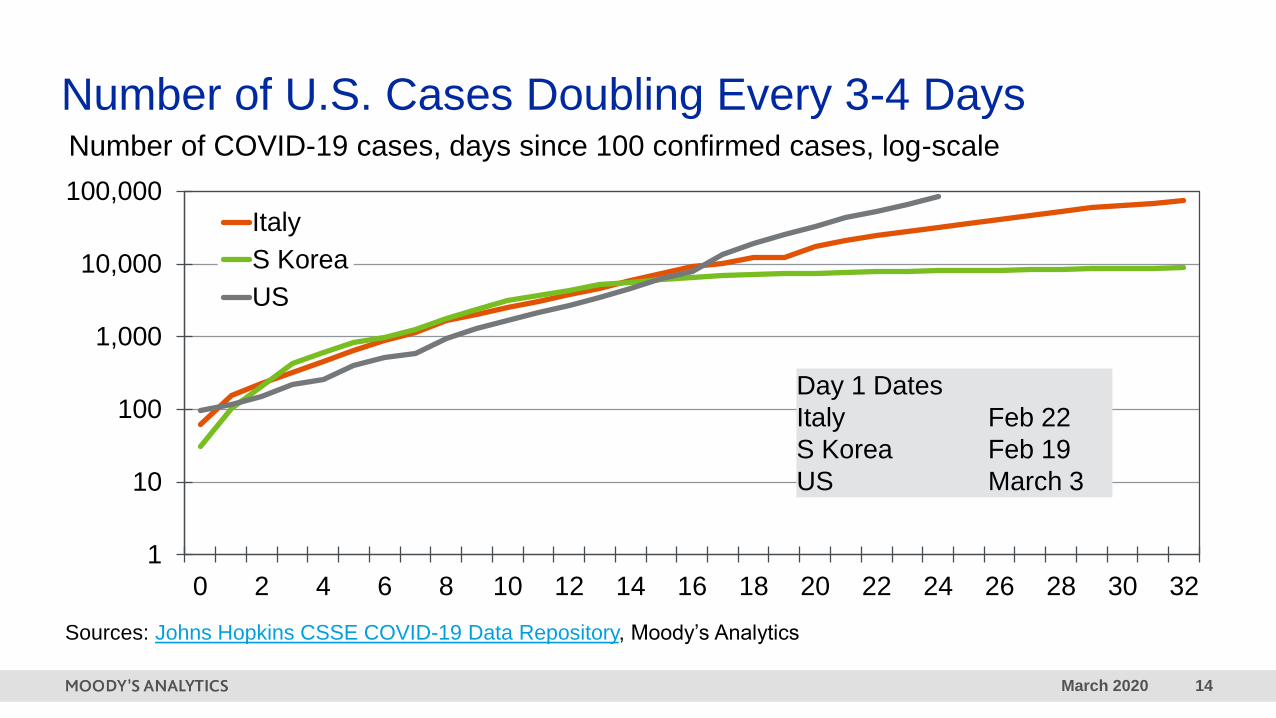
Day 1 Dates
Italy Feb 22
S Korea Feb 19
US March 3
Number of U.S. Cases Doubling Every 3-4 DaysNumber of COVID-19 cases, days since 100 confirmed cases, log-scale
Sources: Johns Hopkins CSSE COVID-19 Data Repository, Moody’s Analytics

March 2020 15
Epidemiological Assumptions
COVID-19
S1 Scenario
• 1-2 mil confirmed U.S. infections
• New infections peak in April
• 1.0% case fatality rate
• 8% hospitalization rate
• Infections abate by June
• 31% excess capacity of hospital beds
• 27% excess capacity of ICU beds
• 30% excess capacity of ventilators
COVID-19
Baseline Forecast
• 3-8 mil confirmed U.S. infections
• New infections peak in May
• 1.5% case fatality rate
• 10% hospitalization rate
• Infections abate by July
• 19% excess capacity of hospital beds
• 4% excess capacity of ICU beds
• 17% excess capacity of ventilators
COVID-19
S3 Scenario
• 9-15 mil confirmed U.S. infections
• New infections peak in June
• 4.5% case fatality rate
• 20% hospitalization rate
• Infections abate by September
• 47% capacity deficit of hospital beds
• 125% capacity deficit of ICU beds
• 56% capacity deficit of ventilators
March 2020 16
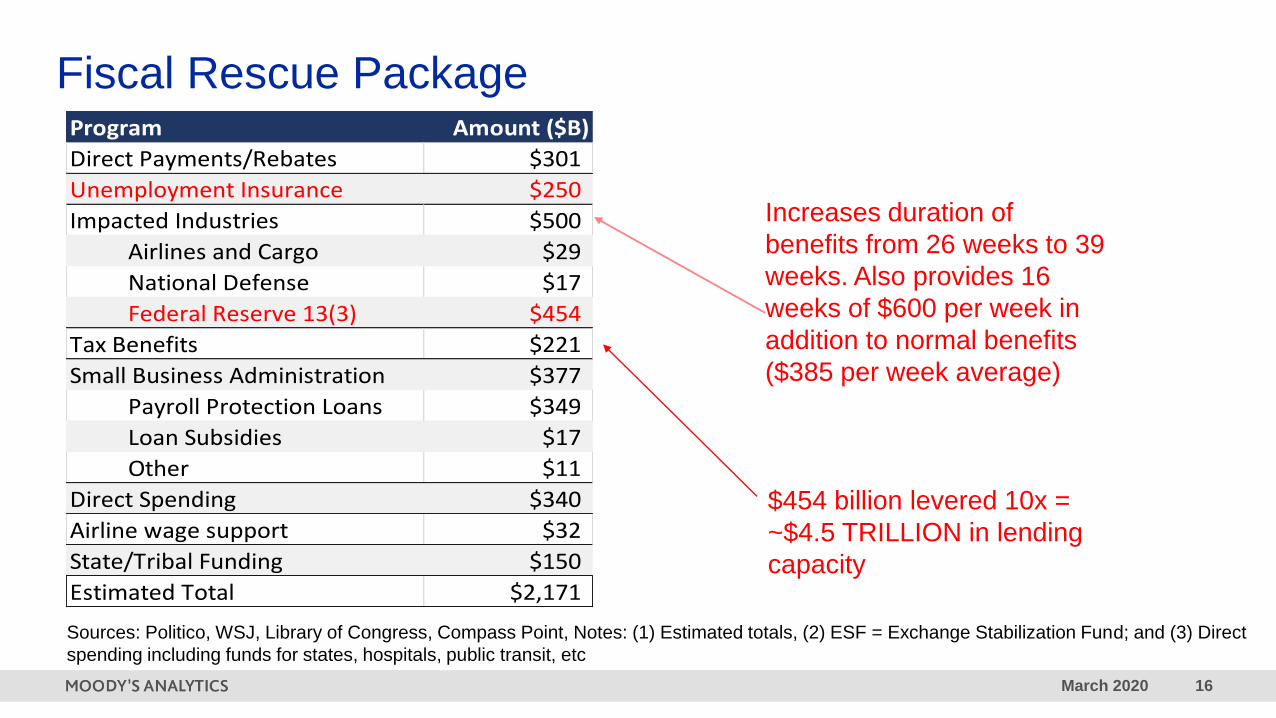
Fiscal Rescue Package
Sources: Politico, WSJ, Library of Congress, Compass Point, Notes: (1) Estimated totals, (2) ESF = Exchange Stabilization Fund; and (3) Direct
spending including funds for states, hospitals, public transit, etc
Program Amount ($B)
Direct Payments/Rebates $301
Unemployment Insurance $250
Impacted Industries $500
Airlines and Cargo $29
National Defense $17
Federal Reserve 13(3) $454
Tax Benefits $221
Small Business Administration $377
Payroll Protection Loans $349
Loan Subsidies $17
Other $11
Direct Spending $340
Airline wage support $32
State/Tribal Funding $150
Estimated Total $2,171
Increases duration of
benefits from 26 weeks to 39
weeks. Also provides 16
weeks of $600 per week in
addition to normal benefits
($385 per week average)
$454 billion levered 10x =
~$4.5 TRILLION in lending
capacity
March 2020 17
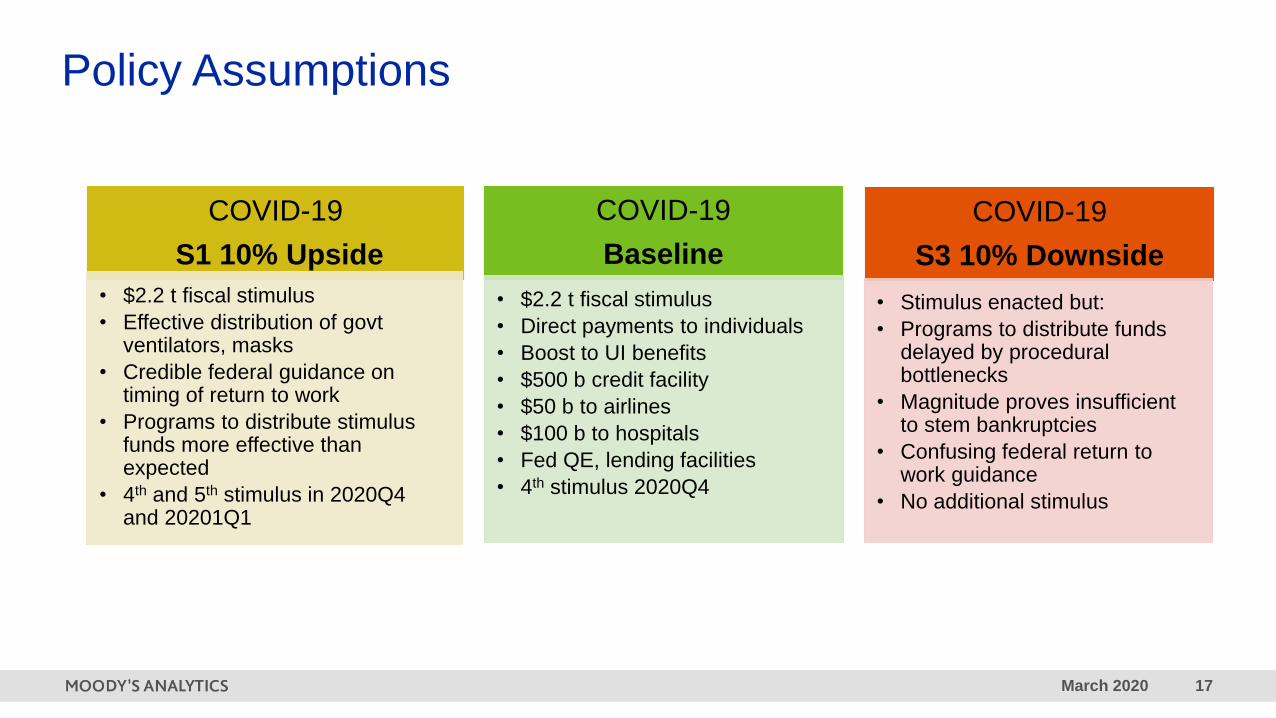
Policy Assumptions
COVID-19
Baseline
• $2.2 t fiscal stimulus
• Direct payments to individuals
• Boost to UI benefits
• $500 b credit facility
• $50 b to airlines
• $100 b to hospitals
• Fed QE, lending facilities
• 4th stimulus 2020Q4
COVID-19
S1 10% Upside
• $2.2 t fiscal stimulus
• Effective distribution of govt ventilators, masks
• Credible federal guidance on timing of return to work
• Programs to distribute stimulus funds more effective than expected
• 4th and 5th stimulus in 2020Q4 and 20201Q1
COVID-19
S3 10% Downside
• Stimulus enacted but:
• Programs to distribute funds delayed by procedural bottlenecks
• Magnitude proves insufficient to stem bankruptcies
• Confusing federal return to work guidance
• No additional stimulus
March 2020 18
0
5
10
15
20
25
Jan-08 Jan-10 Jan-12 Jan-14 Jan-16 Jan-18 Jan-20
U.S. Europe
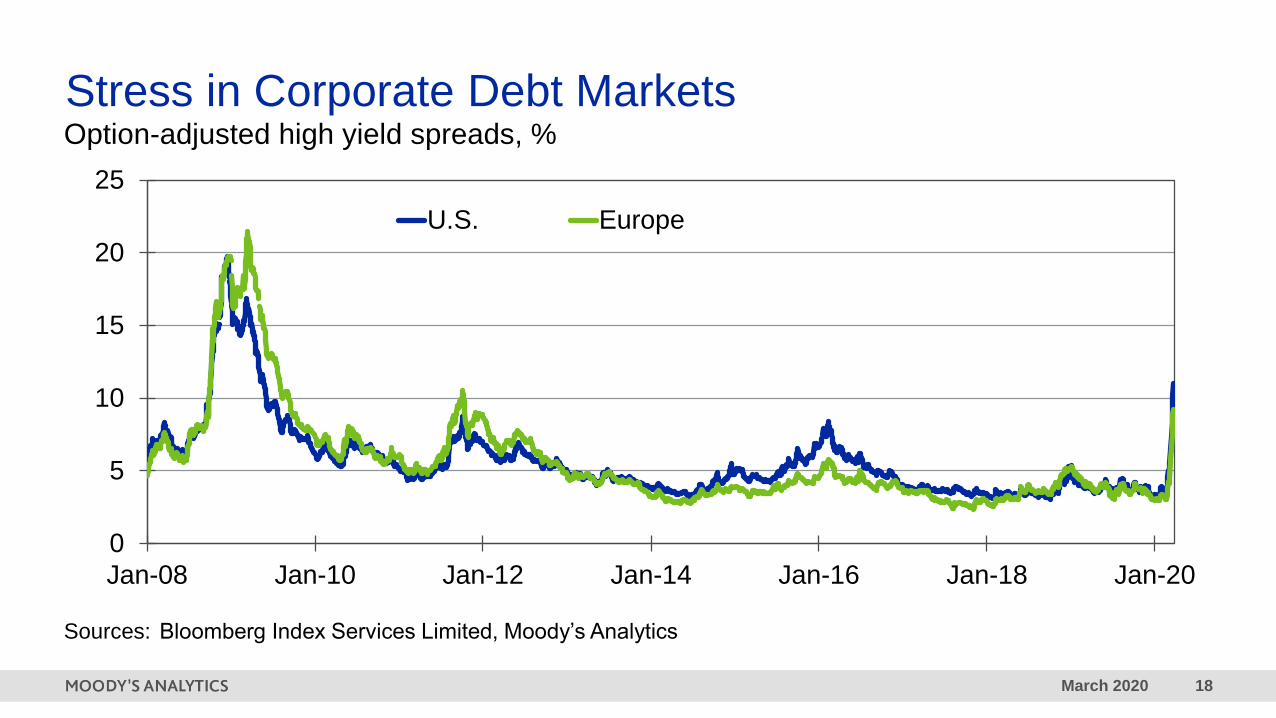
Stress in Corporate Debt MarketsOption-adjusted high yield spreads, %
Sources: Bloomberg Index Services Limited, Moody’s Analytics

March 2020 19
Known Unknowns
COVID-19
Baseline
• How long new cases continue to increase
• Timing of ending of shutdowns
• Effectiveness of stimulus
• Impact on consumer sentiment
• Effects of varying regional responses
COVID-19
S1 10% upside
• Degree to which virus recurs after slowing down
• How fast consumer and business sentiment respond to improving outlook
• Structural changes to economy, e.g., permanent shift to more online retail
COVID-19
S3 10% downside
• Lack of driver of a rebound amid persistence of virus and no second stimulus
• Growing risk taking amid long social dislocation and confusing federal return to work guidance
• Erosion of credit markets amid bankruptcies

March 2020 20
Key Scenario Statistics
COVID-19
Baseline
• Recession in 2020 Q1 and Q2
• Peak unemployment rate near 9% in 2020 Q2
• Peak-to-trough real GDP of almost -6%
• Partial bounce back 2020 Q3, then slow growth
• Acceleration later in 2021
• Return to full employment by 2023
COVID-19
S1 10% Upside
• Milder recession in 2020Q1 and Q2, stronger recovery in 2020Q3 and after
• Peak unemployment 8% in 2020Q2
• Peak-to-trough real GDP of -4%
• Return to full employment by 2022
COVID-19
S3 10% Downside
• Deeper recession in 2020Q1 and Q2, modest rebound in 2020Q3, then renewed decline through 2020Q1
• Peak unemployment 13% in 2020Q2
• Peak-to-trough real GDP of -9%
• Return to full employment by 2025
March 2020 [email protected]
West Chester, EBA-HQ+1.610.235.5299
121 North Walnut Street, Suite 500
West Chester PA 19380
USA
New York, Corporate-HQ+1.212.553.1653
7 World Trade Center, 14th Floor
250 Greenwich Street
New York, NY 10007
USA
London+44.20.7772.5454
One Canada Square
Canary Wharf
London E14 5FA
United Kingdom
Toronto+1.416.681.2133
200 Wellington Street West, 15th Floor
Toronto ON M5V 3C7
Canada
Prague+420.22.422.2929
AFI Butterfly
B1 3rd Floor, Pernerova 691/42
186 00 Prague 8 - Karlin
Czech Republic
Sydney+61.2.9270.8111
Level 10, 1 O'Connell Street
Sydney, NSW, 2000
Australia
Singapore+65.6511.4400
6 Shenton Way
#14-08 OUE Downtown 2
Singapore 068809
Shanghai+86.21.6101.0172
Unit 2306, Citigroup Tower
33 Huayuanshiqiao Road
Pudong New Area, 200120
China
Contact Us: Economics & Business Analytics Offices
March 2020 23
© 2020 Moody’s Corporation, Moody’s Investors Service, Inc., Moody’s Analytics, Inc. and/or their licensors and affiliates (collectively, “MOODY’S”). All
rights reserved.
CREDIT RATINGS ISSUED BY MOODY'S INVESTORS SERVICE, INC. AND ITS RATINGS AFFILIATES (“MIS”) ARE MOODY’S CURRENT
OPINIONS OF THE RELATIVE FUTURE CREDIT RISK OF ENTITIES, CREDIT COMMITMENTS, OR DEBT OR DEBT-LIKE SECURITIES, AND
MOODY’S PUBLICATIONS MAY INCLUDE MOODY’S CURRENT OPINIONS OF THE RELATIVE FUTURE CREDIT RISK OF ENTITIES, CREDIT
COMMITMENTS, OR DEBT OR DEBT-LIKE SECURITIES. MOODY’S DEFINES CREDIT RISK AS THE RISK THAT AN ENTITY MAY NOT MEET ITS
CONTRACTUAL, FINANCIAL OBLIGATIONS AS THEY COME DUE AND ANY ESTIMATED FINANCIAL LOSS IN THE EVENT OF DEFAULT.
CREDIT RATINGS DO NOT ADDRESS ANY OTHER RISK, INCLUDING BUT NOT LIMITED TO: LIQUIDITY RISK, MARKET VALUE RISK, OR PRICE
VOLATILITY. CREDIT RATINGS AND MOODY’S OPINIONS INCLUDED IN MOODY’S PUBLICATIONS ARE NOT STATEMENTS OF CURRENT OR
HISTORICAL FACT. MOODY’S PUBLICATIONS MAY ALSO INCLUDE QUANTITATIVE MODEL-BASED ESTIMATES OF CREDIT RISK AND
RELATED OPINIONS OR COMMENTARY PUBLISHED BY MOODY’S ANALYTICS, INC. CREDIT RATINGS AND MOODY’S PUBLICATIONS DO
NOT CONSTITUTE OR PROVIDE INVESTMENT OR FINANCIAL ADVICE, AND CREDIT RATINGS AND MOODY’S PUBLICATIONS ARE NOT AND
DO NOT PROVIDE RECOMMENDATIONS TO PURCHASE, SELL, OR HOLD PARTICULAR SECURITIES. NEITHER CREDIT RATINGS NOR
MOODY’S PUBLICATIONS COMMENT ON THE SUITABILITY OF AN INVESTMENT FOR ANY PARTICULAR INVESTOR. MOODY’S ISSUES ITS
CREDIT RATINGS AND PUBLISHES MOODY’S PUBLICATIONS WITH THE EXPECTATION AND UNDERSTANDING THAT EACH INVESTOR
WILL, WITH DUE CARE, MAKE ITS OWN STUDY AND EVALUATION OF EACH SECURITY THAT IS UNDER CONSIDERATION FOR PURCHASE,
HOLDING, OR SALE.
MOODY’S CREDIT RATINGS AND MOODY’S PUBLICATIONS ARE NOT INTENDED FOR USE BY RETAIL INVESTORS AND IT WOULD BE
RECKLESS AND INAPPROPRIATE FOR RETAIL INVESTORS TO USE MOODY’S CREDIT RATINGS OR MOODY’S PUBLICATIONS WHEN
MAKING AN
INVESTMENT DECISION. IF IN DOUBT YOU SHOULD CONTACT YOUR FINANCIAL OR OTHER PROFESSIONAL ADVISER.
ALL INFORMATION CONTAINED HEREIN IS PROTECTED BY LAW, INCLUDING BUT NOT LIMITED TO, COPYRIGHT LAW, AND NONE OF SUCH
INFORMATION MAY BE COPIED OR OTHERWISE REPRODUCED, REPACKAGED, FURTHER TRANSMITTED, TRANSFERRED, DISSEMINATED,
REDISTRIBUTED OR RESOLD, OR STORED FOR SUBSEQUENT USE FOR ANY SUCH PURPOSE, IN WHOLE OR IN PART, IN ANY FORM OR
MANNER OR BY ANY MEANS WHATSOEVER, BY ANY PERSON WITHOUT MOODY’S PRIOR WRITTEN CONSENT.
All information contained herein is obtained by MOODY’S from sources believed by it to be accurate and reliable. Because of the possibility of human or
mechanical error as well as other factors, however, all information contained herein is provided “AS IS” without warranty of any kind. MOODY'S adopts
all necessary measures so that the information it uses in assigning a credit rating is of sufficient quality and from sources MOODY'S considers to be
reliable including, when appropriate, independent third-party sources. However, MOODY’S is not an auditor and cannot in every instance independently
verify or validate information received in the rating process or in preparing the Moody’s publications.
To the extent permitted by law, MOODY’S and its directors, officers, employees, agents, representatives, licensors and suppliers disclaim liability to any
person or entity for any indirect, special, consequential, or incidental losses or damages whatsoever arising from or in connection with the information
contained herein or the use of or inability to use any such information, even if MOODY’S or any of its directors, officers, employees, agents,
representatives, licensors or suppliers is advised in advance of the possibility of such losses or damages, including but not limited to: (a) any loss of
present or prospective profits or (b) any loss or damage arising where the relevant financial instrument is not the subject of a particular credit rating
assigned by MOODY’S.
To the extent permitted by law, MOODY’S and its directors, officers, employees, agents, representatives, licensors and suppliers disclaim liability for any
direct or compensatory losses or damages caused to any person or entity, including but not limited to by any negligence (but excluding fraud, willful
misconduct or any other type of liability that, for the avoidance of doubt, by law cannot be excluded) on the part of, or any contingency within or beyond
the control of, MOODY’S or any of its directors, officers, employees, agents, representatives, licensors or suppliers, arising from or in connection with the
information contained herein or the use of or inability to use any such information.
NO WARRANTY, EXPRESS OR IMPLIED, AS TO THE ACCURACY, TIMELINESS, COMPLETENESS, MERCHANTABILITY OR FITNESS FOR ANY
PARTICULAR PURPOSE OF ANY SUCH RATING OR OTHER OPINION OR INFORMATION IS GIVEN OR MADE BY MOODY’S IN ANY FORM OR
MANNER WHATSOEVER.
Moody’s Investors Service, Inc., a wholly-owned credit rating agency subsidiary of Moody’s Corporation (“MCO”), hereby discloses that most issuers of
debt securities (including corporate and municipal bonds, debentures, notes and commercial paper) and preferred stock rated by Moody’s Investors
Service, Inc. have, prior to assignment of any rating, agreed to pay to Moody’s Investors Service, Inc. for appraisal and rating services rendered by it fees
ranging from $1,500 to approximately $2,500,000. MCO and MIS also maintain policies and procedures to address the independence of MIS’s ratings
and rating processes. Information regarding certain affiliations that may exist between directors of MCO and rated entities, and between entities who hold
ratings from MIS and have also publicly reported to the SEC an ownership interest in MCO of more than 5%, is posted annually at www.moodys.com
under the heading “Investor Relations — Corporate Governance — Director and Shareholder Affiliation Policy.”
Additional terms for Australia only: Any publication into Australia of this document is pursuant to the Australian Financial Services License of MOODY’S
affiliate, Moody’s Investors Service Pty Limited ABN 61 003 399 657AFSL 336969 and/or Moody’s Analytics Australia Pty Ltd ABN 94 105 136 972 AFSL
383569 (as applicable). This document is intended to be provided only to “wholesale clients” within the meaning of section 761G of the Corporations Act
2001. By continuing to access this document from within Australia, you represent to MOODY’S that you are, or are accessing the document as a
representative of, a “wholesale client” and that neither you nor the entity you represent will directly or indirectly disseminate this document or its contents
to “retail clients” within the meaning of section 761G of the Corporations Act 2001. MOODY’S credit rating is an opinion as to the creditworthiness of a
debt obligation of the issuer, not on the equity securities of the issuer or any form of security that is available to retail investors. It would be reckless and
inappropriate for retail investors to use MOODY’S credit ratings or publications when making an investment decision. If in doubt you should contact your
financial or other professional adviser.
Additional terms for Japan only: Moody's Japan K.K. (“MJKK”) is a wholly-owned credit rating agency subsidiary of Moody's Group Japan G.K., which is
wholly-owned by Moody’s Overseas Holdings Inc., a wholly-owned subsidiary of MCO. Moody’s SF Japan K.K. (“MSFJ”) is a wholly-owned credit rating
agency subsidiary of MJKK. MSFJ is not a Nationally Recognized Statistical Rating Organization (“NRSRO”). Therefore, credit ratings assigned by MSFJ
are Non-NRSRO Credit Ratings. Non-NRSRO Credit Ratings are assigned by an entity that is not a NRSRO and, consequently, the rated obligation will
not qualify for certain types of treatment under U.S. laws. MJKK and MSFJ are credit rating agencies registered with the
Japan Financial Services Agency and their registration numbers are FSA Commissioner (Ratings) No. 2
and 3 respectively.
MJKK or MSFJ (as applicable) hereby disclose that most issuers of debt securities (including corporate and municipal bonds, debentures, notes and
commercial paper) and preferred stock rated by MJKK or MSFJ (as applicable) have, prior to assignment of any rating, agreed to pay to MJKK or MSFJ
(as applicable) for appraisal and rating services rendered by it fees ranging from JPY200,000 to approximately JPY350,000,000.
MJKK and MSFJ also maintain policies and procedures to address Japanese regulatory requirements.