Moody's Weekly Market Outlook Stronger Dollar Weakens Credit Outlook (Capital Markets Research)7 Aug...
27
AUGUST 6, 2015 CAPITAL MARKETS RESEARCH Moody’s Analytics markets and distributes all Moody’s Capital Markets Research, Inc. materials. Moody’s Capital Markets Research, Inc is a subsidiary of Moody’s Corporation. Moody’s Analytics does not provide investment advisory services or products. For further detail, please see the last page. Stronger Dollar Weakens Credit Outlook Credit Markets Review and Outlook by John Lonski Stronger Dollar Weakens Credit Outlook. » FULL STORY PAGE 2 The Week Ahead We preview economic reports and forecasts from the US, UK/Europe, and Asia/Pacific regions. » FULL STORY PAGE 5 The Long View Check our chart here for forecast summaries of key credit market metrics. Full updated stories, “July’s worldwide issuance of investment- grade corporate bonds soared higher by 54% annually, to $186 billion, which, when compared to previous Julys, was second only to July 2009’s $226 billion,” begin on page 17. » FULL STORY PAGE 17 Ratings Round-Up by Njundu Sanneh More Downgrades than Upgrades for US. » FULL STORY PAGE 20 Market Data Credit spreads, CDS movers, issuance. » FULL STORY PAGE 22 Moody’s Capital Markets Research recent publications Links to commentaries on: bank risk, Unilever, ExxonMobil, CAT, Chevron, Turkey, ANZ, AIG, credit, Ford, Campbell, AXP. » FULL STORY PAGE 26 Credit Spreads Investment Grade: Year-end 2015 spread to resemble its recent 157 bp. High Yield: Recent spread of 520 bp should approximate 510 bp by year-end 2015. Defaults US HY default rate: June 2015, 2.0%; Moody’s Credit Policy Group forecasts 3.0% in 1H2016 Issuance For 2015, US$ IG bond offerings may grow by 23% to $1.388 trillion, while US$ HY bond issuance sinks by -6% to $398 billion. In 2014, US$ IG bond issuance rose by 0.9% to $1.129 trillion, while US$ HY bond issuance dropped by -2.3% to $421 billion. Click here for Moody’s Credit Outlook, our sister publication containing Moody’s rating agency analysis of recent news events, summaries of recent rating changes, and summaries of recent research. Moody’s Capital Markets Research, Inc. Weekly Market Outlook Contributors: David W. Munves, CFA 1.212.553.2844 [email protected] John Lonski 1.212.553.7144 [email protected] Ben Garber 1.212.553.4732 [email protected] Njundu Sanneh 1.212.553.4036 [email protected] Yukyung Choi 1.212.553.0906 [email protected] Irina Baron 1.212.553.4307 [email protected] Franklin Kim 1.212.553.4419 [email protected] Xian (Peter) Li 1.212.553.1404 [email protected] Moody's Analytics/Europe: Tomas Holinka 1.420 ( 221) 666-384 [email protected] Moody's Analytics/Asia-Pacific: Emily Dabbs 1.612.9270.8159 [email protected] Faraz Syed 1.612.9270.8146 [email protected] Editor Dana Gordon 1.212.553.0398 [email protected]
description
report
Transcript of Moody's Weekly Market Outlook Stronger Dollar Weakens Credit Outlook (Capital Markets Research)7 Aug...
WEEKLY MARKET OUTLOOK
AUGUST 6, 2015
CAPITAL MARKETS RESEARCH
Moody’s Analytics markets and distributes all Moody’s Capital Markets Research, Inc. materials. Moody’s Capital Markets Research, Inc is a subsidiary of Moody’s Corporation. Moody’s Analytics does not provide investment advisory services or products. For further detail, please see the last page.
Stronger Dollar Weakens Credit Outlook
Credit Markets Review and Outlook by John Lonski Stronger Dollar Weakens Credit Outlook.
» FULL STORY PAGE 2
The Week Ahead We preview economic reports and forecasts from the US, UK/Europe, and Asia/Pacific regions.
» FULL STORY PAGE 5
The Long View Check our chart here for forecast summaries of key credit market metrics. Full updated stories, “July’s worldwide issuance of investment-grade corporate bonds soared higher by 54% annually, to $186 billion, which, when compared to previous Julys, was second only to July 2009’s $226 billion,” begin on page 17.
» FULL STORY PAGE 17
Ratings Round-Up by Njundu Sanneh More Downgrades than Upgrades for US.
» FULL STORY PAGE 20
Market Data Credit spreads, CDS movers, issuance.
» FULL STORY PAGE 22
Moody’s Capital Markets Research recent publications Links to commentaries on: bank risk, Unilever, ExxonMobil, CAT, Chevron, Turkey, ANZ, AIG, credit, Ford, Campbell, AXP.
» FULL STORY PAGE 26
Credit Spreads
Investment Grade: Year-end 2015 spread to resemble its recent 157 bp. High Yield: Recent spread of 520 bp should approximate 510 bp by year-end 2015.
Defaults US HY default rate: June 2015, 2.0%; Moody’s Credit Policy Group forecasts 3.0% in 1H2016
Issuance For 2015, US$ IG bond offerings may grow by 23% to $1.388 trillion, while US$ HY bond issuance sinks by -6% to $398 billion. In 2014, US$ IG bond issuance rose by 0.9% to $1.129 trillion, while US$ HY bond issuance dropped by -2.3% to $421 billion.
Click here for Moody’s Credit Outlook, our sister publication containing Moody’s rating agency analysis of recent news events, summaries of recent rating changes, and summaries of recent research.
Moody’s Capital Markets Research, Inc.
Weekly Market Outlook Contributors: David W. Munves, CFA 1.212.553.2844 [email protected] John Lonski 1.212.553.7144 [email protected] Ben Garber 1.212.553.4732 [email protected] Njundu Sanneh 1.212.553.4036 [email protected] Yukyung Choi 1.212.553.0906 [email protected] Irina Baron 1.212.553.4307 [email protected] Franklin Kim 1.212.553.4419 [email protected] Xian (Peter) Li 1.212.553.1404 [email protected]
Moody's Analytics/Europe: Tomas Holinka 1.420 ( 221) 666-384 [email protected]
Moody's Analytics/Asia-Pacific: Emily Dabbs 1.612.9270.8159 [email protected] Faraz Syed 1.612.9270.8146 [email protected]
Editor Dana Gordon 1.212.553.0398 [email protected]
CAPITAL MARKETS RESEARCH
2 AUGUST 6, 2015 CAPITAL MARKETS RESEARCH, INC. / MARKET OUTLOOK / MOODYS.COM
Credit Markets Review and Outlook
Credit Markets Review and Outlook By John Lonski, Chief Economist, Moody’s Capital Markets Research, Inc.
Stronger Dollar Weakens Credit Outlook Both the expectation and the realization of higher US interest rates should send the dollar exchange rate up to new cycle highs. The ongoing appreciation of the dollar exchange rate stems from the US’s relatively better growth outlook vis-a-vis the rest of the world. However, an unduly strong dollar risks constraining the global competitiveness of US-based production and reducing US corporate profits by enough to significantly weaken prospects for US business activity.
Compared to the respective averages of 2011-2013, the dollar was recently up by 81% against Brazil's real, 46% versus Japan’s yen, 31% versus Canada's dollar, 28% against Mexico’s peso, 22% against the euro, and 21% versus India’s rupee. Moreover, according to the same serial comparison, the dollar recently was higher by 19% versus a broad basket of foreign currencies and up by 25% in terms of major foreign currencies.
A ratcheting up of fed funds seems appropriate if only because the US economy probably no longer requires the support of an extraordinarily accommodative monetary policy. Nevertheless, by doing so the Fed may have greater difficulty at getting the annual rate of PCE price index inflation up from June’s 0.2% to its long-term target of 2.0%. Higher short-term interest rates are likely to further appreciate the dollar exchange rate and, thereby, put additional downward pressure not only on industrial commodity prices, but on the prices of internationally traded goods and services as well.
Thus, financial markets are less than convinced that fed funds will be hiked even marginally at the next FOMC meeting of September 17. The futures market recently assigned only a 46% probability to a lifting of the target range for fed funds from the current 0% to 0.25% to 0.25% to 0.5%. However, the futures market senses a 73% chance that the fed funds rate will end 2015 in a range that is either at or above 0.25% to 0.5%.
Moody’s industrial metals price just fell to its lowest reading since July 29, 2009, which was at the end of the first month of the now 73-month long economic recovery. The latest -26.8% year-to-year plunge by this reliable indicator of global industrial activity reflects an ample surfeit of world production capacity vis-a-vis global expenditures. Continued dollar exchange rate appreciation risks worsening the plight of countries and companies having meaningful direct exposure to industrial commodities.
Dollar’s Surge of Late 1990s Curbed Inflation Despite Rapid GDP Growth The dollar last experienced a comparable upswing amid a well-established economic recovery during the late 1990s and into 2000. Partly in response to 1996-2000’s -1.5% average annual rate of deflation for the US import price index excluding petroleum imports, the average annual rate of core PCE price index inflation slowed from 1991-1995’s 2.7% to 1996-2000’s 1.6% notwithstanding an accompanying acceleration by the average annual rate of real GDP growth from 2.6% to 4.3%.
Neither did a climb by the ratio of payrolls to the working-age population from 1995’s 59.1% to1999’s 62.2% prevent a deceleration by core PCE price index inflation. By contrast, payrolls recently approximated a comparatively slack 56.6% of working-age Americans. Given the strong dollar and considerable underutilization outside the US, faster wage growth in the US may have the unwanted effect of further impeding the competitiveness of US production to the eventual detriment of the US labor market.
However, Strong Dollar of Late 1990s Crimped Profits and Helped Widen Spreads Dollar strength helped to curb the average annualized growth rate of pretax profits from current production from the 11.0% of the five-years-ended 1995 to the 2.1% of the five-years-ended 2000. Yearlong 2000’s -5.9% annual contraction by profits helped to trigger 2001’s recession.
The moving yearlong average of profits from current production has already slowed from the 14.9% of the three-years-ended March 2012 to the 3.3% of the three-years-ended March 2015. An even stronger dollar portends a further deceleration by profits, if not an outright annual contraction.
Late 1990s Showed National Activity Index Was Better than GDP at Explaining Spreads Despite faster than 4% real GDP growth, corporate credit quality deteriorated amid the last extended episode of dollar appreciation. After averaging 368 bp during January 1994 through July 1998, the high-yield bond spread would then average 611 bp for the remainder of the recovery, or until February 2001.
CAPITAL MARKETS RESEARCH
3 AUGUST 6, 2015 CAPITAL MARKETS RESEARCH, INC. / MARKET OUTLOOK / MOODYS.COM
Credit Markets Review and Outlook
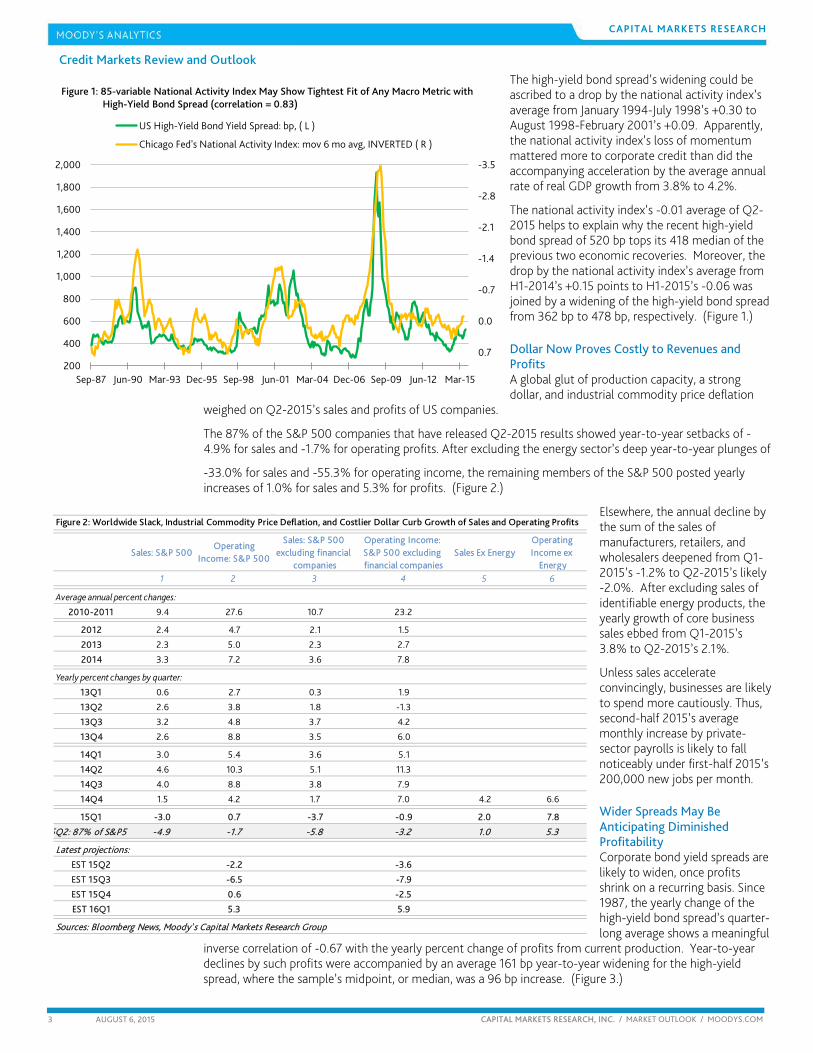
The high-yield bond spread’s widening could be ascribed to a drop by the national activity index’s average from January 1994-July 1998’s +0.30 to August 1998-February 2001’s +0.09. Apparently, the national activity index’s loss of momentum mattered more to corporate credit than did the accompanying acceleration by the average annual rate of real GDP growth from 3.8% to 4.2%.
The national activity index’s -0.01 average of Q2-2015 helps to explain why the recent high-yield bond spread of 520 bp tops its 418 median of the previous two economic recoveries. Moreover, the drop by the national activity index’s average from H1-2014’s +0.15 points to H1-2015’s -0.06 was joined by a widening of the high-yield bond spread from 362 bp to 478 bp, respectively. (Figure 1.)
Dollar Now Proves Costly to Revenues and Profits A global glut of production capacity, a strong dollar, and industrial commodity price deflation
weighed on Q2-2015’s sales and profits of US companies.
The 87% of the S&P 500 companies that have released Q2-2015 results showed year-to-year setbacks of -4.9% for sales and -1.7% for operating profits. After excluding the energy sector’s deep year-to-year plunges of
-33.0% for sales and -55.3% for operating income, the remaining members of the S&P 500 posted yearly increases of 1.0% for sales and 5.3% for profits. (Figure 2.)
Elsewhere, the annual decline by the sum of the sales of manufacturers, retailers, and wholesalers deepened from Q1-2015’s -1.2% to Q2-2015’s likely -2.0%. After excluding sales of identifiable energy products, the yearly growth of core business sales ebbed from Q1-2015’s 3.8% to Q2-2015’s 2.1%.
Unless sales accelerate convincingly, businesses are likely to spend more cautiously. Thus, second-half 2015’s average monthly increase by private-sector payrolls is likely to fall noticeably under first-half 2015’s 200,000 new jobs per month.
Wider Spreads May Be Anticipating Diminished Profitability Corporate bond yield spreads are likely to widen, once profits shrink on a recurring basis. Since 1987, the yearly change of the high-yield bond spread’s quarter-long average shows a meaningful
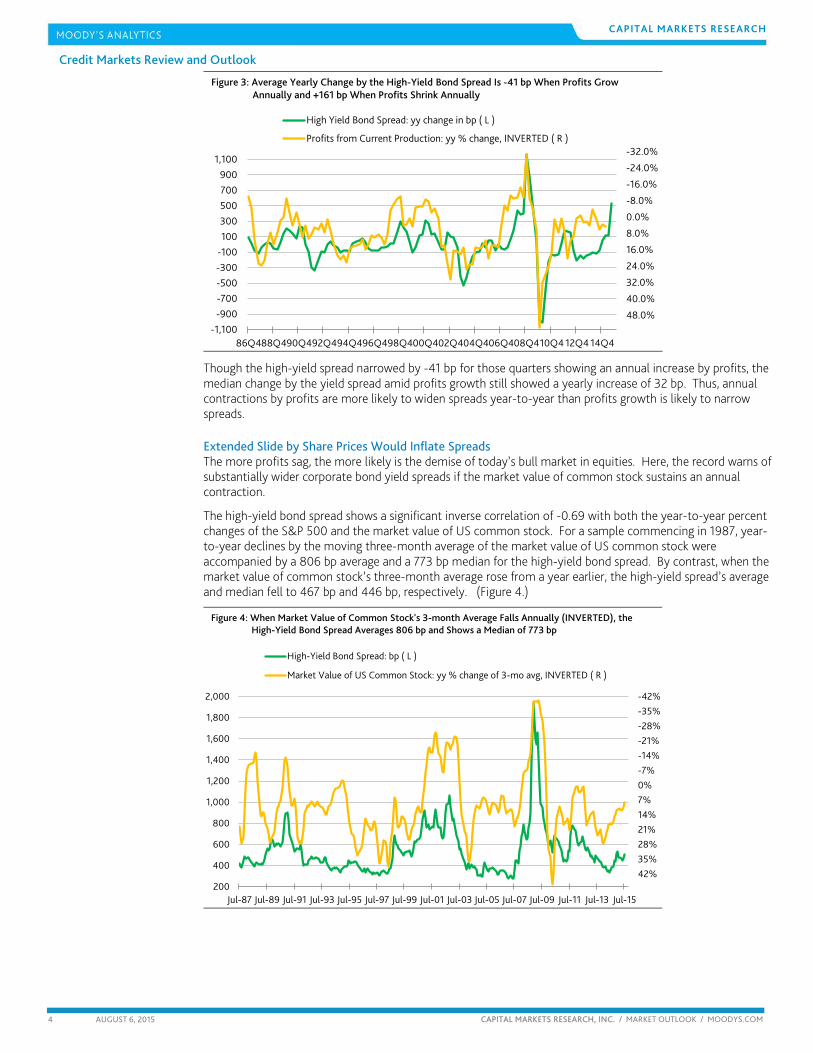
inverse correlation of -0.67 with the yearly percent change of profits from current production. Year-to-year declines by such profits were accompanied by an average 161 bp year-to-year widening for the high-yield spread, where the sample’s midpoint, or median, was a 96 bp increase. (Figure 3.)
Sales: S&P 500 Operating
Income: S&P 500
Sales: S&P 500 excluding financial
companies
Operating Income: S&P 500 excluding financial companies
Sales Ex Energy Operating Income ex
Energy1 2 3 4 5 6
Average annual percent changes:
2010-2011 9.4 27.6 10.7 23.2
2012 2.4 4.7 2.1 1.5
2013 2.3 5.0 2.3 2.7
2014 3.3 7.2 3.6 7.8
Yearly percent changes by quarter:
13Q1 0.6 2.7 0.3 1.9
13Q2 2.6 3.8 1.8 -1.3
13Q3 3.2 4.8 3.7 4.2
13Q4 2.6 8.8 3.5 6.0
14Q1 3.0 5.4 3.6 5.1
14Q2 4.6 10.3 5.1 11.3
14Q3 4.0 8.8 3.8 7.9
14Q4 1.5 4.2 1.7 7.0 4.2 6.6
15Q1 -3.0 0.7 -3.7 -0.9 2.0 7.8
5Q2: 87% of S&P5 -4.9 -1.7 -5.8 -3.2 1.0 5.3
Latest projections:EST 15Q2 -2.2 -3.6
EST 15Q3 -6.5 -7.9
EST 15Q4 0.6 -2.5
EST 16Q1 5.3 5.9
Sources: Bloomberg News, Moody' s Capital Markets Research Group
Figure 2: Worldwide Slack, Industrial Commodity Price Deflation, and Costlier Dollar Curb Growth of Sales and Operating Profits
-3.5
-2.8
-2.1
-1.4
-0.7
0.0
0.7200
400
600
800
1,000
1,200
1,400
1,600
1,800
2,000
Sep-87 Jun-90 Mar-93 Dec-95 Sep-98 Jun-01 Mar-04 Dec-06 Sep-09 Jun-12 Mar-15
US High-Yield Bond Yield Spread: bp, ( L )
Chicago Fed's National Activity Index: mov 6 mo avg, INVERTED ( R )
Figure 1: 85-variable National Activity Index May Show Tightest Fit of Any Macro Metric with High- High-Yield Bond Spread (correlation = 0.83)
CAPITAL MARKETS RESEARCH
4 AUGUST 6, 2015 CAPITAL MARKETS RESEARCH, INC. / MARKET OUTLOOK / MOODYS.COM
Credit Markets Review and Outlook
-32.0%
-24.0%
-16.0%
-8.0%
0.0%
8.0%
16.0%
24.0%
32.0%
40.0%
48.0%-1,100
-900-700-500-300-100100300500700900
1,100
86Q488Q490Q492Q494Q496Q498Q400Q402Q404Q406Q408Q410Q4 12Q4 14Q4
High Yield Bond Spread: yy change in bp ( L )
Profits from Current Production: yy % change, INVERTED ( R )
Figure 3: Average Yearly Change by the High-Yield Bond Spread Is -41 bp When Profits Grow Annuall Annually and +161 bp When Profits Shrink Annually
Though the high-yield spread narrowed by -41 bp for those quarters showing an annual increase by profits, the median change by the yield spread amid profits growth still showed a yearly increase of 32 bp. Thus, annual contractions by profits are more likely to widen spreads year-to-year than profits growth is likely to narrow spreads.
Extended Slide by Share Prices Would Inflate Spreads The more profits sag, the more likely is the demise of today’s bull market in equities. Here, the record warns of substantially wider corporate bond yield spreads if the market value of common stock sustains an annual contraction.
The high-yield bond spread shows a significant inverse correlation of -0.69 with both the year-to-year percent changes of the S&P 500 and the market value of US common stock. For a sample commencing in 1987, year-to-year declines by the moving three-month average of the market value of US common stock were accompanied by a 806 bp average and a 773 bp median for the high-yield bond spread. By contrast, when the market value of common stock’s three-month average rose from a year earlier, the high-yield spread’s average and median fell to 467 bp and 446 bp, respectively. (Figure 4.)
-42%-35%-28%-21%-14%-7%0%7%14%21%28%35%42%
200
400
600
800
1,000
1,200
1,400
1,600
1,800
2,000
Jul-87 Jul-89 Jul-91 Jul-93 Jul-95 Jul-97 Jul-99 Jul-01 Jul-03 Jul-05 Jul-07 Jul-09 Jul-11 Jul-13 Jul-15
High-Yield Bond Spread: bp ( L )
Market Value of US Common Stock: yy % change of 3-mo avg, INVERTED ( R )
Figure 4: When Market Value of Common Stock's 3-month Average Falls Annually (INVERTED), the High High-Yield Bond Spread Averages 806 bp and Shows a Median of 773 bp
The Week Ahead
CAPITAL MARKETS RESEARCH
5 AUGUST 6, 2015 CAPITAL MARKETS RESEARCH, INC. / MARKET OUTLOOK / MOODYS.COM
The Week Ahead – US, Europe, Asia-Pacific
THE US By John Lonski and Ben Garber Moody’s Capital Markets Research Group Estimates are consensus views. Release times are US Eastern Daylight Time
FRIDAY, AUGUST 7
Employment Report – July Time: 8:30 am Forecast: 225,000 nonfarm payrolls, 5.3% unemployment rate July nonfarm payrolls are in line to expand by over 200,000 for the third straight month. Yet more attention may fall on the monthly change in average hourly wages after showing no growth in June. Signs that labor market slack is dissipating raise the probability that wage growth will accelerate in the near future. The broad underemployment rate that includes part-time workers who want full-time jobs fell 1.5% yearly in June to the seven-year low of 10.5%.
TUESDAY, AUGUST 11
Productivity & Unit Labor Costs – Second Quarter Preliminary Time: 8:30 am Forecast: 1.4% productivity, -0.2% unit labor costs The second quarter rebound in output can allow productivity to expand for the first time in three quarters. Hiring concentrated among lower skilled workers and the lack of technological progress has kept productivity growth at an anemic 0.5% annualized over the past two years. That pace raises questions about price pressures with unit labor costs rising at the snappier 2.2% yearly pace over the same span.
THURSDAY, AUGUST 13
Retail Sales – July Time: 8:30 am Forecast: 0.5% overall, 0.5% ex auto A sizable boost in July auto sales can help overall retail sales recover from a June decline. Despite the volatile retail data in recent months, real consumer spending expanded 3.1% year-over-year last quarter, putting the economy on firm footing. And with personal income rising a consistent 0.4% in each month of the second quarter, consumers have the resources to support sturdy if unspectacular retail results.
Import Price Index – July Time: 8:30 am Forecast: -1.0% Renewed declines in oil and other commodities can send the Import Price Index in July to its largest monthly loss in six months. Prior to the raw materials slump of recent weeks, the index was down 10% yearly to June, broadly limiting US price pressures. The diminished global growth prospects reflected by these trends are strengthening the US dollar and greatly limiting potential inflation in the US.
Business Inventories – June Time: 10:00 am Forecast: 0.3% Significant inventory building in recent months may clip US growth in the quarters ahead. Inventory growth in excess of a $120 billion annualized pace in the first half of this year greatly outstripped last year’s $81
The Week Ahead
CAPITAL MARKETS RESEARCH
6 AUGUST 6, 2015 CAPITAL MARKETS RESEARCH, INC. / MARKET OUTLOOK / MOODYS.COM
billion total. As firms adjust their stockpiling downward in future months, the pace of overall real US output growth may struggle to reach 3%.
FRIDAY, AUGUST 14
Producer Price Index – July Time: 8:30 am Forecast: 0.1% overall, 0.1% core The July Producer Price Index is forecast to eke out a gain before the full impact of the ongoing decline in fuel costs is felt. Long-term trends in business costs are especially mild with the overall PPI falling 0.7% yearly to June as the core measure rose just 0.8%. That brings little immediate need for business to pass higher costs onto consumers, who themselves are struggling with muted wage gains.
Industrial Production & Capacity Utilization – July Time: 9:15 am Forecast: 0.3% industrial production, 78.0% Industrial production in July may put together a second consecutive month of expansion for the first time in nearly a year. Though the overall ISM Manufacturing Index dipped in July, the production component rose to the new year-to-date high, giving output on a strong start for the second half of this year. After falling in June, auto production can lead overall industrial output higher thanks to the robust pace of vehicle sales.
University of Michigan Consumer Sentiment – August Preliminary Time: 10:00 am Forecast: 94.0 The August sentiment reading from Michigan can bring some improvement on July’s figure as lower gas prices start to trickle down to consumers. In July, gasoline prices declined for three straight weeks for the first time since February, and further drops are in the pipeline. With the Michigan survey highly sensitive to fuel costs, that trend can keep sentiment on the rise and translate into increased spending on non-fuel items.
EUROPE By the Dismal (Europe) staff in London and Prague Release times are Greenwich Mean Time.
Focus: Eurozone economy muddles through Eurozone manufacturers proved resilient against the Greek debt crisis, a Markit survey shows. Although the Purchasing Managers’ Index ticked down to 52.4 in July from 52.5 in June, it has stayed in expansionary territory since July 2013 and remains close to a 14-month high. French manufacturing continued to slide in July, while business activity ramped up in Austria, Italy, the Netherlands and Spain, and more moderately in Germany. The Greek PMI signaled the strongest contraction since 1999, outdoing the slump in 2012.
Next week brings preliminary estimates of output growth in the euro area for the second quarter. On average, the expansion of the single-currency region likely held steady at 0.4% q/q in the three months to June. The weaker euro and strengthening recoveries in key trade partners likely boosted demand for the region’s exports. Germany's expansion probably accelerated to 0.4% q/q from 0.3% at the start of the year, while in Italy GDP growth likely held steady at 0.3% q/q. We expect French output growth decelerated to 0.2% q/q in the second quarter from 0.6% previously, and that the U.K.'s GDP growth accelerated to 0.7% q/q.
The Week Ahead
CAPITAL MARKETS RESEARCH
7 AUGUST 6, 2015 CAPITAL MARKETS RESEARCH, INC. / MARKET OUTLOOK / MOODYS.COM
The euro area's sluggish recovery is giving little support to inflation, which likely held at 0.2% y/y in July. In Germany, consumer price growth probably eased to 0.4% y/y from 0.5% previously, while in Spain it likely dropped to zero from 0.1% in June. Inflation in France likely ticked up to 0.4% y/y from 0.3% in the previous month. The downturn in Brent crude oil prices to around $50 per barrel in early August could dampen inflation across Europe in coming months.
FRIDAY, AUGUST 7
France – Industrial Production – June Time: 7:45 a.m. BST Forecast: 0.2% France’s industrial production is expected to have ticked up in June on both a month-over-month and a year-ago basis. Demand for local products likely remained under pressure from the slow recovery, tight credit, and slack demand from France’s key euro zone trading partners, together with uncertainty due to developments surrounding Greece and in Ukraine and Russia. The manufacturing PMI in France increased to 50.7 in June from 49.4 in the previous stanza—an emergence from contractionary territory. Also, it was the first time in 14 months that the manufacturing sector expanded in France.
France – Fiscal balance – June Time: 8:00 a.m. BST Forecast: -€59 billion France’s fiscal deficit is expected to be €59 billion for June, a 0.7% improvement from a year earlier. France's 2014 deficit was 4% of GDP, 0.1 percentage point lower than in 2013, and likely will not go below 3% until 2017. Spending by central and local governments, including for social welfare programs, was cut by about €15 billion in 2014 and will be trimmed by an additional €50 billion by 2017. A freeze on public sector salaries, a cap on other state expenditures, and lower contributions to the EU budget have also helped with consolidation.
France – Trade balance – June Time: 8:00 a.m. BST Forecast: -€3.9 billion France’s foreign trade deficit likely shrank somewhat (seasonally adjusted) in June because of stronger exports. Nevertheless, despite recent improvements, export activity remains subdued, and will creep forward only slowly as France struggles with relatively low competitiveness and external demand from other euro zone countries picks up at a snail's pace.
Spain – Industrial Production – June Time: 8:05 a.m. BST Forecast: 5% Spain’s industrial production likely expanded 5% in June from a year earlier—its best result in more than five years. Export-manufacturing has picked up its pace in recent months thanks to improved price competitiveness, reflecting lower unit labor costs and a weaker euro. Euro zone demand is also increasing as the region’s economies recover.
Russian Federation – House Prices – 2015Q2 Time: 9:20 a.m. BST Forecast: 1.2% The inflation of house prices in Russia likely decelerated to 1.2% quarter over quarter in the second quarter, from 1.7% previously. While still positive, the price growth is decelerating on account of lack of demand. According to Rosstat, construction posted a 5.2% annual decline in the second quarter, and a 10% decline in June alone.
United Kingdom – Foreign Trade – June Time: 9:30 a.m. BST Forecast: -£9.3 billion The U.K. foreign trade deficit probably widened in June after it narrowed substantially in the previous month. Exports likely remained under pressure from the weak economic recovery in the euro zone, which contains key destinations for U.K. exports, and the recent strengthening of the trade-weighted pound
The Week Ahead
CAPITAL MARKETS RESEARCH
8 AUGUST 6, 2015 CAPITAL MARKETS RESEARCH, INC. / MARKET OUTLOOK / MOODYS.COM
making British goods and services less cost competitive. Meanwhile, solid domestic demand probably supported imports.
Germany – Industrial Production – June Time: 11:00 a.m. BST Forecast: 0.2% German industrial production was unchanged in May from the previous month but advanced 2.2% year over year. Manufacturing will remain under pressure in the coming months, as weak domestic and external demand has been weighing on the economy. The ZEW indicator of economic sentiment fell to 29.7 from 31.5 in June, while the ZEW indicator for the current situation rose to 63.9 from 62.9. Meanwhile, the Markit manufacturing PMI for June rose to 51.9 from 51.1 the previous month. We expect that industrial production added 0.2% in June from the previous month.
MONDAY, AUGUST 10
France – GDP – 2015Q2 Time: 6:30 a.m. BST Forecast: 0.2% The French economy likely expanded 0.2% q/q in the second quarter with private consumption, a key growth driver, contributing to the growth despite being under pressure from high unemployment, tight credit and high taxes. Producers' confidence has increased as firms start to benefit from stronger domestic demand and to accumulate more inventories. Fixed investment has stalled, however, with banks still cautious about lending in an uncertain economy. Public consumption has edged higher, but the government's meagre efforts to bring its finances to order continue to weigh on it. Despite a slight rise in exports, external trade likely contributed little to second quarter growth.
Germany – Foreign Trade – June Time: 8:00 a.m. BST Forecast: €21.5 billion Germany's trade surplus has been under strain because of the euro zone’s sluggish recovery. Political tensions with Russia and a slowdown in Asia, particularly China, have crimped exports. A bright spot is the weakening euro, which held at $1.12 in June and is expected to depreciate further in the second half of the year. This has boosted exports outside the single-currency region. The foreign trade surplus likely narrowed slightly in June from the previous month but expanded in year-ago terms.
United Kingdom – Halifax Housing Price Index – July Time: 9:30 a.m. BST Forecast: 8.5% U.K. house prices rose in month-ago terms in June for the fourth consecutive month. The increase was the largest since the start of this year, according to Halifax Bank. House prices were also up in year-ago terms. The housing market will come under pressure in the coming months from the prospect of official interest rates starting to rise next year, the recent introduction of tighter mortgage loan standards, and already-high prices. House prices likely continued to climb in July, but the rate of increase probably eased to 8.5% y/y.
Russian Federation – Foreign Trade – June Time: 10:00 a.m. BST Forecast: US$16 billion Russia's merchandise trade balance has been hovering around US$15 billion since late 2010, and we expect this trend to continue. The June balance likely reached $16 billion on the back of increased volumes of crude oil exports. The depreciating ruble likely contributed through cheaper exports and more expensive imports.
OECD – Composite Leading Indicators – June Time: 11:00 a.m. BST Forecast: 99.9 The OECD's composite leading indicators in July likely averaged 99.9 on the back of disappointing second quarter U.S. output data and, more important, equity market turbulence in China. The leading euro zone
The Week Ahead
CAPITAL MARKETS RESEARCH
9 AUGUST 6, 2015 CAPITAL MARKETS RESEARCH, INC. / MARKET OUTLOOK / MOODYS.COM
countries have shown little to no improvement, which limits the contribution of periphery countries to the average measure.
TUESDAY, AUGUST 11
Italy – Consumer Price Index – July Time: 9:00 a.m. BST Forecast: 0.4% Italy’s national CPI remained at 0.2% y/y and harmonized consumer price growth accelerated to 0.4% in July from 0.2% in June, according to the preliminary estimates. Excluding energy, inflation was stable at 0.8%, while core inflation picked up to 0.8% in July. Although low oil prices will push total inflation lower, the recovery and weaker euro will contribute to higher inflation pressure. Italy’s economy emerged from recession in the three months to March, with real GDP rising 0.3% q/q, but the Purchasing Managers’ Index for manufacturing and services eased to a four-month low of 53.5 in July, indicating slower growth.
WEDNESDAY, AUGUST 12
Italy – Foreign Trade – June Time: 9:00 a.m. BST Forecast: €3.9 billion Italy’s merchandise trade surplus likely widened to €3.9 billion in May from €3.3 billion a year earlier. Economic recovery in the euro zone and low oil prices contributed to the widening surplus. The weakening euro likely boosted Italy’s exports outside the euro zone, since the nominal effective exchange rate for Italy declined by almost 5% in June from a year earlier. Italy’s exporters should also benefit from a new bailout deal between Greece and its creditors, avoiding a Greek exit from the euro zone for now.
United Kingdom – Employment Situation – July Time: 9:30 a.m. BST Forecast: 5.6% Unemployed The U.K. headline ILO-harmonized unemployment rate for the three months to May rose marginally to 5.6% from a six-year low previously. The main driver was a fall in the employment rate while the participation rate held steady. The claimant count jobless rate—which is one month ahead of the ILO data—in June was unchanged from a six-year low previously. The unemployment rate thus probably held steady at 5.6% in the three months to June.
Euro Zone – Industrial Production – June Time: 10:00 a.m. BST Forecast: 0.2% Euro zone industrial production likely expanded in June in month- and year-ago terms. July's PMI edged lower to 52.4 from 52.5 in June, signaling a modest deceleration in the rate of expansion of euro zone manufacturing. Economic performance was uneven across the region. Growth in output, new orders and employment was recorded across the consumer, intermediate and investment goods sectors in July, the same as in June.
THURSDAY, AUGUST 13
Germany – Consumer Price Index – July Time: 7:00 a.m. BST Forecast: 0.4% Annual inflation in Germany slowed further in July, preliminary estimates show. Consumer prices likely increased by 0.2% y/y, following a 0.3% rise in the previous month. Leading the slowdown was a steeper drop in energy prices, by 6.2% y/y, after they fell 5.9% in June because of a renewed decline in oil prices. The price of Brent crude recently fell to $50 per barrel. The Bundesbank's measure of inflation thus probably decreased to 0.4% y/y in July from 0.5% in the previous month.
The Week Ahead
CAPITAL MARKETS RESEARCH
10 AUGUST 6, 2015 CAPITAL MARKETS RESEARCH, INC. / MARKET OUTLOOK / MOODYS.COM
France – Consumer Price Index – July Time: 7:45 a.m. BST Forecast: 0.4% France’s annual EU-harmonized consumer price growth likely ticked up to 0.4% in July. We expect that year-on-year prices of fuels were still low, while the prices of high-value-added imports likely increased. The euro has remained weak against the U.S. dollar, putting mild upward pressure on prices. But despite the recovery, domestic demand in France has not driven up the price level since high unemployment continues to weigh on it.
Spain – Consumer Price Index – July Time: 8:05 a.m. BST Forecast: 0% Spain’s consumer price index remained flat year on year in July, after rising 0.1% in June for the first gain in 12 months. Global oil prices look to have found a floor, which is pushing up transport and utility costs, and this will filter through to a broader rise in prices. The weak euro is also helping to drive up prices, as imports become more expensive. As the domestic economy continues to recover, inflation should start to pick up.
France – Nonfarm Payrolls – 2015Q2 Time: 8:15 a.m. BST Forecast: 15.8 million French nonfarm payrolls likely were broadly unchanged in the second quarter. The weak labor market, low margins, and uncertain business segment have kept the number of payrolls subdued and contributed to weak hiring. The number of French job seekers remained high in June, with the number of people actively seeking work rising by 2,000 to 3.55 million. The labor market is not expected to pick up until the final quarter of 2015.
FRIDAY, AUGUST 14
Germany – Preliminary GDP – 2015Q2 Time: 7:00 a.m. BST Forecast: 0.4% German GDP advanced 0.3% q/q in the first quarter, following a 0.7% increase in the previous stanza. Driving the expansion was domestic demand, especially household consumption, while net exports decreased. The expansion was likely little changed at around 0.4% q/q in the three months to June, supported by the weakening euro, which dropped to $1.11 on average in the second quarter from $1.13 in the previous stanza. In annual terms, GDP growth likely accelerated slightly to 1.4% from 1% at the start of the year.
Spain – Industrial Orders – June Time: 8:00 a.m. BST Forecast: 2.2% Spain’s new industrial orders grew 2.2% year on year in June, down from the previous month’s 3.5% gain. Exporters are benefiting from a relatively weak euro, while strong domestic demand is boosting orders for consumption goods. After surprisingly robust growth in May, we expect capital goods orders softened slightly in June. The energy industry will continue to exert downward pressure, as global energy prices remain subdued.
Italy – Preliminary GDP – 2015Q2 Time: 9:00 a.m. BST Forecast: 0.3% Italy’s economy likely continued to grow in the three months to June, following a 0.3% increase in the first quarter. The composite Purchasing Managers’ Index was in expansionary territory, above the threshold of 50, in June for the seventh month. While manufacturing activity picked up to its fastest pace since April 2011, growth in the service sector slowed further in July but remains solid enough to support job creation. The economy is supported by the weaker euro, low oil prices, and flowing medium-term credit, but elevated unemployment and slack wage growth weigh on household consumption.
The Week Ahead
CAPITAL MARKETS RESEARCH
11 AUGUST 6, 2015 CAPITAL MARKETS RESEARCH, INC. / MARKET OUTLOOK / MOODYS.COM
United Kingdom – GDP Expenditure Breakdown – 2015Q2 Time: 9:30 a.m. BST Forecast: 0.7% U.K. economic growth accelerated in the three months to June, with real GDP expanding 0.7% compared with a revised 0.4% in the first quarter. The largest contribution to real GDP was likely from fixed investment, followed by private consumption and government spending. Net exports probably were a drag because of the weakness of the euro zone economy and the pound’s appreciation against the euro, which kept a lid on the region’s demand for British exports. Moody’s Analytics expects U.K. growth will moderate to about 2.4% this year from 3% in 2014, but the first quarter GDP data suggest that the risks to the forecast are to the downside.
Germany – ZEW Indicator of Economic Sentiment – August Time: 10:00 a.m. BST Forecast: 30 Investor confidence worsened again in Germany in July. The ZEW indicator of economic sentiment fell to 29.7 from 31.5 in June, while the ZEW indicator for the current situation rose to 63.9 from 62.9. Sentiment likely remained under pressure in August because of the Chinese stock market crash and continued troubles with the Greek debt deal, despite an agreement being reached. The ZEW sentiment indicator thus probably was little changed from July, rising marginally to 30.
Euro Zone – Consumer Price Index – July Time: 10:00 a.m. BST Forecast: 0.2% Euro zone consumer prices increased 0.2% y/y in July, the same as in the previous month. Inflation should gather momentum in coming months as oil deflation eases and food price growth gains ground. The euro's depreciation will also likely push up import prices, contributing to higher inflation. To accelerate price growth the European Central Bank held interest rates steady at a record low in July while maintaining its bond purchases through its Expanded Asset Purchase Program, under which the bank buys €60 billion in assets per month. The program will continue until September 2016 or until inflation moves closer to target.
Euro Zone – Provisional GDP – 2015Q2 Time: 10:00 a.m. BST Forecast: 0.4% Growth in the euro zone in the three months to June likely was 0.4% q/q, the same as the previous quarter's growth, according to the Purchasing Managers’ Index. The June PMI took the average index for the second quarter to a four-year high as new business orders and employment continued to expand at healthy rates. The weaker euro and recoveries in key trading partners will boost demand for the region’s exports. The Greek crisis seems unlikely to dampen the rest of the euro zone, but even with the risk of a Greek exit diminishing, soft investment growth will continue to drag on long-term potential growth in the euro area.
Russian Federation – Government Finance – June Time: 2:00 p.m. BST Forecast: -RUB700 billion Russia's federal budget likely posted a deficit of RUB700 billion in June. The budget has been under significant pressure since the beginning of the year, and the government is trying to optimize the expenditure structure to ease the pressures, more crucial as international crude oil prices still hover below $60 per barrel.
The Week Ahead
CAPITAL MARKETS RESEARCH
12 AUGUST 6, 2015 CAPITAL MARKETS RESEARCH, INC. / MARKET OUTLOOK / MOODYS.COM
ASIA-PACIFIC By Emily Dabbs and the Asia-Pacific Staff of Moody’s Analytics Release times are Greenwich Mean Time
China's July data will show a tentative improvement in the economy China’s July data will likely show a slight improvement in the economy. Retail sales and industrial production are expected to grow steadily as domestic demand picks up. There are signs of a slight rebound in consumer inflation as the housing market turns a corner, while low global commodity prices continue to push down producer prices. Fixed asset investment is also expected to pick up, as monetary easing boosts bank lending. It is unclear if foreign trade will continue its tentative recovery, while foreign capital inflow will remain soft.
Singapore, Malaysia and Hong Kong all have second quarter GDP figures out this week. Singapore’s growth is expected to soften as the housing downturn and weak electronic exports weigh on the economy. Malaysian growth is also expected to slow because of low global oil prices and subdued global demand. Hong Kong will likely grow just 0.1% q/q as China’s slower income growth hurts trade, retail and financial sectors.
FRIDAY, AUGUST 7
Indonesia – GDP – 2015Q2 Time: 5:00 p.m. GMT Forecast: 5% y/y The Indonesian economy likely expanded 5% y/y in the June quarter, after growing 4.7% in the March quarter. President Joko Widodo's reform agenda has struggled in recent times, as infrastructure investment remains low. Meanwhile, the ASEAN powerhouse continues to be hurt by lower commodity prices. Exports have fallen, and the external sector will likely be a drag on growth in the coming year. Low import demand also suggests that government spending and private investment failed to increase strongly in the second quarter. We expect below potential growth to continue until reforms are delivered.
Australia – Housing Finance – June Time: 1:30 a.m. GMT Forecast: 3.6% m/m Owner-occupied housing finance likely partially rebounded in June, after slumping by 6.1% m/m in May. Demand for housing in the eastern states is strong, fuelling mortgage finance. But conditions are subdued elsewhere. The Australian Prudential Regulation Authority, Australia's financial regulator, is working behind the scenes to cool investor participation, particularly in the Sydney and Melbourne markets. This is having an effect at the margins, and with big banks forced to increase the cost of lending to investors, further cooling in home loan demand can be expected.
Japan – Monetary Policy – August Time: 5:00 a.m. GMT Forecast: ¥80 trillion The Bank of Japan will maintain its expansionary monetary stance, continuing to expand asset purchases at an annual rate of ¥80 trillion. The BoJ refrained from reopening the stimulus taps in July even as Greek debt woes and China’s stock turmoil caused gyrations in financial markets. On balance, the BoJ will probably need to ease monetary policy again in 2015, as energy prices are likely to stay lower for longer if sanctions are eased on Iranian production, throwing its inflation target in doubt.
Taiwan – Foreign Trade – July Time: 8:00 a.m. GMT Forecast: US$1.8 billion Taiwan’s trade surplus is expected to narrow to US$1.8 billion in July from US$2.2 billion in June. Weak global demand is hurting exports, while low global oil prices keep a lid on import prices. Taiwan has few major trade agreements outside China, making it highly reliant on mainland demand for export growth. While stronger U.S. demand will boost Taiwan exports somewhat, softening Chinese demand will continue to be a drag through the second half of 2015.
SUNDAY, AUGUST 9
The Week Ahead
CAPITAL MARKETS RESEARCH
13 AUGUST 6, 2015 CAPITAL MARKETS RESEARCH, INC. / MARKET OUTLOOK / MOODYS.COM
China – Consumer Price Index – July Time: 1:30 a.m. GMT Forecast: 1.4% Inflation pressures remain soft in China but there are signs of a rebound, or at least an end to the disinflation. The housing market is turning a corner, with sales in Tier 1 cities surging. The disinflationary impact of lower oil prices is starting to fade, and nonfood inflation has steadily trended higher since January.
China – Producer Price Index – July Time: 1:30 a.m. GMT Forecast: -4.9% Producer prices in China remain in deflation because of continued price declines for mining and other raw materials goods. The boost to activity from looser monetary policy is yet to occur, so Chinese producers still have significant overcapacity. Any rebound is not likely until year's end after monetary easing takes full effect on the real economy, the housing market cycle decisively turns up, and investment increases.
MONDAY, AUGUST 10
China – Monetary Aggregates – July Time: 4:00 p.m. GMT Forecast: 12.5% The People's Bank of China's monetary easing measures are starting to take effect, with bank lending and money supply growth accelerating. Interest rate and reserve ratio cuts are increasing the demand for and supply of credit. The stock market volatility in July may have cut margin lending activity, but the housing market's steady recovery would have increased demand for loans.
China – Foreign Trade – July Time: 4:00 p.m. GMT Forecast: US$38 billion China's foreign trade activity showed tentative recovery in June, but it is unclear if improvements persisted into July. Exports rebounded thanks to higher U.S. and ASEAN demand, but weakness from Europe and Japan continues to drag. Manufacturers were less optimistic in the month, suggesting that exports are flagging. Meanwhile there were signs that the trough in commodity imports has passed, but the stock market volatility in the month may have curtailed imports as firms wait to assess the impact.
Malaysia – Industrial Production – June Time: 4:01 a.m. GMT Forecast: 3.4% Industrial production likely softened in June, rising 3.4% year on year, down from 4.5% in May. Soft global demand is dragging on Malaysia’s key industries: tech and commodities. The manufacturing purchasing managers’ index remained in contraction territory in July, with production and new orders falling. Production should start to rebound in late 2015 as the global economy strengthens.
Japan – Consumer Confidence – July Time: 5:00 a.m. GMT Forecast: 41.5 Japan’s consumer confidence index likely fell to 41.5 in July from 41.7 in June, remaining below the neutral 50 level. The index averaged 41.5 in the second quarter. The rout in global financial markets, linked to Greece’s debt woes and China’s equity jitters, likely hurt sentiment in July, as more than 30% of Japan’s population own shares. Outside of that, rising wages and lower unemployment are supporting prospects around jobs, incomes and spending plans.
OECD – Composite Leading Indicators – June Time: 10:00 a.m. GMT Forecast: 99.9 OECD's composite leading indicators in July likely averaged 99.9 on the back of somewhat disappointing second quarter U.S. output data, but most important by the equity market turbulence in China. The leading euro zone countries have shown little to no improvement, thus limiting the positive contribution to the average measure stemming from periphery countries.
The Week Ahead
CAPITAL MARKETS RESEARCH
14 AUGUST 6, 2015 CAPITAL MARKETS RESEARCH, INC. / MARKET OUTLOOK / MOODYS.COM
TUESDAY, AUGUST 11
India – Foreign Trade – July Time: 6:30 p.m. GMT Forecast: -US$11.1 billion India's monthly trade deficit likely widened to US$11.1 billion in July. Exports remain under pressure, as global demand has failed to fire in recent months. Uncertainty around Greece's position in the euro zone, along with mixed demand from the U.S., suggests that demand from India's key export markets was likely mute. Imports are likely to fall. Monsoon rains in India have been closer to the long-term average, suggesting less need to import food items from overseas. We expect the trade weakness to persist in coming months, as export-oriented manufacturers are reluctant to increase investment.
Philippines – Industrial Production – June Time: 4:30 a.m. GMT Forecast: -1.2% Philippine industrial production likely improved in June, after falling 3.1% y/y in May. The sharp decline in oil-related production in year-on-year terms likely eased by June with prices recovering. Government stimulus will also lift domestic-facing food production through the second half of 2015.
WEDNESDAY, AUGUST 12
South Korea – Employment – July Time: 11:00 p.m. GMT Forecast: 4% unemployed Korea’s unemployment rate likely rose to 4% in June, from May’s 3.9%. Employment likely fell as the export-driven economy struggles with softer global demand and the fallout from the Middle East Respiratory Syndrome outbreak. The outbreak is hurting consumer sentiment, and this likely drove participation down as well. Youth unemployment will also remain high as the government struggles to implement labor market reform.
Singapore – GDP - Final – 2015Q2 Time: 12:00 a.m. GMT Forecast: 1.5% The housing downturn and continued weakness in electronics exports have weighed down Singapore's economy. Public infrastructure investment has boosted growth somewhat, but the economy is expected to grow below potential for the foreseeable future. Slower currency appreciation could help export competitiveness in coming months, but gains are likely to be minimal.
Japan – Industry Activity Indexes – June Time: 4:30 a.m. GMT Forecast: -0.5% Japan’s services activity index posted a third consecutive month-on-month decline in May, a trend that likely continued in June. Spring wage increases are lending support to retail trade, but other domestic-oriented industries are struggling. The cheaper yen is good for manufacturers but is hurting local operators because it increases input costs and contributes to reduced domestic trade.
China – Fixed Asset Investment – July Time: 5:30 a.m. GMT Forecast: 11.8% There are signs of an investment rebound in China. Past monetary easing, including the 115 basis points of interest rate cuts since November, is helping the housing market and starting to boost real investment. Declines in mining investment are retreating, while public investment in rail and utilities is accelerating.
China – Industrial Production – July Time: 5:30 a.m. GMT Forecast: 7%
The Week Ahead
CAPITAL MARKETS RESEARCH
15 AUGUST 6, 2015 CAPITAL MARKETS RESEARCH, INC. / MARKET OUTLOOK / MOODYS.COM
Industrial activity in China has picked up on the back of a recovery in electrical machinery, automobiles, and other manufactured goods, suggesting that domestic and external consumer demand is picking up. However, housing-related sectors such as steel and cement production remain weak, as does mining-related output. Monetary stimulus should encourage a steady rebound in the second half of the year.
China – Retail Sales – July Time: 5:30 a.m. GMT Forecast: 10.6% Retail spending was slightly stronger than expected in June, but it is unclear if gains persisted into July. Stock market volatility would have cut spending among those in the middle class who own stock. The housing market, while rebounding in Tier 1 cities, remains in a slump nationwide. Continued declines in fuel costs would have cut spending in nominal terms.
India – Industrial Production – June Time: 12:00 p.m. GMT Forecast: 3.2% India's industrial production has been volatile in 2015. Production likely expanded 3.2% y/y in June. There has been no sustained uptick in production throughout the year, and government's failure to deliver reforms is largely to blame. Manufacturing, the industry touted by the government to drive growth, has been most disappointing. For India to grow at potential, production must increase 7% to 8% consistently. Thursday, August 13
Japan – Machinery Orders – June Time: 11:50 p.m. GMT Forecast: -2.5% Core machinery orders posted a third straight monthly gain in May, a positive sign for Prime Minister Shinzo Abe's economic policies, which rest on increasing business investment. That said, the data are vulnerable to a decline in June, as the series is notoriously volatile. Statistical nuances aside, the mix in orders is still uneven. Manufacturing orders are rising solidly, in part thanks to the cheaper yen, while the sluggish domestic economy weighs on non-manufacturers.
South Korea – Monetary Policy – August Time: 1:15 a.m. GMT Forecast: 1.5% The Bank of Korea is expected to keep rates on hold at a record low 1.5% in August. High levels of household debt are a concern for the central bank as it tries to boost a lagging economy while maintaining financial stability. Korea grew a subdued 0.3% through the June quarter as soft global demand weighed on exports and the MERS outbreak hit consumer spending. The government has announced a fiscal stimulus package which should boost growth in coming months, taking pressure off the BoK to ease monetary conditions further.
Malaysia – GDP – 2015Q2 Time: 4:00 a.m. GMT Forecast: 5.1% Malaysia’s economy likely grew 5.1% year on year in the June quarter, down from 5.5% in the opening quarter of 2015. Exports are the main drag, driven by soft global demand and low oil prices. This filters through to the domestic economy, as unemployment rises and consumers reduce spending plans. Capital expenditure should remain buoyant as government infrastructure projects come on line. Malaysia’s economy should pick up later this year as the global economy strengthens.
FRIDAY, AUGUST 14
China – Foreign Direct Investment – July Time: 4:00 p.m. GMT Forecast: US$8 billion Foreign capital inflows into China have been soft because of the overcapacity in the real economy and stock market volatility. Expectations of a lower yuan may also be deterring capital inflows. Demand for capital is being met by domestic banks, helped by lower interest rates and lower reserve ratios.

The Week Ahead
CAPITAL MARKETS RESEARCH
16 AUGUST 6, 2015 CAPITAL MARKETS RESEARCH, INC. / MARKET OUTLOOK / MOODYS.COM
New Zealand – Retail Trade – 2015Q2 Time: 10:45 p.m. GMT Forecast: 0.9% New Zealand retail trade likely cooled from the outsize 2.7% q/q gain in the March quarter. Whilst retail trade is bustling in Auckland thanks to wealth effects from the booming property market, elsewhere it has softened as the falling terms of trade hurt national income growth. The central bank's easing bias should lift consumer sentiment and spending in the second half of 2015.
India – Wholesale Price Index – July Time: 6:45 a.m. GMT Forecast: -2.2% India's wholesale prices likely fell 2.2% y/y in July. Some upward pressure may come from food articles due to seasonal vagaries, but we still expect a broad-based decline in prices because of lower energy and manufactured-good costs. The falling WPI confirms that India continues to operate under a negative output gap. We believe further rate cuts are on the agenda, as demand has failed to ignite.
Hong Kong – GDP – 2015Q2 Time: 8:14 a.m. GMT Forecast: 0.1% Hong Kong’s economy probably barely grew in the second quarter. The trade, retail and financial sectors have been hit particularly hard by China’s slower income growth and crackdown on corruption. Real GDP likely rose just 0.1% on a quarter-ago basis in the second quarter, down from the first quarter’s 0.4% gain. The year-on-year rate likely hovered around 2%, its average for the past three years.
The Week Ahead
CAPITAL MARKETS RESEARCH
17 AUGUST 6, 2015 CAPITAL MARKETS RESEARCH, INC. / MARKET OUTLOOK / MOODYS.COM
The Long View
The US: July’s worldwide issuance of investment-grade corporate bonds soared higher by 54% annually, to $186 billion, which, when compared to previous Julys, was second only to July 2009’s $226 billion By John Lonski, Chief Economist, and Ben Garber, Economist, Moody’s Capital Markets Research Group, August 6, 2015 CREDIT SPREADS As measured by Moody's long-term average corporate bond yield, the recent investment grade corporate bond yield spread of 157 bp was above its 122-point mean of the two previous economic recoveries. Any narrowing by this spread may be limited by more cash- or debt-funded acquisitions, spin-offs, stock buybacks, and dividends. Subpar growth by business sales and profits will also add to credit risk, as will a rising risk of high-yield defaults.
The recent high-yield bond spread of 520 bp approximates what might be inferred from a forecasting model that employs the average high-yield expected default frequency metric, the Chicago Fed’s national activity index, and the VIX index. In view of how the investment-grade financial company bond yield spread widened from its 110 bp average of the 12-months-ended May 2015 to a recent 137 bp, the financial system may be slightly less willing to supply liquidity in the event of an adverse shock. Moreover, the implications for liquidity of regulatory changes merit above-average scrutiny.
DEFAULTS The US's trailing 12-month high-yield default rate was 2.0% in June 2015, which inched up from the 1.9% of both May 2015 and June 2014. The default rate is projected to approach 3% by December 2015.
Sufficient liquidity and core profits growth should rein in defaults for now.
US CORPORATE BOND ISSUANCE After advancing by 33% annually in 2012 to a record $1.134 trillion, 2013’s US$-denominated investment grade (IG) bond issuance dipped by -1.5% to $1.119 trillion. Following 2012’s 48% annual surge, US$-denominated high yield bond issuance advanced by 11% to a record $431 billion in 2013. Also, after gaining 5% in 2012, newly rated high yield bank loan programs increased by 38% annually to $579 billion in 2013.
In 2014, US$-denominated bond issuance edged up by 0.7% annually for IG, to $1.127 trillion and dropped by -2.7% to $419 billion for high yield. Also, newly rated bank loan programs from high yield issuers plunged by -17% in 2014 to $480 billion, which was far under 2007’s record $661 billion.
Second-quarter 2014’s worldwide corporate bond issuance posted year-over-year advances of 15% for IG and 53% for high-yield, wherein dollar-denominated bond offerings increased by 5% for IG and advanced by 32% for high-yield.
Q3-2014’s worldwide corporate bond issuance revealed annual decline of -10.2% for IG and a rise of 0.4% for high-yield that included setbacks for US$-denominated issuance of -15% for IG and -1% for high-yield.
Q4-2014’s worldwide corporate bond issuance showed annual percent changes of a 3.8% increase for IG and a -19.7% plunge for high-yield. At the same time, US$-denominated offerings advanced by 17% for IG and sank by -9% for high yield.
Q1-2015’s worldwide corporate bond issuance increased annually by 9.5% for investment-grade and by 12.1% for high-yield; US$-priced offerings the advances were 23% and 29%, respectively.
According to a preliminary estimate, Q2-2015’s worldwide offerings of corporate bonds showed annual percent changes of +5% for IG and -35% for high-yield, wherein US$-denominated supply soared higher by 31% for IG and plunged by -21% for high yield.
For yearlong 2015, worldwide corporate bond offerings are likely to rise by 6% annually for IG and fall by -12% for high yield.
Through the first 31 weeks of 2015, the year-over-year percent changes for corporate bond issuance were +25.3% for US$-denominated investment-grade, -4.8% for US$-denominated high-yield, -11.0% for euro-denominated investment-grade, and -40.0% for euro-denominated high-yield.
In 2015, a growing number of bond issues and newly-rated bank loan programs will fund acquisitions and shareholder compensation. Companies will resort to acquisitions and divestitures in order to better cope
The Long View The Long View
The Week Ahead
CAPITAL MARKETS RESEARCH
18 AUGUST 6, 2015 CAPITAL MARKETS RESEARCH, INC. / MARKET OUTLOOK / MOODYS.COM
with the US’s subpar recovery. To the degree companies fear significantly higher bond yields, pre-fundings will rise.
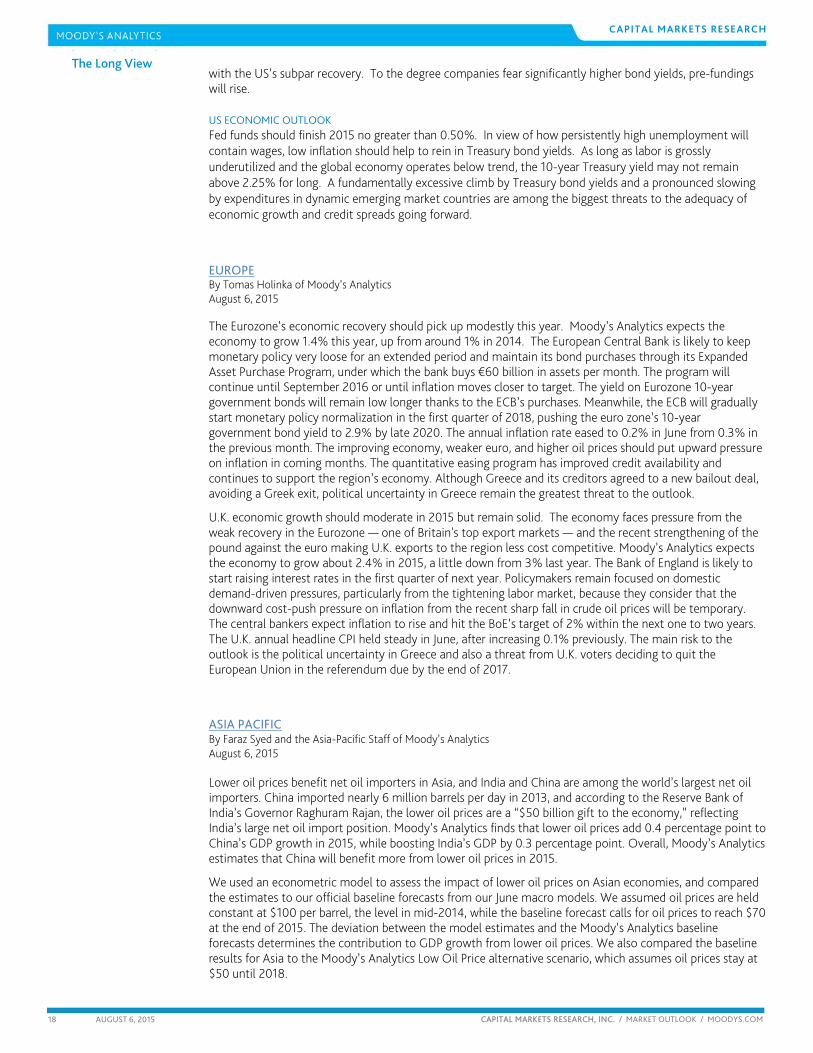
US ECONOMIC OUTLOOK Fed funds should finish 2015 no greater than 0.50%. In view of how persistently high unemployment will contain wages, low inflation should help to rein in Treasury bond yields. As long as labor is grossly underutilized and the global economy operates below trend, the 10-year Treasury yield may not remain above 2.25% for long. A fundamentally excessive climb by Treasury bond yields and a pronounced slowing by expenditures in dynamic emerging market countries are among the biggest threats to the adequacy of economic growth and credit spreads going forward.
EUROPE By Tomas Holinka of Moody’s Analytics August 6, 2015 The Eurozone’s economic recovery should pick up modestly this year. Moody’s Analytics expects the economy to grow 1.4% this year, up from around 1% in 2014. The European Central Bank is likely to keep monetary policy very loose for an extended period and maintain its bond purchases through its Expanded Asset Purchase Program, under which the bank buys €60 billion in assets per month. The program will continue until September 2016 or until inflation moves closer to target. The yield on Eurozone 10-year government bonds will remain low longer thanks to the ECB’s purchases. Meanwhile, the ECB will gradually start monetary policy normalization in the first quarter of 2018, pushing the euro zone’s 10-year government bond yield to 2.9% by late 2020. The annual inflation rate eased to 0.2% in June from 0.3% in the previous month. The improving economy, weaker euro, and higher oil prices should put upward pressure on inflation in coming months. The quantitative easing program has improved credit availability and continues to support the region’s economy. Although Greece and its creditors agreed to a new bailout deal, avoiding a Greek exit, political uncertainty in Greece remain the greatest threat to the outlook.
U.K. economic growth should moderate in 2015 but remain solid. The economy faces pressure from the weak recovery in the Eurozone — one of Britain's top export markets — and the recent strengthening of the pound against the euro making U.K. exports to the region less cost competitive. Moody’s Analytics expects the economy to grow about 2.4% in 2015, a little down from 3% last year. The Bank of England is likely to start raising interest rates in the first quarter of next year. Policymakers remain focused on domestic demand-driven pressures, particularly from the tightening labor market, because they consider that the downward cost-push pressure on inflation from the recent sharp fall in crude oil prices will be temporary. The central bankers expect inflation to rise and hit the BoE’s target of 2% within the next one to two years. The U.K. annual headline CPI held steady in June, after increasing 0.1% previously. The main risk to the outlook is the political uncertainty in Greece and also a threat from U.K. voters deciding to quit the European Union in the referendum due by the end of 2017.
ASIA PACIFIC By Faraz Syed and the Asia-Pacific Staff of Moody’s Analytics August 6, 2015 Lower oil prices benefit net oil importers in Asia, and India and China are among the world’s largest net oil importers. China imported nearly 6 million barrels per day in 2013, and according to the Reserve Bank of India’s Governor Raghuram Rajan, the lower oil prices are a “$50 billion gift to the economy,” reflecting India’s large net oil import position. Moody’s Analytics finds that lower oil prices add 0.4 percentage point to China’s GDP growth in 2015, while boosting India’s GDP by 0.3 percentage point. Overall, Moody’s Analytics estimates that China will benefit more from lower oil prices in 2015.
We used an econometric model to assess the impact of lower oil prices on Asian economies, and compared the estimates to our official baseline forecasts from our June macro models. We assumed oil prices are held constant at $100 per barrel, the level in mid-2014, while the baseline forecast calls for oil prices to reach $70 at the end of 2015. The deviation between the model estimates and the Moody’s Analytics baseline forecasts determines the contribution to GDP growth from lower oil prices. We also compared the baseline results for Asia to the Moody’s Analytics Low Oil Price alternative scenario, which assumes oil prices stay at $50 until 2018.
The Long View
The Week Ahead
CAPITAL MARKETS RESEARCH
19 AUGUST 6, 2015 CAPITAL MARKETS RESEARCH, INC. / MARKET OUTLOOK / MOODYS.COM
The boost to China’s trade position is small, as oil consumption per capita is much lower than in other countries, partially because the country has a large rural population; most of the gains from lower oil prices accrue to urban areas. The same holds for India, where the rural-urban divide is even larger.
If oil prices stayed at around $50 per barrel until 2018, as in our alternative scenario, then oil-reliant India benefits more than China, reflecting the varying paths the economies are taking.
Chinese policymakers are focusing on consumption-led growth and slowing investment, which reduces oil demand. Indian policymakers, on the other hand, are on an infrastructure investment drive, as the economy suffers from chronic supply bottlenecks.
In the Low Oil Price scenario, Indian policymakers are able to use the savings from lower fuel to lift spending on ailing railways, transport and energy industries. The government’s “Made in India” program results in higher manufacturing output. Lower input costs boost manufacturing profits, increasing foreign investment and wider spending across the economy.
Overall, India receives a cumulative boost of around 3.2 percentage points to GDP through 2018 under the Low Oil Price scenario, while China’s GDP is increased by about 1.4 percentage points over the same period.
The Week Ahead
CAPITAL MARKETS RESEARCH
20 AUGUST 6, 2015 CAPITAL MARKETS RESEARCH, INC. / MARKET OUTLOOK / MOODYS.COM
Ratings Round-Up By Njundu Sanneh
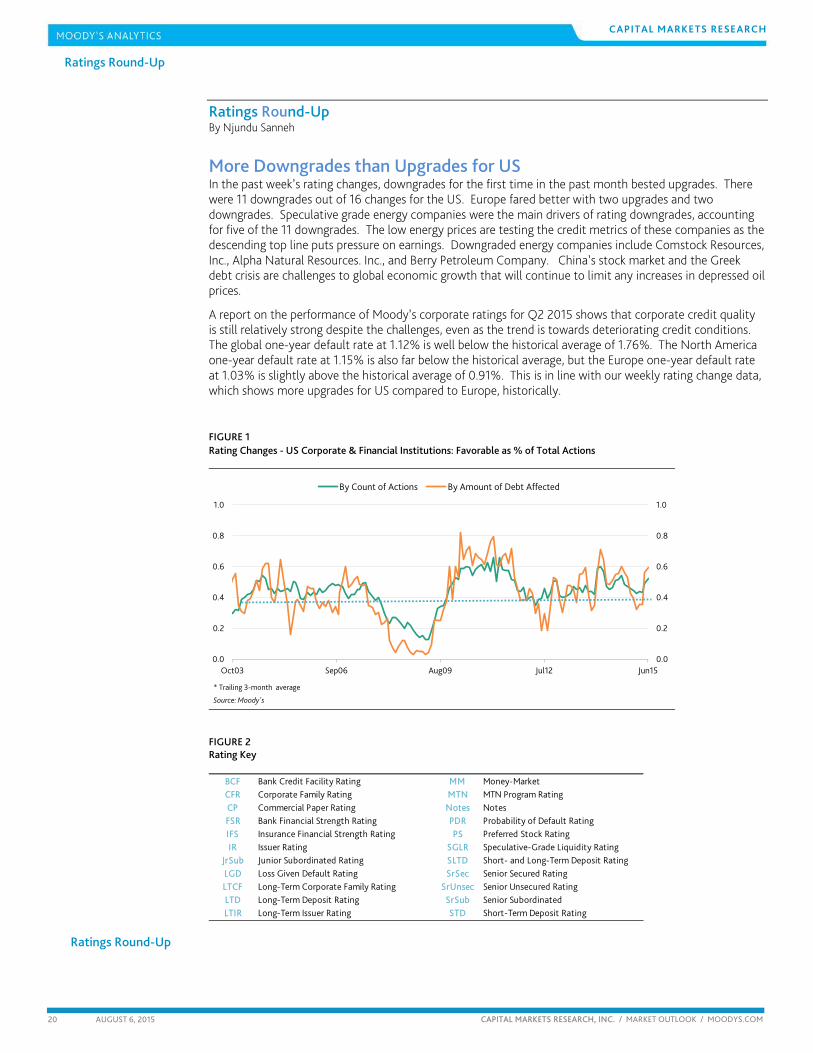
More Downgrades than Upgrades for US In the past week’s rating changes, downgrades for the first time in the past month bested upgrades. There were 11 downgrades out of 16 changes for the US. Europe fared better with two upgrades and two downgrades. Speculative grade energy companies were the main drivers of rating downgrades, accounting for five of the 11 downgrades. The low energy prices are testing the credit metrics of these companies as the descending top line puts pressure on earnings. Downgraded energy companies include Comstock Resources, Inc., Alpha Natural Resources. Inc., and Berry Petroleum Company. China’s stock market and the Greek debt crisis are challenges to global economic growth that will continue to limit any increases in depressed oil prices.
A report on the performance of Moody’s corporate ratings for Q2 2015 shows that corporate credit quality is still relatively strong despite the challenges, even as the trend is towards deteriorating credit conditions. The global one-year default rate at 1.12% is well below the historical average of 1.76%. The North America one-year default rate at 1.15% is also far below the historical average, but the Europe one-year default rate at 1.03% is slightly above the historical average of 0.91%. This is in line with our weekly rating change data, which shows more upgrades for US compared to Europe, historically.
FIGURE 1 Rating Changes - US Corporate & Financial Institutions: Favorable as % of Total Actions
0.0
0.2
0.4
0.6
0.8
1.0
0.0
0.2
0.4
0.6
0.8
1.0
Oct03 Sep06 Aug09 Jul12 Jun15
By Count of Actions By Amount of Debt Affected
* Trailing 3-month average
Source: Moody's FIGURE 2 Rating Key
BCF Bank Credit Facility Rating MM Money-MarketCFR Corporate Family Rating MTN MTN Program RatingCP Commercial Paper Rating Notes NotesFSR Bank Financial Strength Rating PDR Probability of Default RatingIFS Insurance Financial Strength Rating PS Preferred Stock RatingIR Issuer Rating SGLR Speculative-Grade Liquidity Rating
JrSub Junior Subordinated Rating SLTD Short- and Long-Term Deposit RatingLGD Loss Given Default Rating SrSec Senior Secured Rating LTCF Long-Term Corporate Family Rating SrUnsec Senior Unsecured Rating LTD Long-Term Deposit Rating SrSub Senior SubordinatedLTIR Long-Term Issuer Rating STD Short-Term Deposit Rating
Ratings Round-Up
Ratings Round-Up

The Week Ahead
CAPITAL MARKETS RESEARCH
21 AUGUST 6, 2015 CAPITAL MARKETS RESEARCH, INC. / MARKET OUTLOOK / MOODYS.COM
FIGURE 3 Rating Changes: Corporate & Financial Institutions – US
Date Company Sector RatingAmount
($ Million)Up/
Down
Old LTD
Rating
New LTD
Rating
IG/SG
7/29/15 ALLEGHENY TECHNOLOGIES INCORPORATED Industrial SrUnsec/LTCFR/PDR 1,500 D Ba1 Ba2 SG7/29/15 HILL-ROM HOLDINGS, INC. Industrial SrSec/BCF D Ba1 Ba2 SG7/30/15 FPL ENERGY WIND FUNDING, LLC Industrial SrSec 55 D Ba2 Ba3 SG7/30/15 HEALTHSOUTH CORPORATION Industrial SrUnsec 1,376 D Ba3 B1 SG7/31/15 COMSTOCK RESOURCES, INC. Industrial SrSec/LTCFR/PDR 1,400 D Caa1 Caa2 SG8/3/15 BB&T CORPORATION - Susquehanna Bancshares, Inc. Financial SrUnsec 150 U Baa2 A2 SG8/3/15 CELGENE CORPORATION Industrial SrUnsec 6,750 D Baa1 Baa2 SG8/3/15 FPL ENERGY NATIONAL WIND PORTFOLIO, LLC Industrial SrSec 100 U B1 Ba3 SG8/3/15 HD SUPPLY, INC. Industrial SrUnsec/LTCFR/PDR 2,275 U Caa2 Caa1 SG8/3/15 MSCI INC. Industrial SrUnsec/LTCFR/PDR 800 D Ba1 Ba2 SG8/3/15 OLLIE'S HOLDINGS, INC. Industrial SrSec/LTCFR/PDR/BCF U B2 Ba3 SG8/3/15 TALBOTS INC. Industrial SrSec/LTCFR/PDR U B3 B1 SG8/4/15 ALPHA NATURAL RESOURCES, INC Industrial SrUnsec/SrSec/LTCFR/PDR/BCF 2,271 D Ca C SG8/4/15 APPVION, INC. Industrial SrSec/LTCFR/PDR 250 D B2 B3 SG8/4/15 BERRY PETROLEUM COMPANY Industrial SrUnsec/LTCFR/PDR 6,849 D B1 B3 SG8/4/15 SMILE BRANDS GROUP INC. Industrial SrSec/LTCFR/PDR/BCF D B2 Caa1 SG
Source: Moody's
FIGURE 4 Rating Changes: Corporate & Financial Institutions – EUROPE
Date Company Sector RatingAmount
($ Million)Up/
Down
Old LTD
Rating
New LTD
Rating
IG/SG
Country
7/31/15 LA FINANCIERE ATALIAN S.A. Industrial SrUnsec/LTCFR/PDR 276 U B3 B2 SG FRANCE7/30/15 IENERGIZER LIMITED Industrial SrSec/LTCFR/PDR D B2 B3 SG GUERNSEY7/30/15 ALLIANDER N.V. Utility SrUnsec/JrSub/LTIR/MTN 2,596 U Aa3 Aa2 IG NETHERLANDS7/31/15 CHERKIZOVO GROUP, PJSC Industrial LTCFR/PDR 2,050 D B2 B1 SG RUSSIA
Source: Moody's
CAPITAL MARKETS RESEARCH
22 AUGUST 6, 2015 CAPITAL MARKETS RESEARCH, INC. / MARKET OUTLOOK / MOODYS.COM
Market Data
0
200
400
600
800
0
200
400
600
800
2003 2004 2005 2006 2007 2008 2009 2010 2011 2012 2013 2014 2015
Spread (bp) Spread (bp) Aa2 A2 Baa2
Source: Moody'sSource: Moody's
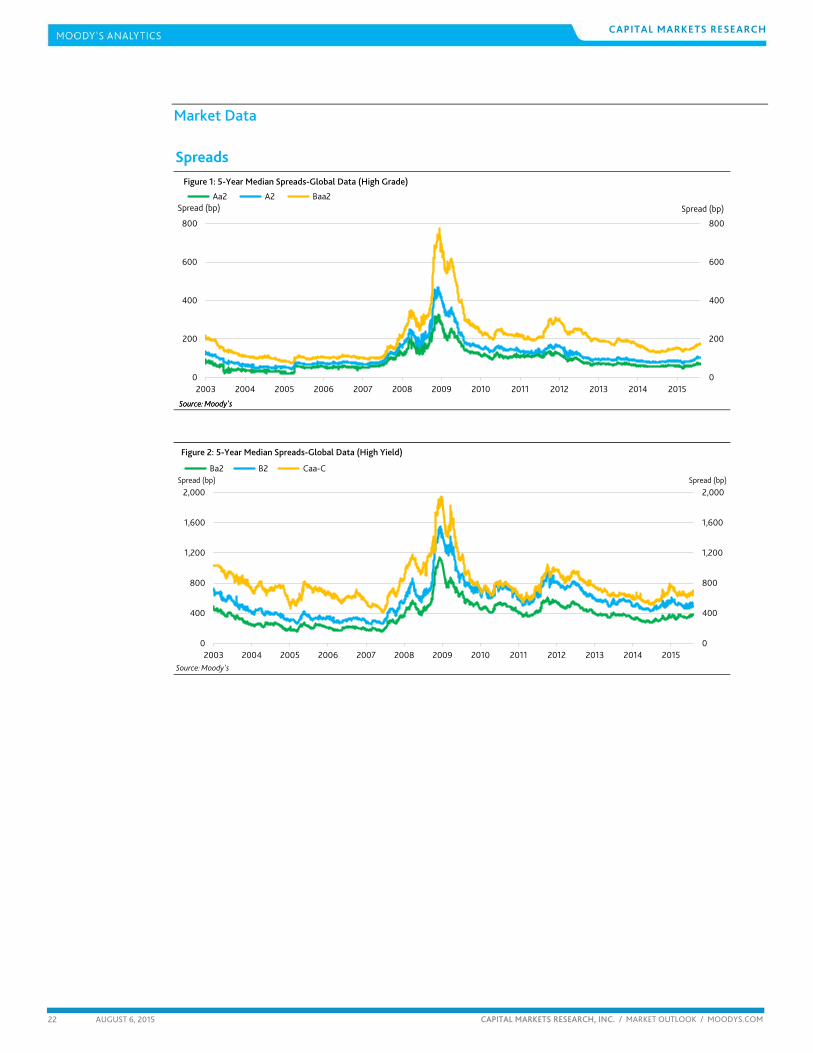
Figure 1: 5-Year Median Spreads-Global Data (High Grade)
0
400
800
1,200
1,600
2,000
0
400
800
1,200
1,600
2,000
2003 2004 2005 2006 2007 2008 2009 2010 2011 2012 2013 2014 2015
Spread (bp) Spread (bp) Ba2 B2 Caa-C
Source: Moody's
Figure 2: 5-Year Median Spreads-Global Data (High Yield)
Spreads
CAPITAL MARKETS RESEARCH
23 AUGUST 6, 2015 CAPITAL MARKETS RESEARCH, INC. / MARKET OUTLOOK / MOODYS.COM
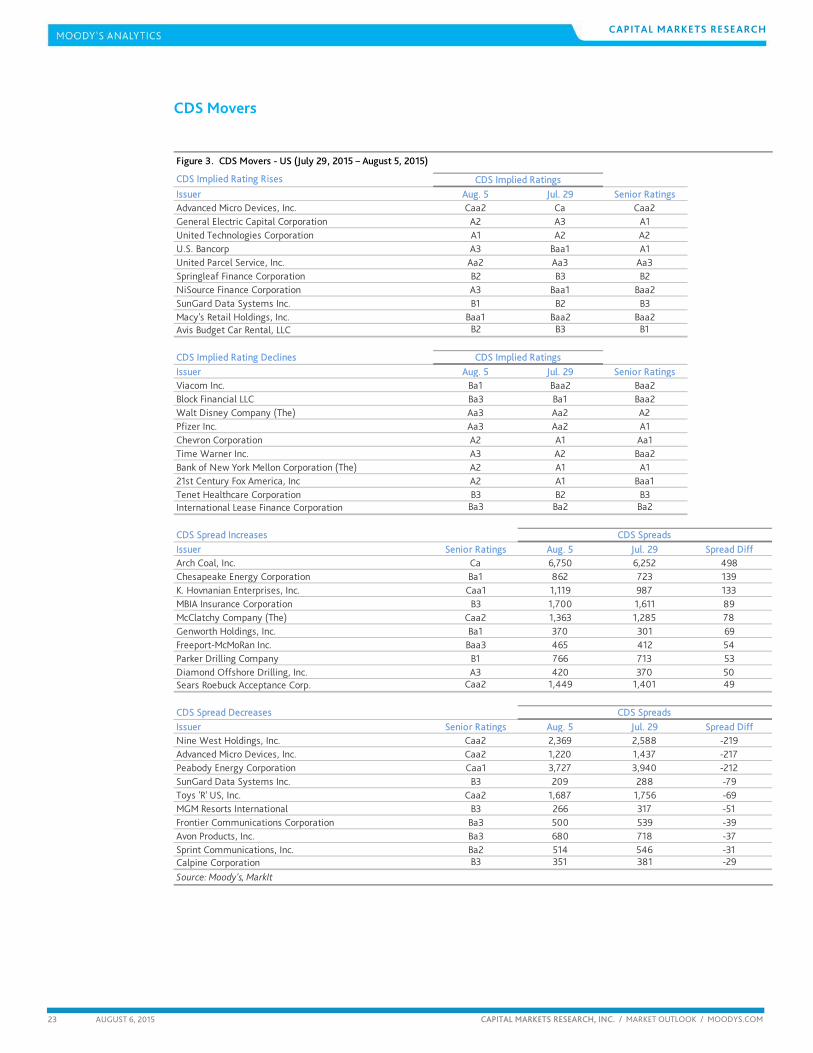
CDS Movers
CDS Implied Rating Rises
Issuer Aug. 5 Jul. 29 Senior RatingsAdvanced Micro Devices, Inc. Caa2 Ca Caa2General Electric Capital Corporation A2 A3 A1United Technologies Corporation A1 A2 A2U.S. Bancorp A3 Baa1 A1United Parcel Service, Inc. Aa2 Aa3 Aa3Springleaf Finance Corporation B2 B3 B2NiSource Finance Corporation A3 Baa1 Baa2SunGard Data Systems Inc. B1 B2 B3Macy's Retail Holdings, Inc. Baa1 Baa2 Baa2Avis Budget Car Rental, LLC B2 B3 B1
CDS Implied Rating DeclinesIssuer Aug. 5 Jul. 29 Senior RatingsViacom Inc. Ba1 Baa2 Baa2Block Financial LLC Ba3 Ba1 Baa2Walt Disney Company (The) Aa3 Aa2 A2Pfizer Inc. Aa3 Aa2 A1Chevron Corporation A2 A1 Aa1Time Warner Inc. A3 A2 Baa2Bank of New York Mellon Corporation (The) A2 A1 A121st Century Fox America, Inc A2 A1 Baa1Tenet Healthcare Corporation B3 B2 B3International Lease Finance Corporation Ba3 Ba2 Ba2
CDS Spread IncreasesIssuer Senior Ratings Aug. 5 Jul. 29 Spread DiffArch Coal, Inc. Ca 6,750 6,252 498Chesapeake Energy Corporation Ba1 862 723 139K. Hovnanian Enterprises, Inc. Caa1 1,119 987 133MBIA Insurance Corporation B3 1,700 1,611 89McClatchy Company (The) Caa2 1,363 1,285 78Genworth Holdings, Inc. Ba1 370 301 69Freeport-McMoRan Inc. Baa3 465 412 54Parker Drilling Company B1 766 713 53Diamond Offshore Drilling, Inc. A3 420 370 50Sears Roebuck Acceptance Corp. Caa2 1,449 1,401 49
CDS Spread DecreasesIssuer Senior Ratings Aug. 5 Jul. 29 Spread DiffNine West Holdings, Inc. Caa2 2,369 2,588 -219Advanced Micro Devices, Inc. Caa2 1,220 1,437 -217Peabody Energy Corporation Caa1 3,727 3,940 -212SunGard Data Systems Inc. B3 209 288 -79Toys 'R' US, Inc. Caa2 1,687 1,756 -69MGM Resorts International B3 266 317 -51Frontier Communications Corporation Ba3 500 539 -39Avon Products, Inc. Ba3 680 718 -37Sprint Communications, Inc. Ba2 514 546 -31Calpine Corporation B3 351 381 -29
Source: Moody's, MarkIt
CDS Spreads
CDS Implied Ratings
CDS Implied Ratings
CDS Spreads
Figure 3. CDS Movers - US (July 29, 2015 – August 5, 2015)
CAPITAL MARKETS RESEARCH
24 AUGUST 6, 2015 CAPITAL MARKETS RESEARCH, INC. / MARKET OUTLOOK / MOODYS.COM
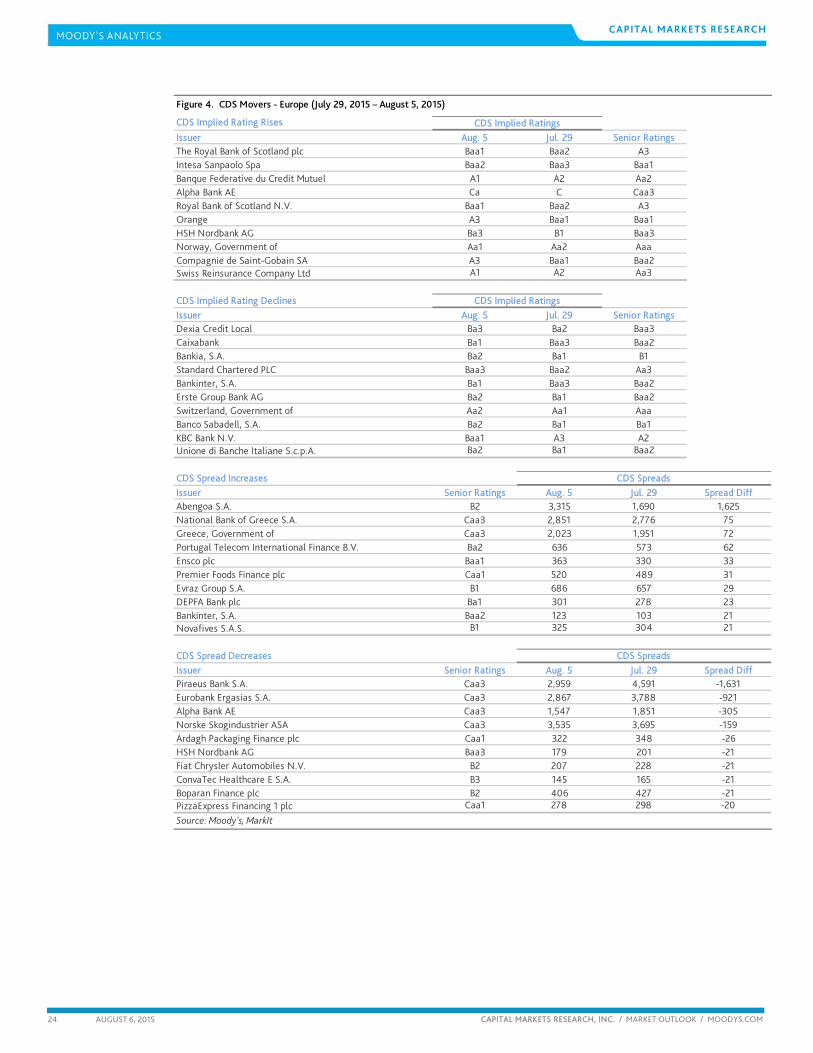
CDS Implied Rating Rises
Issuer Aug. 5 Jul. 29 Senior RatingsThe Royal Bank of Scotland plc Baa1 Baa2 A3Intesa Sanpaolo Spa Baa2 Baa3 Baa1Banque Federative du Credit Mutuel A1 A2 Aa2Alpha Bank AE Ca C Caa3Royal Bank of Scotland N.V. Baa1 Baa2 A3Orange A3 Baa1 Baa1HSH Nordbank AG Ba3 B1 Baa3Norway, Government of Aa1 Aa2 AaaCompagnie de Saint-Gobain SA A3 Baa1 Baa2Swiss Reinsurance Company Ltd A1 A2 Aa3
CDS Implied Rating DeclinesIssuer Aug. 5 Jul. 29 Senior RatingsDexia Credit Local Ba3 Ba2 Baa3Caixabank Ba1 Baa3 Baa2Bankia, S.A. Ba2 Ba1 B1Standard Chartered PLC Baa3 Baa2 Aa3Bankinter, S.A. Ba1 Baa3 Baa2Erste Group Bank AG Ba2 Ba1 Baa2Switzerland, Government of Aa2 Aa1 AaaBanco Sabadell, S.A. Ba2 Ba1 Ba1KBC Bank N.V. Baa1 A3 A2Unione di Banche Italiane S.c.p.A. Ba2 Ba1 Baa2
CDS Spread IncreasesIssuer Senior Ratings Aug. 5 Jul. 29 Spread DiffAbengoa S.A. B2 3,315 1,690 1,625National Bank of Greece S.A. Caa3 2,851 2,776 75Greece, Government of Caa3 2,023 1,951 72Portugal Telecom International Finance B.V. Ba2 636 573 62Ensco plc Baa1 363 330 33Premier Foods Finance plc Caa1 520 489 31Evraz Group S.A. B1 686 657 29DEPFA Bank plc Ba1 301 278 23Bankinter, S.A. Baa2 123 103 21Novafives S.A.S. B1 325 304 21
CDS Spread DecreasesIssuer Senior Ratings Aug. 5 Jul. 29 Spread DiffPiraeus Bank S.A. Caa3 2,959 4,591 -1,631Eurobank Ergasias S.A. Caa3 2,867 3,788 -921Alpha Bank AE Caa3 1,547 1,851 -305Norske Skogindustrier ASA Caa3 3,535 3,695 -159Ardagh Packaging Finance plc Caa1 322 348 -26HSH Nordbank AG Baa3 179 201 -21Fiat Chrysler Automobiles N.V. B2 207 228 -21ConvaTec Healthcare E S.A. B3 145 165 -21Boparan Finance plc B2 406 427 -21PizzaExpress Financing 1 plc Caa1 278 298 -20
Source: Moody's, MarkIt
CDS Spreads
CDS Implied Ratings
CDS Implied Ratings
CDS Spreads
Figure 4. CDS Movers - Europe (July 29, 2015 – August 5, 2015)
CAPITAL MARKETS RESEARCH
25 AUGUST 6, 2015 CAPITAL MARKETS RESEARCH, INC. / MARKET OUTLOOK / MOODYS.COM
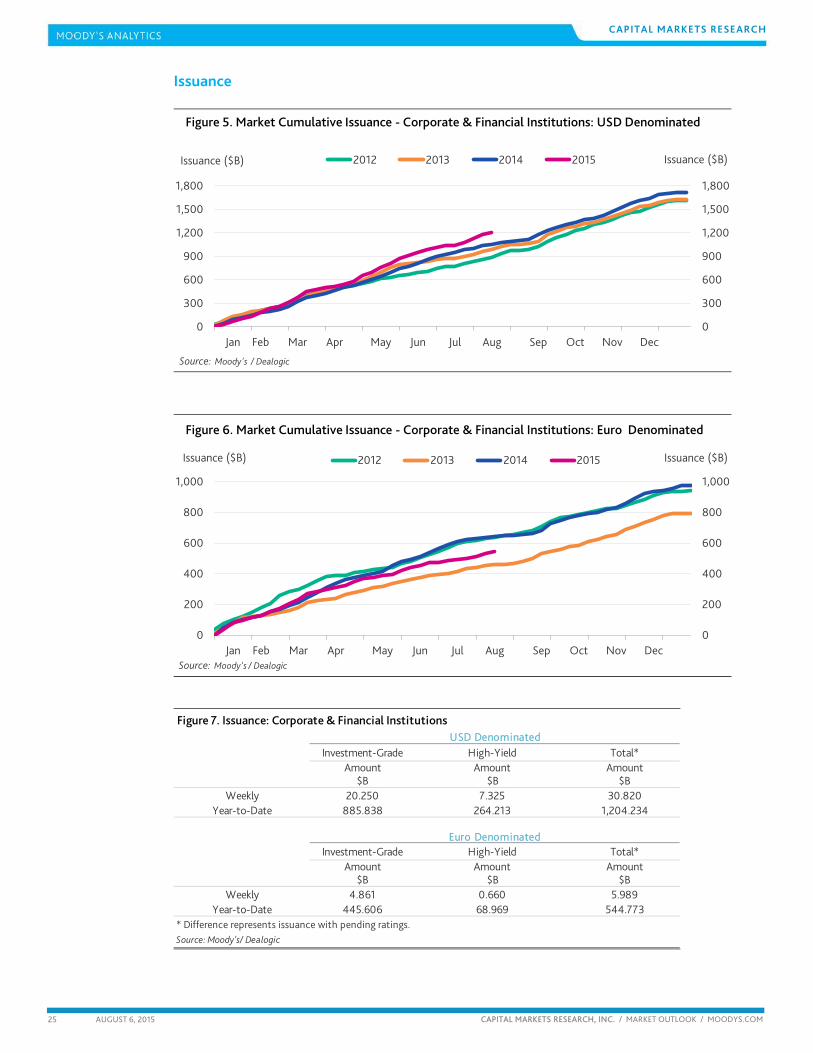
Issuance
0
300
600
900
1,200
1,500
1,800
0
300
600
900
1,200
1,500
1,800
Jan Feb Mar Apr May Jun Jul Aug Sep Oct Nov Dec
Issuance ($B) Issuance ($B)2012 2013 2014 2015
Source: Moody's / Dealogic
Figure 5. Market Cumulative Issuance - Corporate & Financial Institutions: USD Denominated
0
200
400
600
800
1,000
0
200
400
600
800
1,000
Jan Feb Mar Apr May Jun Jul Aug Sep Oct Nov Dec
Issuance ($B) Issuance ($B)2012 2013 2014 2015
Source: Moody's / Dealogic
Figure 6. Market Cumulative Issuance - Corporate & Financial Institutions: Euro Denominated
Investment-Grade High-Yield Total*Amount Amount Amount
$B $B $BWeekly 20.250 7.325 30.820
Year-to-Date 885.838 264.213 1,204.234
Investment-Grade High-Yield Total*Amount Amount Amount
$B $B $BWeekly 4.861 0.660 5.989
Year-to-Date 445.606 68.969 544.773* Difference represents issuance with pending ratings.Source: Moody's/ Dealogic
USD Denominated
Euro Denominated
Figure 7. Issuance: Corporate & Financial Institutions
CAPITAL MARKETS RESEARCH
26 AUGUST 6, 2015 CAPITAL MARKETS RESEARCH, INC. / MARKET OUTLOOK / MOODYS.COM
Moody’s Capital Markets Research recent publications
https://www.moodys.com/research/Bank-Risk-Report-Banks-Average-Market-Signals-Stable-Globally-in--PBC_1007234
https://www.moodys.com/research/Market-Signals-Review-Unilevers-Bond-Implied-Rating-Declines--PBC_1007313
https://www.moodys.com/research/Market-Signals-Review-Exxon-Mobil-Market-Implied-Ratings-All-Move--PBC_1007259
https://www.moodys.com/research/Market-Comment-One-Company-Mirrors-the-Worldwide-Economic-Slowdown--PBC_1007233
https://www.moodys.com/research/Market-Signals-Review-Chevron-Corp-Market-Implied-Ratings-Decline--PBC_1007229
https://www.moodys.com/research/Corregidora-Corregidora-Takes-First-Step-towards-Addressing-Pension-Liabilities-a--PBC_1006268
https://www.moodys.com/research/Sovereign-Risk-Report-Political-Unrest-and-Potential-US-Rate-Hikes--PBC_1007138
https://www.moodys.com/research/Market-Signals-Review-Australia-and-New-Zealand-Banking-Group-Ltd--PBC_1007108
https://www.moodys.com/research/Market-Signals-Review-American-International-Group-Two-Market-Implied-Ratings--PBM_1007149
https://www.moodys.com/research/Credit-Concerns-Surpass-Rate-Risks-Capital-Markets-Research--PBC_183469
https://www.moodys.com/research/Market-Signals-Review-Ford-Motor-Co-Market-Signals-on-Cruise--PBC_1007073
https://www.moodys.com/research/Market-Signals-Review-Campbell-Soup-Co-EDF-and-Bond-Implied--PBC_1007056
https://www.moodys.com/research/Market-Signals-Review-American-Express-Co-CDS-Implied-Rating-Rises--PBC_1007016
https://www.moodys.com/research/Sovereign-Risk-Report-Emerging-Markets-Sovereign-Default-Risk-Rises-In--PBC_1006915
These and others are also available at: http://www.moodys.com/cmrg
CAPITAL MARKETS RESEARCH
27 AUGUST 6, 2015 CAPITAL MARKETS RESEARCH, INC. / MARKET OUTLOOK / MOODYS.COM
To order reprints of this report (100 copies minimum), please call 212.553.1658.
Report Number: 183598 Contact Us
Editor Dana Gordon
Americas : 1.212.553.4399
Europe: +44 (0) 20.7772.5588
Asia: 813.5408.4131
© 2015 Moody’s Corporation, Moody’s Investors Service, Inc., Moody’s Analytics, Inc. and/or their licensors and affiliates (collectively, “MOODY’S”). All rights reserved.
CREDIT RATINGS ISSUED BY MOODY'S INVESTORS SERVICE, INC. (“MIS”) AND ITS AFFILIATES ARE MOODY’S CURRENT OPINIONS OF THE RELATIVE FUTURE CREDIT RISK OF ENTITIES, CREDIT COMMITMENTS, OR DEBT OR DEBT-LIKE SECURITIES, AND CREDIT RATINGS AND RESEARCH PUBLICATIONS PUBLISHED BY MOODY’S (“MOODY’S PUBLICATIONS”) MAY INCLUDE MOODY’S CURRENT OPINIONS OF THE RELATIVE FUTURE CREDIT RISK OF ENTITIES, CREDIT COMMITMENTS, OR DEBT OR DEBT-LIKE SECURITIES. MOODY’S DEFINES CREDIT RISK AS THE RISK THAT AN ENTITY MAY NOT MEET ITS CONTRACTUAL, FINANCIAL OBLIGATIONS AS THEY COME DUE AND ANY ESTIMATED FINANCIAL LOSS IN THE EVENT OF DEFAULT. CREDIT RATINGS DO NOT ADDRESS ANY OTHER RISK, INCLUDING BUT NOT LIMITED TO: LIQUIDITY RISK, MARKET VALUE RISK, OR PRICE VOLATILITY. CREDIT RATINGS AND MOODY’S OPINIONS INCLUDED IN MOODY’S PUBLICATIONS ARE NOT STATEMENTS OF CURRENT OR HISTORICAL FACT. MOODY’S PUBLICATIONS MAY ALSO INCLUDE QUANTITATIVE MODEL-BASED ESTIMATES OF CREDIT RISK AND RELATED OPINIONS OR COMMENTARY PUBLISHED BY MOODY’S ANALYTICS, INC. CREDIT RATINGS AND MOODY’S PUBLICATIONS DO NOT CONSTITUTE OR PROVIDE INVESTMENT OR FINANCIAL ADVICE, AND CREDIT RATINGS AND MOODY’S PUBLICATIONS ARE NOT AND DO NOT PROVIDE RECOMMENDATIONS TO PURCHASE, SELL, OR HOLD PARTICULAR SECURITIES. NEITHER CREDIT RATINGS NOR MOODY’S PUBLICATIONS COMMENT ON THE SUITABILITY OF AN INVESTMENT FOR ANY PARTICULAR INVESTOR. MOODY’S ISSUES ITS CREDIT RATINGS AND PUBLISHES MOODY’S PUBLICATIONS WITH THE EXPECTATION AND UNDERSTANDING THAT EACH INVESTOR WILL, WITH DUE CARE, MAKE ITS OWN STUDY AND EVALUATION OF EACH SECURITY THAT IS UNDER CONSIDERATION FOR PURCHASE, HOLDING, OR SALE.
MOODY’S CREDIT RATINGS AND MOODY’S PUBLICATIONS ARE NOT INTENDED FOR USE BY RETAIL INVESTORS AND IT WOULD BE RECKLESS FOR RETAIL INVESTORS TO CONSIDER MOODY’S CREDIT RATINGS OR MOODY’S PUBLICATIONS IN MAKING ANY INVESTMENT DECISION. IF IN DOUBT YOU SHOULD CONTACT YOUR FINANCIAL OR OTHER PROFESSIONAL ADVISER.
ALL INFORMATION CONTAINED HEREIN IS PROTECTED BY LAW, INCLUDING BUT NOT LIMITED TO, COPYRIGHT LAW, AND NONE OF SUCH INFORMATION MAY BE COPIED OR OTHERWISE REPRODUCED, REPACKAGED, FURTHER TRANSMITTED, TRANSFERRED, DISSEMINATED, REDISTRIBUTED OR RESOLD, OR STORED FOR SUBSEQUENT USE FOR ANY SUCH PURPOSE, IN WHOLE OR IN PART, IN ANY FORM OR MANNER OR BY ANY MEANS WHATSOEVER, BY ANY PERSON WITHOUT MOODY’S PRIOR WRITTEN CONSENT.
All information contained herein is obtained by MOODY’S from sources believed by it to be accurate and reliable. Because of the possibility of human or mechanical error as well as other factors, however, all information contained herein is provided “AS IS” without warranty of any kind. MOODY'S adopts all necessary measures so that the information it uses in assigning a credit rating is of sufficient quality and from sources MOODY'S considers to be reliable including, when appropriate, independent third-party sources. However, MOODY’S is not an auditor and cannot in every instance independently verify or validate information received in the rating process or in preparing the Moody’s Publications.
To the extent permitted by law, MOODY’S and its directors, officers, employees, agents, representatives, licensors and suppliers disclaim liability to any person or entity for any indirect, special, consequential, or incidental losses or damages whatsoever arising from or in connection with the information contained herein or the use of or inability to use any such information, even if MOODY’S or any of its directors, officers, employees, agents, representatives, licensors or suppliers is advised in advance of the possibility of such losses or damages, including but not limited to: (a) any loss of present or prospective profits or (b) any loss or damage arising where the relevant financial instrument is not the subject of a particular credit rating assigned by MOODY’S.
To the extent permitted by law, MOODY’S and its directors, officers, employees, agents, representatives, licensors and suppliers disclaim liability for any direct or compensatory losses or damages caused to any person or entity, including but not limited to by any negligence (but excluding fraud, willful misconduct or any other type of liability that, for the avoidance of doubt, by law cannot be excluded) on the part of, or any contingency within or beyond the control of, MOODY’S or any of its directors, officers, employees, agents, representatives, licensors or suppliers, arising from or in connection with the information contained herein or the use of or inability to use any such information.
NO WARRANTY, EXPRESS OR IMPLIED, AS TO THE ACCURACY, TIMELINESS, COMPLETENESS, MERCHANTABILITY OR FITNESS FOR ANY PARTICULAR PURPOSE OF ANY SUCH RATING OR OTHER OPINION OR INFORMATION IS GIVEN OR MADE BY MOODY’S IN ANY FORM OR MANNER WHATSOEVER.
MIS, a wholly-owned credit rating agency subsidiary of Moody’s Corporation (“MCO”), hereby discloses that most issuers of debt securities (including corporate and municipal bonds, debentures, notes and commercial paper) and preferred stock rated by MIS have, prior to assignment of any rating, agreed to pay to MIS for appraisal and rating services rendered by it fees ranging from $1,500 to approximately $2,500,000. MCO and MIS also maintain policies and procedures to address the independence of MIS’s ratings and rating processes. Information regarding certain affiliations that may exist between directors of MCO and rated entities, and between entities who hold ratings from MIS and have also publicly reported to the SEC an ownership interest in MCO of more than 5%, is posted annually at www.moodys.com under the heading “Shareholder Relations — Corporate Governance — Director and Shareholder Affiliation Policy.”
For Australia only: Any publication into Australia of this document is pursuant to the Australian Financial Services License of MOODY’S affiliate, Moody’s Investors Service Pty Limited ABN 61 003 399 657AFSL 336969 and/or Moody’s Analytics Australia Pty Ltd ABN 94 105 136 972 AFSL 383569 (as applicable). This document is intended to be provided only to “wholesale clients” within the meaning of section 761G of the Corporations Act 2001. By continuing to access this document from within Australia, you represent to MOODY’S that you are, or are accessing the document as a representative of, a “wholesale client” and that neither you nor the entity you represent will directly or indirectly disseminate this document or its contents to “retail clients” within the meaning of section 761G of the Corporations Act 2001. MOODY’S credit rating is an opinion as to the creditworthiness of a debt obligation of the issuer, not on the equity securities of the issuer or any form of security that is available to retail clients. It would be dangerous for “retail clients” to make any investment decision based on MOODY’S credit rating. If in doubt you should contact your financial or other professional adviser.
For Publications Issued by Moody’s Capital Markets Research, Inc. only:
The statements contained in this research report are based solely upon the opinions of Moody’s Capital Markets Research, Inc. and the data and information available to the authors at the time of publication of this report. There is no assurance that any predicted results will actually occur. Past performance is no guarantee of future results.
The analysis in this report has not been made available to any issuer prior to publication.
When making an investment decision, investors should use additional sources of information and consult with their investment advisor. Investing in securities involves certain risks including possible fluctuations in investment return and loss of principal. Investing in bonds presents additional risks, including changes in interest rates and credit risk.
Moody's Capital Markets Research, Inc., is a subsidiary of MCO. Please note that Moody’s Analytics, Inc., an affiliate of Moody’s Capital Markets Research, Inc. and a subsidiary of MCO, provides a wide range of research and analytical products and services to corporations and participants in the financial markets. Customers of Moody’s Analytics, Inc. may include companies mentioned in this report. Please be advised that a conflict may exist and that any investment decisions you make are your own responsibility. The Moody’s Analytics logo is used on certain Moody’s Capital Markets Research, Inc. products for marketing purposes only. Moody’s Analytics, Inc. is a separate company from Moody’s Capital Markets Research, Inc.