COVER SHEET - QUT ePrintseprints.qut.edu.au/3029/1/3029.pdf · , & Kevin J. McKee 3 ... This study...
27
COVER SHEET This is the author version of article published as: Unsworth, Kerrie L. and McKee, Kevin J. and Mulligan, Catherine (2001) When does old age begin? The role of attitudes in age parameter placement . Social Psychology Review 3(2):pp. 5-15. Copyright 2001 The British Psychological Society Accessed from http://eprints.qut.edu.au
Transcript of COVER SHEET - QUT ePrintseprints.qut.edu.au/3029/1/3029.pdf · , & Kevin J. McKee 3 ... This study...

COVER SHEET
This is the author version of article published as: Unsworth, Kerrie L. and McKee, Kevin J. and Mulligan, Catherine (2001) When does old age begin? The role of attitudes in age parameter placement . Social Psychology Review 3(2):pp. 5-15. Copyright 2001 The British Psychological Society Accessed from http://eprints.qut.edu.au

RUNNING HEAD: Attitudes and age parameters
When Does Old Age Begin?
The Role of Attitudes in Age Parameter Placement
by
Kerrie L. Unsworth 1 , Catherine Mulligan 2 , & Kevin J. McKee 3
1 Institute of Work Psychology, University of Sheffield 2 Department of Psychology, University of Sheffield
3 Sheffield Institute for Studies on Ageing, University of Sheffield
ADDRESS FOR CORRESPONDENCE: Kerrie L. Unsworth, Institute of Work Psychology, University of Sheffield, Sheffield S10 2TN. Email: [email protected]

Age Parameter Placement 2
WHEN DOES OLD AGE BEGIN? THE ROLE OF ATTITUDES IN AGE PARAMETER
PLACEMENT
Abstract
This research examined the influence of a person’s age and their attitudes towards
ageing in their placement of age parameters, and in particular, their placement of the beginning
of old age. Previous research has shown that as an individual’s age increases, their parameter
for the beginning of old age is placed further along the lifespan. Two groups (young and
middleaged adults) were recruited to test the hypothesis that an individual’s attitude towards
old age will mediate the relationship between age and the placement of this age parameter,
such that the middleaged group will hold more negative attitudes towards old age causing
them to place the parameter further away. Results showed that middleaged adults were, in
fact, more optimistic towards old age than young adults. Despite this unanticipated finding, the
mediation model was tested and found to be valid. Thus, middleaged people were more
optimistic towards old age and this caused them to place the age parameter further down the
lifespan. Two possible explanations were suggested: an increase in contact with
counterstereotypical older adults, and a possible confounding effect of optimism towards
living a long life. Policy implications were discussed.

Age Parameter Placement 3
At the present time, the population age structure of developed countries is undergoing
rapid change, with such countries’ populations containing proportionately and absolutely more
older citizens (Victor, 1991). Understanding how and why we consider people of particular
ages to be old is therefore of considerable and increasing importance, especially since being
labelled ‘old’ has great significance for an individual’s rights and level of social exclusion in
many countries (Higgs, 1995). This study will examine the influence of a person’s age and
their attitudes toward age and ageing in their placement of age parameters.
Cameron (1969) researched the everyday normative use of the terms young adult,
middleaged, old and aged. In a sample of 571 people, he found age parameters as follows:
young adult, 1825; middleaged, 4055; old, 6580; and aged, 80+. Perhaps most
interestingly, Cameron also reported a general tendency for age parameters to be raised with
increasing age of the respondent. Other research also shows agerelated differences in
perceptions of lifespan stages. Drevenstedt (1976) found that older participants perceived old
age as starting significantly later than did young and middle aged adults and an Age Concern
study showed that 1624 year olds placed the start of old age at 63 years, whereas adults of
75+ placed the start at 76 years (Age Concern, 1992). This effect also persists in other
cultures (e.g., Hori, 1994).
Within Western society, nearly everybody (including older people themselves) appears
to hold negative stereotypes about ageing and older people (e.g., Anantharaman, 1984;
ColletePratt, 1976; Netz & BenSira, 1993). Common stereotypes of old age include: most
older people are senile, live in institutions, and no longer care about achievement (Hayslip &
Panek, 1993). Much research has focussed upon young people’s perceptions of older people.
Goldman & Goldman (1981) examined Australian, English, US and Swedish children and
young people between the ages of 5 and 25 years old; Hawkins (1996) examined college

Age Parameter Placement 4
students between the ages of 18 and 24 years old; and both Tuckman and Lorge (1953) and
Anantharaman (1980) questionned postgraduate students. In each of these studies, older
people were evaluated negatively. Even in other, somewhat more collectivistic, cultures,
young people were found to hold negative attitudes towards the aged (e.g., Rapoport &
Barnett, 1986).
In addition, young people view old age significantly more negatively than do older
people (Anantharaman, 1979). In an investigation of the devaluation of old age, ColletePratt
(1976) found that young participants devalued old age almost twice as much as older
participants. Netz and BenSira (1993) found that, although older people held negative
stereotypes about “old people”, they still perceived their age group significantly more
favourably than the younger participants.
There is therefore substantial work on the perception of age parameters, and on
stereotypes of old age and older people. However, there has been little work that has
attempted to integrate these two areas, either theoretically or empirically. For example, the
influence of age on the perception of age parameters may be mediated by an individual’s
personal attitudes towards ageing and being aged. As described above, people of all ages have
negative stereotypes about old age (eg., ColletePratt, 1976). These stereotypes, however,
may differ in their importance to the respondent’s self identity depending upon that person’s
age. Old age stereotypes are likely to be more salient to a middleaged person who is closer to
joining the “old age” ingroup, than to a younger person; thus increasing the threat to middle
aged adults. Previous research has shown that the combination of negative stereotypes and
threat from the outgroup is a very strong predictor of negative attitudes towards that outgroup
(Stephan, Ybarra, Martinez, Schwarzald, & TurKaspa, 1998). Thus, as the stereotypes of old
age become more threatening in middle age they may translate into more negative personal

Age Parameter Placement 5
attitudes. Findings from a study conducted by Thorson and colleagues (1974) support this
hypothesis: middleaged people had more negative attitudes towards older people than
younger adults.
Thus, it is suggested that middleaged respondents will have more negative attitudes
towards old age than younger respondents. As it is undesirable to join a group of which you
hold negative attitudes (Tajfel & Turner, 1979), a middleaged person with negative attitudes
towards ageing will avoid the transition into old age. Therefore, they will tend to place the age
parameter further down the lifespan than a person who holds less negative attitudes towards
old age.
The present study therefore aims to integrate research on perception of age parameters
and attitudes toward ageing and older people. The study will ascertain people’s perceptions of
the age parameters of youth, middle age and old age in two samples: one of young people
drawn from a student population; and one of middleaged people drawn from a population of
teachers and lecturers. In particular the study will examine the role of attitudes in the
placement of the beginning of old age. The specific hypotheses to be tested are as follows:
Hypothesis One: There will be no differences between young and middleaged
participants on negativity of stereotypes, but middleaged participants will hold more negative
attitudes towards ageing than younger participants.
Hypothesis Two: Attitudes towards old age will mediate the relationship between age
and the placement of the parameter for the beginning of old age.
Method
Participants

Age Parameter Placement 6
The sample comprised two groups: a group of younger adults (students) and a group
of middleaged adults (school teachers and university lecturers). These groups were selected
to minimise the welldocumented confound of educational level on agerelated differences in
psychological variables (see Hertzog, 1996). The younger adult group approached consisted
of 152 firstyear psychology students, all of whom participated. In the middleaged group, 50
teachers were approached and 29 participated; of the 50 lecturers approached, 25 participated.
The overall sample size for the middleaged group was therefore 54, and the overall
recruitment rate was 54%.
Materials
A selfreport questionnaire was used to gather data. It consisted of three components:
measures of age parameters; attitudes towards ageing; and stereotypical characteristics of age.
In addition to this, brief demographic details of the participants were obtained: age bracket,
gender, education level and current employment.
Section 1: Age Parameters
This section was designed to elicit the perceived age parameters of youth, middle age
and old age. It consisted of five questions asking the respondent to indicate the age they
considered youth and middle age to begin and end, and old age to begin. For example, “At
what age do you consider that old age begins?”
Section 2: Attitudes Towards Ageing
The Reactions to Ageing Questionnaire (RAQ; Gething, 1994) was used to measure
personal rather than societal attitudes towards ageing. The most recent form of the RAQ was
used, containing 27 items. The participant indicates their level of agreement/disagreement with

Age Parameter Placement 7
each item, all of which are statements about ageing, rated on six point scales ranging from 1
“Strongly Agree” to 6 “Stongly Disagree”. Example items are “Old age will be an enjoyable
time of life”, and “Becoming frail is rarely an issue that concerns me”. Gething (1994)
reported six underlying factors anxiety about the future (α=0.78), physical wellbeing
(α=.72), psychological wellbeing (α=.62), denial of ageing (α =.68), isolation (α =.49) and
activity (α =.20).
Section 3: Stereotypical Characteristics of Age
The aim of this section was to elicit the stereotypes which respondents use to
characterise age categories. The format of this section was free response. Guidelines directed
the participants to consider the specific psychological characteristics that they associated with
people at each of three different stages of the life span (young person, middleaged person,
older person). The participants were asked to write down as many characteristics as they
could.
Procedure
The younger adult group were provided with questionnaires during undergraduate
laboratory classes. The questionnaires were returned to the researcher at the end of the class.
A dual strategy was undertaken to recruit the middleaged adult group. First, 50 teachers from
two secondary schools were provided with a pack containing the questionnaire, a cover letter
explaining the purpose of the study, and an envelope in which to return the completed
questionnaire. The completed questionnaires were returned via the schools’ internal mailing
system and collected by the researchers. Second, a random selection of 50 lecturers from the
authors’ research establishment were recruited by means of a postal survey. A questionnaire
pack, identical to that given to the teachers, was sent through the internal mailing system; the

Age Parameter Placement 8
questionnaires were returned by the same system. To minimise order effects, the
questionnaires distributed to particpants were balanced for presentation of sections: thus,
approximately onesixth of each group received the questionnaire with the sections in the
order 1/2/3, a further sixth in the order 1/3/2 and so on.
Preliminary Data Analysis
Data were analysed using the software package SPSS v6.0 for Windows. Of the
questionnaires completed by the young adult group, nine questionnaires were unusable. Within
the middleaged group, three questionnaires were unusable. For the purposes of the study, it
was essential that the groups did not overlap with respect to age. When the data were
examined, a natural division fell between the two groups at 30 years. However a few cases in
each group lay upon the wrong side of this boundary, thus these cases were withdrawn from
further analysis. Four younger adult cases (three aged between 30 and 39, one aged between
40 and 49) and six middleaged adult cases (all aged between 20 and 29) were removed.
Therefore the final number of participants included in the study were as follows: 139 younger
adults (29 male, 110 female) and 45 middleaged adults (25 male, 20 female). The ages of the
participants in each group are displayed below in Table 1. Examination of
Insert Table 1 about here
demographic information provided during the study indicated that all of the younger adult
group were studying for a tertiary degree and all of the middleaged adult group held a tertiary
degree, thus satisfying the design requirement of educationallevel matching.
Group differences in placement of age parameters were examined by ttest, while
principle components analysis (PCA) was used to explore the factor structure of the RAQ. To
quantify the valence of stereotypes generated by respondents, two raters (undergraduate

Age Parameter Placement 9
psychology students blind to the purpose of the study) used a five point scale to rate each
characteristic provided by participants in terms of its positive/negative valence (very
negative=2, negative=1, neutral=0, positive=1, very positive=2). A satisfactory interrater
reliability of 84% was achieved. Where disagreement between raters occured, scores were
averaged. Each participant was then provided with an overall stereotype score within each of
the three age categories, achieved by summing the scores given to every characteristic
provided. Ttests were then used to examine group differences in age stereotypes, and to
examine group differences in attitude factor scores generated by the PCA of the RAQ. Finally,
regression analyses were employed to determine whether attitudes mediated the relationship
between age and age parameter placement.
Results
Age Parameters
The means, standard deviations and ranges for the perceived parameters of the three
age categories are given in Table 2. There were no differences between male and female
respondents for any age parameter (Youth Begins: t= .22, df= 182, p=.82; Youth Ends: t=
.44, df=181, p=.66; Middle Age Begins: t=1.32, df=179, p=.19; Middle Age Ends: t=.98,
df=179, p=.33; Old Age Begins: t=1.26, df=180, p=.209). As the table demonstrates, middle
aged adults consistently placed the parameters of all age categories farther along the life span
than the younger adult sample. The differences in parameter placement between age groups
was significant in every case but the placement of Youth Ends.
Table 2 about here
Bivariate correlational analyses were also performed on the different age parameters.
Significant positive correlations were found between Youth Begins and Youth Ends (r=.34,

Age Parameter Placement 10
p<.001), Middle Age Begins and Middle Age Ends (r=.46, p<.001), Middle Age Ends and Old
Age Begins (r=.38, p<.001), and Middle Age Begins and Old Age Begins (r=.25, p<.01). All
other correlations were nonsignificant.
Principal Components Analysis of RAQ
To examine the factor structure of the RAQ and to reduce the number of attitude items
to a smaller number suitable for multivariate analysis, a PCA was conducted upon the
participants’ responses to the 27 items of the RAQ. The data were screened for missing
information and 19 participants were consequently removed from further analyses. There were
no univariate or multivariate outliers. The correlation matrix produced by PCA indicated many
bivariate correlations with r>0.30, suggesting good factorability (Bartlett’s test of sphericity =
1577.65, p<.001; KaiserMeyerOlkin measure of sampling adequacy = 0.80).
Initial factor extraction produced eight principal factors with eigenvalues greater than
one. However, the last three factors accounted for relatively small amounts of variance (<5%)
indicating low reliability; the scree plot also revealed a break in the trajectory at four factors.
The lower order factors were carefully examined for ease of interpretation and found to lack
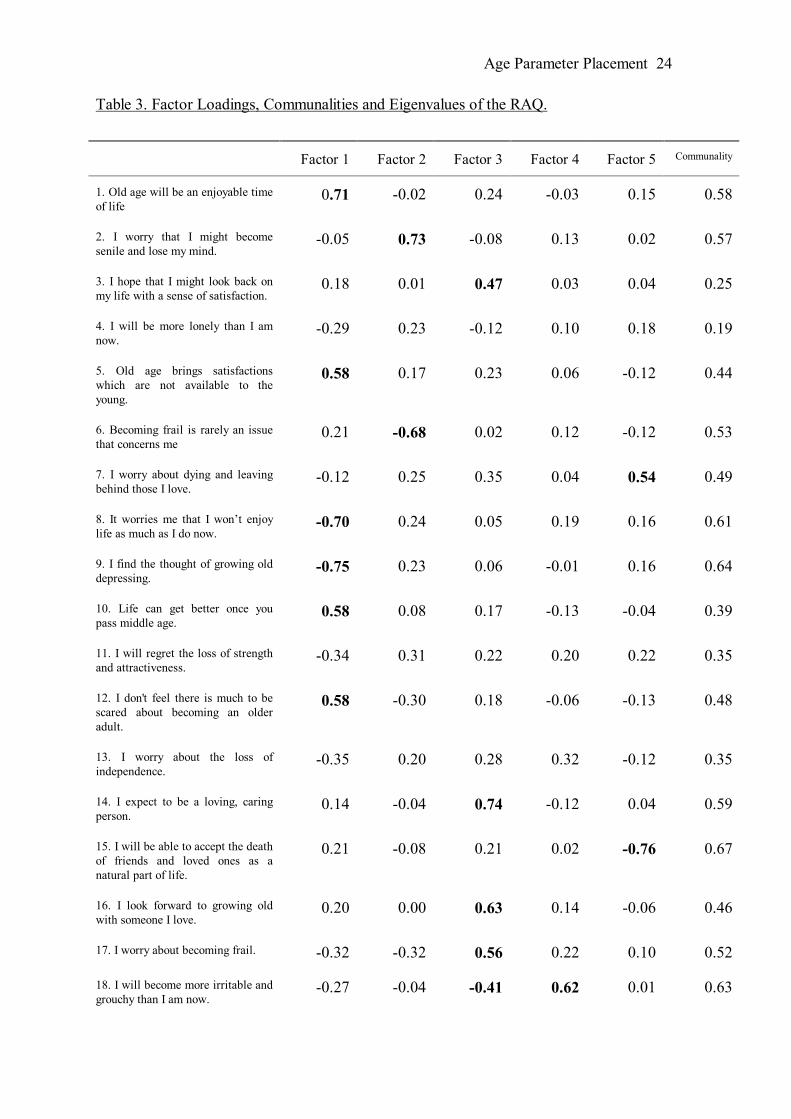
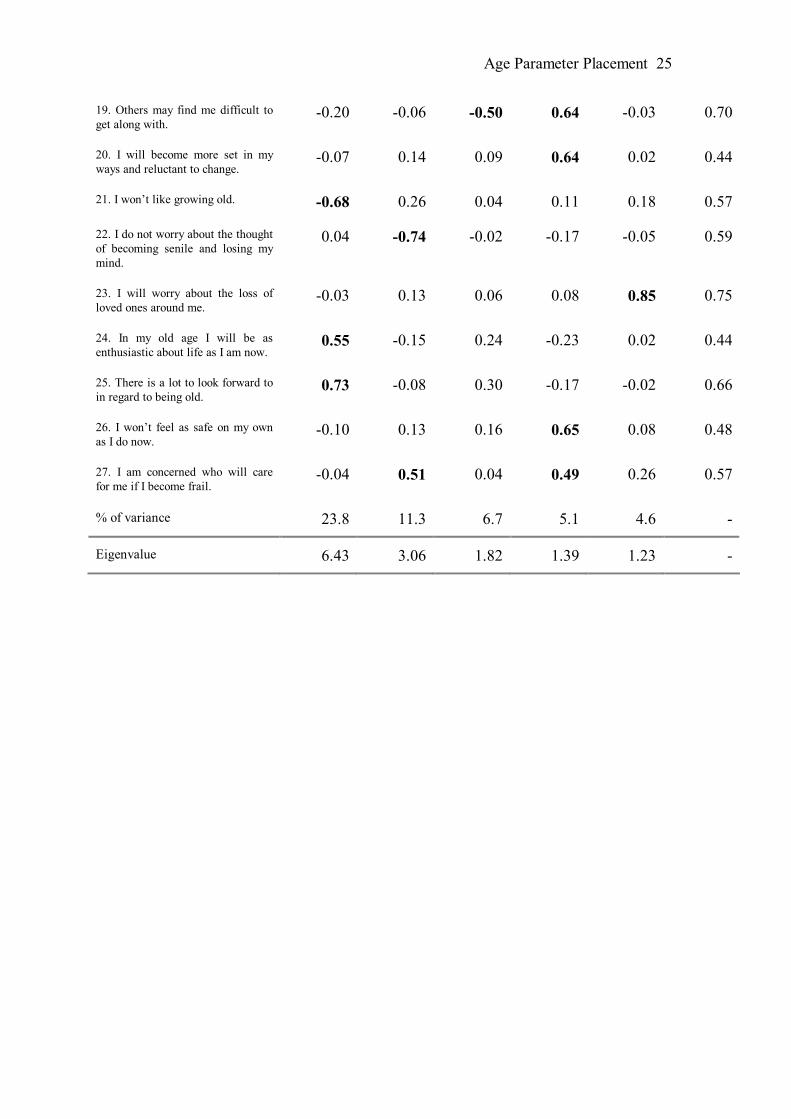
theoretical coherence. Taking these issues into account, five factors were selected for varimax
rotation. Table 3 shows the item loading on each factor and item communalities, factor
eigenvalues and percentage of variance explained by each factor. Interpretation of
Table 3 About here
factors was based upon items that loaded at 0.4 or above. Hence, the first factor was
interpreted as “Optimism Towards Old Age”, the second as “Worry about Mental and Physical
Deterioration”, the third as “Maintenance of Interpersonal Skills”, the fourth as “Worry about
Future Adjustment”, and the fifth as “Fear of Death”. Following PCA, factor scores were

Age Parameter Placement 11
produced for each participant using the regression method available with the SPSS software.
Thus, each participant was provided with five orthogonal attitude factor scores, corresponding
to the five factors obtained through PCA.
Hypothesis One: Stereotypes and Attitudes
Following the calculation of the overall valence of the stereotypes generated by each
participant, a ttest was conducted to establish if younger and middleaged adults differed in
their evaluation of the psychological characteristics of old people (means=.50, 1.14
respectively). There was no significant difference between groups (t=.62, df=1,182, p=.54),
thus supporting the first part of hypothesis one. Five ttests were then performed to establish if
there were any significant differences between the two groups on the RAQ attitude factor
scores (as factor scores are orthogonal, MANOVA was inappropriate; a Bonferroni
adjustment of the overall alpha for the five tests was conducted (α=0.01 per test)). Optimism
Towards Old Age was the only attitude factor on which younger and middleaged adults
scored significantly different (t=3.58, df=1,163, p<.001). However, contrary to expectations,
middleaged adults viewed old age more optimistically than younger adults (means=.49 and
.15, respectively).
Hypothesis Two: Mediating Effect of Attitudes
A test of mediation requires that there be a significant relationship between an
independent variable (in this case, age group) and a proposed mediating variable (in this case,
RAQ attitude factor scores). As shown in the previous analysis, only the attitude factor
Optimism Towards Old Age differed across age groups. Thus, the other attitude variables
were not considered as potential mediator variables. Despite the unanticipated finding that

Age Parameter Placement 12
middleaged adults were more optimistic about old age than younger adults, it was decided to
continue with a test of Optimism Towards Old Age as a mediator variable.
To demonstrate a mediation effect, three regression analyses need to be performed: the
mediator variable is regressed on the independent variable (Optimism Towards Old Age on
age group); the dependent variable is regressed on the independent variable (Old Age Begins
on age group); and finally, the dependent variable is regressed on both the independent
variable and the potential mediator variable simultaneously (Old Age Begins on age group and
Optimism Towards Old Age). Mediation is present if the beta weights for the first two
regressions are significant, and if the beta weight for the independent variable is nonsignificant
in the third regression while the beta weight for the mediator remains significant (Baron &
Kenny, 1986). The results are shown in Table 4. The first regression of Optimism
Insert Table 4 Here
Towards Old Age on age group was significant. The second regression of Old Age Begins on
age group was also significant. Finally, the third regression produced a nonsignificant beta
weight for age group while the beta weight for Optimism Towards Old Age remained
significant. Thus, it can be concluded that Optimism Towards Old Age mediates the
relationship between age group and the placement of the parameter for Old Age Begins.
Because the direction of the relationship between age group and Optimism Towards
Old Age was the opposite to that expected, it was decided to test an alternative mediation
model. The model tested the proposal that the placement of the age parameter Old Age Begins
mediates the relationship between age group and Optimism Towards Old Age: middleaged
adults push the old age parameter back further than younger adults; because this then reduces
the threat of old age to the individual’s identity, they feel more optimistic about old age. Baron

Age Parameter Placement 13
and Kenny’s (1986) recommended procedures were again followed. With Old Age Begins
(mediator) regressed on age group, the beta weight for age group was significant (β=0.24,
p<.001; R 2 = .05, F(1,180)=10.67, p<.01). With Optimism Towards Old Age (dependent
variable) regressed on age group, the beta weight for old age was again significant (β=0.27,
P<.001; R 2 =.07, F(1,163)=12.84, p<.001). Finally, Optimism Towards Old Age was regressed
on both Old Age Begins and age group simultaneously: the beta weight for age group
remained significant in this third regression, and indeed was reduced only marginally (βAGE
GRP=.24, p<.01; βOLD AGE=.22, p<.01; R 2 =.12; F(2,160)=11.15, p<.001). Thus, we can
conclude that Old Age Begins does not mediate the relationship between age group and
Optimism Towards Old Age.
Discussion
This study examined the age at which young and middleaged adults believe old age
begins, and the role that attitudes play in the placement of this age parameter. Specifically,
young adults were found to place the age parameter Old Age Begins significantly earlier in the
lifespan than did middleaged adults, and while attitudes did mediate the relationship between
age and age parameter placement, contrary to expectations middleaged adults were found to
have more positive attitudes towards old age than young adults.
There was strong similarity between the age parameters elicited by this study and those
found by Cameron (1969), especially for the beginning of old age. Thus, despite the relatively
wide range of placements, it appears that people tend to converge on age parameters and this
place of convergence does not appear to have changed much over the past 30 years. Age
parameters, at least in the form of an averaged figure, appear to be relatively stable across
periods of time. Yet, on an individual level, these age parameters shift as the individual

Age Parameter Placement 14
becomes older. The findings of the present study are consistent with that of previous research
in that middleaged adults placed all but one age parameter significantly further along the
lifespan than young adults.
The attitudes towards old age used in this study were ascertained by the RAQ. Whilst
a fifth attitude factor (Maintenance of Interpersonal Skills) was identified in the present
analysis which did not occur in Gething’s (1994) study, overall the similarities between the
two analyses are striking. In particular, statements that tapped affect and cognitions regarding
physical and mental decline in later life seem to form stable attitude dimensions in both the UK
sample from the present study and in Gething’s Australian sample. This is a promising finding
allowing us to be more confident in the reliability of the RAQ across cultures.
The first hypothesis tested in this study looked at the differences between the
stereotypes and attitudes towards old age of young and middleaged adults. It was
hypothesised that there would be no differences in the negativity of the stereotypes, but that
middleaged adults would hold more negative attitudes towards old age than younger adults.
The first part of this hypothesis held true: there were no significant differences between young
and middleaged participants on stereotype valency. However, attitudes towards old age did
not differ across the age groups as expected: Optimism Towards Old Age was the only RAQ
attitude factor to differ between young and middleaged participants, and contrary to
expectations middleaged participants were more optimistic about old age than the younger
sample.
The second hypothesis looked at the mediating effect of attitudes toward old age on
the relationship between age and age parameter placement. Originally, it was hypothesised that
as people grew older, their attitudes towards old age became more negative. As these attitudes

Age Parameter Placement 15
became more negative, the age parameters would be placed further down the life span.
However, as noted earlier, middleaged participants held more positive, rather than more
negative, attitudes towards old age than younger participants. Nevertheless, the mediational
analyses found that participants’ attitudes did indeed mediate the relationship between age and
age parameter placement. A posthoc model was then developed, that attitudes may become
more positive because, as people age, they place age parameters further away, thus lowering
threat. However, when this model was tested, no mediation effect was obtained.
What can account for the study findings? First, the middleaged group may have been
more positive about old age than the young adult group because they know more older
people. It has been demonstrated that the ages of people within an individual’s social network
tend to be similar to the age of the individual (Hartup & Stevens, 1997). Thus, the social
networks of middleaged individuals will be more likely to contain a number of people in the
later stages of life, than will the social networks of young people. Classic social psychological
experiments have shown that exposure to counterstereotypical members of the outgroup (in
this case, older people) can reduce the negativity of the attitudes towards that outgroup (e.g.,
Sherif, 1967). More specifically, TogonuBickersteth (1985) showed that adults who resided
in multigenerational households and who had daily contact with older people viewed old age
more positively than adults who did not live in such households. Similarly, Hale (1998) found
that both young and older participants who experienced high levels of contact with older
people held less negative stereotypes and attitudes. Thus, an increase in age may increase the
quantity and quality of contact with older people, which may lead to more positive attitudes
towards old age.
Greater contact and exposure to older people may also explain the second unforeseen
result: people who were optimistic about old age placed the age parameter further away. Most

Age Parameter Placement 16
social psychological experiments in this area show that if the person exhibiting
counterstereotypical information is seen as atypical of a normal outgroup member, they are
seen as an exception and attitudes towards the outgroup do not change (e.g., Fiske, Neuberg,
Beattie & Milberg, 1987; Wilder, Simon & Faith, 1996). Thus, if a middleaged participant
knows a 65 year old person who displays counterstereotypical behaviour, but is seen as
atypical of a normal older adult, then that person will be seen as an exception to the norm.
However, these social psychological studies use absolute boundaries for outgroups; the
participant cannot change the boundary and cannot change the membership of the “exception”.
Thus, it may be that when participants are able to change the membership of atypical outgroup
members they have been exposed to, they show that they are exceptions by excluding them
from the outgroup. In other words, the age parameters are moved to exclude the exception
from the “older adult” outgroup. Thus, our middleaged participant will move the Old Age
Begins parameter further up the lifespan. Further research is needed to ascertain the validity of
this argument.
An alternative explanation is that the attitude factor Optimism Towards Old Age is
tapping an optimism about living to an advanced age. In other words, people who score highly
on Optimism Towards Old Age also believe they will live longer. The parameter marking the
end of life may act as a cognitive anchor and pull the age parameter Old Age Begins further up
the life span. Certainly, the high correlations between subsequent age parameters indicate a
cognitive linking of the parameters in this way. Unfortunately, as parameters marking the end
of life were not collected in this study, a test of the validity of this interpretation must await
further research.
The limitations of this study are those usually found in this literature. The design was
crosssectional, allowing for the possibility that the findings are the result of cohort rather than

Age Parameter Placement 17
ageing effects. The groups of adults sampled, although comparing well on education, did not
compare well in terms of age range: the ‘middleaged’ adult group indeed being something of
a contrivance, given that the age range of this group was all of 39 years. Finally, sampling bias
may have influenced the study findings in unsuspected ways, with the response rate for the
middleaged adult group being particularly problematic.
The study needs replication, therefore, before any firm conclusions can be drawn, not
only because of the limitations in study design, but also because of the unexpected nature of
the results. Nevertheless, the study findings remain of considerable interest, due to the
demonstration of how optimism about late life can mediate the relationship between age and
the placement of age parameters. This finding, if confirmed, has considerable policy
implications. If who we perceive to be old is influenced by personal attitudes towards old age,
then societal fears may be open to amelioration through psychological interventions aimed at
changing these attitudes. In a world that is increasingly concerned about the burden on society
of the ‘grey’ population (e.g., Butler, 1997; Getzen, 1992; Kono, 1996), such an opportunity
needs full exploration.

Age Parameter Placement 18
References
Age Concern, England. (1992). Dependence: The Ultimate Fear. London: Age Concern
England.
Anantharaman, R.N. (1979). Perception of old age by two generations. Journal of
Psychological Researches, 23(3), 198199.
Anantharaman, R.N. (1980). A study of stereotypes towards old age. Journal of Psychological
Researches, 24(3), 140143.
Anantharaman, R.N. (1984). Perception of stereotypes towards old age by two generations.
Journal of Psychological Researches, 28(3), 170173.
Baron, R.M., & Kenny, D.A. (1986). The moderator/mediator variable distinction in social
psychology research: Conceptual, strategic, and statistical considerations. Journal of
Personality and Social Psychology, 51(6), 11731182.
Butler, R.N. (1997). Population aging and health. British Medical Journal, 315, 10821084.
Cameron, P. (1969). Age parameters of young adult, middle aged, old and aged. Journal of
Gerontology, 24, 201202
ColletePratt, C. (1976). Attitudinal predictors of devaluation of old age in a multigenerational
sample. Journal of Gerontology, 31, 193197.
Drevenstedt, J. (1976). Perceptions of the onsets of adulthood, middle age and old age.
Journal of Gerontology, 31, 5357.
Fiske, S.T., Neuberg, S.L., Beattie, A.E., & Milberg, S.J. (1987). Categorybased and
attributebased reactions to others: Some informational conditions of stereotyping and
individualising processes. Journal of Experimental Social Psychology, 23(5), 399427.

Age Parameter Placement 19
Gething, L. (1994). Health professional attitudes towards ageing and older people: Preliminary
report of the Reactions to Ageing Questionnaire. Australian Journal of Ageing, 13, 77
81.
Getzen, T.E. (1992). Population aging and the growth of health expenditures. Journal of
Gerontology: Social Sciences, 47, S98104.
Goldman, R.J., & Goldman, J.D. (1981). How children view old people and ageing: A
developmental study of children in four countries. Australian Journal of Psychology,
33(3), 405441.
Hale, N.M. (1998). Effects of age and interpersonal contact on stereotyping of the elderly.
Current Psychology: Developmental, Learning, Personality, Social, 17(1), 2847.
Hartup, W.W., & Stevens, N. (1997). Friendships and adaptation in the life course.
Psychological Bulletin, 121, 355370.
Hawkins, M.J. (1996). College students’ attitudes toward elderly persons. Educational
Gerontology, 22(3), 271279.
Hayslip, B., and Panek, P.E. (1993). Adult Development and Ageing. New York: Harper
Collins
Hertzog, C. (1996). Research design in studies of aging and cognition. In J.E. Birren & K.W.
Schaie (Eds.) Handbook of the Psychology of Aging, 4th Ed. San Diego: Academic
Press.
Higgs, P. (1995). Citizenship and old age: The end of the road. Ageing and Society, 15, 535
550.
Hori, S. (1994). Beginning of old age in Japan and age norms in adulthood. Educational
Gerontology, 20(5), 439451.
Kono, S. (1996). Population ageing in Japan. Reviews in Clinical Gerontology, 6, 205211.

Age Parameter Placement 20
Netz, Y., & BenSira, D. (1993). Attitudes of young peopoe, adults, and older adults from
three generation families toward the concepts “ideal person”, “youth”, “adult”, and
“old person”. Educational Gerontology, 19(7), 607621.
Rapoport, T., & Barnett, S.J. (1986). Youth’s conception of lifecycle stages: The Israeli case.
Human Relations, 39(9), 779791.
Sherif, M. (1967). Social Interaction: Process and Products. Chicago, Ill.: Aldine.
Stephan, W.G., Ybarra, O., Martinez, C.M., Schwarzald, J., & TurKaspa, M. (1998).
Prejudice toward immigrants to Spain and Israel: An integrated threat theory approach.
Journal of CrossCultural Psychology, 29(4), 559576.
Tajfel, H., & Turner, J.C. (1979). An integrative theory of intergroup conflict. In W.C. Austin
and S. Worchel (Eds.), The Social Psychology of Intergroup Relations. CA:
Brooks/Cole.
Thorson, J.A., Whatley, L., & Hancock, K. (1974). Attitudes toward the aged as a function of
age and education. Gerontologist, 14(4), 316318.
TogonuBickersteth, F. (1985). Multigenerational residence and perception of old age by
Nigerian youth. Psychology and Human Development, 1(2), 8186.
Tuckman, J., & Lorge, I. (1953). Attitudes towards old people. Journal of Social Psychology,
37, 249260.
Victor, C. R. (1991). Health and Health Care in Later Life. Milton Keynes: Open University
Press.
Wilder, D.A., Simon, A.F., & Faith, M. (1996). Enhancing the impact of counterstereotypic
information: Dispositional attributions for deviance. Journal of Personality and Social
Psychology, 71(2), 276287.

Age Parameter Placement 21
Wortley, J. (1998). Fourage systems of human development. Journal of Aging and Identity,
3(4), 213230.

Age Parameter Placement 22
Table 1. Ages of Participants
Age 1019 2029 3039 4049 5059 6069
Frequency 114 25 15 16 13 1
Percentage 62 13.6 8.2 8.7 7.1 0.5

Age Parameter Placement 23
Table 2. Means, Standard Deviations, and Range of Age Parameters by Age Group.
Young Adults MiddleAged Adults TTest of Means
Mean MinMax SD Mean MinMax SD t value, df
YB a 13.6 820 1.77 14.3 1019 2.13 t=2.35, 182*
YE b 24.7 1440 4.96 25.7 1642 6.45 t=1.06 181
MAB c 36.9 2152 5.91 40.3 2550 5.02 t=3.41, 179***
MAE d 57.3 4069 5.47 62.1 4970 5.52 t=5.01, 179***
OAB e 63.5 4080 5.95 66.8 5975 4.88 t=3.27, 180**
a Youth Begins, b Youth Ends, c Middle Age Begins, d Middle Age Ends, e Old Age Begins
* p<.05, ** p<.01, *** p<.001
Age Parameter Placement 24
Table 3. Factor Loadings, Communalities and Eigenvalues of the RAQ.
Factor 1 Factor 2 Factor 3 Factor 4 Factor 5 Communality
1. Old age will be an enjoyable time of life
0.71 0.02 0.24 0.03 0.15 0.58
2. I worry that I might become senile and lose my mind.
0.05 0.73 0.08 0.13 0.02 0.57
3. I hope that I might look back on my life with a sense of satisfaction.
0.18 0.01 0.47 0.03 0.04 0.25
4. I will be more lonely than I am now.
0.29 0.23 0.12 0.10 0.18 0.19
5. Old age brings satisfactions which are not available to the young.
0.58 0.17 0.23 0.06 0.12 0.44
6. Becoming frail is rarely an issue that concerns me
0.21 0.68 0.02 0.12 0.12 0.53
7. I worry about dying and leaving behind those I love.
0.12 0.25 0.35 0.04 0.54 0.49
8. It worries me that I won’t enjoy life as much as I do now.
0.70 0.24 0.05 0.19 0.16 0.61
9. I find the thought of growing old depressing.
0.75 0.23 0.06 0.01 0.16 0.64
10. Life can get better once you pass middle age.
0.58 0.08 0.17 0.13 0.04 0.39
11. I will regret the loss of strength and attractiveness.
0.34 0.31 0.22 0.20 0.22 0.35
12. I don't feel there is much to be scared about becoming an older adult.
0.58 0.30 0.18 0.06 0.13 0.48
13. I worry about the loss of independence.
0.35 0.20 0.28 0.32 0.12 0.35
14. I expect to be a loving, caring person.
0.14 0.04 0.74 0.12 0.04 0.59
15. I will be able to accept the death of friends and loved ones as a natural part of life.
0.21 0.08 0.21 0.02 0.76 0.67
16. I look forward to growing old with someone I love.
0.20 0.00 0.63 0.14 0.06 0.46
17. I worry about becoming frail. 0.32 0.32 0.56 0.22 0.10 0.52
18. I will become more irritable and grouchy than I am now.
0.27 0.04 0.41 0.62 0.01 0.63
Age Parameter Placement 25
19. Others may find me difficult to get along with.
0.20 0.06 0.50 0.64 0.03 0.70
20. I will become more set in my ways and reluctant to change.
0.07 0.14 0.09 0.64 0.02 0.44
21. I won’t like growing old. 0.68 0.26 0.04 0.11 0.18 0.57
22. I do not worry about the thought of becoming senile and losing my mind.
0.04 0.74 0.02 0.17 0.05 0.59
23. I will worry about the loss of loved ones around me.
0.03 0.13 0.06 0.08 0.85 0.75
24. In my old age I will be as enthusiastic about life as I am now.
0.55 0.15 0.24 0.23 0.02 0.44
25. There is a lot to look forward to in regard to being old.
0.73 0.08 0.30 0.17 0.02 0.66
26. I won’t feel as safe on my own as I do now.
0.10 0.13 0.16 0.65 0.08 0.48
27. I am concerned who will care for me if I become frail.
0.04 0.51 0.04 0.49 0.26 0.57
% of variance 23.8 11.3 6.7 5.1 4.6
Eigenvalue 6.43 3.06 1.82 1.39 1.23

Age Parameter Placement 26
Table 4. Mediation Regression Analysis: Optimism Towards Old Age (Mediator), Age Group
(Independent Variable IV), and Old Age Begins (Dependent Variable DV).
Mediator (Optimism Towards Old Age) regressed on IV (Age Group)
Variable Beta Weight R 2 F Value(df), p
Age Group .27*** .07 12.84 (1, 163); p<.001
DV (Old Age Begins) regressed on IV (Age Group)
Variable Beta Weight R 2 F Value(df), p
Age Group .24*** .05 10.67 (1,180); p<.01
DV (Old Age Begins) regressed on IV (Age Group) & Mediator (Optimism Toward Old Age)
Variable Beta Weight R 2 F Value(df), p
Age Group .14
Optimism .22** .09 7.65, df=2,160, p<.001
** p<.01, *** p<.001