Course Completion by Enrollment Status · Course Completion by Enrollment Status (Table 1) The...
15
Achievement Gap Analysis Report 1 Course Completion by Enrollment Status (Fall 2012 through Fall 2014 Cohorts) Research Report No. 08-16 Office of Institutional Effectiveness and Student Success Initiatives MARCH 2016
Transcript of Course Completion by Enrollment Status · Course Completion by Enrollment Status (Table 1) The...
Achievement Gap Analysis Report 1
Course Completion by Enrollment Status
(Fall 2012 through Fall 2014 Cohorts)
Research Report No. 08-16
Office of Institutional Effectiveness and Student Success InitiativesMARCH 2016

NORTHERN VIRGINIA COMMUNITY COLLEGE
OFFICE OF INSTITUTIONAL EFFECTIVENESS AND STUDENT SUCCESS INITIATIVES The purpose of the Office of Institutional Effectiveness and Student Success Initiatives is to conduct analytical studies and provide information in support of institutional planning, policy formulation, and decision making. In addition, the office provides leadership and support in research related activities to members of the NOVA community engaged in planning and evaluating the institution’s success in accomplishing its mission.
4001 Wakefield Chapel Road Annandale, VA 22003-3796
(703) 323-3129 www.nvcc.edu/oir
When citing data from this report, the Northern Virginia Community College (NOVA) Office of Institutional Effectiveness
and Student Success Initiatives must be cited as the source.

i
Table of Contents Introduction ................................................................................................................................... 1
Executive Summary ..................................................................................................................... 2
Successful Course Completion in First Semester ........................................................................ 3
Course Completion by Enrollment Status .................................................................................. 3
Course Completion by Gender .................................................................................................. 3
Course Completion by Age ........................................................................................................ 4
Course Completion by Race/Ethnicity ....................................................................................... 5
Course Completion by Program Placement .............................................................................. 6
Appendix: Data Tables ................................................................................................................. 8
List of Tables
Table 1. Successful Course Completion by Enrollment Status: Fall 2012 through Fall 2014 Cohorts ................................................................................................................................................. 3
List of Figures
Figure 1. Successful Course Completion Rates of Full-Time Students by Gender: Fall 2012 through Fall 2014 Cohorts ....................................................................................................... 3
Figure 2. Successful Course Completion Rates of Part-Time Students by Gender: Fall 2012 through Fall 2014 Cohorts ....................................................................................................... 4
Figure 3. Successful Course Completion Rates of Full-Time Students by Age: Fall 2012 through Fall 2014 Cohorts .................................................................................................................... 4
Figure 4. Successful Course Completion Rates of Part-Time Students by Age: Fall 2012 through Fall 2014 Cohorts .................................................................................................................... 5
Figure 5. Successful Course Completion Rates of Full-Time Students by Race/Ethnicity: Fall 2012 through Fall 2014 Cohorts .............................................................................................. 5
Figure 6. Successful Course Completion Rates of Part-Time Students by Race/Ethnicity: Fall 2012 through Fall 2014 Cohorts .............................................................................................. 6
Figure 7. Successful Course Completion Rates of Full-Time Students by Program Placement: Fall 2012 through Fall 2014 Cohorts ....................................................................................... 6
Figure 8. Successful Course Completion Rates of Part-Time Students by Program Placement: Fall 2012 through Fall 2014 Cohorts ....................................................................................... 7
ii
Appendix: Data Tables
Table A.1. Successful Course Completion by Enrollment Status and Gender: Fall 2012 through Fall 2014 Cohorts ........................................................................................................................... 8
Table A.2. Successful Course Completion by Enrollment Status and Age: Fall 2012 through Fall 2014 Cohorts ........................................................................................................................... 8
Table A.3. Successful Course Completion by Enrollment Status and Race: Fall 2012 through Fall 2014 Cohorts ........................................................................................................................... 9
Table A.4. Successful Course Completion by Enrollment Status and Program Placement: Fall 2012 through Fall 2014 Cohorts ....................................................................................................... 9

1
Successful Course Completion in First Semester by Enrollment and Demographics: Fall 2012 through Fall 2014
Introduction NOVA’s commitment to student success is supported by the College’s participation in the Achieving the Dream (ATD) National Reform Network. ATD is a comprehensive nationwide, non-governmental reform movement for student success in which NOVA has been a member since 2007 and a Leader College since 2010.1 NOVA’s participation in ATD encourages continuous monitoring of student outcomes in order to identify areas for improvement and pursue research-based methods of increasing student success and closing achievement gaps. To support this endeavor, this Report is part of a series examining recent trends among first-time to NOVA students across the following indicators of student success:
Four-Year Graduation Rates Fall-to-Fall and Fall-to-Spring Retention Success in Developmental Education Courses Developmental Student Success in College-Level Courses Success in Gatekeeper Courses Successful Course Completion (All Courses)
This Report examines data on successful course completion. Successful course completion measures the number of courses successfully completed relative to the total number of courses attempted in a given semester. Successful completion of a course is defined as a student earning either an A, B, C, P or S.2 This Report examines the rates at which three cohorts of first-time to NOVA students, Fall 2012 through Fall 2014, successfully completed courses in their first semester at NOVA. In consideration of the College’s commitment to closing achievement gaps, the data are disaggregated and analyzed by student demographics: enrollment status (full-time or part-time), gender, age, race/ethnicity, and program placement.3
1 Leader Colleges have demonstrated commitment to and progress on the five principles of Achieving the Dream and have shown at least three years of improvement on at least one of the Achieving the Dream measures of student success. For more information see http://achievingthedream.org 2 P (Pass) and S (Satisfactory) are assignations used to indicate satisfactory completion of developmental courses. These grades are not included in grade point average calculations. 3 All demographics are as of the student’s first term.

2
Executive Summary This Report examines successful course completion by first-time to NOVA students. Successful course completion measures the number of courses successfully completed relative to the total number of courses attempted in a given semester. Successful completion of a course is defined as a student earning either an A, B, C, P or S. The following points represent the main findings in this report.
Overall, rates of successful course completion in the first semester ranged from 68 to 69 percent across cohorts from Fall 2012 through Fall 2014.
Enrollment Status
Full-time students consistently completed 69 percent of their courses in their first semester, while rates for part-time students fluctuated between 65 and 69 percent.
Gender
Female students had higher rates of successful course completion than male students regardless of enrollment status, though the gap in completion rates was generally larger between part-time male and female students.
Age
More than 80 percent of each cohort of full-time students were ages 18 to 21. Course completion rates among these students remained stable at 68 percent for each cohort and were consistently lower than those of other age groups.
Students ages 18 to 21 comprised 50 to 54 percent of each cohort of part-time students. Successful course completion rates for these students remained relatively stable at 59 percent in the Fall 2012 and Fall 2014 cohorts, and were as many as 10 percentage points below the overall part-time rate in each cohort.
Race/Ethnicity
Asian students had the highest course completion rates (71 to 78 percent), while Black students had the lowest (58 to 64 percent), regardless of enrollment status.
Program Placement
Not Placed part-time students had higher course completion rates, ranging from 77 to 87 percent, than both full- and part-time program placed students.

3
Successful Course Completion in First Semester Course Completion by Enrollment Status (Table 1)
The course completion rate of full-time students remained at 69 percent for each of the three cohorts.
Course completion rates for part-time students fluctuated between 65 and 69 percent.
Table 1. Successful Course Completion by Enrollment Status: Fall 2012 through Fall 2014 Cohorts
Status Fall 2012 Cohort Fall 2013 Cohort Fall 2014 Cohort
N Successful
N Successful
N Successful
# % # % # % Full-Time 27,137 18,729 69.0 28,916 19,877 68.7 29,037 20,060 69.1Part-Time 13,857 9,450 68.2 12,881 8,369 65.0 15,419 10,628 68.9Total 40,994 28,179 68.7 41,797 28,246 67.6 44,456 30,688 69.0
Course Completion by Gender (Figures 1 and 2)
Regardless of enrollment status, female students successfully completed between 71 and 74 percent of their courses and showed higher course completion rates than male students in each cohort.
The gap between male and female students was generally larger for part-time students than full-time students, with part-time male students’ course completion rates approximately 8 to 10 percentage points lower than those of part-time female students.
Figure 1. Successful Course Completion Rates of Full-Time Students by Gender: Fall 2012 through Fall 2014 Cohorts
66% 65%
72% 73%
60%
65%
70%
75%
80%
85%
Fall 2012 Fall 2013 Fall 2014
Co
urs
e C
om
ple
tio
n R
ate
Cohort
FT Male FT Female FT Overall

4
Figure 2. Successful Course Completion Rates of Part-Time Students by Gender:
Fall 2012 through Fall 2014 Cohorts
Course Completion by Age (Figures 3 and 4)
More than 80 percent of each cohort of full-time students were ages 18 to 21. Course completion rates among these students remained stable at 68 percent for each cohort and were consistently lower than those of other age groups.
Students ages 18 to 21 comprised 50 to 54 percent of each cohort of part-time students. Successful course completion rates for these students remained relatively stable at 59 percent in the Fall 2012 and Fall 2014 cohorts, and were as many as 10 percentage points below the overall part-time rate in each cohort.
Part-time students under the age of 18 tended to have the highest course completion rates (91 and 93 percent for the Fall 2012 and Fall 2014 cohorts, respectively).4
Figure 3. Successful Course Completion Rates of Full-Time Students by Age:
Fall 2012 through Fall 2014 Cohorts
Note: The figure excludes sub-groups of small size. Data for all sub-groups can be found in the appendix.
4 Dual enrollment students comprised 93 to 97 percent of part-time students under the age of 18.
64% 64%
72% 74%
50%
60%
70%
80%
Fall 2012 Fall 2013 Fall 2014
Co
urs
e C
om
ple
tio
n R
ate
Cohort
PT Male PT Female PT Overall
74%
78%
68% 68%
75%
70%
76%75%
69%
74%
78% 79%
60%
65%
70%
75%
80%
85%
Fall 2012 Fall 2013 Fall 2014
Co
urs
e C
om
ple
tio
n R
ate
Cohort
FT Under 18 FT 18-21 FT 22-24 FT 25-29
FT 30-44 FT 45-59 FT Overall

5
Figure 4. Successful Course Completion Rates of Part-Time Students by Age: Fall 2012 through Fall 2014 Cohorts
Note: The figure excludes sub-groups of small size. Data for all sub-groups can be found in the appendix.
Course Completion by Race/Ethnicity (Figures 5 and 6)
Asian students had the highest course completion rates (74 to 78 percent), while Black students had the lowest (58 to 64 percent), regardless of enrollment status.
For both full- and part-time Black students, completion rates decreased by 2 percentage points from the Fall 2012 cohort to the Fall 2014 cohort.
White students had course completion rates at or above the overall rates, ranging from 70 to 73 percent.
Hispanic students had course completion rates at or below the overall rates, ranging from 59 to 68 percent.
Figure 5. Successful Course Completion Rates of Full-Time Students by Race/Ethnicity:
Fall 2012 through Fall 2014 Cohorts
Note: The figure excludes sub-groups of small size. Data for all sub-groups can be found in the appendix.
91%93%
59% 59%
70% 70%
76% 77%76%75%
78%77%
50%
60%
70%
80%
90%
100%
Fall 2012 Fall 2013 Fall 2014
Co
urs
e C
om
ple
tio
n R
ate
Cohort
PT Under 18 PT 18-21 PT 22-24 PT 25-29
PT 30-44 PT 45-59 PT Overall
70% 72%
64% 62%
78% 77%
66% 66%
50%
60%
70%
80%
90%
Fall 2012 Fall 2013 Fall 2014
Co
urs
e C
om
ple
tio
n R
ate
Cohort
FT White FT Black FT Asian FT Hispanic FT Overall

6
Figure 6. Successful Course Completion Rates of Part-Time Students by Race/Ethnicity:
Fall 2012 through Fall 2014 Cohorts
Note: The figure excludes sub-groups of small size. Data for all sub-groups can be found in the appendix.
Course Completion by Program Placement (Figures 7 and 8)
A.S. degree students comprised the majority of full-time students and had course completion rates at or above the overall full-time rate in each cohort. These students’ completion rates remained relatively stable across cohorts, ranging from 69 to 70 percent.
Not Placed part-time students – students who were not enrolled in a degree or certificate program – had the highest course completion rates in each part-time cohort, increasing from 84 percent in Fall 2012 to 87 percent in the Fall 2014 cohort.
Part-time students enrolled in the A.A., A.A.S., and A.S. degree programs had course completion rates below the overall part-time rate.
Figure 7. Successful Course Completion Rates of Full-Time Students by Program Placement: Fall 2012 through Fall 2014 Cohorts
Note: The figure excludes sub-groups of small size. Data for all sub-groups can be found in the appendix.
71% 73%
60%58%
74%78%
67%65%
50%
60%
70%
80%
90%
Fall 2012 Fall 2013 Fall 2014
Co
urs
e C
om
ple
tio
n R
ate
Cohort
PT White PT Black PT Asian PT Hispanic PT Overall
68%
70%70%69%69% 68%
62%
66%66%
71%
55%
60%
65%
70%
75%
Fall 2012 Fall 2013 Fall 2014
Co
urs
e C
om
ple
tio
n R
ate
Cohort
A.A. A.S. A.A.S.Certificate Not Placed FT Overall

7
Figure 8. Successful Course Completion Rates of Part-Time Students by Program Placement:
Fall 2012 through Fall 2014 Cohorts
Note: The figure excludes sub-groups of small size. Data for all sub-groups can be found in the appendix.
63% 62%64%61%
58% 59%
66%69%
84%
87%
55%
60%
65%
70%
75%
80%
85%
90%
Fall 2012 Fall 2013 Fall 2014
Co
urs
e C
om
ple
tio
n R
ate
Cohort
A.A. A.S. A.A.S.
Certificate Not Placed PT Overall
8
Appendix: Data Tables
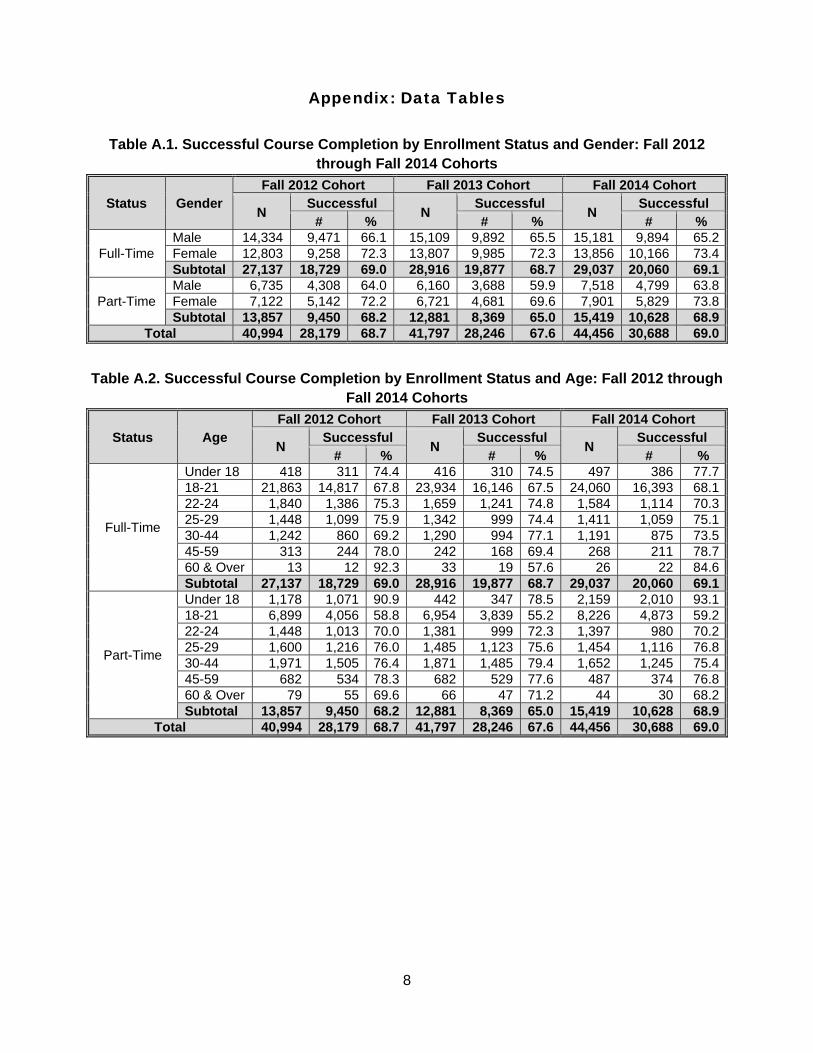
Table A.1. Successful Course Completion by Enrollment Status and Gender: Fall 2012 through Fall 2014 Cohorts
Status Gender Fall 2012 Cohort Fall 2013 Cohort Fall 2014 Cohort
N Successful
N Successful
N Successful
# % # % # %
Full-Time Male 14,334 9,471 66.1 15,109 9,892 65.5 15,181 9,894 65.2Female 12,803 9,258 72.3 13,807 9,985 72.3 13,856 10,166 73.4Subtotal 27,137 18,729 69.0 28,916 19,877 68.7 29,037 20,060 69.1
Part-Time Male 6,735 4,308 64.0 6,160 3,688 59.9 7,518 4,799 63.8Female 7,122 5,142 72.2 6,721 4,681 69.6 7,901 5,829 73.8Subtotal 13,857 9,450 68.2 12,881 8,369 65.0 15,419 10,628 68.9
Total 40,994 28,179 68.7 41,797 28,246 67.6 44,456 30,688 69.0
Table A.2. Successful Course Completion by Enrollment Status and Age: Fall 2012 through
Fall 2014 Cohorts
Status Age Fall 2012 Cohort Fall 2013 Cohort Fall 2014 Cohort
N Successful
N Successful
N Successful
# % # % # %
Full-Time
Under 18 418 311 74.4 416 310 74.5 497 386 77.718-21 21,863 14,817 67.8 23,934 16,146 67.5 24,060 16,393 68.122-24 1,840 1,386 75.3 1,659 1,241 74.8 1,584 1,114 70.325-29 1,448 1,099 75.9 1,342 999 74.4 1,411 1,059 75.130-44 1,242 860 69.2 1,290 994 77.1 1,191 875 73.545-59 313 244 78.0 242 168 69.4 268 211 78.760 & Over 13 12 92.3 33 19 57.6 26 22 84.6Subtotal 27,137 18,729 69.0 28,916 19,877 68.7 29,037 20,060 69.1
Part-Time
Under 18 1,178 1,071 90.9 442 347 78.5 2,159 2,010 93.118-21 6,899 4,056 58.8 6,954 3,839 55.2 8,226 4,873 59.222-24 1,448 1,013 70.0 1,381 999 72.3 1,397 980 70.225-29 1,600 1,216 76.0 1,485 1,123 75.6 1,454 1,116 76.830-44 1,971 1,505 76.4 1,871 1,485 79.4 1,652 1,245 75.445-59 682 534 78.3 682 529 77.6 487 374 76.860 & Over 79 55 69.6 66 47 71.2 44 30 68.2Subtotal 13,857 9,450 68.2 12,881 8,369 65.0 15,419 10,628 68.9
Total 40,994 28,179 68.7 41,797 28,246 67.6 44,456 30,688 69.0

9
Table A.3. Successful Course Completion by Enrollment Status and Race: Fall 2012 through Fall 2014 Cohorts
Status Race/Ethnicity Fall 2012 Cohort Fall 2013 Cohort Fall 2014 Cohort
N Successful
N Successful
N Successful
# % # % # %
Full-Time
White 10,445 7,309 70.0 10,398 7,242 69.7 9,741 6,969 71.5Black 4,698 3,026 64.4 4,951 3,082 62.3 4,979 3,097 62.2Asian 4,439 3,443 77.6 4,701 3,592 76.4 4,890 3,764 77.0Hispanic 5,818 3,818 65.6 6,722 4,556 67.8 7,422 4,878 65.7American Indian 41 19 46.3 52 34 65.4 61 49 80.3Native Hawaiian 152 107 70.4 125 68 54.4 149 92 61.7Two or More Races 1,145 748 65.3 1,526 967 63.4 1,369 897 65.5Not Specified 28 14 50.0 28 17 60.7 12 5 41.7Unknown 371 245 66.0 413 319 77.2 414 309 74.6Subtotal 27,137 18,729 69.0 28,916 19,877 68.7 29,037 20,060 69.1
Part-Time
White 6,445 4,564 70.8 5,555 3,866 69.6 6,599 4,819 73.0Black 2,635 1,590 60.3 2,482 1,457 58.7 2,740 1,581 57.7Asian 1,460 1,077 73.8 1,344 958 71.3 1,713 1,343 78.4Hispanic 2,431 1,623 66.8 2,525 1,498 59.3 3,217 2,077 64.6American Indian 36 25 69.4 37 15 40.5 35 28 80.0Native Hawaiian 64 42 65.6 73 43 58.9 74 63 85.1Two or More Races 581 373 64.2 577 310 53.7 774 502 64.9Not Specified 16 14 87.5 19 16 84.2 13 11 84.6Unknown 189 142 75.1 269 206 76.6 254 204 80.3Subtotal 13,857 9,450 68.2 12,881 8,369 65.0 15,419 10,628 68.9
Total 40,994 28,179 68.7 41,797 28,246 67.6 44,456 30,688 69.0
Table A.4. Successful Course Completion by Enrollment Status and Program Placement:
Fall 2012 through Fall 2014 Cohorts
Status Age Fall 2012 Cohort Fall 2013 Cohort Fall 2014 Cohort
N Successful
N Successful
N Successful
# % # % # %
Full-Time
A.A. 3,468 2,347 67.7 3,173 2,177 68.6 3,308 2,302 69.6A.A.A. 181 86 47.5 109 90 82.6 68 40 58.8A.A.S. 4,256 2,930 68.8 3,347 2,228 66.6 3,356 2,294 68.4A.S. 16,984 11,916 70.2 20,554 14,229 69.2 20,875 14,445 69.2Certificate 933 581 62.3 772 464 60.1 636 417 65.6Not Placed 1,315 869 66.1 961 689 71.7 794 562 70.8Subtotal 27,137 18,729 69.0 28,916 19,877 68.7 29,037 20,060 69.1
Part-Time
A.A. 1,150 722 62.8 1,149 690 60.1 1,103 680 61.7A.A.A. 90 54 60.0 63 32 50.8 45 39 86.7A.A.S. 2,169 1,264 58.3 1,983 1,233 62.2 1,619 947 58.5A.S. 6,078 3,893 64.1 6,537 4,042 61.8 7,435 4,522 60.8Certificate 741 487 65.7 690 474 68.7 655 452 69.0Not Placed 3,629 3,030 83.5 2,459 1,898 77.2 4,562 3,988 87.4Subtotal 13,857 9,450 68.2 12,881 8,369 65.0 15,419 10,628 68.9
Total 40,994 28,179 68.7 41,797 28,246 67.6 44,456 30,688 69.0
NOVA Mission and Strategic Goals
Mission
With commitment to the values of access, opportunity, student success, and excellence, the mission of Northern Virginia Community College is to deliver world-class in-person and online post-secondary teaching, learning, and workforce development to ensure our region and the Commonwealth of Virginia have an educated population and globally competitive workforce.
Strategic Goals
I. STUDENT SUCCESS – Northern Virginia Community College will move into the top tier
of community colleges with respect to the college readiness, developmental course completion, retention, graduation, transfer, and career placement of its students.
II. ACCESS – Northern Virginia Community College will increase the number and diversity
of students being served to mirror the population growth of the region.
III. TEACHING AND LEARNING – Northern Virginia Community College will focus on student success by creating an environment of world-class teaching and learning.
IV. EXCELLENCE – Northern Virginia Community College will develop ten focal points of
excellence in its educational programs and services that will be benchmarked to the best in the nation and strategic to building the College's overall reputation for quality.
V. LEADERSHIP – Northern Virginia Community College will serve as a catalyst and a
leader in developing educational and economic opportunities for all Northern Virginians and in maintaining the quality of life and economic competitiveness of the region.
VI. PARTNERSHIPS – Northern Virginia Community College will develop strategic partnerships to create gateways of opportunity and an integrated educational system for Northern Virginians who are pursuing the American Dream.
VII. RESOURCES – Northern Virginia Community College will increase its annual funding
by $100 million and expand its physical facilities by more than one million square feet in new and renovated space. This includes the establishment of two additional campuses at epicenters of the region’s population growth, as well as additional education and training facilities in or near established population centers.
VIII. EMERGENCY PREPAREDNESS AND CONTINUITY OF OPERATIONS – Northern
Virginia Community College will be recognized as a leader among institutions of higher education in Virginia for its development and testing of emergency response and continuity of operation plans.

703–323–3000 | www.nvcc.edu