COUPLING EFFECTS BETWEEN TANK SLOSHING AND · PDF fileit is not feasible to carry out model...
8
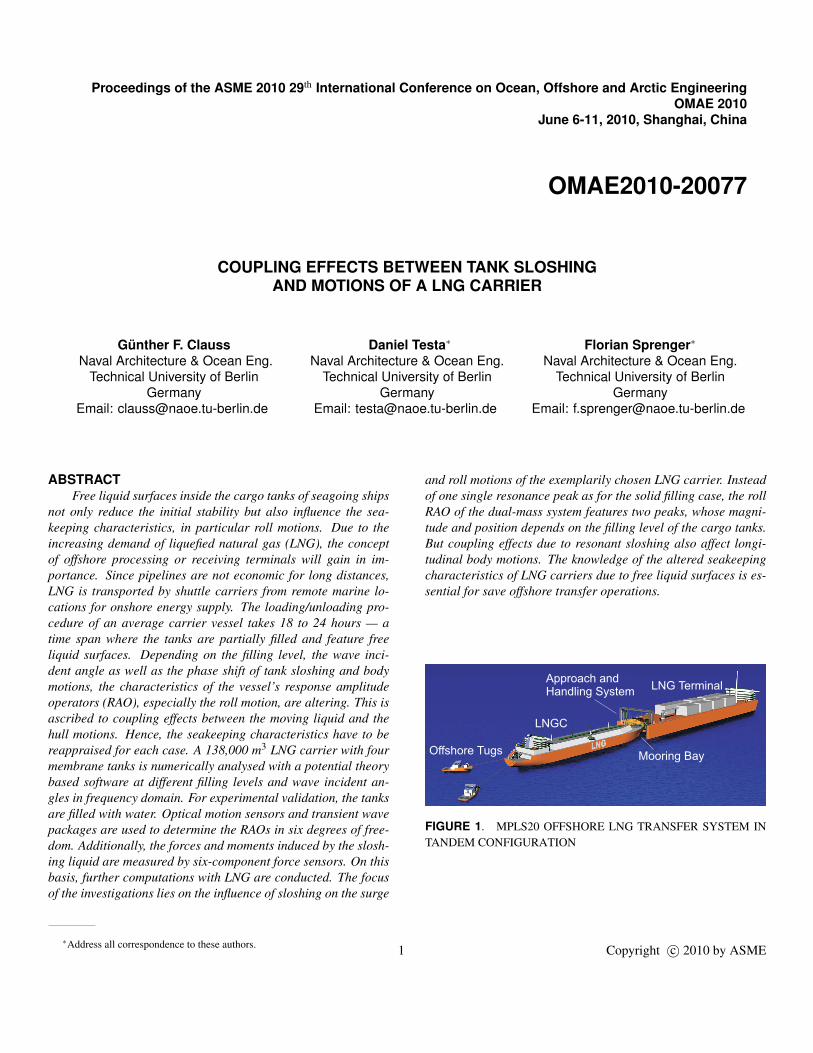
Proceedings of the ASME 2010 29 th International Conference on Ocean, Offshore and Arctic Engineering OMAE 2010 June 6-11, 2010, Shanghai, China OMAE2010-20077 COUPLING EFFECTS BETWEEN TANK SLOSHING AND MOTIONS OF A LNG CARRIER G¨ unther F. Clauss Naval Architecture & Ocean Eng. Technical University of Berlin Germany Email: [email protected] Daniel Testa * Naval Architecture & Ocean Eng. Technical University of Berlin Germany Email: [email protected] Florian Sprenger * Naval Architecture & Ocean Eng. Technical University of Berlin Germany Email: [email protected] ABSTRACT Free liquid surfaces inside the cargo tanks of seagoing ships not only reduce the initial stability but also influence the sea- keeping characteristics, in particular roll motions. Due to the increasing demand of liquefied natural gas (LNG), the concept of offshore processing or receiving terminals will gain in im- portance. Since pipelines are not economic for long distances, LNG is transported by shuttle carriers from remote marine lo- cations for onshore energy supply. The loading/unloading pro- cedure of an average carrier vessel takes 18 to 24 hours — a time span where the tanks are partially filled and feature free liquid surfaces. Depending on the filling level, the wave inci- dent angle as well as the phase shift of tank sloshing and body motions, the characteristics of the vessel’s response amplitude operators (RAO), especially the roll motion, are altering. This is ascribed to coupling effects between the moving liquid and the hull motions. Hence, the seakeeping characteristics have to be reappraised for each case. A 138,000 m 3 LNG carrier with four membrane tanks is numerically analysed with a potential theory based software at different filling levels and wave incident an- gles in frequency domain. For experimental validation, the tanks are filled with water. Optical motion sensors and transient wave packages are used to determine the RAOs in six degrees of free- dom. Additionally, the forces and moments induced by the slosh- ing liquid are measured by six-component force sensors. On this basis, further computations with LNG are conducted. The focus of the investigations lies on the influence of sloshing on the surge * Address all correspondence to these authors. and roll motions of the exemplarily chosen LNG carrier. Instead of one single resonance peak as for the solid filling case, the roll RAO of the dual-mass system features two peaks, whose magni- tude and position depends on the filling level of the cargo tanks. But coupling effects due to resonant sloshing also affect longi- tudinal body motions. The knowledge of the altered seakeeping characteristics of LNG carriers due to free liquid surfaces is es- sential for save offshore transfer operations. Offshore Tugs LNGC Approach and Handling System Mooring Bay LNG Terminal FIGURE 1. MPLS20 OFFSHORE LNG TRANSFER SYSTEM IN TANDEM CONFIGURATION 1 Copyright c 2010 by ASME
Transcript of COUPLING EFFECTS BETWEEN TANK SLOSHING AND · PDF fileit is not feasible to carry out model...
Proceedings of the ASME 2010 29th International Conference on Ocean, Offshore and Arctic EngineeringOMAE 2010
June 6-11, 2010, Shanghai, China
OMAE2010-20077
COUPLING EFFECTS BETWEEN TANK SLOSHINGAND MOTIONS OF A LNG CARRIER
Gunther F. ClaussNaval Architecture & Ocean Eng.
Technical University of BerlinGermany
Email: [email protected]
Daniel Testa∗Naval Architecture & Ocean Eng.
Technical University of BerlinGermany
Email: [email protected]
Florian Sprenger∗Naval Architecture & Ocean Eng.
Technical University of BerlinGermany
Email: [email protected]
ABSTRACTFree liquid surfaces inside the cargo tanks of seagoing ships
not only reduce the initial stability but also influence the sea-keeping characteristics, in particular roll motions. Due to theincreasing demand of liquefied natural gas (LNG), the conceptof offshore processing or receiving terminals will gain in im-portance. Since pipelines are not economic for long distances,LNG is transported by shuttle carriers from remote marine lo-cations for onshore energy supply. The loading/unloading pro-cedure of an average carrier vessel takes 18 to 24 hours — atime span where the tanks are partially filled and feature freeliquid surfaces. Depending on the filling level, the wave inci-dent angle as well as the phase shift of tank sloshing and bodymotions, the characteristics of the vessel’s response amplitudeoperators (RAO), especially the roll motion, are altering. This isascribed to coupling effects between the moving liquid and thehull motions. Hence, the seakeeping characteristics have to bereappraised for each case. A 138,000 m3 LNG carrier with fourmembrane tanks is numerically analysed with a potential theorybased software at different filling levels and wave incident an-gles in frequency domain. For experimental validation, the tanksare filled with water. Optical motion sensors and transient wavepackages are used to determine the RAOs in six degrees of free-dom. Additionally, the forces and moments induced by the slosh-ing liquid are measured by six-component force sensors. On thisbasis, further computations with LNG are conducted. The focusof the investigations lies on the influence of sloshing on the surge
∗Address all correspondence to these authors.
and roll motions of the exemplarily chosen LNG carrier. Insteadof one single resonance peak as for the solid filling case, the rollRAO of the dual-mass system features two peaks, whose magni-tude and position depends on the filling level of the cargo tanks.But coupling effects due to resonant sloshing also affect longi-tudinal body motions. The knowledge of the altered seakeepingcharacteristics of LNG carriers due to free liquid surfaces is es-sential for save offshore transfer operations.
Offshore Tugs
LNGC
Approach andHandling System
Mooring Bay
LNG Terminal
FIGURE 1. MPLS20 OFFSHORE LNG TRANSFER SYSTEM INTANDEM CONFIGURATION
1 Copyright c© 2010 by ASME

INTRODUCTIONFor several decades, natural gas was merely a byproduct of
oil production. Today, its importance as energy source is stillgrowing. Large quantities of natural gas are produced from off-shore fields, with associated problems of transportation to furtheronshore processing. Especially for remote marine gas fields, thedeployment of LNG tank ships (Liquefied Natural Gas) is a moreeconomic alternative to pipelines — with increasing significance(see RINA [1]).
As published by Cook [2], only one floating offshore LNGtransfer system — based on the emergency unloading technology— was tested in calm water conditions and side-by-side configu-ration using 8” non-insulated composite hoses until today. How-ever, Frohne et al. [3] state that the increasing loading capacityof currently built LNG carriers (up to 260,000 m3) creates a newmarket for fast and safe loading/offloading concepts — i.e. largerpipe diameters and transfer operations in rough seas.
Offshore terminal designs for production and processing ofnatural gas are typically fixed at a certain location by turret moor-ing and transfer the liquefied gas to periodically operating shuttletankers in side-by-side configuration.
In the framework of the joint research project Maritime PipeLoading System 20” (MPLS20), an innovative offshore transfersystem between a turret moored terminal barge and a shuttle car-rier in tandem configuration is developed and analysed by Clausset al. [4] and Hoog et al. [5]. Brugg Pipe Systems is designinga corrugated transfer pipe of 16” inner diameter for LNG load-ing/offloading — which is significantly exceeding currently ex-isting pipe diameters and hence transfer rates. The work of Nex-ans focusses on the manufacturing technology of the vacuum in-sulated transfer pipes, IMPaC Offshore Engineering GmbH is inauthority of the approaching and handling system and TechnicalUniversity Berlin is conducting model tests as well as numericalsimulations in order to analyse the hydrodynamical characteris-tics of the coupled system.
As fluid sloshing inside the cargo tanks significantly influ-ences the vessel’s seakeeping behavior, the knowledge of theexpected filling height-dependent system motions during load-ing/offloading procedures is essential in order to assure safe oper-ations. This scenario is numerically and experimentally analysedfor the exemplary LNG carrier described by Tab. 1 and Tab. 2,respectively.
Newman [6] conducted numerical investigations where cou-pled vessel motions of a spheroidal hull with three partially filledtanks were analysed using a linear potential theory based ap-proach. Gaillarde et al. [7] carried out model tests as well asnumerical simulations for a LNG-FPSO, assessing coupled rollmotions at different filling ratios. Molin et al. [8, 9] proposed atheoretical method to predict the combined dynamics of a bargehull and sloshing in internal tanks and also conducted experimen-tal studies focussing on high tank filling levels and roof impactsfor different tank geometries. Lee et al. [10] analysed the effects
FIGURE 2. PRINCIPAL 3D-SKETCH OF THE PRISMATIC TANKWITH ALL RELEVANT DIMENSIONS
of tank sloshing on roll and pitch motions of an LNG vessel.In this paper the motion behavior of a LNG-Carrier (LNGC)
with 138,000 m3 loading capacity and 4 membrane tanks is sys-tematically analysed for four different filling levels (100 % (solidfilling), h1 = 30 %, h2 = 20 % and h3 = 10 % filling height) at aconstant draught of 12 m and 100 m water depth. Tab. 1 showsthe main dimensions of the LNGC and the cargo tanks. For clar-ification, Fig. 2 provides a 3D sketch of the prismatic tank. As
TABLE 1. MAIN DIMENSIONS OF THE LNGC AND THETANKS (FULL SCALE)
Parameter Dimension
Length over all 282 m
Breadth 42 m
Draught 12 m
Height 26 m
Displacement 103,921 m3
Loading capacity 138,000 m3
Tank length LT 38.3 m
Tank breadth BT 35.8 m
Tank height HT 26.1 m
δ1 4.65 m
δ2 5.0 m
2 Copyright c© 2010 by ASME

it is not feasible to carry out model tests with hazardous liquidslike LNG, a numerical model is firstly validated and calibratedfor water filling by comparing Response Amplitude Operators(RAO). Subsequently, numerical simulations with LNG fillingare conducted.
EXPERIMENTAL SETUPFor experimental investigations, a glass-fibre reinforced
plastic (GRP) model of the LNG carrier as shown in Fig. 3, top,and described in Tab. 1 is built at a scale of 1:100. All testsare carried out in the seakeeping basin of Technical UniversityBerlin. The carrier model is soft-moored and equipped with fourwireless, individually pulsed infrared sensors. The body motionsin six degrees of freedom are precisely tracked by five camerasmounted on a carriage above the basin with a tracking range of8 × 10 m. Also, the foremost and sternmost tanks are placed onsix-component force sensors to measure the forces and momentsbetween tanks and hull (see Fig. 3, centre). A ship-fixed cameralocated at the stern of the vessel records the interior fluid motionsin the tanks. Test series with filling levels of 10 %, 20 % and 30 %water in all four tanks have been conducted at a constant draughtof 12 m (full scale). In order to analyse the seakeeping char-acteristics of the carrier in these different loading conditions infrequency domain, transient wave packet technique as proposedby Clauss and Kuhnlein [11] is applied.
In Tab. 2, all relevant model test parameters are listed in de-pendency of the filling ratio. The filling height (f.h.) is denotedby h, the mass of water inside the four tanks by mT , the height ofthe centre of gravity above keel for the hull including ballast byKGH and the radii of gyration by ixx, iyy and izz, respectively.
TABLE 2. MODEL TEST PARAMETERS IN DEPENDENCY OFTHE FILLING HEIGHT (FULL SCALE)
Parameter 10 % f.h. 20 % f.h. 30 % f.h. solid filling
h [m] 2.6 4.9 7.9 —
mT [kg] 1.05e07 2.16e07 3.97e07 —
KGH [m] 12.85 12.36 12.57 15.13
ixx,H [m] 14.62 14.67 15.22 12.57
iyy,H [m] 80.63 82.61 82.14 72.17
izz,H [m] 81.18 83.25 82.48 72.95
ship-fixed camera
force sensors
plexiglass tanks
carrier hull
FIGURE 3. GRP MODEL OF THE LNG CARRIER IN THE SEA-KEEPING BASIN AT A MODEL SCALE OF 1:100 (TOP); LON-GITUDINAL CUT THROUGH A 3D SKETCH OF THE LNGCSHOWING THE FOUR INTEGRATED PLEXIGLASS TANKS, THETWO SIX-COMPONENT FORCE SENSORS AND THE ON-BOARDCAMERA (CENTRE); LNGC DISCRETISATION WITH 6432 PAN-ELS FOR NUMERICAL ANALYSES WITH 30 % TANK FILLING(BOTTOM)
NUMERICAL SETUPAll numerical simulations are conducted in frequency do-
main with the radiation-diffraction panel code WAMIT (WaveAnalysis at Massachusetts Institute of Technology, [12]), whichis based on potential theory and is widely accepted as a reliabletool for hydrodynamic analyses in offshore technology. Fromversion 6.2 on, WAMIT is capable of analyzing internal tanksand linear tank/ship interaction. As described by Newman [6],the interior wetted tank surfaces are considered as an extensionof the exterior wetted body surface to form one global boundarysurface with two independent fluid domains and separate sets oflinear equations. Tank filling heights as well as the density ofthe internal fluid can be chosen arbitrarily (in this case: water998.2 kg/m3, LNG 435 kg/m3).
Since only potential damping is considered in this linear ap-
3 Copyright c© 2010 by ASME

proach, viscous damping effects — in particular for roll motions— have to be taken into account by modifying the respectivedamping terms for the equations of motion. The viscous partof the total damping is determined by subtracting the potentialdamping calculated by WAMIT from the total damping deter-mined by decay tests with the carrier hull at solid filling con-dition. Since the model tests do not take into account scaledviscosities (exclusively Froude-compliant), the total damping isoverestimated compared to full scale values. Based on these re-sults, an external viscous damping matrix is implemented in thenumerical code. Fig. 3, bottom, shows the discretisation of thecarrier hull and the four prismatic tanks by 6432 panels for the30 % tank filling case.
SLOSHING VALIDATION WITH WATERSince hazardous liquids like LNG cannot easily be used in
model tests, this cargo can only be investigated numerically. Inorder to calibrate and validate the numerical code, model test andcalculations with water are conducted first. Three different fillingheights h are considered, but in the following, 30 % tank fillingis regarded exclusively, i.e. h = 7.9 m (full scale). The validationof the numerical method is achieved by comparison of RAOs ofthe rigid body motions of the LNGC with partially filled tanks.In Fig. 4, the numerically computed RAOs for surge and pitch(incident wave angle β = 180◦, blue box) as well as sway androll (β = 90◦, orange box) are compared to model test results.
� = 90° � = 180°
0 0.2 0.4 0.6 0.8 10
5
10
15
20
25
roll
ω [rad/s]
s4
a/ζ
a[°
/m]
0 0.2 0.4 0.6 0.8 10
0.5
1
1.5
ω [rad/s]
s2
a/ζ
a[m
/m]
WAMIT(solid filling)
WAMIT (30%)
model test (30%)
sway
0 0.2 0.4 0.6 0.8 10
0.5
1
1.5
ω [rad/s]
s1
a/ζ
a[m
/m]
surge
0 0.2 0.4 0.6 0.8 10
0.2
0.4
0.6
0.8
1
ω [rad/s]
s5
a/ζ
a[°
/m]
pitch
FIGURE 4. COMPARISON BETWEEN WAMIT COMPUTA-TIONS (SOLID FILLING AND 30 % FILLING HEIGHT) ANDMODEL TEST RESULTS FOR SURGE AND PITCH (β = 180◦,BLUE BOX) AS WELL AS SWAY AND ROLL (β = 90◦, ORANGEBOX) MOTIONS AT 30 % TANK FILLING (WATER)
Model test results and numerical computations show excel-lent agreement. For highlighting the deviating characteristics be-tween solid filling and partial filling, Fig. 4 also includes the casewithout free fluid surfaces computed by WAMIT. For solid fill-ing, the surge motion continuously converges to zero in shortwaves while for 30 % filling height, a prominent peak appears atω = 0.74 rad/s. The pitch motion for the partial filling case showsno significant deviations compared to solid filling. In beam seas(β = 90◦), the sway motion with free fluid surfaces features alocal maximum at ω = 0.86 rad/s instead of ω = 0.44 rad/s,which can be ascribed to coupling with the roll motion, thatshows the most significant deviations. Instead of one high soli-tary resonance peak as for solid filling at ω = 0.44 rad/s, the rollRAO for 30 % filling height features two smaller peaks — oneat a lower (ω = 0.2 rad/s) and one at a higher wave frequency(ω = 0.86 rad/s). The internal fluid acts as a roll damping sys-tem leading to peaks of low magnitude outside the region wheresignificant spectral wave energy is usually expected. The phe-nomenon of the drastically changing roll characteristics can beascribed to the dual-mass system of carrier and freely moving in-terior fluid. In order to interpret the roll motion characteristicswith free fluid surfaces inside the cargo tanks, Fig. 5 shows snapshots of the fluid motion inside the sternmost tank taken from theon-board camera for 30 % filling height. The three pictures inthe top row show fluid motion in regular waves (β = 90◦) withω = 0.2 rad/s, i.e. the low-frequency roll peak, the centre pic-tures show snapshots of the fluid motion for the high-frequencyroll peak (ω = 0.86 rad/s) and the bottom row represents the surgemotion peak at ω = 0.74 rad/s.
�
�
= 0.2 rad/s
= 90°
�
�
= 0.86 rad/s
= 90°
�
�
= 0.74 rad/s
= 180°
FIGURE 5. SNAP SHOTS FROM THE ON-BOARD CAMERA INREGULAR WAVES. ω = 0.2 rad/s (TOP, β = 90◦), ω = 0.86 rad/s(CENTRE, β = 90◦) AND ω = 0.74 rad/s (BOTTOM, β = 180◦)
4 Copyright c© 2010 by ASME
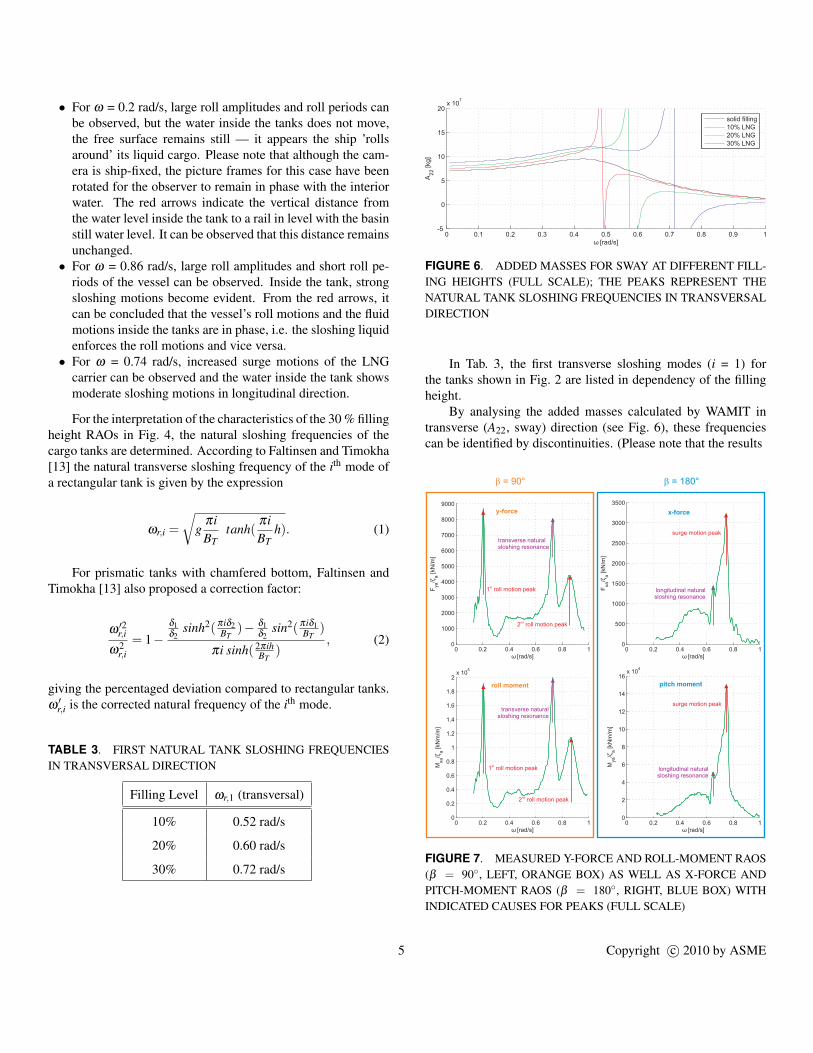
• For ω = 0.2 rad/s, large roll amplitudes and roll periods canbe observed, but the water inside the tanks does not move,the free surface remains still — it appears the ship ’rollsaround’ its liquid cargo. Please note that although the cam-era is ship-fixed, the picture frames for this case have beenrotated for the observer to remain in phase with the interiorwater. The red arrows indicate the vertical distance fromthe water level inside the tank to a rail in level with the basinstill water level. It can be observed that this distance remainsunchanged.• For ω = 0.86 rad/s, large roll amplitudes and short roll pe-
riods of the vessel can be observed. Inside the tank, strongsloshing motions become evident. From the red arrows, itcan be concluded that the vessel’s roll motions and the fluidmotions inside the tanks are in phase, i.e. the sloshing liquidenforces the roll motions and vice versa.• For ω = 0.74 rad/s, increased surge motions of the LNG
carrier can be observed and the water inside the tank showsmoderate sloshing motions in longitudinal direction.
For the interpretation of the characteristics of the 30 % fillingheight RAOs in Fig. 4, the natural sloshing frequencies of thecargo tanks are determined. According to Faltinsen and Timokha[13] the natural transverse sloshing frequency of the ith mode ofa rectangular tank is given by the expression
ωr,i =
√g
πiBT
tanh(πiBT
h). (1)
For prismatic tanks with chamfered bottom, Faltinsen andTimokha [13] also proposed a correction factor:
ω ′2r,i
ω2r,i
= 1−δ1δ2
sinh2(πiδ2BT
)− δ1δ2
sin2(πiδ1BT
)
πi sinh( 2πihBT
), (2)
giving the percentaged deviation compared to rectangular tanks.ω ′r,i is the corrected natural frequency of the ith mode.
TABLE 3. FIRST NATURAL TANK SLOSHING FREQUENCIESIN TRANSVERSAL DIRECTION
Filling Level ωr,1 (transversal)
10% 0.52 rad/s
20% 0.60 rad/s
30% 0.72 rad/s
0 0.1 0.2 0.3 0.4 0.5 0.6 0.7 0.8 0.9 1-5
0
5
10
15
20x 10
7
ω [rad/s]
A22
[kg
]
solid filling
10% LNG
20% LNG
30% LNG
FIGURE 6. ADDED MASSES FOR SWAY AT DIFFERENT FILL-ING HEIGHTS (FULL SCALE); THE PEAKS REPRESENT THENATURAL TANK SLOSHING FREQUENCIES IN TRANSVERSALDIRECTION
In Tab. 3, the first transverse sloshing modes (i = 1) forthe tanks shown in Fig. 2 are listed in dependency of the fillingheight.
By analysing the added masses calculated by WAMIT intransverse (A22, sway) direction (see Fig. 6), these frequenciescan be identified by discontinuities. (Please note that the results
0 0.2 0.4 0.6 0.8 10
1000
2000
3000
4000
5000
6000
7000
8000
9000
ω [rad/s]
Fya/ζ
a[k
N/m
]
y-force
2 roll motion peaknd
1 roll motion peakst
transverse naturalsloshing resonance
[rad/s]
0 0.2 0.4 0.6 0.8 10
0.2
0.4
0.6
0.8
1
1.2
1.4
1.6
1.8
2x 10
5
roll moment
ω
Mxa/ζ
a[k
Nm
/m]
1 roll motion peakst
transverse naturalsloshing resonance
2 roll motion peaknd
� = 90° � = 180°
0 0.2 0.4 0.6 0.8 10
2
4
6
8
10
12
14
16x 10
4
pitch moment
ω [rad/s]
Mya/ζ
a[k
Nm
/m]
longitudinal naturalsloshing resonance
surge motion peak
0 0.2 0.4 0.6 0.8 10
500
1000
1500
2000
2500
3000
3500
x-force
ω [rad/s]
Fxa/ζ
a[k
N/m
]
longitudinal naturalsloshing resonance
surge motion peak
FIGURE 7. MEASURED Y-FORCE AND ROLL-MOMENT RAOS(β = 90◦, LEFT, ORANGE BOX) AS WELL AS X-FORCE ANDPITCH-MOMENT RAOS (β = 180◦, RIGHT, BLUE BOX) WITHINDICATED CAUSES FOR PEAKS (FULL SCALE)
5 Copyright c© 2010 by ASME

0 0.2 0.4 0.6 0.8 10
0.5
1
1.5
2
ω [rad/s]
s2a/ζ
a[m
/m]
solid filling
10% LNG
20% LNG
30% LNG
0 0.2 0.4 0.6 0.8 10
0.5
1
1.5
ω [rad/s]s
3a/ζ
a[m
/m]
0 0.2 0.4 0.6 0.8 10
5
10
15
20
25
ω [rad/s]
s4a/ζ
a[°
/m]
wave incident angle = 90°�
0 0.2 0.4 0.6 0.8 10
0.5
1
1.5
2
ω [rad/s]
s1a/ζ
a[m
/m]
0 0.2 0.4 0.6 0.8 10
0.5
1
1.5
ω [rad/s]
s3a/ζ
a[m
/m]
0 0.2 0.4 0.6 0.8 10
0.2
0.4
0.6
0.8
1
ω [rad/s]
s5a/ζ
a[°
/m]
wave incident angle = 180°�
0 0.2 0.4 0.6 0.8 10
0.5
1
1.5
2
ω [rad/s]
s1a/ζ
a[m
/m]
0 0.2 0.4 0.6 0.8 10
5
10
15
20
25
ω [rad/s]
s4a/ζ
a[°
/m]
0 0.2 0.4 0.6 0.8 10
0.5
1
1.5
2
ω [rad/s]
s2a/ζ
a[m
/m]
0 0.2 0.4 0.6 0.8 10
0.2
0.4
0.6
0.8
1
ω [rad/s]
s5a/ζ
a[°
/m]
0 0.2 0.4 0.6 0.8 10
0.5
1
1.5
ω [rad/s]
s3a/ζ
a[m
/m]
0 0.2 0.4 0.6 0.8 10
0.2
0.4
0.6
0.8
1
ω [rad/s]
s6a/ζ
a[°
/m]
wave incident angle = 120°�
sway heave
roll
surge heavesway
pitch yaw
roll
surge heave pitch
FIGURE 8. COMPARISON OF RAOS FOR DIFFERENT LNG FILLING LEVELS AND WAVE INCIDENT ANGLES OBTAINED BY WAMIT
6 Copyright c© 2010 by ASME

become better for higher filling levels, since Eqs. (1) and (2) arevalid only for filling levels above the chamfers.)
Considering the forces and moments induced by the sloshingfluid on the carrier hull, Fig. 7 shows that the first natural slosh-ing frequencies are reflected in these RAOs, resulting in strongpeaks in the transversal direction (β = 90◦, ω = 0.72 rad/s, see or-ange box in Fig. 8) and small peaks in the longitudinal direction(β = 180◦, ω = 0.68 rad/s, see blue box in Fig. 8). As indicated,the other maximum values are caused by peaks in the respec-tive vessel motion RAOs. However, Fig. 4 shows that the motionpeaks related to sloshing phenomena do not exactly appear at thenatural tank sloshing frequency but are shifted towards higherfrequencies where the magnitude. This deviation depends on thefluid mass inside the tanks.
SLOSHING ANALYSES WITH LNGIn the preceding section, the numerical approach is success-
fully validated for water filling. Now, the cargo tanks are sim-ulated with LNG instead, which cannot be achieved by modeltests. In Fig. 8, the numerical results for 10 %, 20 % and 30 %LNG filling ratio are presented. Inside the orange box (top),sway, heave and roll for β = 90◦ are presented. The heave mo-tion shows no dependency on the filling ratio, while sway and inparticular roll feature significant changes in the motion charac-teristics. Similar to the observations for water filling in the pre-vious section, one low-frequency and one high-frequency peakappears. For higher filling ratios, the high-frequency peak shiftsinto higher frequencies while it decreases. Due to the differentdensities of water (ρ = 998.2 kg/m3) and LNG (ρ = 435 kg/m3),the roll maxima for both cases are not identical. As Fig. 9 il-lustrates for different filling levels, the high-frequency peaks (re-lated to the transversal sloshing resonances) for LNG appear at
0 0.1 0.2 0.3 0.4 0.5 0.6 0.7 0.8 0.9 10
5
10
15
20
25
� [rad/s]
s/
[°/m
]4
aa
�
solid filling
LNGH O2
20%
10%
30%
sloshing inducedresonances
rigid body resonances
FIGURE 9. COMPARISON OF THE ROLL MOTION RAOS(β = 90◦) FOR DIFFERENT FILLING LEVELS OF WATER ANDLNG
lower frequencies compared to water while the low-frequencypeaks (rigid body resonances) are depending on the hull and bal-last mass distribution. The sloshing induced high-frequency rollpeaks appear close to the transversal sloshing resonance modes,but the distance ∆ω between the natural sloshing frequency andthe actual peak in the roll RAO increases with increasing fluidmass — i.e. filling height and higher fluid densities.
For β = 120◦, surge, sway, heave, roll, pitch and yaw RAOsare shown inside the green box (centre) and inside the bluebox (bottom) surge, heave and pitch RAOs are presented forβ = 180◦. Again, it becomes apparent that free liquid surfacesdo not influence heave and pitch motions, but surge and roll inparticular. The surge peak also shifts to higher frequencies forincreasing filling ratios, since it is caused by the resonant longi-tudinal sloshing.
CONCLUSIONSFree liquid surfaces in internal cargo tanks significantly in-
fluence vessel motion characteristics. Especially roll (β = 90◦
and 120◦) and surge (β = 180◦ and 120◦) feature new maximumvalues (two roll peaks, one surge peak) which are changing in fre-quency and magnitude in dependency of the filling height. Heaveand pitch motions on the other hand are not significantly chang-ing.
By conducting model tests with different filling ratios ofwater (10 %, 20 % and 30 %), the numerical approach is suc-cessfully validated. Detailed analyses of the experimental andnumerical results (including force and moment measurements)reveal interesting interactions. It is observed that the naturalsloshing frequencies of the tanks strongly influence the force andmoment RAOs, measured between tanks and carrier hull, whichfeature peaks caused by resonant tank sloshing as well as reso-nant body motions. In the longitudinal direction surge shows aprominent peak close to the first longitudinal natural sloshing fre-quency, and in transverse direction roll and sway RAOs featurepeaks close to the first transverse natural sloshing frequency.
Calculations with LNG show the same tendencies as for wa-ter, but with different peak characteristic, caused by the lowerdensity of the liquefied gas.
PERSPECTIVESBased on these results, potential for further research work
arises. In the previous investigations, only equally filled tanksare investigated. In case of different filling heights inside theinterior tanks, the motion behavior of the carrier will be evenmore complicated. Also, the influence of different tank typesas spherical tanks and bilobe tanks on the motion characteristicswill be considered numerically.
Due to the minimum bending radius of the transfer pipes,the relative x- and z-motions between terminal and carrier ves-
7 Copyright c© 2010 by ASME

sel of the MPLS20 system are restricted to xrel = ± 2 m andzrel = ± 5 m. On this basis, the operational range of the multi-body system in tandem configuration will be determined numer-ically in dependency of the filling height. Fig. 10 shows the tol-erable sea states (JONSWAP spectra, 0.1 s ≤ T0 ≤ 15 s) relatedto the given relative motion limitations of the transfer pipe con-necting points for an exemplary LNG filling height of 20 % andwave incident angles (β = 90◦, β = 120◦ and β = 180◦). It can be
0 5 10 150
2
4
6
8
10
12
Hs,t
ol,re
lz[m
]
0 5 10 150
2
4
6
8
10
12
unfeasible
feasible feasible
unfeasible
relative z-motion relative x-motion
Hs,t
ol,re
lx[m
]
T [s]0
solidfilling
20%LNG
β = 180°
β = 120°
β = 90°
T [s]0
FIGURE 10. TOLERABLE SEA STATES FOR DIFFERENT LNGFILLING HEIGHTS AND WAVE INCIDENT ANGLES RELATEDTO THE LIMITS OF THE RELATIVE Z- (LEFT) AND X-MOTIONS(RIGHT) OF THE TRANSFER PIPE CONNECTION POINTS
observed that the operational range due to the relative z-motionrestriction is not influenced by sloshing motions with 20 % LNGfilling height in the tanks (except for β = 120◦, where slightdeviations occur), while the relative x-motion limitation showssignificant influences leading to a decreased operational rangefor 20 % LNG filling height and all wave incident angles. On ba-sis of this data, stochastic downtime analyses will be conductedfor locations in the North Sea region.
ACKNOWLEDGMENTThe authors wish to express their gratitude to the German
Federal Ministry of Economics and Technology (BMWi) andProject Management Julich (PTJ) for funding the joint researchproject ’MPLS20 — Maritime Pipe Loading System 20”’ (FKZ03SX240D), in particular to Dipl.-Ing. Barbara Grothkopp andDipl.-Betriebswirtin Cornelia Bude for their excellent support.Furthermore, we want to thank our project partners ’IMPaC En-gineering’,’Brugg Pipe Systems’ and ’Nexans’ for their support.Many thanks also to our colleague at Technical University Berlin,Dipl.-Ing. Matthias Dudek for his contribution to this paper andto cand. ing. Basil Bodemann for his support during the modeltests.
REFERENCES[1] The Royal Institute of Naval Architects, 2006. “Gas ships:
Trends and Technology”.[2] Cook, J. W., 2006. “Gulf Gateway Energy Bridge - The
First Year of Operations and the Commercial and Opera-tional Advantages of the Energy Bridge Technology”. InProceedings of the Offshore Technology Conference. OTC18396.
[3] Frohne, C., Harten, F., Schippl, K., Steen, K. E., Haakon-sen, R., Eide, J., and Høvik, J., 2008. “Innovative PipeSystem for Offshore LNG Transfer”. In Proceedings of theOffshore Technology Conference. OTC 19239.
[4] Clauss, G., Sprenger, F., Testa, D., Hoog, S., and Huhn, R.,2009. “Motion Behaviour of a New Offshore LNG TransferSystem at Harsh Operational Conditions”. In Proceedingsof the 28 th Conference on Offshore Mechanics and ArcticEngineering.
[5] Hoog, S., Koch, H., Huhn, R., Frohne, C., Homann, J.,Clauss, G., Sprenger, F., and Testa, D., 2009. “LNG Trans-fer in Harsh Environments — Introduction of a New Con-cept”. In Proceeding of the Offshore Technology Confer-ence. OTC 19866.
[6] Newman, J. N., 2005. “Wave effects on vessels whith inter-nal tanks”. In Proceedings of the 20 th International Work-shop on Water Waves and Floating Bodies. Longyearbyen,Svalbard.
[7] Gaillarde, G., Ledoux, A., and Lynch, M., 2004. “CouplingBetween Liquefied Gas and Vessel’s Motion for PartiallyFilled Tanks: Effect on Seakeeping”. In Proceedings ofDesign & Operation of Gas Carriers.
[8] Molin, B., Remy, F., Rigaud, S., and de Jouette, C., 2002.“LNG-FPSO’s: frequency domain, coupled analysis ofsupport and liquid cargo motions”. In Proccedings of the10 th Congress of the International Maritime Association ofthe Mediterranean.
[9] Molin, B., Remy, F., Ledoux, A., and Ruiz, N., 2008. “Ef-fect of Roof Impacts on Coupling Between Wave Responseand Sloshing in Tanks of LNG-Carriers”. In Proceedings ofthe 27 th International Conference on Offshore Mechanicsand Arctic Engineering.
[10] Lee, S., Kim, M., Lee, D., and Shin, Y., 2007. “The Ef-fects of Tank Sloshing on LNG Vessel Repsonses”. In Pro-ceedings of the 26 th International Conference on OffshoreMechanics and Arctic Engineering.
[11] Clauss, G. F., and Kuhnlein, W. L., 1997. “A new tool forseakeeping tests – nonlinear transient wave packets”. InProceedings of the 8 th Int. Conference on the Behaviour ofOffshore Structures (BOSS), pp. 269–285.
[12] Massachusetts Institute of Technology, 2006. WAMIT Ver-sion 6.4. Userguide.
[13] Faltinsen, O., and Timokha, A., 2009. Sloshing. 1 st edition.Cambridge University Press.
8 Copyright c© 2010 by ASME


![Sloshing motion in excited tanks - context/Earthcontextearth.com/wp-content/uploads/2016/07/JCP04.pdf · Sloshing motion in excited tanks ... [35] modelled inviscid sloshing motion](https://static.fdocuments.us/doc/165x107/5a78985e7f8b9aa2448e4299/sloshing-motion-in-excited-tanks-context-motion-in-excited-tanks-35-modelled.jpg)