COMMUNITY’S ADAPTIVE CAPACITY DUE TO COASTAL FLOODING IN SEMARANG COASTAL CITY, INDONESIA

The Climate Council is an independent, crowd-funded organisation
providing quality information on climate change to the Australian public.
ClimATeCounCil.org.Au
COUNTING THE COSTS: CLIMATE CHANGE AND COASTAL FLOODING

Authorship: Will Steffen, John Hunter and lesley Hughes
Published by the Climate Council of Australia limited
iSBn: 978-0-9941623-0-4 (print) 978-0-9941623-1-1(web)
© Climate Council of Australia ltd 2014
This work is copyright the Climate Council of Australia ltd. All material contained in this work is copyright the Climate Council of Australia ltd except where a third party source is indicated.
Climate Council of Australia ltd copyright material is licensed under the Creative Commons Attribution 3.0 Australia license. To view a copy of this license visit http://creativecommons.org.au
You are free to copy, communicate and adapt the Climate Council of Australia ltd copyright material so long as you attribute the Climate Council of Australia ltd and the authors in the following manner:
Counting the Costs: Climate Change and Coastal Flooding by Will Steffen, John Hunter and lesley Hughes (Climate Council of Australia).
Permission to use third party copyright content in this publication can be sought from the relevant third party copyright owner/s.
This report is printed on 100% recycled paper.
Page iClimateCounCil.org.au
Prefacethis is the 14th publication of the Climate
Council. the Climate Council is an
independent, non-profit organisation,
funded by donations from the public.
our mission is to provide authoritative,
expert information to the australian
public on climate change.
many australians live on or near the
coast. the major population centres
—Sydney, melbourne, Brisbane, Perth,
adelaide, Hobart and Darwin—are all
port cities and much of the nation’s
critical infrastructure—transport,
commercial, residential, defence—is
located along our coastlines. Virtually
all of this infrastructure has been
designed and built for a stable climate
with known ranges of variability. But
the climate system is no longer stable.
Sea level is rising and so are the risks
for our coastal infrastructure.
this report explores two of the most
serious consequences of rising
sea level—the large increase in the
frequency of coastal inundation and
the recession of ‘soft’ shorelines.
Damage caused by increased coastal
inundation and recession poses a
massive financial burden due to damage
and destruction of infrastructure.
Coastal inundation and recession also
have important implications for health
and well-being, coastal ecosystems and
communities. the report describes how
scientific understanding of sea-level
rise has improved significantly over
the last decade, and we also explore the
challenge of making better decisions
about future coastal development.
Finally, the report discusses the urgent
need to stabilise the climate to reduce
the level of risks from coastal flooding
in the future.
We are extremely grateful to our team
of reviewers whose comments and
suggestions improved the report.
the reviewers were: Jon Barnett
(university of melbourne), melanie
Bishop (macquarie university), Bruce
thom (university of Sydney) and
Stefan trueck (macquarie university).
We thank CSiro for reviewing the
accuracy and relevance of the science
underpinning the report. their review is
not an endorsement of the conclusions
drawn. We are also grateful to our expert
contributors—Frank Jotzo (australian
national university) and Jan mcDonald
(university of tasmania)—for their
case studies (boxes) in this report.
We thank the Climate Council staff
for their many contributions to the
production of this report.
the authors retain sole responsibility
for the content of the report.
Professor Will Steffen Climate Councillor
Dr John Hunter
Professor Lesley Hughes Climate Councillor

Page ii
COUNTING THE COSTS: CLIMATE CHANGE AND COASTAL FLOODING
ClimateCounCil.org.au
Introduction australia is largely a coastal country.
much of our population lives on or near
the coast, and our six state capital cities
—Sydney, melbourne, Brisbane, Perth,
adelaide and Hobart, as well as Darwin
in the northern territory—are all
port cities. in addition to the many
lifestyle amenities from living on the
coast, much of the nation’s critical
infrastructure—transport, commercial,
residential, defence—is located along
our coastlines. Virtually all of this
infrastructure has been designed and
built for a stable climate with known
ranges of variability. But the climate
system is no longer stable. Sea levels
are rising and so are the risks they
pose for our coastal infrastructure.
the most immediate and serious
consequence of rising sea level is
the flooding of coastal areas through
both inundation and recession (see
Section 1). Coastal flooding creates
many risks, including impacts on health
and well-being, damage to coastal
ecosystems and disruption of people’s
lives. in addition to these, the risks to
coastal infrastructure – the major focus
of this report - are potentially huge,
particularly the economic losses due to
damage and destruction and the flow-on
effects to the economy more generally.
Scientific understanding of sea-level rise
has improved significantly over the last
decade. We now have more reliable and
accurate information on the observed
rates of sea-level rise, as well as a better
understanding of regional variations
around the australian coast. We can
assess the relative importance of various
factors, such as the warming of ocean
water and the loss of ice from the polar
ice sheets, in driving sea-level rise.
our knowledge of the behaviour of the
large polar ice sheets, such as those in
greenland and West antarctica, has also
improved, allowing better assessments
of the risks from rapid and/or irreversible
loss of ice from these regions.
infrastructure that we are designing
and building now should take climate
change into account, but this is often
not the case. in addition to a solid
scientific knowledge base, perceptions,
values, institutions, rules and other
social factors are crucially important
in developing appropriate responses to
climate-related risks. an acceptance of
the reality of climate change and its risks
is essential, but much more is needed.
the challenge is to build effective
approaches for dealing with the risks
to existing infrastructure as well as
making better decisions about future
infrastructure development.
ultimately, stabilising the climate is
necessary to reduce the level of risks
from coastal flooding. rapid and deep
cuts in greenhouse gas emissions are
critical here in australia and around
the world to stabilise the climate.
Page iiiClimateCounCil.org.au
Preface i
Introduction ii
Key findings iv
1. Sea-level rise, coastal flooding and coastal infrastructure .........................1
2. The science of sea-level rise .........................................................................................................72.1 observations of sea-level rise 8
2.2 Projections of future sea-level rise 12
2.3 increased probability of coastal flooding 16
2.4 other contributing factors to risks of sea-level rise 20
3. Counting the costs ................................................................................................................................213.1 infrastructure exposed to coastal flooding 23
3.2 observed economic costs of coastal flooding 25
3.3 Projected costs of coastal flooding in future 28
3.4 other impacts of coastal flooding 34
4. How can we deal with the risks? ............................................................................................444.1 the nature of the challenge 45
4.2 Do nothing: the head-in-the-sand approach 48
4.3 Stabilise the climate system: reducing greenhouse gas emissions 51
4.4 Be prepared: adapting to the sea-level rise we can’t avoid 53
5. The bottom line .........................................................................................................................................58
References 60
Contents
Page iv
COUNTING THE COSTS: CLIMATE CHANGE AND COASTAL FLOODING
ClimateCounCil.org.au
1. Sea level has already risen and continues to rise due to climate change. Climate change exacerbates coastal flooding from a storm surge as the storm rides on higher sea levels.
› Climate change drives up sea level by warming the oceans and increasing the flow of ice from the land into the sea, for instance from melting glaciers.
› over half the australian coastline is vulnerable to recession from rising sea level, with 80% of the Victorian coast and 62% of the Queensland coast at risk.
› at both Fremantle and Sydney, flooding events became three times more frequent during the 20th century as a result of sea-level rise.
› With just 10 cm of sea level rise the risks of coastal flooding roughly treble.
2. Australia is highly vulnerable to increasing coastal flooding because our cities, towns and critical infrastructure are mainly located on the coast. Australia’s infrastructure has been built for the climate of the 20th century and is unprepared for rising sea level.
› Sea level is likely to increase by 0.4 to 1.0 m through the 21st century. Strong action to reduce greenhouse gas emissions would constrain sea-level rise towards the lower end of that range, while
a business-as-usual approach to burning fossil fuels would drive it towards the upper end.
› a sea-level rise of only 0.5 m
would, on average, mean that
a 1-in-a-100 year flood—a very
rare event today—would occur
every few months. it could also
involve a potential retreat of sandy
shorelines by 25 to 50 m.
› Sydney is particularly vulnerable.
it is likely that today’s 1-in-100 year
flood would occur every day or so
by 2100.
3. Coastal flooding is a sleeping giant. If the threat of sea level rise is ignored, the projected increases in economic damage caused by coastal flooding are massive.
› more than $226 billion in
commercial, industrial, road and
rail, and residential assets around
australian coasts are potentially
exposed to flooding and erosion
hazards at a sea level rise of 1.1 m,
a high end, but quite plausible,
scenario for 2100.
› in Southeast Queensland—without
adaptation—a current 1-in-100
year coastal flooding event risks
damage to residential buildings
of around $1.1 billion. With a
0.2 m rise in sea level, a similar
flooding event would increase the
damages to around $2 billion, and
a 0.5 m rise in sea level would raise
projected damages to $3.9 billion.
Key findings
Page vClimateCounCil.org.au
› By 2050—without adaptation—the
losses from coastal flooding globally
are projected to rise to $uS1 trillion
per year, about the size of the
entire australian economy. By 2100
the losses from coastal flooding
are projected to be 0.3–9.3% of
global gDP per year. the high-end
projection is a scenario for global
economic collapse.
4. Rising sea levels pose risks for many of Australia’s species and iconic natural places, such as Kakadu National Park and the Great Barrier Reef.
› many ecosystems, like mangroves,
saltmarshes and seagrass beds,
may become trapped in a ‘coastal
squeeze’ between rising sea levels
and fixed landward barriers such as
seawalls and urban development.
Damaging these ecosystems
has negative flow-on effects to
water quality, carbon storage
and fisheries.
› Sea-level rise is increasing the
salinity of coastal groundwater
and pushing salty water further
upstream in estuaries, affecting
salt-sensitive plants and animals.
Salt-water intrusion from rising
sea levels is contributing to the
loss of freshwater habitats in
coastal regions such as Kakadu
national Park.
› Some corals may not be able
to keep up with periods of
rapid sea-level rise, leading to
“drowning” of reefs.
› australia’s multi-billion dollar
tourism industry relies on
australia’s beautiful sandy beaches,
from the gold Coast to Fremantle
to Wine glass Bay. Sandy beaches
are at risk from coastal erosion.
5. Rising sea level is eroding the viability of coastal communities on islands in the Torres Strait and the Pacific, and in low-lying areas of Asia, increasing the likelihood of migration and resettlement.
› Several torres Strait island
communities are situated on
extremely low-lying areas and
already experience flooding during
high tides. Building seawalls and
raising houses can buy time, but in
the long-term, some communities
may face relocation.
› a sea-level rise of 0.5 to 2 m
could displace 1.2 and 2.2 million
people from the Caribbean
region and the indian and Pacific
ocean islands, assuming that
no adaptation occurs.
› globally, considerable displacement
of people from the impacts
of climate change, including
increasing coastal flooding and
erosion, is likely in coming decades.
Projections range from tens of
millions to 250 million people.
Page vi
COUNTING THE COSTS: CLIMATE CHANGE AND COASTAL FLOODING
ClimateCounCil.org.au
6. We need deep and urgent cuts in greenhouse gas emissions this decade and beyond if we are to avoid the most serious risks from rising sea levels and coastal flooding.
› Stabilising the climate system
through deep and rapid reductions
in greenhouse gas emissions today
is the only way to significantly
reduce the level of risk that we face
from coastal flooding in the second
half of the century and beyond.
› to prepare for the sea-level
rise that we can’t prevent is
also essential to lower the
risks of coastal flooding. this
requires a coordinated national
planning framework integrated
across federal, state and local
governments with clear allocation
of responsibilities.
1.
1. Sea-level rISe, CoaStal floodIng and CoaStal InfraStruCture
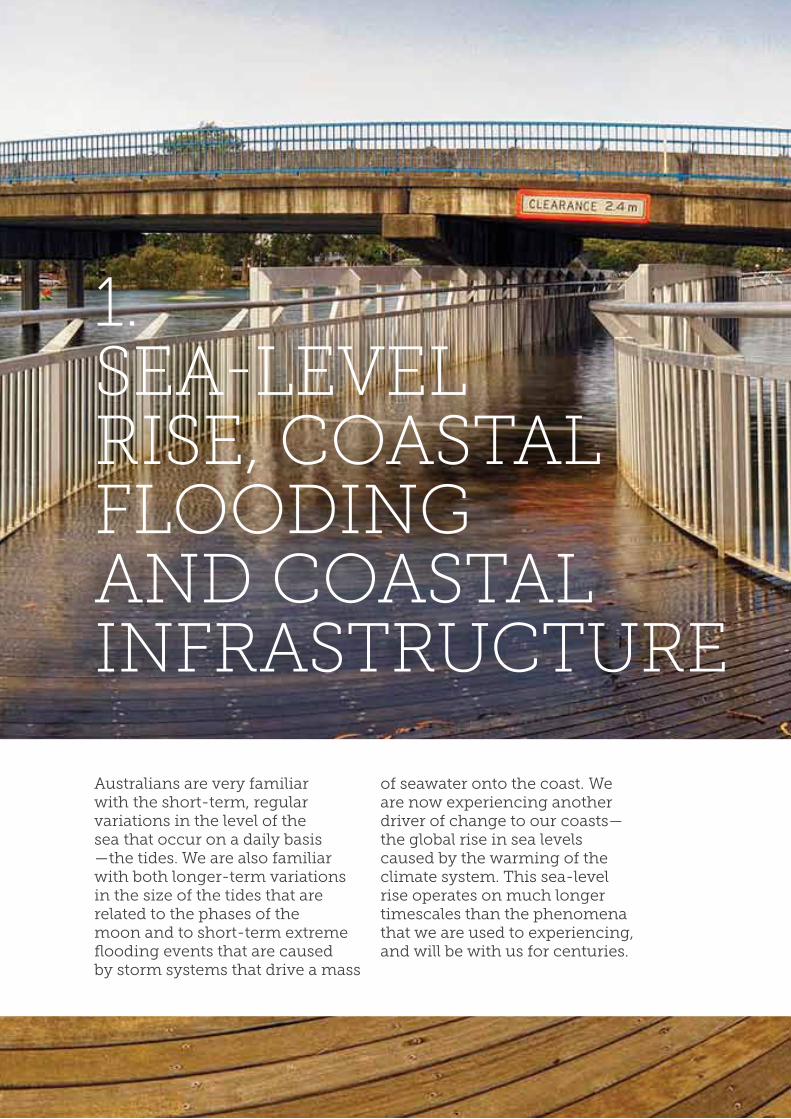
australians are very familiar with the short-term, regular variations in the level of the sea that occur on a daily basis —the tides. We are also familiar with both longer-term variations in the size of the tides that are related to the phases of the moon and to short-term extreme flooding events that are caused by storm systems that drive a mass
of seawater onto the coast. We are now experiencing another driver of change to our coasts—the global rise in sea levels caused by the warming of the climate system. this sea-level rise operates on much longer timescales than the phenomena that we are used to experiencing, and will be with us for centuries.

Page 2
COUNTING THE COSTS: CLIMATE CHANGE AND COASTAL FLOODING
ClimateCounCil.org.au
Sea-level rise affects the coast in two
distinct ways: by inundation, and by
coastal recession. inundation is the
process by which the rise in sea level
floods the land, without causing any
change of the actual land surface.
on the other hand, coastal recession
is the process by which “soft” (e.g.
sandy or muddy) shorelines tend to
be eroded landwards under a rising
sea level (table 1). the latter process
is complicated by the fact that coastal
recession (or the opposite effect,
progradation, where the shoreline
migrates seawards) is affected by
several other processes such as
waves, water currents and sediment
supply and so is not determined solely
by changes in sea level.
over half the australian coastline is vulnerable to erosion from rising sea level.
Figure 1: an example of coastal recession at Broadbeach Queensland

Page 3ClimateCounCil.org.au
01Sea-level riSe, coaStal flooding and coaStal infraStructure
this report focuses primarily on
infrastructure, which is defined as the
basic physical structures and facilities
needed for the operation of a society.
australia’s infrastructure is mostly
concentrated in the coastal zone around
centres of population (DCC 2009; Chen
and mcaneney 2006). in this report,
infrastructure includes buildings
(private, commercial, industrial and
public buildings), community services
(e.g. police, fire and ambulance stations,
hospitals and schools), transport (e.g.
roads, railways, ports and airports) and
essential services (e.g. facilities for water,
waste treatment and energy supply).
Defence facilities (e.g. naval bases)
are also built assets under threat from
climate change and coastal flooding.
in addition to infrastructure, other
features of coastal regions are vulnerable
to coastal inundation and recession. the
impact of shoreline recession on the
land values along the coast is a prime
example. Shorelines composed of sand,
mud and soft rock may recede under
changing environmental conditions
such as sea-level rise. However, sandy
shorelines are the only ones that have
the potential to restore themselves after
an erosion event—for example, after a
large storm.
the average recession of sandy
shorelines under sea-level rise can be
roughly estimated through the Bruun
rule (Zhang et al. 2004), which states
that, on average for every metre of sea-
level rise, sandy shorelines recede by
50–100 metres. the Bruun rule operates
on the assumptions that without sea-
level rise, the beach would be in steady
state and that other physical conditions
(e.g., waves or currents) are unchanged.
no simple rule exists for the movement
of shorelines of mud or soft rock,
although sea-level rise still tends to make
such shorelines recede. table 1 above
shows the total lengths of vulnerable
coastline susceptible to recession under
adverse conditions such as sea-level rise;
these are defined as all those composed
of sand and mud, which are backed by
soft sediment (so that recession is largely
unconstrained), and all those composed
of soft rock. more than half of australia’s
coastline, about 31,000 km, is potentially
vulnerable to recession.
Table 1: Fraction of coastline susceptible to recession under sea-level rise, defined as shore composed of sand and mud, backed by soft sediment (so that recession is largely unconstrained), and shore composed of soft rock. Based on DCC (2009).
State total length of open coast, km
total length of vulnerable coast, km
Proportion of vulnerable coast (%)
Vic 2395 1915 80
nSW 2109 839 40
Qld 12,276 7551 62
nt 11,147 6990 63
Wa 20,513 8237 40
Sa 5876 3046 52
tas 4995 2336 47
aus 59,311 30,914 52
Page 4
COUNTING THE COSTS: CLIMATE CHANGE AND COASTAL FLOODING
ClimateCounCil.org.au
it is not only human infrastructure
that is at risk from rising sea levels and
coastal flooding. large stretches of
australia’s coasts that are vulnerable to
sea-level rise include coastal wetlands,
saltmarshes, mudflats, mangroves,
seagrass beds, rocky shores and sandy
beaches. these provide important
habitats for many species, including
commercially and recreationally
important fish and shellfish. these
ecosystems provide many additional
services, including protection from
erosion and storms, filtration of water
and stabilisation of sediments (Spalding
et al. 2014). the sediments within these
habitats also play a very important role
in carbon sequestration (“blue carbon”),
contributing about half of the total
carbon burial in the oceans (Duarte
et al. 2005).
many of these habitats are already in
serious decline due to human impacts,
and climate change is posing multiple
new threats. as sea levels rise, low-lying
habitats will become increasingly
inundated. in some cases, species
and habitats will be able to adjust by
moving landwards but this will not be
possible if the terrain is very steep, or
if human development is a barrier—
the “coastal squeeze”.
tourism, one of australia’s most
important income earners, is also
vulnerable. our spectacular coastline
and natural marine habitats are
central attractions for domestic and
international visitors. rising sea levels
and increased coastal flooding pose
great risks to the maintenance of our
beaches and the attractiveness and
access of many of our prime natural
tourist attractions.
one of the most common
misconceptions about sea-level rise is
that its rate – currently about 3 mm per
year—is so slow that it is not important
in terms of impacts. By contrast, the
impacts of extreme weather events,
such as heatwaves, extreme rainfall,
bushfires, are immediate and often very
serious. Similarly, sea-level rise is often
experienced via extreme inundation
or recession events.
the immediate trigger of a high sea-level
event is often a combination of a high
tide and storm surge (a “storm tide” is
the sum of a storm surge and tide). the
latter is a short-term rise in sea level
driven by strong winds and/or reduced
atmospheric pressure. around northern
australia, storm surges are often driven
by tropical cyclones while intense low
pressure systems can also lead to storm
surges along our non-tropical coasts.
For example, Cyclone Yasi caused a
large storm surge that contributed to
extensive coastal flooding in north
Queensland. Storm surges can extend
for hundreds of kilometres along a coast
and the area of flooding can extend
several kilometres inland in particularly
low-lying areas. other factors, such as
human modification of the coastline,
also influence the severity of the impacts
of a storm surge.
as illustrated in Figure 2, the most
direct link between coastal flooding and
climate change is based on the fact that
storm surges are now occurring on base
sea levels that have already risen and are
continuing to rise. Storm surges are thus
becoming more damaging as they are
able to penetrate further inland.
When the weather system that drives the
storm surge—a tropical cyclone, large

Page 5ClimateCounCil.org.au
01Sea-level riSe, coaStal flooding and coaStal infraStructure
storm or intense low pressure system—
also brings heavy rainfall to the coastal
area, a “double whammy” flooding event
may occur as water comes from both
the ocean (as described above) and from
the land. these events may become
more common in future as the sea level
rises and the probability of heavy rainfall
events increases (iPCC 2013).
in this report we take a risk-based
approach to assessing the link between
climate change and coastal flooding
and adopt the simple relationship
shown in Figure 3 (an interpretation
of the iSo standard definition) to assess
changes in risk.
risk is defined as the combination of the
likelihood that (or frequency with which)
an extreme flooding event will occur
and the consequences that result. Both
contributing factors are important. For
example, an increase in the frequency
of flooding events will obviously
increase the risk of damage, but as
more infrastructure is built in vulnerable
locations and its value increases, the
consequences of a flooding event of
the same magnitude that occurred
previously will become more costly,
thus also raising the risk.
the next section of this report examines
the changes that are occurring in the
physical part of the equation—the
observed rate of sea-level rise globally,
the regional variations in sea-level rise
around australia, the factors that are
driving the observed rise in sea level, and
the projected further rises in sea level to
Figure 2: Climate change exacerbates the effects of a storm surge increasing the base sea level (Climate Commission 2013a).

Page 6
COUNTING THE COSTS: CLIMATE CHANGE AND COASTAL FLOODING
ClimateCounCil.org.au
the end of the century. importantly, this
section also examines the changes in
the frequency with which high sea-level
events are likely to occur as the base sea
level rises.
Section 3 explores the other side of the
risk equation—the consequences of
high sea-level events when they occur.
this section focuses strongly on the
economic costs associated with flooding
and erosion, especially in urban areas.
We also consider the coastline itself
(“soft” coasts) and the loss of property,
as well as the consequences of coastal
flooding and erosion for tourism and
natural ecosystems.
Section 4 puts the two components
of the risk equation together and
examines the approaches we can take
to deal with the changing risk profile.
Because sea level is already rising as
a result of climate change and will
continue to rise through this century
and beyond, denying climate change
and ignoring its consequences, or
understanding the risks but failing to
act, are not wise options. adaptation
is essential to minimise the risk of
high sea-level events, where the iPCC
defines “adaptation” as “…the process of
adjustment to actual or expected climate
and its effects, in order to moderate
harm or exploit beneficial opportunities”
(iPCC 2012). Stabilising the climate
system through deep and rapid emission
reductions is also essential, as it will
influence the rate at which sea level
rises this century and the ultimate level
at which it is stabilised.
Figure 3: a diagram based on an interpretation of the iSo standard definition of risk used in australia and new Zealand (aS/nZS iSo 31000:2009).
Likelihood (frequency, probability)
Risk
Consequence (impacts, damages)
2. the SCIenCe of Sea-level rISe
there is strong evidence that the primary cause of the sea-level rise observed during the past half-century was the warming of the atmosphere and oceans due to an increase in the concentration of greenhouse gases in the atmosphere (iPCC 2013). Sea level is certain to rise further through the rest of this century and beyond, leading to large increases in frequency of coastal flooding.
the effect of changes in sea level that we experience at the
coast is actually the result of two processes. they are the vertical motion (rise or fall) of the sea surface itself and the vertical motion (rise or subsidence) of the land surface adjacent to the sea. this is called relative sea-level change and is the change that is measured by a tide gauge. on the other hand, a satellite measures the motion of the sea surface relative to the centre of the earth (called a geocentric measurement).

Page 8
COUNTING THE COSTS: CLIMATE CHANGE AND COASTAL FLOODING
ClimateCounCil.org.au
relative sea-level change is the more
important measurement in terms of
assessing impacts on infrastructure,
property and ecosystems. in many
parts of the world today, especially
around some large cities located on
deltas, impacts are increased by local
subsidence of the land, which causes
relative sea-level rise to be greater
than geocentric sea-level rise.
2.1 Observations of sea-level rise
Sea level is most commonly observed
by instruments, such as tide-gauges
located on the coastline (generally in
ports), or satellites that measure the
height of the sea surface over most
of the world’s ocean, using a form
of radar. in addition, methods called
proxy techniques are sometimes used,
primarily in cases where instrumental
records are not available. Coring in salt
marshes is a popular proxy technique
for the estimation of sea-levels over the
past few centuries.
long-term tide-gauge measurements
started around 1700 in amsterdam (Pugh
and Woodworth 2014) and around the
middle of the 19th century in australia
(Hunter et al. 2003; matthäus 1972). the
longest near-continuous australian
records are from Fremantle (from 1897)
and Fort Denison (Sydney; from 1886)
(noC 2014). there are now around 300
australian locations where tide gauges
have been, or are being, operated. the
primary purpose of these gauges has
been to aid port and survey operations,
rather than for scientific studies of
sea level. From 1990 to the present,
however, the australian Baseline Sea
level monitoring Project (Bom 2014d)
has provided scientific-quality sea level
data at 15 locations around australia
(see Figure 5 for locations).
global-average sea level has risen by 17 cm over the 20th century.the most widely used continuous
satellite observations of sea level started
in 1992 and provide coverage of the
world’s oceans, except near the poles,
approximately every 10 days. the broad
spatial coverage of satellite observations
has been combined with the long
duration of tide-gauge measurements
to provide long-term regional records
of sea-level change commonly called
sea-level reconstructions. examples of
the global-average sea level derived from
these reconstructions are shown in Figure
4 (rhein et al. 2013), which indicates an
average rise of about 17 cm (1.7 mm/
yr) over the 20th century. over the past
two decades, satellite observations
indicate a global-average rate of about
3.2 mm/yr (Pugh and Woodworth 2014).
it is not clear at present whether this
apparent increase represents a long-term
acceleration or simply a manifestation of
natural variability. However, using model
results, Church et al. (2013a) concluded
that ‘the increased rate of rise since 1990
is not part of a natural cycle but a direct
response to increased radiative forcing
(both anthropogenic and natural), which
will continue to grow with ongoing
greenhouse gas emissions’.
long-term tide-gauge records and cores from salt marshes indicate that

Page 9ClimateCounCil.org.au
02The science of sea-level rise
a significant acceleration in sea-level rise occurred towards the end of the nineteenth century (Church et al. 2013b).
Figure 5 shows the observed rate of
relative sea-level rise around australia
from 1990–1993 (the period of installation
of the aBSlmP tide gauges) to June 2014
(Bom 2014d). the average rate is 5.6 ± 2.3
(sd) mm/yr; the lowest rate is 3.5 mm/yr
at Stony Point (Vic) and the largest is 10.0
mm/yr at Hillarys (Wa). these rates are
all higher than the global-average rate
since 1992 of about 3.2 mm/yr measured
by satellite, although southeastern
australia is closest to the global average.
there are a number of reasons for the
differences between the global rate and
those measured around australia. Firstly,
regional variations in sea level cover a
range of scales in time and space. over
long time scales, if one region of the
oceans warms faster than elsewhere,
the rate of rise will tend to be larger in
that region. Such changes in ocean
temperature are inextricably linked with
long-term changes in wind, pressure
and/or ocean currents. at shorter time
scales, ocean-wide phenomena such as
the el niño-Southern oscillation (enSo)
cause sea level at many (especially
western and northwestern) locations
around australia to fall during an el
niño event (Church et al. 2006). Douglas
(2001) showed that individual tide-
gauge records need to be at least 50–80
years long to average out such temporal
variability and yield robust estimates of
long-term local sea-level change (the
records used to derive the trends shown
in Figure 5 are only about 20 years long).
Secondly, the rates of rise shown in
Figure 5 are relative rates and so may be
significantly affected by land movement.
the high rate of sea-level rise observed
at Hillarys is related to subsidence of the
surrounding land, believed to be due to
groundwater extraction for the city of
Perth (Burgette et al. 2013).
average sea-level rise around australia has been close to the global average.if adjustments are made to australian
tide-gauge observations to account for
enSo, glacial isostatic adjustment (gia;
the effect on relative sea level of changes
in the earth’s loading and gravitational
field caused by past changes in land ice)
and atmospheric pressure, the mean
sea-level rise over the periods 1966–2009
and 1993–2009 was 2.1 and 3.1 mm/yr,
respectively, which compares well with
the global-average sea-level rise over the
same periods of 2.0 mm/yr (from tide
gauges) and 3.4 mm/yr (from satellites)
(White et al. 2014). over these periods,
the mean sea-level rise around australia
was therefore close to the global-average.
the above analysis shows that
unadjusted observations of present
regional sea-level rise around australia
should be treated with caution when
considering the likely future sea-level
rise. the most useful estimates of
future sea-level rise (i.e. the rise
several decades or more hence) come
from climate projections provided
by computer models (see Section 2.3)
rather than from simple extrapolation
of recent observations.

Page 10
COUNTING THE COSTS: CLIMATE CHANGE AND COASTAL FLOODING
ClimateCounCil.org.au
Figure 4: Yearly average global mean sea level reconstructed from tide gauges (1880–2010) by three different approaches (Jevrejeva et al., 2008; Church and White, 2011; ray and Douglas, 2011). all uncertainty bars are one standard error as reported by the authors. adapted from iPCC ar5 Wgi, Chapter 3, Figure 3.13(a) (rhein et al. 2013).
Figure 5: observed rate of relative sea-level rise at 15 sites around australia for the period 1990–1993 to June 2014 in mm/yr (Bom 2014d).
AUSTRALIA
TASMANIA
CAPE FERGUSON
ROSSLYN BAY
PORT KEMBLA
LORNE
PORTLAND
PORT STANVAC
THEVENARD
ESPERANCE
STONY POINT
GROOTE EYLANDT
DARWIN
BROOME
HILLARYS
BURNIE
SPRING BAY
10.0
8.0
6.0
4.0
-10
0
10
20
30
40
50
60
70
1992 1994 1996 1998 2000 2002 2004 2006 2008 2010 2012Year
Tide gaugeAltimeter
-20
0
20
40
60
80
100
1970 1975 1980 1985 1990 1995 2000 2005 2010Year
Sea levelThermosteric component
-10
-5
0
5
10
15
2005 2006 2007 2008 2009 2010 2011 2012Year
Mass (GRACE) + Steric (ARGO) Sea level (Altimeter)
(a) (b)
(d)(c)
GM
SL
anom
aly
(mm
)G
MS
L an
omal
y (m
m)
GM
SL
anom
aly
(mm
)
-100
-50
0
50
100
150
200
1880 1900 1920 1940 1960 1980 2000
Church & White, 2011Jevrejeva et al., 2008Ray & Douglas, 2011
GM
SL
anom
aly
(mm
)
Year
Page 11ClimateCounCil.org.au
02The science of sea-level rise
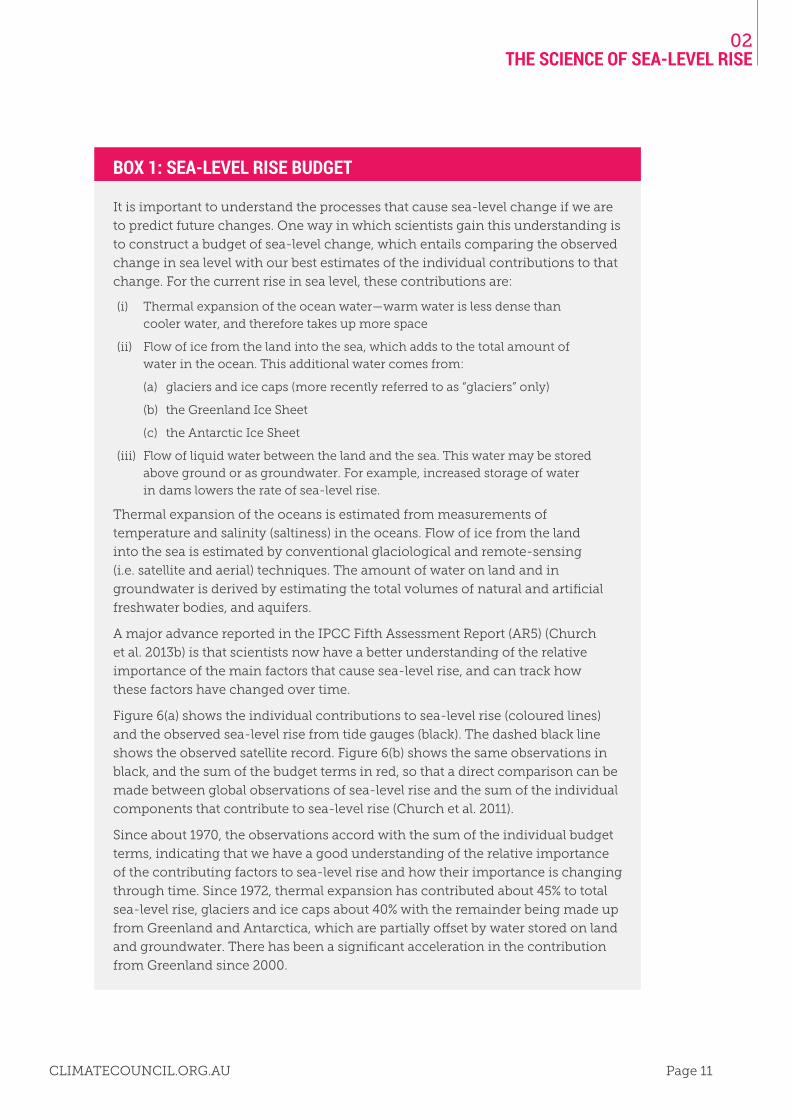
Box 1: Sea-level riSe Budget
it is important to understand the processes that cause sea-level change if we are
to predict future changes. one way in which scientists gain this understanding is
to construct a budget of sea-level change, which entails comparing the observed
change in sea level with our best estimates of the individual contributions to that
change. For the current rise in sea level, these contributions are:
(i) thermal expansion of the ocean water—warm water is less dense than cooler water, and therefore takes up more space
(ii) Flow of ice from the land into the sea, which adds to the total amount of water in the ocean. this additional water comes from:
(a) glaciers and ice caps (more recently referred to as “glaciers” only)
(b) the greenland ice Sheet
(c) the antarctic ice Sheet
(iii) Flow of liquid water between the land and the sea. this water may be stored above ground or as groundwater. For example, increased storage of water in dams lowers the rate of sea-level rise.
thermal expansion of the oceans is estimated from measurements of
temperature and salinity (saltiness) in the oceans. Flow of ice from the land
into the sea is estimated by conventional glaciological and remote-sensing
(i.e. satellite and aerial) techniques. the amount of water on land and in
groundwater is derived by estimating the total volumes of natural and artificial
freshwater bodies, and aquifers.
a major advance reported in the iPCC Fifth assessment report (ar5) (Church
et al. 2013b) is that scientists now have a better understanding of the relative
importance of the main factors that cause sea-level rise, and can track how
these factors have changed over time.
Figure 6(a) shows the individual contributions to sea-level rise (coloured lines)
and the observed sea-level rise from tide gauges (black). the dashed black line
shows the observed satellite record. Figure 6(b) shows the same observations in
black, and the sum of the budget terms in red, so that a direct comparison can be
made between global observations of sea-level rise and the sum of the individual
components that contribute to sea-level rise (Church et al. 2011).
Since about 1970, the observations accord with the sum of the individual budget
terms, indicating that we have a good understanding of the relative importance
of the contributing factors to sea-level rise and how their importance is changing
through time. Since 1972, thermal expansion has contributed about 45% to total
sea-level rise, glaciers and ice caps about 40% with the remainder being made up
from greenland and antarctica, which are partially offset by water stored on land
and groundwater. there has been a significant acceleration in the contribution
from greenland since 2000.

Page 12
COUNTING THE COSTS: CLIMATE CHANGE AND COASTAL FLOODING
ClimateCounCil.org.au
Since 1972 thermal expansion has contributed about 45% to total sea-level rise and the loss of ice from glaciers and ice caps about 40%.
2.2 Projections of future sea-level rise
the amount that sea level rises in the
future will depend on the amount of
greenhouse gases emitted into the
atmosphere. the most commonly used
projections of likely regional and global
sea-level rise cover the 21st century,
which corresponds to the period of most
interest to coastal planners (see Section
4.2). the projections are based on certain
assumed trajectories of atmospheric
greenhouse gas concentrations; in the
iPCC ar5, these are called Representative
Concentration Pathways or RCPs (van
Vuuren 2011; Box 2).
Figure 6: the global sea-level budget from 1961 to 2008. (a): the individual terms of the budget (coloured) lines and observations of sea-level rise (black solid and dashed lines); (b) the sum of the budget terms (red line) and observed sea-level rise (solid and dashed black lines). Shading around the solid black lines and around the red line in part (b) show the ±one standard deviation uncertainty range. after Church et al. (2011).
Box 1: Sea-level riSe Budget (continued)

Page 13ClimateCounCil.org.au
02The science of sea-level rise
Projections of future changes in the climate system, such as global-average
air temperature or sea-level rise, require assumptions about the changes
in the concentration of greenhouse gases in the atmosphere through time.
throughout its Fifth assessment report, the iPCC (2013) has used the concept
of Representative Concentration Pathways, or rCPs, to provide trajectories of
changes in the concentration of greenhouse gases in the atmosphere.
rCPs are related to the rate at which human activities are emitting greenhouse
gases to the atmosphere, but are rather different from the emission scenarios
that have been used previously. the rCPs also incorporate the rate at which
greenhouse gases are absorbed by the oceans and by the land, the so-called
carbon sinks. Currently these carbon sinks absorb slightly more than half of
human emissions of carbon dioxide. unless there are significant changes in
the strength of these sinks, the concentration pathways, or rCPs, will generally
reflect the rate of emission of greenhouse gases to the atmosphere.
two rCPs are considered in this report:
(a) rCP4.5: this is a mitigation pathway that stabilises greenhouse gases in
the atmosphere by 2100. However, the temperature at the end of the 21st
century is more likely than not to exceed 2°C relative to the latter half of
the nineteenth century.
(b) rCP8.5: this is a “business as usual” trajectory in which atmospheric
greenhouse gas concentrations continue to rise through the century.
this trajectory will result in global temperatures around 4°C at the end
of the 21st century relative to the latter half of the nineteenth century.
through the rest of this report, we use the term “weak mitigation pathway” for
rCP4.5 and the term “business as usual pathway”, or “Bau pathway”, for rCP8.5.
the iPCC also used a stronger mitigation pathway, rCP2.6, in its Fifth
assessment. of the four pathways that the iPCC used, rCP2.6 most closely
resembles the budget approach, described in Section 4.3, which requires
rapid and deep cuts in greenhouse gas emissions to stabilise the climate at
a temperature rise of no more than 2°C above pre-industrial. We focus on
rCP4.5 and rCP8.5 in this report to highlight the very serious risks from
coastal flooding that we face if we do not take decisive and rapid action
to reduce greenhouse gas emissions.
Box 2: PathwayS of future greenhouSe gaS concentrationS in the atmoSPhere

Page 14
COUNTING THE COSTS: CLIMATE CHANGE AND COASTAL FLOODING
ClimateCounCil.org.au
Figure 7 shows the projected global-
average sea level rise for the weak
mitigation pathway (blue) and for
the Bau pathway (orange), relative to
1986–2005, as reported in the iPCC ar5
(Church et al. 2013b). For each projection,
the central black line is the median,
and the coloured band represents the
“likely range”. this range represents
the 5- to 95-percentile range of the
model projections, and was further
interpreted in the ar5 as being the
range within which future sea level
has a 66% likelihood of occurring.
the amount that sea level rises in the future will depend on the amount of greenhouse gases emitted into the atmosphere.Based on Figure 7, the sea-level rise over
the 21st century is in the approximate
range 0.4–0.7 m for the weak mitigation
pathway and 0.5–1.0 m for the Bau
pathway. these ranges are relatively
large—about the same magnitude as
the lower limit of the estimate. However,
as will be shown in Section 2.4, this
uncertainty increases the amount that
we need to allow for sea-level rise; it is
certainly not an excuse for inaction.
Sea level could rise between 0.4–1.0 m over the rest of this century depending on how rapidly we reduce emissions of greenhouse gases.one potentially large future contributor
to sea level that that cannot yet be
well modelled is the West antarctic
ice Sheet, the destabilisation of which
could add a few tens of centimetres to
the 2100 projections in a worst-case
scenario (Church et al. 2013b). recent
observations of changes in the West
antarctic ice Sheet (Joughin and alley
2011; Joughin et al. 2014; rignot et al.
2014) suggest that there are legitimate
concerns about its long-term stability
through the rest of this century.
two important analyses of risks to
australia’s coast (DCC (2009) and DCCee
(2011), which are referred to in Section
3, assumed a ‘high end’ sea-level rise at
2100 of 1.1 metre, based on projections
from the iPCC’s 2007 Fourth assessment
report (ar4) and other research
suggesting that the ar4’s projections
may have been underestimated. although
higher than the upper 95-percentile
limits shown in Figure 7, this ‘high end’
projection is still highly plausible.

Page 15ClimateCounCil.org.au
02The science of sea-level rise
a major advance in the iPCC ar5 was
the development of regional projections
of relative sea level, including the effects
of thermal expansion of the oceans,
addition of water to the oceans through
the flow of ice from the land into the
sea, changes in ocean dynamics, and
past and future changes in the earth’s
gravitational field and in the vertical
movement of the earth’s crust due to
the flow of ice from the land into the
sea. these projections are therefore the
most appropriate ones for determining
the effect of sea-level rise on the coast.
it should be noted, however, that these
projections do not include tectonic
effects or local land motion due to
processes such as subsidence caused
by groundwater withdrawal, as occurs
at Hillarys, Wa (see Section 2.1).
if the West antarctic ice Sheet is destabilised, sea-level could rise higher than currently expected.
Best estimates (central values) of sea-
level projections for australia from the
iPCC ar5, over the period 2010–2100,
for the weak mitigation and the Bau
pathways, are shown in Figures 8a and
9a, respectively. the locations shown
in these figures are the sites of long
(greater than about 30 years) australian
tide-gauge records. these sites are
representative of the major population
centres. in addition, these tide-gauge
records provide the basis for the
estimation of the increased probability
of coastal flooding described in Section
2.3. the ranges of projected sea-level
rise at the tide-gauge locations shown
are 0.45–0.53 m and 0.65–0.76 m for
the weak mitigation and Bau pathways,
respectively. the rise is slightly larger on
the southeast, east and northwest coasts
of australia.
Figure 7: Projected global-average sea-level rise for the weak mitigation (rCP4.5: blue) and Bau (rCP8.5: orange) pathways, relative to the average for the 1986–2005 period.
Page 16
COUNTING THE COSTS: CLIMATE CHANGE AND COASTAL FLOODING
ClimateCounCil.org.au
Without significant reduction of emissions, sea-level rise will likely be measured in metres in coming centuries.Sea-level rise after 2100 becomes
progressively less certain, both due to
uncertainties inherent in the models
and to a lack of knowledge of future
emissions. However, Church et al. (2013b)
reported the spread of model projections
of global-average sea-level rise (over only
a few models) for a “medium scenario”
(which is similar to the weak mitigation
pathway) of 0.26–1.09 m and 0.27–
1.51 m for 2200 and 2300, respectively
(both relative to 1986–2005). they also
considered a “high scenario” (which
is similar to the Bau pathway), which
gave model spreads of 0.58–2.03 m
and 0.92–3.59 m, for 2200 and 2300,
respectively. We could possibly see a
rise of 2 m by 2450 under the “medium
scenario” and by 2200 under the “high
scenario”. Without significant mitigation
of emissions, sea-level rise will likely be
measured in metres in coming centuries.
over longer time periods, sea-level
rise could be significantly higher.
During the last interglacial Period,
about 120,000 years ago, when global
temperature was 1° to 2° C warmer than
pre-industrial (which will more likely
than not be exceeded even under the
weak mitigation pathway) the sea level
reached at least 5 m higher than present
(Church et al. 2013b).
2.3 Increased probability of coastal flooding
the surface of the sea is never still. apart
from the increases we are measuring as
a result of increasing greenhouse gas
emissions, the surface is continually
affected by tides, storm surges and
variations over seasonal, annual and
decadal cycles. a piece of infrastructure,
if located near the coast, may experience
the occasional flooding event as result of
these variations in sea level.
the frequency of coastal flooding events trebles for every 0.1 m of sea-level rise.Such flooding events generally occur
when a storm surge coincides with a
high tide (Figure 2), but other processes
may come into play that make the
flooding event higher or lower. under
a long-term trend of rising sea level,
the frequency of flooding events (at a
given infrastructure height) increases.
Church et al. (2006) showed that, at
both Fremantle and Sydney, flooding
events of a given height increased their
frequency of occurrence by a factor of
about three during the 20th century as a
result of sea-level rise.
a rough “rule of thumb” is that the
frequency of flooding events trebles
for every 0.1 m of sea-level rise (Hunter
2012). therefore, for a 0.2 m rise, the
frequency of flooding events increases
by a factor of about 3x3 = 9; for a 0.3 m
rise, the frequency of flooding events
increases by a factor of about 3x3x3 = 27,
and so on. therefore, a 0.5 m rise (for the

Page 17ClimateCounCil.org.au
02The science of sea-level rise
21st century this would represent a mid-
range projection for the weak mitigation
pathway and a projection at the lower
end of the range for the Bau pathway)
would increase the frequency of flooding
events by about 250. this means that, if a
piece of infrastructure was designed for a
1-in-100-year flooding event (a common
design criteria), it would experience the
same flood every few months after the
sea level had risen 0.5 m.
For a sea-level rise of only 0.5 m, flood events that today might be expected once every hundred years could occur every few months in the future.as noted in Section 2.2, projections
of sea-level rise entail significant
uncertainty. the multiplying factor by
which the average frequency of flooding
events increases with sea-level rise
depends both on the best estimate of
that rise and on its uncertainty (Hunter
2012). taking both these contributions
into account, Figures 8b and 9b show
this multiplying factor over the period
2010–2100. there are wide ranges of
multiplying factors over the locations
shown: 13 to >10,000 and 45 to >10,000
for the weak mitigation and Bau
pathways, respectively. in cases where
the multiplying factor is 10,000, what
is now a 1-in-100-year flooding event
is projected to occur every few days
by 2100. table 2 shows the multiplying
factors and impacts for australian cities
in 2100 based on the Bau pathway.
this shows that Sydney, Bundaberg
and Hobart would experience today’s
1-in-100-year flooding event every day
or so by the end of this century. even
in adelaide (the least vulnerable city
shown in table 2), today’s 1-in-100-year
flooding event would occur every year or
so by 2100.
Table 2: Showing expected multiplying factors and impacts for australian cities in 2100 based on the Bau pathway.
City multiplying factor
impact
Sydney >10000 1-in-100-year event would happen every day or so
Bundaberg >10000 1-in-100-year event would happen every day or so
townsville 1500 1-in-100-year event would happen every month or so
Darwin >10000 1-in-100-year event would happen every day or so
Port Hedland 580 1-in-100-year event would happen every few months
Fremantle 820 1-in-100-year event would happen every month or so
adelaide 120 1-in-100-year event would happen every year or so
Hobart >10000 1-in-100-year event would happen every day or so
melbourne 2100 1-in-100-year event would happen more than every month

Page 18
COUNTING THE COSTS: CLIMATE CHANGE AND COASTAL FLOODING
ClimateCounCil.org.au
Figure 8: (a) best estimate (metres), (b) multiplying factor, and (c) allowance (metres) for 2100 relative to 2010 for the sea-level rise projections for the weak mitigation pathway (rCP4.5).
AUSTRALIA
TASMANIA
FREMANTLE
DARWIN
ADELAIDEMELBOURNE
SYDNEY
HOBART
PORT HEDLAND
BUNDABERG
TOWNSVILLE
0.70
0.60
0.50
0.40
AUSTRALIA
TASMANIA
FREMANTLE
DARWIN
ADELAIDEMELBOURNE
SYDNEY
HOBART
PORT HEDLAND
BUNDABERG
TOWNSVILLE
>1000
1000
100
10
AUSTRALIA
TASMANIA
FREMANTLE
DARWIN
ADELAIDEMELBOURNE
SYDNEY
HOBART
PORT HEDLAND
BUNDABERG
TOWNSVILLE
0.70
0.60
0.50
0.40
Table 3: Showing expected impact for different multiplying factors.
multiplying factor
impact
10000 1-in-100-year event would happen every few days
1000 1-in-100-year event would happen every month or so
100 1-in-100-year event would happen every year or so
10 1-in-100-year event would happen every ten years or so
a “planning allowance” may be derived
by calculating how much a piece of
infrastructure would need to be raised
to keep the average frequency of
flooding events the same in the future
as it is now. Figures 8c and 9c show
this planning allowance over the period
2010–2100 for the weak mitigation and
Bau pathways, respectively. the ranges
of allowances over the locations shown
are 0.48–0.66 m and 0.72–0.95 m for
the weak mitigation and Bau pathways,
respectively, which are 0.1–0.2 m above
the central values of the projections
(Section 2.2 and Figures 8a and 9a); this
increase results from uncertainties in the
projections. the allowances are larger on
the southeast and east coasts of australia.
(a)
(b)
(c)

Page 19ClimateCounCil.org.au
02The science of sea-level rise
AUSTRALIA
TASMANIA
FREMANTLE
DARWIN
ADELAIDEMELBOURNE
SYDNEY
HOBART
PORT HEDLAND
BUNDABERG
TOWNSVILLE
0.90
0.80
0.70
0.60
AUSTRALIA
TASMANIA
FREMANTLE
DARWIN
ADELAIDEMELBOURNE
SYDNEY
HOBART
PORT HEDLAND
BUNDABERG
TOWNSVILLE
>1000
1000
100
10
AUSTRALIA
TASMANIA
FREMANTLE
DARWIN
ADELAIDEMELBOURNE
SYDNEY
HOBART
PORT HEDLAND
BUNDABERG
TOWNSVILLE
0.90
0.80
0.70
0.60
Figure 9: (a) best estimate (metres), (b) multiplying factor, and (c) allowance (metres) for 2100 relative to 2010 for the sea-level rise projections for the weak mitigation pathway (rCP4.5).
(a)
(b)
(c)

Page 20
COUNTING THE COSTS: CLIMATE CHANGE AND COASTAL FLOODING
ClimateCounCil.org.au
2.4 Other contributing factors to risks of sea-level rise
Coasts are always at risk, even in the
absence of climate change and sea-level
rise. Coasts are exposed to storm surges
and waves, which can cause inundation
of low-lying land and modifications
to soft shorelines (i.e. those composed
of sand, mud or soft rock). of the
soft shorelines, sandy shorelines are
probably the least vulnerable because,
even though they can suffer significant
recession after a large storm (which
brings high waves and often a higher
mean water level), they generally
“repair” during quieter times. However,
as indicated in Section 1, sea-level rise
may lead to an overall recession, which
often manifests itself as an inadequate
“repair” process after a major storm.
muddy and soft-rock shorelines cannot
repair themselves in this way once they
are eroded as there is no corresponding
post-storm “repair” process.
Coastal engineers and planners design
infrastructure to cope with events of a
certain probability of occurrence. For
example much of our infrastructure
has been designed to cope with a
“one-in-one-hundred-year” extreme
event, which relates to a water level or
wave height that is exceeded, on average,
once in 100 years. this is approximately
the same as the water level or wave
height that has a likelihood of 1%
(or 1 in 100) of occurring in any one year.
there is much debate about whether this
is a sufficient safety margin. For example,
infrastructure is often designed to last
100 years and also to just withstand the
“one-in-one-hundred-year” extreme
event. However (paradoxical as it may
seem), simple statistics tells us that such
infrastructure is more likely than not to
experience something at least as severe
as the one-in-one-hundred-year event
during its 100-year lifetime—therefore
it is more likely than not to get flooded
at least once. in the netherlands, where
flooding could be widespread and
disastrous, coastal design and planning
is based on the 1-in-10,000-year extreme
event, such that the likelihood of flooding
in any 100-year period would only be
about 1% (or 1 in 100) (Kabat et al. 2009).
as noted in Section 2.1, local subsidence
of land increases the rate of relative
sea-level rise, thereby increasing the
vulnerability of the shoreline to flooding.
this effect is evident at several locations
around australia and is generally
due to the extraction of groundwater
(e.g. Hillarys, see Section 2.1; adelaide,
see Belperio, 1993) or the extraction
of oil and gas (e.g., gippsland, see
Freij-ayou et al. 2007).

3. CountIng the CoStS
the potential costs of coastal flooding can be estimated in a number of ways, including (i) the value of infrastructure that is exposed to coastal flooding, both at current sea level and at levels projected for the future; (ii) observed damages of coastal flooding events that have already occurred; and (iii) estimated damages of future coastal flooding events at a projected amount of sea-level rise.
Various methods are used to assess present and future damages to infrastructure. Some studies focus specifically on direct
infrastructure damage and the resulting insurance claims, whilst others incorporate indirect costs, such as the economic disruption from flooded businesses or cut roads, the losses of state’s tax income, or long-term declines in property value. Projected costs can also vary depending on the factors considered in different studies, such as the presumed extent of sea level rise or the local adaptive capacity of the area at risk. the discount rate employed in the study can also have a large bearing on projected future costs of coastal flooding.

Pag
e 22
CO
UN
TIN
G T
HE
CO
ST
S: C
LIM
AT
E C
HA
NG
E A
ND
CO
AS
TA
L F
LO
OD
ING
Cl
ima
te
Co
un
Cil
.or
g.a
u
Data relates to infrastructure exposed to coastal inundation and shoreline recession at a sea level rise of 1.1 metres (high end scenario for 2100). The replacement values are drawn from Geoscience Australia’s National Exposure Information System (NEXIS) database. Source: DCC 2009; DCCEE 2011.
NSW
$0.6-$1.3 billion of rail and tramways at risk
$12.7-$18.1 billion of commercial and light industrial buildings at risk
WA
VIC
Up to 15,000 HOMES AT RISK!
Up to 48,000 HOMES AT RISK!
TAS
$0.6-$1.3 billion of rail and tramways at risk
$11.3-$17 billion worth of commercial and light industrial buildings at risk
QLD
$9.7-$12.9 billion of roads at risk
$0.1 - $0.5 billion of rail and tramways at risk
NT
THE COSTS OF
COASTAL FLOODING
Over $7 billion of roads at risk
$8.7-$11.3 BILLION
OF ROADS AT RISK
COMMERCIAL & LIGHT INDUSTRIAL BUILDINGS AT RISK
$87 BILLION
HOMES AT RISK
$72 BILLION
ROAD & RAIL AT RISK
$67 BILLION
AT RISK AT
RISK AT RISK
SA
$0.6-$1.3 billion of rail and tramways at risk
$22.6-$28.2 BILLIONOF COMMERCIAL & LIGHT INDUSTRIAL
BUILDINGS AT RISK
INFRASTRUCTURE& HOMES AT RISK FROM COASTAL INUNDATION AT A SEA LEVEL RISE OF
1.1 METRES.
WORTH OF
120 PORTS
5 POWER STATIONS
258 POLICE, FIRE & AMBULANCE STATIONS
75 HOSPITALS & HEALTH SERVICES
44 WATER AND WASTE FACILITIES
NATIONAL INFRASTRUCTURE WITHIN 200 M OF THE COASTLINE
CLOSE TO
250,HOMES
$226 BILLION
AT RISK!
Up to 68,000 HOMES AT RISK!
Figure 10: Counting the costs of coastal flooding

Page 23ClimateCounCil.org.au
03Counting the Costs
in this section we briefly examine the
amount of infrastructure currently
exposed to coastal flooding, followed by
a description of the observed economic
costs of coastal flooding events that
have already occurred. We then explore
potential future economic damage
to infrastructure from the increase in
coastal flooding from sea-level rise,
noting the differences in methods and
approaches used to make the estimates.
although the focus is primarily on
australia, global examples are also given.
We conclude with a discussion of the
risks of a rising sea level for sectors other
than human infrastructure—natural
ecosystems, coastal tourism, and the
potential cultural and social issues
associated with environmentally induced
migration.
3.1 Infrastructure exposed to coastal flooding
the exposure of coastal assets to sea
level rise associated with climate
change is widespread and this hazard
will increase into the future. more than
$226 billion (2008$) in commercial,
industrial, road and rail, and residential
assets are potentially exposed to flooding
and erosion hazards at a sea level rise
of 1.1 m (a high end scenario for 2100).
Coastal assets at risk from the combined
impact of inundation and shoreline
recession include: between 5,800 and
8,600 commercial buildings, with a value
ranging from $58 to $81 billion (2008
replacement value); between 3,700 and
6,200 light industrial buildings, with a
value of between $4.2 and $6.7 billion
(2008 replacement value); and between
27,000 and 35,000 km of roads and rail,
with a value of between $51 and $67
billion (2008 replacement value) (DCCee
2011) (Figures 10, 11). replacement values
quoted above were drawn from the
geoscience australia’s national exposure
information System (neXiS) database.
Because of its location close to the
shoreline, the gold Coast is particularly
exposed to sea-level rise, storms surges,
flooding, beach erosion and the potential
damage to infrastructure. a 2009 study
by the Department of Climate Change,
(DCC) study estimated that there are
2,300 residential buildings located within
50 m of sandy coast and 4,750 within
110 m. this exposes between 4,000 and
8,000 private dwellings to the impacts of
coastal flooding, if sea levels were to rise
by 1.1 m, whilst a 5 m rise, would flood
most of the developed area (DCC 2009).
at a sea level rise of 1.1 m, more than $226 billion in commercial, industrial, road and rail, and residential assets are at risk from flooding.exposure will likely increase as the
population grows (DCCee 2011). the
intergenerational report 2010 projects
that australia’s population will grow by
65% to more than 35 million people in
2049 (Commonwealth of australia 2010),
and a large share of this growth would
be absorbed by coastal settlements and

Page 24
COUNTING THE COSTS: CLIMATE CHANGE AND COASTAL FLOODING
ClimateCounCil.org.au
cities (DCCee 2011). How many of these
new coastal settlements and dwellings
will be built in areas vulnerable to coastal
flooding will depend, at least in part, on
the effectiveness of urban and regional
planning to account for the increasing
risk of coastal flooding in future
development (see Section 4).
Figure 11: the combine estimated replacement value of infrastructure flooded by a 1.1 m sea-level rise (DCCee 2011).
Figure 12: an example of damage to a road from coastal flooding.

Page 25ClimateCounCil.org.au
03Counting the Costs
3.2 Observed economic costs of coastal flooding
3.2.1 Costs of coastal flooding in Australia
the costs incurred from extreme climate
events have been significant in the
past; the damages from major flooding,
tropical cyclones and severe storms
for the 1967–1999 period, based on
2008 residential building pricing, were
estimated at $28.6 billion (DCC 2009).
Particular examples of the extreme
events in which coastal flooding was an
important component are given below.
Cyclone Yasi (2011): one of the most
powerful cyclones to have affected
Queensland since records began was
tropical Cyclone Yasi in February 2011.
Queensland had already been devastated
by a series of severe floods that occurred
throughout December 2010 and January
2011, with record flood peaks at over
100 Queensland river height locations
(Queensland Floods Commission
2011). the cost of the 2010–11 floods,
combined with the costs from Cyclone
Yasi, reduced the Queensland gross State
Product (gSP) by $6 billion in 2010–11,
with consequences for coal exports
and tourism as well as rural production
(Queensland government 2011).
The Pasha Bulker Storm (2007): in
June 2007, the ‘Pasha Bulker Storm’
hit australia’s east coast between the
llawarra and the Hunter regions, causing
substantial damage and erosion as a
result of coastal flooding. the storm was
comprised of a total of five east coast
lows (eCls), with the first eCl causing
the most significant damage, including
widespread flooding and wind damage,
coastal erosion, the grounding of the
Pasha Bulker—a 40,000 tonne bulk
carrier ship—and the loss of nine lives.
the Pasha Bulker Storm was one of
the most severe meteorological events
in australia’s history, with substantial
economic losses and social disruption
due to the loss of critical infrastructure.
approximately 300,000 people were
without mains electricity for four days,
the coal export chain was frozen for two
weeks and telecommunications were cut
off (Verdon-Kidd 2010). it is estimated
that the value of work-related property
loss and damage from the storm and
flood was around $458 million, 22%
($123 million) of which was not covered
by insurance (mcDonald and redford
2008; Verdon-Kidd 2010).
Cyclone Larry (2006): Severe
tropical Cyclone larry hit the coast
of north Queensland, near innisfail,
on 20 march 2006 (Bom 2014a).
accompanying the cyclone was a
powerful storm surge, with coastal
areas devastated by flooding. about
10,000 homes were affected and the
cost of the damage to both infrastructure
and crops around innisfail was estimated
to be over $500 million. transport
infrastructure was also damaged,
with flooding disrupting road and rail
access for several days (Bom 2014a).
Cyclone Ingrid (2005): in early march
2005 Severe tropical Cyclone ingrid
caused significant damage along
the coastlines of Queensland, the
northern territory, Western australia
and Papua new guinea. the cyclone
was accompanied by a significant
storm surge that damaged ocean
vessels and coastal infrastructure. in
Page 26
COUNTING THE COSTS: CLIMATE CHANGE AND COASTAL FLOODING
ClimateCounCil.org.au
Western australia the accompanying
storm tide stranded boats 100 m inland
(Bom 2005). the swell was so large that
a vessel was capsized in Papua new
guinea with a loss of five lives (Bom
2005). in Queensland, Cyclone ingrid
caused approximately $2 million worth
of damages (Queensland government
2005). in the northern territory the
coastal regions of Croker island, melville
island, nhulunbuy, Bathurst island
and the Coburg Peninsula were all
severely affected by the cyclone and
accompanying flooding, with damages
reaching an estimated $10 million
(northern territory government
2005). Croker island was particularly
affected, with the island’s school, local
store, fishing lodge and pearl farms all
damaged, with the cost of rebuilding
infrastructure estimated to be over
$5 million (aBC 2005).
Cyclone Vance (1999): Severe
tropical Cyclone Vance passed across
exmouth gulf in Western australia
on 22 march 1999. the storm surge
that accompanied the cyclone was
coupled with a high tide, illustrating the
significant damage that can be triggered
when the two occur simultaneously
(for example, the storm surge and high
tide in Figure 2). the combination of
high seas and high tides caused severe
erosion of the beachfront at exmouth,
damaged barges, left vessels stranded
and caused severe structural damage to
10% of buildings in exmouth (Bom 1999;
Bom 2014b). Water and power supplies
were also disrupted and the main rail
and road links to the south were cut. the
insurance Council of australia estimated
the 1999 damage at $35 million, putting
the 2011 estimated normalised cost at
$108 million (aem 2014).
3.2.2 Costs of coastal flooding globally
Severe coastal flooding caused by
storm surges and exacerbated by rising
sea level has occurred in many places
around the world, with significant
damages. average global flood losses
in 2005 for the world’s coastal cities
were estimated to be about $uS6 billion
(Hallegatte et al. 2013). Severe coastal
flooding caused by storm surges and
exacerbated by rising sea level has
occurred in many places around the
world, with significant damages. in
the united States, the most costly
natural disaster in its history was
Hurricane Katrina, which hit the gulf
Coast and the city of new orleans
in 2005. in addition to damage from
high wind speeds, the storm surge
that accompanied the cyclone caused
significant damage to infrastructure and
loss of life. the coastal flood heights,
which reached 8.5 m above ordinary tide
levels (www.nhc.noaa.gov/outreach/
history), were the highest ever recorded
in the uSa, with an estimated $uS100
billion in losses and approximately
2,000 fatalities (lin et al. 2012).
Seven years later the atlantic Coast
of the uSa was battered by Hurricane
Sandy, an unusual storm in terms of
its size and its northerly track. again,
the combination of storm surges and
higher sea level combined to wreak
havoc on some of the country’s most
populous and economically important
areas (Box 3).

Page 27ClimateCounCil.org.au
03Counting the Costs
Hurricane Sandy had a profound impact on life and property in the Caribbean
and continental united States with 24 states experiencing direct impacts
from the storm. the superstorm caused 147 deaths, damaged or destroyed at
least 650,000 houses and left approximately 8.5 million people without power
(noaa 2013). other impacts included the cancellation of 20,000 airline flights
from 27 october to 1 november 2012, 8.6 million power outages in 17 states
(some lasting for weeks), and unparalleled disruption of rail networks across
the northeast (Halverson and rabenhorst 2013).
the tropical storm force winds stretched over 1,600 km, making Hurricane
Sandy one of the largest atlantic tropical storms ever recorded, covering over
4.6 million square kilometres. the high winds drove large storm surges; the
tide gauges at the Battery in manhattan and at Bergen Point West reach on
Staten island recorded values of 2.7 m and 2.9 m above ordinary tide levels,
respectively. the worst flooding occurred over Staten island and to the south
along the new Jersey shore ((middlesex, monmouth, and ocean Counties;
Figure 13). in coastal monmouth and ocean Counties, entire communities
were flooded, with houses swept off foundations, and cars and boats carried
inland by the surge (noaa 2013).
Hurricane Sandy killed 43 people in new York City, left thousands homeless,
caused an estimated $uS19 billion in public and private losses and crippled
the financial district. the new York Stock exchange closed for the first time
since 1888 and the storm surge flooded new York City’s subway tunnels and
inundated the runways at la guardia and Kennedy airports. the damage to the
new Jersey transit System was estimated at $uS400 million (tollefson 2013).
an assessment by the new York City Panel on Climate Change in 2010
suggested that local relative sea level could rise by 0.3–1.4 m by 2080. recent
studies by lin et al (2012) found that floods that occur once every 100 years in
the current climate could happen every 3–20 years by the end of this century
if sea level rises by 1 m. What is considered a ‘500-year’ event today could
occur every 25–240 years (tollefson 2013).
Box 3: hurricane Sandy (22–29 octoBer 2012)

Page 28
COUNTING THE COSTS: CLIMATE CHANGE AND COASTAL FLOODING
ClimateCounCil.org.au
3.3 Projected costs of coastal flooding in future
While the costs of damage to
infrastructure from coastal flooding
events that have already occurred can
be assessed or estimated based on the
current value of the infrastructure,
the insured losses, or the current
replacement value of the infrastructure,
it is not as easy to estimate the costs of
a coastal flooding event at some point
in the future, especially in the distant
future. economists use discount rates to
compare the cost of some future event
with current costs of a similar event. use
of discount rates in estimating impacts
of climate change is the topic of lively
debate, with no consensus on the rate
that should be used for impacts decades
into the future (Box 4).
500-year-�ood zone100-year-�ood zone
Area �ooded by Hurricane SandyProposed storm-surge barriers
Brooklyn
Queens
Bronx
StatenIsland
Sandy Hook, New Jersey
Manha
ttan
DANGER ZONEHurricane Sandy's storm surge combined with a high tide to �ood many areas that were predicted to be inundated only once every 500 years. The �ood zones are now being updated.
Atlantic Ocean
Hud
son
Rive
r
4 km
Figure 13: areas of new York City vulnerable to coastal flooding and areas flooded in 2012 by the storm surge from Hurricane Sandy.

Page 29ClimateCounCil.org.au
03Counting the Costs
Frank Jotzo
Crawford School of Public Policy, The Australian National University
economic assessment of investments for climate change mitigation or
adaptation requires comparing costs and benefits that occur at different points
in the future. in economic benefit-cost analysis the intertemporal dimension is
captured by “discounting” future benefits and costs relative to today’s, reducing
the present-day value of future events by some percentage rate per year.
the longer the time frames involved, the more important the discount rate.
in evaluating the expected benefits of reducing greenhouse gas emissions
to limit future climate change impacts, very long timeframes are involved.
thus the choice of the discount rate can be crucial in the evaluation.
Benefit-cost analysis of adaptation decisions may also be strongly affected
by discount rates, especially for long-lived capital investments like port
facilities, roads and rail lines.
a benefit-cost analysis of an investment to reduce emissions or invest in
adaptation measures will show a lower net present value (the discounted
stream of benefits and costs over time) the higher the discount rate. in many
cases, the discount rate will determine whether an investment is seen as
economically beneficial (with a positive net present value) or not.
a high discount rate means that events in the far future are given almost no
weight compared to the present. For example, a benefit of $1 million occurring
in 50 years has a present value of $364,000 if the discount rate is 2%, but only
$27,000 if the discount rate is 7%.
the choice of discount rate may be viewed from a normative or prescriptive
perspective, and from a positive or descriptive perspective. the descriptive
approach involves observing how individuals and markets make intertemporal
decisions, as revealed by market interest rates. market rates for example as
charged for financing of commercial investment projects do not reflect the
preferences of future generations, and there are no risk-free financial assets
of similarly long maturity as the time horizons involved in most decisions
about climate change responses. inflation-adjusted interest rates for long-term
government bonds for a number of developed countries have been in the range
of -1% to 2% (Blanco et al. 2014).
Determining a discount rate normatively involves ethical judgments. it requires
judgment about whether and how much future benefits and costs should
be discounted simply because they occur later in time, and about the fair
distribution of benefits and costs between different generations that are likely
to differ in their wealth.
Box 4: diScounting future BenefitS and coStS

Page 30
COUNTING THE COSTS: CLIMATE CHANGE AND COASTAL FLOODING
ClimateCounCil.org.au
the first of these parameters is sometimes termed the “pure rate of time
preference”. the recent literature on the economics of climate change suggests
a rate of zero or near-zero, on the basis that there is no valid ethical argument
to place less emphasis on the future than the present purely because of the
impatience or desires of the present generation. this was the approach taken
in the Stern review on the economics of climate change and the garnaut
Climate Change review (see Stern 2007 and garnaut 2008).
the second parameter involves making a judgment about societies’ aversion
to inequality between generations, and an estimation about whether and by
how much future generations will be richer than today’s population.
the recent iPCC report (Working group iii, technical Summary) finds that
the parameter used for intergenerational inequality aversion “[…] should be
consistent with attitudes towards inequality between people of different income
today. although this is ultimately a normative decision, the recent literature
favors a risk-free discount rate between one and three times the anticipated
growth rate of consumption per capita, which in turn can differ greatly
between countries. Because the long term growth rate is uncertain, there is a
precautionary argument to use a smaller discount rate” (Kolstad et al. 2014).
For australia, projections by the treasury (Commonwealth of australia 2010)
assume real per capita gDP growth of 1.5% per year toward the middle of
the century. on the basis of the iPCC findings, this implies a discount rate
of between 1.5% and 4.5%, minus an adjustment for precaution. Views will
diverge about the long-term rate of per capita income growth, with some
arguing that lower rates are possible or likely; about the adequate parameter
for inter-generational inequality aversion; and about reductions in the
discount rate to adjust for risk.
ultimately, societies and policymakers need to base their decisions on
ethical positions and value judgments, informed by analysis from natural
science and social science including economics. economic assessment of
expected benefits and costs cannot adequately deal with the uncertainties
involved in climate change, in particular the risk of catastrophic climate
change impacts. Benefit-cost analysis also struggles to put a monetary value
on non-market impacts such as the loss of human health and life, species
and iconic natural environments.

Page 31ClimateCounCil.org.au
03Counting the Costs
Where possible in the discussion below,
we note the discount rate that has been
used in the cost estimates.
3.3.1 Projected costs in Australia
the economic costs of natural disasters,
currently estimated at $6.3 billion per
year, are projected to double by 2030 and
reach $23 billion by 2050—these estimates
do not account for climate change. these
projected future costs incorporated aBS
data on predicted growth rates for the
value of housing in each state (Deloitte
access economics 2013).
CSiro (2014) assessed the future impacts
of four hazards, including coastal
inundation, on residential housing
across australia. total damage from
coastal inundation under what was
termed “a medium climate outlook”
over the period to 2100 in the absence
of adaptation is expected to amount to
a net present value of almost $6 billion,
based on 2006$ using a 5.6% nominal
discount rate.
gosford nSW. a study focusing on
future coastal flooding in gosford shows
the sharp increase in costs that can be
expected from even modest increases in
sea-level rise (lin et al 2014). the study
was based on projected infrastructure
damages caused by seawater flooding
to residential buildings and to sections
of vulnerable roadways. as a baseline
for the study, lin et al. (2014) simulated
a coastal flooding event in 2011 that
would cause approximately $3 million in
damages and affect about 200 dwellings.
With an increase in sea level of 0.4 m,
which is certainly possible this century
(see Section 2), coastal flooding would
damage about 680 dwellings at an
anticipated cost of $13.5 million (adjusted
to 2010$ values) (lin et al. 2014).
Whilst the gosford study focused
on direct infrastructure damages, it
also noted the significant impacts
that more frequent and more severe
flooding events could have on gosford’s
ecological assets, such as it wetlands.
rising sea level is increasing the risk
to the wetlands by contributing to the
salinisation and destruction of key
habitats on the gosford peninsula
(lin at al. 2014). the gosford area is
representative of numerous low-lying
coastal areas across australia that are
becoming increasingly urbanised and
are thus at risk from rising sea levels
(lin et al. 2014).
Southeast Queensland. there are an
estimated 35,200 residential buildings in
Southeast Queensland (SeQ) currently
exposed to a 1-in-100-year coastal
flooding event; these buildings would
will suffer damages of about $1.1 billion
(2009 prices) from such an event (Wang
et al. 2010). By 2030, with an additional
0.2 m rise in sea level (Figure 7)—and
with the same planning and building
regulations as today—the number of
residential buildings at risk from a similar
event is estimated to increase to about
61,500 and the costs to about $2 billion
(based on 2009 value). By 2070, with a
0.5 m rise in sea level compared to 2000,
a similar event will affect approximately
121,000 residential buildings with
potential damages of about $3.9 billion
(2009$) (Wang et al. 2010).
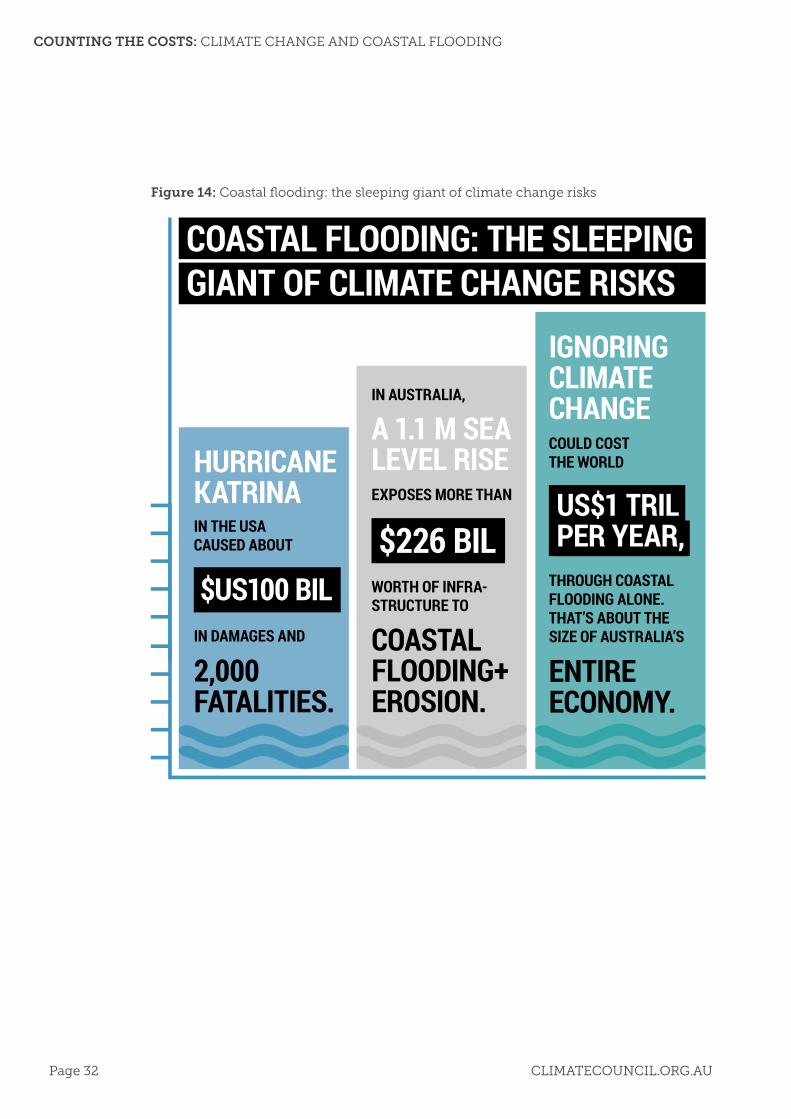
Page 32
COUNTING THE COSTS: CLIMATE CHANGE AND COASTAL FLOODING
ClimateCounCil.org.au
In AustrAlIA,
A 1.1 m seA level rIse exposes more thAn
$226 bIl worth of InfrA-structure to
coAstAl floodIng+ erosIon.
IgnorIng clImAte chAngecould cost the world
us$1 trIl per yeAr,through coAstAl floodIng Alone. thAt’s About the sIze of AustrAlIA’s
entIre economy.
hurrIcAne KAtrInA
In the usA cAused About
$us100 bIlIn dAmAges And
2,000 fAtAlItIes.
coAstAl floodIng: the sleepIng gIAnt of clImAte chAnge rIsKs
Figure 14: Coastal flooding: the sleeping giant of climate change risks
Page 33ClimateCounCil.org.au
03Counting the Costs
in Southeast Queensland the cost of coastal flooding could double by 2030 and quadruple by 2070.Brisbane. a study in the inner city
Brisbane area found that a significant
property-price discounting of 5.5%
occurs for each metre that the property
lies below the defined flood level.
after the 2011 floods, individual land
valuations fell by as much as 20 percent.
a 0.5 m rise in sea levels could affect
the value of 5.1% of inner city properties,
up from 3.6% of properties affected at
today’s sea level (rambaldi et al. 2013).
it should be noted that the discount/
height relationship found in this paper
is specific to the flood characteristics
of the Brisbane floodplain, which is
dominated by floods from the Brisbane
river. Different relationships would
apply in open coast situations.
at a national level, land value forms
a substantial part of overall property
value in coastal regions and whilst the
buildings themselves may be insured,
the land itself is not (SCCCWea 2009).
the insurance Council of australia has
emphasized that damage caused by
storm surge, landslip and sea-level rise
is not insured and coastal inundation
and erosion can leave landowners
with significant losses (Sullivan 2009;
SCCCWea 2009).
3.3.2 Projected costs globally the average global losses for the world’s
coastal cities due to floods is expected
to rise to $uS52 billion per year by 2050
from projected socio-economic change
alone, that is, an increase in exposure
(e.g., more infrastructure placed in
vulnerable locations). But the more
important factors are environmental.
When land subsidence—a serious
problem for some coastal cities—and
sea-level rise are taken into account
—and assuming that no adaptation
measures are taken—the projected flood
losses rise to a staggering $uS1 trillion
or more per year, about the size of the
entire australian economy (Hallegatte
et al. 2013). these estimates are for direct
costs only. the indirect costs may be
even more substantial; these include
economic impacts down supply chains,
competition for capital in rebuilding
after the flood, and the social costs of
environmentally induced migration
(see Section 3.4.3).
Without adaptation, global losses from coastal flooding could increase to $uS1 trillion per year by 2050.

Page 34
COUNTING THE COSTS: CLIMATE CHANGE AND COASTAL FLOODING
ClimateCounCil.org.au
Hurricanes Katrina and Sandy are
harbingers of things to come. in just over
a decade, a double whammy of higher
sea levels coupled with storm surges
is likely to increase the average annual
cost of coastal storms along the uSa
eastern Seaboard and the gulf of mexico
by $uS2 billion to $uS3.5 billion (risky
Business Project 2014). When potential
increases in north atlantic hurricane
intensity are added to the mix (iPCC
2013), the likely increase in average
annual losses increases to up to $uS7.3
billion, bringing the total annual cost
of hurricane and other coastal storm
damage to $uS35 billion (risky Business
Project 2014). With a ‘business as usual’
scenario, by 2050 between $uS66 billion
and $uS106 billion of existing coastal
property in the uSa will likely be below
mean sea level, with $uS238 billion to
$uS507 billion worth of property below
mean sea level by 2100 (risky Business
Project 2014).
Hurricanes Katrina and Sandy are harbingers of things to come.the observed and projected damages
from coastal flooding in the uSa are
large in absolute terms due to the very
large amount of valuable infrastructure
located in vulnerable areas. although
projected damages from coastal flooding
in smaller countries are much smaller
in absolute terms, they are nonetheless
important in terms of proportional
effects on the economies of these
countries (Box 5).
at the global level damage from
coastal flooding is expected to grow
considerably throughout this century
as sea levels rise and socioeconomic
development increases the number
of people and value of the built
environment in areas vulnerable to
flooding. applying national population
and gDP growth rates, and without
including adaptation, 0.2–4.6% of the
global population (1,400,000–32,200,000
people) is expected to be flooded
annually in 2100 with a rise in global-
average sea level of 0.25–1.2 m, with
expected annual losses of 0.3–9.3%
of global gDP (Hinkel et al. 2014).
the upper limit of this range—over
9% loss gDP annually—is much larger
than the annual average growth rate in
global gDP. in effect, this is a scenario
for a climate change-driven global
economic collapse.
3.4 Other impacts of coastal flooding
3.4.1 Species and natural ecosystems
Coastal ecosystems in many parts of
australia are already under serious
pressure from development. rising
sea levels and the resultant increase in
flooding frequency are exacerbating
these pressures. many ecosystems are
trapped in a ‘coastal squeeze’ between
rising sea levels and fixed landward
barriers such as seawalls, and urban
development. this squeeze will continue
to threaten the range of benefits that
these ecosystems provide, and the
species they support.

Page 35ClimateCounCil.org.au
03Counting the Costs
3.4.1.1 Coral reefsCoral reefs are under multiple threats
from climate change, especially from
rising sea temperatures that cause
bleaching, from increased ocean
acidification, and from increased
intensity of tropical cyclones. But
rising sea levels also have profound
implications for the structure and
composition of coral reef communities
– favouring some faster growing species
over those that grow more slowly. there
is evidence that corals have had difficulty
keeping up with some periods of rapid
Cost estimates are difficult to compare across studies because of a diverse
range of scenarios employed, impacts and adaptation options considered,
methodologies applied and baseline conditions assumed. Despite the large
diversity across studies, there is strong agreement that it makes economic
sense to protect large parts of the world’s coastline during the 21st century
against increased coastal flood damage and land loss (see, for example,
nicholls and tol 2006; anthoff et al. 2010; Hinkel et al. 2013).
Some developing countries and Small island States are especially vulnerable
economically. the cost of a 1 m rise in global-average sea level is estimated
to be more than 1% of national gDP for micronesia, Palau, the Bahamas and
mozambique (anthoff et al. 2010). For coastal flooding, annual damage and
protection costs are projected to amount to several percentages of the national
gDP for countries such as Kiribati, the Solomon islands, Vanuatu and tuvalu
under sea-level rise projections of 0.6–1.3 m by 2100 (Hinkel et al. 2013). in
some countries, particularly developing countries, coastal defences are not
fully effective for the current flooding risk, resulting in an ‘adaptation deficit’.
the costs of eliminating this deficit could be very high. For example, the capital
cost of building dykes to adapt to the current flooding regime in africa was
estimated in 2011 to cost $uS300 billion per year with $uS3 billion per year
required for maintenance (Hinkel et al. 2011).
ironically some types of adaptation (see next section) could actually increase
vulnerability to very large coastal flooding events, with dramatic increases in
damages when these floods occur. For example, in the iPCC Fifth assessment
report (ar5) Wong et al. (2014) described how increasing coastal flooding
protection could attract even more people and development to the flood-
prone areas on the assumption that the protection measures have decreased
vulnerability. However, if coastal defences were breached, the consequences
would be catastrophic for coastal communities (gibbs 2013). the risk of failure
of defence structures and consequent catastrophic flooding increases with
rising sea level (Hinkel et al. 2013). london, tokyo, Shanghai, Hamburg and
rotterdam are good examples of this phenomenon (nicholls et al. 2007).
Box 5: international aSSeSSmentS of the economic riSkS of coaStal flooding

Page 36
COUNTING THE COSTS: CLIMATE CHANGE AND COASTAL FLOODING
ClimateCounCil.org.au
sea level rise in the past, leading to
“drowning” of reefs (Hoegh-guldberg,
2011; Woodroffe and Webster, 2014).
3.4.1.2 Estuaries estuaries provide the critical link
between freshwater and saltwater
habitats, and are among the most
degraded habitats on earth (Koehn
et al. 2011). these habitats are highly
productive and provide breeding
grounds for many commercially
important fish and shellfish species,
as well as crocodiles in northern
regions (Fuentes et al. 2012). Sea-level
rise is increasing the salinity of
groundwater and pushing salty water
further upstream, affecting species of
salt-sensitive plants and animals both in
the estuaries themselves, and in adjacent
aquifers (Werner and lockington, 2006).
3.4.1.3 Seagrass meadows Seagrasses are marine flowering plants
that grow in shallow, sheltered sandy
areas around coasts and provide food,
shelter and nursery grounds for many
species of fish, invertebrates, turtles and
dugongs (Figure 15) and help stabilise
marine sediments, protect shorelines,
and filter and oxygenate the water
column (Saunders et al. 2013). globally,
the role of seagrasses in nutrient
cycling has been estimated to be worth
uS$1.9 trillion per year (Waycott et al.
2009). the sediments beneath seagrasses
also store more carbon (“blue carbon”)
than any other ecosystem on earth
(mcleod et al. 2011).
australia has some of the most extensive
and diverse seagrass communities in
the world. on the great Barrier reef, for
example, seagrasses cover more than
twice the area of corals (Dennison 2009).
Sea grass beds in southeastern australia
contain more than a third of all seagrass
species known worldwide (Carruthers
et al. 2007).
Figure 15: Seagrasses, threatened by rising sea levels, are relied upon by dugongs for food, shelter and nursery grounds.

Page 37ClimateCounCil.org.au
03Counting the Costs
Seagrass habitats are threatened
worldwide from coastal development,
dredging, nutrient input and
sedimentation (Hughes et al. 2009;
Sheaves et al. 2014). indeed it has been
estimated that seagrass globally is being
lost at a rate of 7% per year since the
1990s, compared to 0.9% before 1940
(Waycott et al. 2009). in australia, the
total area of seagrass beds is estimated
to have declined by 450 km2 just in the
single decade from 1986–1996, mostly
in tropical regions as a result of cyclone
damage (Kirkman 1997). Following
Cyclone Yasi in november 2011, all three
species of seagrasses in Cairns Harbour
completely disappeared, having been
at stable levels for at least six decades
(Pollard and greenway 2013).
rising sea levels pose a new threat
because, as water depths increase, light
availability for seagrass photosynthesis
will decline in current locations. in some
areas, seagrasses will be able to adapt by
colonising new, landward, habitats. in
other locations, increased sedimentation
(accretion) may be sufficient to maintain
plants at an appropriate depth (Waycott
et al. 2009). if neither of these processes
occur at a sufficient rate, continued loss
of seagrass habitats is inevitable. For
example, seagrass extent in moreton
Bay, QlD, has been projected to decline
by 17% by 2100 with a sea level rise of 1.1
m, if no concurrent improvements to
water quality occur (Saunders et al. 2013).
Seagrass decline will have significant
impacts on fisheries. the economic
contribution of seagrass to the fisheries
in the gulf waters of South australia,
for example, has been estimated to
contribute around $114 million per
annum (mcarthur and Boland 2006).
3.4.1.4 Mangroves and saltmarshes
like seagrasses, mangroves and
saltmarshes provide extremely important
habitat for many marine species, as well
as other ecosystem services such as
coastal protection, sediment trapping
and carbon storage (Figure 16; Barbier
et al. 2011; mcleod et al. 2011), (Saintilan
and rogers 2013). mangroves and
saltmarshes intercept nitrogen-rich
runoff from the land, protecting coastal
habitats from excessive nutrient input
that can lead to stimulation of harmful
algal blooms (Valiela et al. 2009). in some
regions, saltwater inundation due to
rising sea levels is leading to landward
encroachment of mangroves, sometimes
at the expense of freshwater habitats
(e.g. mulrennan and Woodroffe 1998;
Williamson et al. 2011) or saltmarsh
(rogers et al. 2013; Saintilan and rogers
2013). in some areas, this encroachment
is being enhanced by the sediment
from land-clearing washing into
waterways. increasing atmospheric Co2
may also lead to greater productivity
in these habitats (lovelock et al. 2012).
However, the coastal squeeze is also
affecting mangroves in many parts of the
australian coastline, inhibiting the ability
of mangroves to adapt as sea levels rise.
any overall loss of mangrove extent
will have significant impacts on the
viability of commercially important
fisheries. Catches of barramundi, banana
prawns and mud crabs, all of which
use mangroves as nursery habitat, are
significantly correlated with the local
extent of mangroves along the QlD
coast (manson et al. 2005).

Page 38
COUNTING THE COSTS: CLIMATE CHANGE AND COASTAL FLOODING
ClimateCounCil.org.au
3.4.1.5 Sandy beaches Sandy beaches, which provide nesting
habitat for species such as seabirds and
turtles are threatened directly by sea
level rise as well as increased damage
from storm surges (Fuentes et al. 2010;
Chambers et al. 2012).
marine turtles face multiple threats
from climate change, especially from
the impacts of rising temperatures on
the ratio between males and females,
and development of hatchlings.
inundation of beaches from rising
sea levels and flooding where turtles
nest will also reduce breeding success
(Fuentes et al. 2010); many nesting
beaches will eventually be lost entirely.
up to 38% of key green turtle nesting
areas in the northern great Barrier
reef are projected to be inundated
with a sea level rise of ~80 cm by 2100
(Fuentes et al., 2010); under storm events
this threat is substantially increased with
up to 75% of nesting areas affected.
up to 38% of key green turtle nesting areas in the northern great Barrier reef could be inundated by 2100.
Figure 16: mangroves in some regions may be subject to “coastal squeeze”—caught between rising sea levels and coastal development. in other regions, mangroves are moving landward at the expense of saltmarsh and freshwater wetlands.

Page 39ClimateCounCil.org.au
03Counting the Costs
turtles and their nest sites are also
vulnerable to increases in either the
intensity or frequency of extreme
events such as storm surges and tropical
cyclones (Fuentes and abbs 2010).
a dramatic increase in the number
of dead green turtles on northern
Queensland beaches was reported in
late 2011 following Cyclone Yasi, one
of the most powerful tropical cyclones
to have crossed the great Barrier reef
and the coast of Queensland—1275
deaths reported at this time compared to
754 for the same period in the previous
year (gBrmPa 2012). many of the turtles
appeared malnourished, likely due to
the destruction of coastal seagrass by
the extreme weather.
3.4.1.6 Coastal freshwater wetlands
Saltwater intrusion from rising sea
levels, in combination with other
human impacts, is already having
significant impacts on coastal freshwater
ecosystems in some regions. Kakadu
national Park, a uneSCo World
Heritage area, was identified in the
iPCC’s Fourth assessment report as
being particularly vulnerable to this
impact (Hennessy et al. 2007). the
coastal wetlands of Kakadu have high
conservation significance and are used
by traditional aboriginal owners, as well
as for tourism (see Section 3.4.2) and
recreational boating and fishing. much
of the Kakadu floodplain has very low
relief—falling only 0.5 m over more than
70 km (Finlayson et al. 2009). this means
that only small increases in sea level
can potentially have very large impacts.
indeed, in the east alligator river region,
intrusion of salt water several kilometers
along tidal creeks has occurred over
the past few decades, resulting in a
nine-fold increase in the area of saline
mudflats and more than 60% loss of
Melaleuca-dominated freshwater swamp
vegetation (Winn et al. 2006). these
impacts have likely occurred due to a
complex of interacting factors, including
sea-level rise and past damage by feral
buffalo (Bowman et al. 2010). Similar
losses of freshwater habitats have been
documented in other rivers in the region,
including the Wildman, South alligator
and mary rivers (Catford et al. 2013,
mulrennan and Woodroffe 1998).
loss of freshwater habitats in locations
such as Kakadu can have serious flow-
on impacts to the animals that use the
swamps as habitat. magpie geese, with
an estimated population of 2–3 million
in the northern territory, rely on these
swamps for nesting and feeding. a 5%
loss of wetland area could reduce the
population of these birds to just a few
thousand (Catford et al. 2013, traill et
al. 2010). transformation of the Kakadu
floodplains to saline habitats will also
have dramatic negative effects on other
waterbirds, crocodiles, mammals that
use the areas in the dry season, and fish
species such as barramundi that use the
habitats during part of their life cycles
(Bmt WBm 2011; Catford et al. 2013).
Saline flooding is not only a risk
for northern australia. modelling of
sea-level rise in the Hunter region of
nSW, for example, indicates that by
2100, saline flooding in the Hunter
river estuary could wipe out virtually
all of the Hunter Wetlands national
Park, an important habitat for migratory
birds (rogers et al. 2014).

Page 40
COUNTING THE COSTS: CLIMATE CHANGE AND COASTAL FLOODING
ClimateCounCil.org.au
3.4.2 Coastal tourismtourism is one of australia’s most
important industries, contributing $42.3
billion to gDP in 2013 and employing
over 900,000 people, directly or
indirectly (8% of total employment)
(tourism research australia 2014).
a substantial proportion of tourism
revenue can be attributed directly to
marine biodiversity and resources ($5.1
billion annually and 54,000 jobs in the
great Barrier reef catchment alone)
(mapstone et al. 2010). Sixty-two percent
of international visitors visit beaches
at some time in their stay (amelung
and nicholls, 2014) and surveys on the
gold Coast found that 74% of visitors
identified beach-going as the top activity
(tourism research australia 2013).
marine tourism is extremely vulnerable
to the impacts of climate change
because of its strong dependence on
environmental aesthetics and favourable
weather (Pham et al. 2010; ruhanen and
Shakeela 2013). Changes in the quality
of marine and coastal ecosystems,
especially coral reefs and beaches,
will have important flow-on impacts
not only to the local region, but also
to the australian economy in general.
increases in extreme weather will also
affect the access, cost, and/or both real
and perceived safety of some tourist
activities and destinations (mapstone et
al. 2010). any climate change-associated
decline in recreational fishing will also
have impacts in some coastal regions.
Cities such as the gold Coast may be
particularly vulnerable (Figure 17). the
city hosts over 11 million visitors per
year (Business gold Coast 2011). the
beach is central to the city’s appeal as a
tourism destination and maintenance
of the beach resource is central to the
city’s future. as sea levels rise, there is
no opportunity for the beach to move
landwards due to the adjacent high-
rise development. this means that
maintenance of the beach in the future
will require sand to be brought from
external sources. at current prices, this
equates to an expenditure (of sand alone,
without any additional infrastructure)
of $11–54 million per year over the next
century, depending on sea level scenario
used (Cooper and lemckert, 2012).
Beaches in the region are also vulnerable
to increased damage from extreme
events (Castelle et al. 2008).
Sea-level rise and associated coastal
flooding (as outlined in section 3.4.1.6)
also has serious implications for habitats
in Kakadu national Park, the most
important natural, cultural, recreational
and tourist resource in the coastal region
of the northern territory (Finlayson
et al. 2009). Kakadu attracts more than
160,000 visitors per year, and was
conservatively estimated in 2007 to bring
in more than $15 million per year to
the top end economy (tremblay 2007).
Visitor surveys consistently rate “wildlife
viewing” as the main reason for visiting
the region.
3.4.3 Environmentally Induced Migration
Some of the impacts of climate change
on australian society may be felt
indirectly, via impacts in other countries.
the iPCC has recently concluded
that, given evidence of major extreme
weather events leading to significant
population displacement in the past,
and projected changes in the incidence
of extreme events in the future, climate

Page 41ClimateCounCil.org.au
03Counting the Costs
change seems likely to amplify the risks
of population displacement, and that
“models, scenarios, and observations
suggest that coastal inundation can
lead to migration and resettlement”
(adger et al. 2014).
Projections of global, climate change-
induced movement of people in coming
decades vary from tens of millions to
as much as 250 million (myers 2002;
mcmichael et al. 2012). a world that has
warmed 4°C above pre-industrial levels
(by 2100 or later), producing a 0.5–2 m
sea level rise, has the estimated potential
to displace 1.2 and 2.2 million people
from the Caribbean, indian ocean and
Pacific ocean, assuming no adaptation
(nicholls et al. 2011). While the empirical
basis of such estimates has been
questioned (Barnett and o’neill 2012),
considerable displacement of people as
a result of future environmental changes
and extreme climate events seems likely.
in some parts of the tropical western
Pacific rates of sea-level rise of up to four
times the global average (approximately
12 mm yr -1) have been reported between
1993 and 2009 (Cazenave and remy
2011). these are generally thought to be
associated with natural cyclic climate
phenomena such as enSo (el niño-
Southern oscillation), which may cause
changes in sea level of about ±20–30 cm
(White et al. 2014). most of the critical
infrastructure, agricultural production,
and human settlements on small islands
in the western Pacific is on the coast
and so is exposed to extreme tides,
storm surge events, inundation due
to swell waves (Hoeke et al, 2013) and
sea-level rise (see also Box 6 on torres
Strait islands). these impacts raise the
Figure 17: Coastal erosion on the gold Coast

Page 42
COUNTING THE COSTS: CLIMATE CHANGE AND COASTAL FLOODING
ClimateCounCil.org.au
prospect of the need for relocation of
some Pacific island communities in the
future. thus far, however, there appear
to be no formal government policies that
allow for climate ‘refugees’ from islands
to be accepted into another country
(Bedford and Bedford, 2010) and there
are considerable financial and legal
barriers expected to inhibit such policies
(Barnett and Chamberlain 2010).
the decision to migrate is a complex
one, whether at the level of individuals
or a community and there is rarely a
single cause (nurse et al. 2014). Some
social science researchers warn of the
dangers of forced relocation, and of
social, economic and health problems
associated with resettlement away from
traditional homelands, cautioning that
such strategies should be an option of
last resort (Barnett and o’neill 2012).
the torres Strait is a broad stretch of shallow water between the tip of
Cape York and the southwestern coast of Papua new guinea. the region
includes over 100 islands, cays, coral reefs and sand banks and is home to
18 communities with a total population of around 8,700. more than 80% of
inhabitants are torres Strait islander and aboriginal people.
the torres Strait communities have very strong cultural, economic, social and
spiritual connections with their country, and are governed by their distinct
ailan Kastom (island custom). the region is also known for the diversity of its
marine ecosystems, providing habitats for many endangered species such as
turtles and dugongs.
many of the torres Strait island communities are extremely low-lying and are
thus among the most vulnerable in australia to the impacts of climate change.
the shallowness of the Strait exacerbates storm surges and when such surges
coincide with very high tides, extreme sea levels result. Sea level data collected
by satellite from one location in the torres Strait for the period 1993–2010 shows
a rise of 6 mm p.a., more than twice the global average—although it should be
acknowledged that this is a single, relatively short dataset and that the signal is
strongly influenced by the enSo cycle (see Section 2.1; White et al. 2014).
even modest sea level rises in the future will threaten the torres Strait
communities because many are situated very close to high tide level and some
are already experiencing inundation during annual high tides. inundation
affects houses, roads, water supply, power stations, sewage and stormwater
systems, cultural sites, cemeteries, gardens, community facilities and
ecosystems, and are often accompanied by severe erosion. By affecting the
infrastructure of the communities and surrounding environment, climate
change threatens the lives, livelihoods, and unique culture of the islanders.
Box 6: vulneraBility of torreS Strait iSland communitieS

Page 43ClimateCounCil.org.au
03Counting the Costs
Figure 18: Seawater overflowing a protective wall on Sabai, torres Strait islands.
Source: David Hanslow, tSra
Main sources: tSra 2008; green et al 2010; Suppiah et al 2010; tSra 2010;
mcnamara et al 2012; Preston-thomas et al 2012.
the islands of Boigu and Saibai are especially at risk, as well as the central
coral cay islands and several other communities located on low coastal flats.
Dengue fever and malaria are already concerns on many of the islands, and
the mosquito vectors of these diseases breed in brackish pools on islands such
as Saibai. increases in extreme weather, in combination with the prevalence
of water tanks near houses, could increase the risks of infection if adequate
preventative measures are not taken.
adaptation options for the communities include seawalls and levees, relocating
and raising houses and other facilities, managing dunes and associated
vegetation, building desalination plants, and beach nourishment. However,
there are limits to adaptation in these islands because of limited land area, or
by the lack of high land, such as on Saibai and Boigu. in the long-term, the
worst-case scenario is that several communities will face relocation, which
would be associated with significant cultural, spiritual and economic costs.

4. how Can we deal wIth the rISKS?

Page 45ClimateCounCil.org.au
04How can we deal witH tHe risks?
4.1 The nature of the challenge
Some of the projected increases in
economic damage caused by coastal
flooding—for example, losses of $uS1
trillion per year by 2050 (Hallegatte et
al. 2013) or a loss of over 9% in global
annual gDP by 2100 (Hinkel et al. 2014)
are extremely large. Yet, even though
these projections are based on rates of
sea-level rise that are entirely plausible—
even likely—for the remainder of this
century (the lifetime of infrastructure
being designed and built now), action
on climate change is too little and too
slow compared to the risks that climate
change poses for our future well-being.
So why is there not more concern over
the risks of sea-level rise?
one problem is the mismatch between
the time horizons of much present-
day economic analyses and planning,
and those of the climate system. there
are two fundamental aspects of this
mismatch. the first is the perception
that the present rate of sea-level rise,
about 3 mm yr-1, is too slow to matter.
this is a very short-term view. the huge
thermal inertia of the oceans and the
increasing loss of ice from the polar
ice sheets means that not only are we
committed to significant sea-level rise
this century, sea levels will continue
rising for many centuries (Figure 7;
Section 2.2). although we can slow the
rate of sea-level rise through rapid and
deep cuts in greenhouse gas emissions,
we have absolutely no choice but to
deal with the risks of rising seas for
generations into the future.
Second, many people conceive of
sea-level rise like a very slow filling
of a bathtub, in which the impact is
one of an imperceptibly slow intrusion
of water across low-lying land, so
slow that we can readily adapt at the
time. However, like many aspects of
climate change, the far more important
impacts are felt through extreme events.
as described in Section 2.3, one of the
most damaging impacts will be from
extreme coastal flooding events; with a
sea-level rise of 0.5 m, coastal flooding
events are likely to occur hundreds of
times more frequently.
With a sea-level rise of 0.5 m, coastal flooding events are likely to occur hundreds of times more frequentlyStudies in a number of states across
australia, despite variations in
methodologies, all indicate that the
projected increase in coastal flooding
will come at great economic cost
(Section 3). Furthermore, the economic
costs will rise more sharply than the
change in sea-level itself (lewandowsky
et al. 2014; Box 7).

Page 46
COUNTING THE COSTS: CLIMATE CHANGE AND COASTAL FLOODING
ClimateCounCil.org.au
Figure 19: Curvature in the shape of the potential consequence associated with rising sea level.
there is not a simple, proportional relationship between the amount of
sea-level rise and the consequences associated with it (lewandowsky et al.
2014). that is, every 10 cm rise in sea level does not increase the consequences
of coastal flooding by the same amount, as shown in Figure 19. For example,
the increase in consequences for a future 70 cm sea-level rise compared
to 50 cm is much larger than the decrease in consequences for a 30 cm
sea-level rise compared to 50 cm. therefore, taking a best estimate or average
projected sea-level rise is not a wise way to assess the economic risks from
higher sea levels. a more appropriate way would be to take the average of the
consequences for the high and low estimates of sea-level rise, which would
give a value higher than the consequence for the average value of sea-level rise.
Box 7: the raPidly riSing conSequenceS of Sea-level riSe

Page 47ClimateCounCil.org.au
04How can we deal witH tHe risks?
Finally, it is very difficult for people to
imagine what the future might hold for
their children and grandchildren as the
sea level slowly but inexorably rises as a
result of the warming of the planet. Visual
artists can bring possible futures to life
in a way that the models, projections,
facts and figures of natural scientists
can’t. Figure 20 shows two examples of
photographic artworks from an exhibition
shown at southeast australian coastal
communities as part of a research project
aimed at helping the communities to
understand the implications of rising
sea levels and to deal effectively with
them (norman et al. 2014).
Figure 20: Visual artists depict the impact of rising sea levels.
John Boyd MacDonald Humpback flight. 2013.
Heike Qualitz Contemplating adaptation. 2013.

Page 48
COUNTING THE COSTS: CLIMATE CHANGE AND COASTAL FLOODING
ClimateCounCil.org.au
this section focuses on (i) why ignoring
the problem of sea-level rise is not an
appropriate approach; (ii) the urgent need
to stabilise the climate system to prevent
unacceptable—and unmanageable—risks
of coastal flooding in the future, and (iii)
what we can do to cope with the sea-level
rise that we can’t avoid.
4.2 Do nothing: The head-in-the-sand approach
the risks of sea-level rise highlight the
dangers inherent in the denial of the
science of climate change, in taking a
wait-and-see attitude, or in responding
in an uncoordinated or ineffectual way.
in fact, doing nothing is itself a conscious
choice. By doing nothing, we are in effect
becoming increasingly ill-prepared for the
coastal flooding that is already happening,
and we will continue to make poor
planning and investment decisions for the
infrastructure of the future. Doing nothing
has serious implications for emergency
management authorities, who have to
deal with the increasing occurrence of
coastal flooding, and for the economic
well-being of communities, states and
the country. We’ll be increasingly left
with damaged, stranded and unusable
infrastructure as it is abandoned before
the end of its useful economic life.
responsibility for coastal management
in australia is shared between federal,
state and local governments, and this
means that a coordinated approach to
the risks of sea-level rise, built on a sound
base of scientific understanding, will be
the most effective way forward. lack of
agreement across governmental levels
on the scientific knowledge base, on the
seriousness of the risks, or on the need for
a common approach can lead to inaction,
conflict or maladaptation, leaving coastal
communities at higher risk from the
inevitable increase in coastal flooding
events. lack of a common approach
can also lead to significant decreases in
business efficiency, given the difficulty
of assessing the risk of investment in
different local government areas if they
all use different risk assessment criteria
and methods.
the most effective way to deal with sea-level rise is a coordinated approach from all levels of government based on science.all of australia’s states have, at one time,
acknowledged the reality of a rising sea
level and the need to plan for it. as a result,
all have instituted planning allowances
for sea-level rise until around the end
of this century (e.g., a high end scenario
for 2100, see Figure 7), with allowances
in the range 0.8–1.0 m. Such allowances
provide guidance to communities, local
governments, businesses and industries
as they plan their infrastructure for
the future. at present mandatory state
planning allowances for 2100 are in
place in Victoria, South australia and
Western australia, with local governments
having responsibility as to how the
allowances should be implemented.
Page 49ClimateCounCil.org.au
04How can we deal witH tHe risks?
in nSW and Queensland the allowances
have been revoked or suspended, with local
authorities now having broad discretion
for coastal planning (reisinger et al 2014).
tasmania has developed recommended,
but not mandated, planning allowances
for 2050 and 2100 (tasmanian Climate
Change office 2012).
Failing to deal effectively with sea-level rise means greater risks for communities.approaches to coastal planning across
the country remain highly variable and
inconsistent (good 2011; gibbs and Hill
2012). Some policies focus on managing
climate change risks to new development
but provide little guidance on how to
manage risks to existing settlements
(gibbs and Hill 2012). Planning for
emergency management requirements in
light of climate change risks is generally
focused on responding to storms, floods
and other events rather than on the longer
term planning impacts of climate change
(gibbs and Hill 2012).
many local governments lack the
resources for detailed coastal mapping and
hazard assessment, and coastal policies
in many regions are highly contested
(gorddard et al. 2012). Some councils
have applied coastal set backs to limit
development in high risk areas and some
have attempted to implement specific
policies of coastal retreat. these policies
have the potential for litigation (see Box 8),
to conflict with different policies at state
government level, and to lead to ad hoc,
individual measures that are likely to be
maladaptive. results of litigation have
varied and, in the absence of clearer
legislative guidance, more litigation is
expected as rising sea levels affect existing
properties and adaptation responses
constrain development on coastal land
(Verschuuren and mcDonald 2012).
local governments have often called for
clear policy direction from state/territory
governments and for financial resources
to assess risks and implement coastal
adaptation initiatives. many have argued
for a coordinated national approach
with clear allocation of responsibilities,
agreed allowances across jurisdictions
(Figure 9(c) provides an illustration of a
consistent set of australian allowances),
and policy integration across sectors and
scales to reduce (i) the risks of conflict
between different levels of government,
(ii) litigation where private and public
interests collide, and (iii) the possibility
of maladaptation (Barnett and o’neill
2010; good 2011; gibbs and Hill 2012;
Serrao-neumann et al. 2013).
at present, however, there are no
standardised national guidelines for
planning for the impacts of climate change
in coastal areas across australia, with
most state and the northern territory
governments operating independently
and, as a result, inconsistently (nCCoe
2012a). the national Committee on Coastal
and ocean engineering have sought
to address this, with the development
of three guidelines designed to assist
coastal engineers, managers and planners
in developing adaptation responses
at the local and state government
level (nCCoe 2012a; 2012b; 2012c).

Page 50
COUNTING THE COSTS: CLIMATE CHANGE AND COASTAL FLOODING
ClimateCounCil.org.au
Jan McDonald, University of Tasmania
the town of old Bar on the nSW mid-coast has a long history of coastal erosion
and associated concern about the impacts on coastal properties. one-in-50-
year and 1-in-100-year coastal impact lines were introduced in the 1980s and
1990s to restrict new development. Development intensified landward of the
1-in-100-year line, but many of these properties are now at risk because of a
significant increase in erosion intensity. a major tourist resort, 35 homes, the
surf club and significant public infrastructure were identified as being within
the 1-in-5-year impact line.
a local coastal hazard study for old Bar Beach prepared in 2008 concluded
that the earlier hazard lines had underestimated erosion risks and a coastline
management study identified a range of management options. these included
planned (staged) and immediate retreat, as well as a range of hard protections
in combination with soft protective works such as beach nourishment. the
high cost of defensive structures and concern about impacts on beach access
caused greater taree Council to adopt a ‘planned retreat’ policy for vulnerable
coastal areas in 2010.
this policy required at-risk properties to be removed or demolished and only
permitted new development on condition that it be removed when the erosion
line reached a prescribed point. the owners of threatened properties at old Bar
continued to exert considerable pressure on Council to construct a permanent
defensive structure. the tourist resort constructed a temporary geotextile wall
in front of its property, but the nSW Coastal Panel rejected its application to
build a more permanent structure citing its potential impacts on public access
and amenity.
the Coastal Panel’s decision and on-going beach erosion led to declines in
property values and intensified outcry from property owners. meanwhile, a
change in state government in 2011 led to shifts in coastal policy that allowed
for greater protection of private properties against coastal hazards. in response
to growing property-owner opposition and the change in state policy, gtCC
reversed its planned retreat policy and has now included plans for a permanent
rock revetment for old Bar in its Draft Coastal Zone management Plan. this
outcome highlights the inevitability of tradeoffs between private property vs
public interests and that conflicts over coastal planning can lead to sub-optimal
outcomes when considered long-term. it emphasizes the urgent need for
clear guidance from state and federal government about the prioritisation and
valuing of short- and long-term public interest values.
Main source:Foerster a, macintosh a and mcDonald J (2014)
Box 8: graPPling with the conSequenceS of coaStal eroSion: the caSe of old Bar nSw

Page 51ClimateCounCil.org.au
04How can we deal witH tHe risks?
4.3 Stabilise the climate system: Reducing greenhouse gas emissions
Doing nothing, or taking piece-meal,
uncoordinated actions, are not
appropriate options to deal with the risks
of sea-level rise and coastal flooding.
to lower the risks in the longer term,
there is no alternative but to stabilise
the climate system as soon as possible.
although there is a large degree of
inertia in several of the factors that drive
sea-level rise, the actions we take now
can significantly reduce the level of risk
that we face from coastal flooding in the
second half of the century and beyond.
as Figure 7 shows, by 2100 the central
estimate of sea-level rise for the Bau
pathway on which we are currently
tracking is approximately 20 cm higher
than that for the weak mitigation
pathway. a difference of 20 cm will
have a significant influence on the
frequency of coastal flooding, as
described in Section 2.3.
the gap between scenarios widens
further after 2100, which means that
the actions that we take (or don’t take)
now will have a very large effect on the
severity of the sea-level rise challenge
that future generations will face. it
could make the difference between a
level of coastal flooding they might be
able to cope with and one that could
overwhelm them.
to stabilise the climate system this
century at a temperature rise of no
more than 2°C above the pre-industrial
level, which would put the sea-level
rise trajectory at the lower end
of the ranges shown in Figure 7,
requires urgent, rapid and deep
cuts in greenhouse gas emissions,
particularly Co2 emissions. the
carbon budget approach provides the
clearest framework for understanding
the nature and magnitude of this
challenge (meinshausen et al. 2009;
iPCC 2013).
the carbon budget is the maximum
amount of Co2 that can be emitted to the
atmosphere by human activities to meet
the 2°C target. the budget approach
accommodates a risk management
framework. the more stringent the
budget, the greater the chance we’ll
meet the 2°C target, and vice versa.
to have a good chance—two-thirds or
greater—of stabilising the climate at the
2°C target, we have a total budget of
1000 billion tonnes of carbon emissions
from all human sources since the
beginning of the industrial revolution
in the late 1700s. By 2011, we had
consumed half of the budget and the
rate of emissions is rising, meaning that
we are consuming the remaining budget
at an ever-increasing rate (Figure 21).

Page 52
COUNTING THE COSTS: CLIMATE CHANGE AND COASTAL FLOODING
ClimateCounCil.org.au
Figure 21: overspend in the carbon budget. each Co2 symbol represents 10 billion tonnes of Co2 (Climate Commission 2013b).
Page 53ClimateCounCil.org.au
04How can we deal witH tHe risks?
the implication of the budget approach
is clear. the recent flurry of activity
in finding and developing non-
conventional fossil fuel energy sources
is a futile exercise if we want to stabilise
the climate system (Carbon tracker and
grantham institute 2013). about 80% of
the fossil fuel reserves will have to stay in
the ground and cannot be burnt.
if we are to have any chance at all of
meeting the carbon budget, stabilising
the climate system, and reducing the risk
to future generations of coastal flooding,
this is the critical decade for action. not
only will australia’s and global carbon
emissions need to be headed strongly
downward by 2020, but the investment
decisions we make over the coming
years will have a profound impact on our
capability to drive global emissions down
to very low levels by mid-century.
4.4 Be prepared: Adapting to the sea-level rise we can’t avoid
adaptation responses to rising sea levels
include a number of options, such
as ‘protection’ which can involve the
development of infrastructure such as
sea walls or flood gates, ‘accommodation’
which includes actions such as
developing pumps and raising footpaths,
and ‘retreat’ which involves the
relocation of residents from areas that
are likely to become inundated (Fletcher
et al. 2013). However, deciding which
approach to take and when to implement
it, as well as gaining community support
for any actions, can be a challenging
process. Furthermore, adaptation
responses may only provide protection
for a limited amount of time. ultimately,
as the impacts of climate change
intensify, areas of land may eventually
have to be abandoned (nCCoe 2012a).
a complex array of social factors
influence how communities decide
on which actions to take in response
to an increase in coastal flooding
(gorddard et al. 2012; abel et al. 2011;
Barnett et al. 2013). integrating these
factors and the scientific knowledge
base is perhaps most effectively achieved
via an adaptation pathway framework
focused on decision-making (Box 9).
the question of whether an additional
runway should be built at Brisbane
airport to relieve air traffic congestion
is an excellent case study of the way
a decision-centred framework can be
used to deal with the risks of coastal
flooding (Box 10).
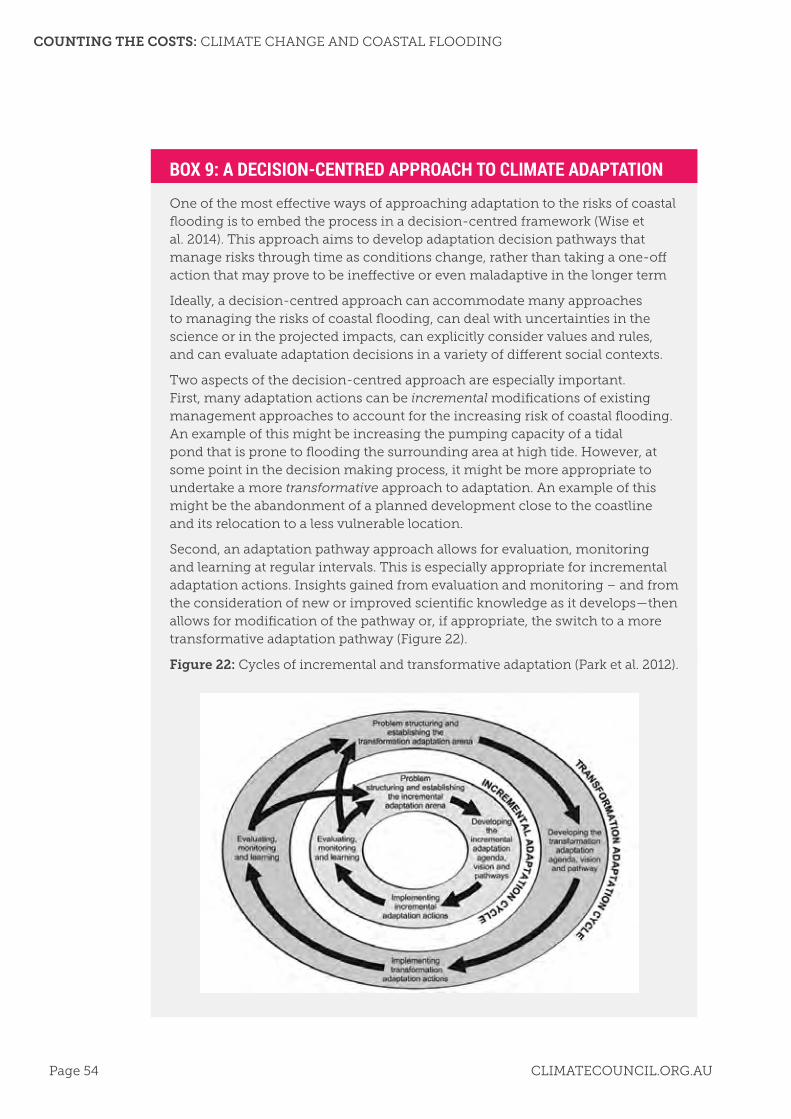
Page 54
COUNTING THE COSTS: CLIMATE CHANGE AND COASTAL FLOODING
ClimateCounCil.org.au
one of the most effective ways of approaching adaptation to the risks of coastal flooding is to embed the process in a decision-centred framework (Wise et al. 2014). this approach aims to develop adaptation decision pathways that manage risks through time as conditions change, rather than taking a one-off action that may prove to be ineffective or even maladaptive in the longer term
ideally, a decision-centred approach can accommodate many approaches to managing the risks of coastal flooding, can deal with uncertainties in the science or in the projected impacts, can explicitly consider values and rules, and can evaluate adaptation decisions in a variety of different social contexts.
two aspects of the decision-centred approach are especially important. First, many adaptation actions can be incremental modifications of existing management approaches to account for the increasing risk of coastal flooding. an example of this might be increasing the pumping capacity of a tidal pond that is prone to flooding the surrounding area at high tide. However, at some point in the decision making process, it might be more appropriate to undertake a more transformative approach to adaptation. an example of this might be the abandonment of a planned development close to the coastline and its relocation to a less vulnerable location.
Second, an adaptation pathway approach allows for evaluation, monitoring and learning at regular intervals. this is especially appropriate for incremental adaptation actions. insights gained from evaluation and monitoring – and from the consideration of new or improved scientific knowledge as it develops—then allows for modification of the pathway or, if appropriate, the switch to a more transformative adaptation pathway (Figure 22).
Box 9: a deciSion-centred aPProach to climate adaPtation
Figure 22: Cycles of incremental and transformative adaptation (Park et al. 2012).

Page 55ClimateCounCil.org.au
04How can we deal witH tHe risks?
Different approaches to adapting to
the risks of coastal flooding can have
very large economic implications. For
example, adaptation could occur through
tightening planning regulations so that
the risk to the existing stock of properties
is held to today’s levels, despite sea-level
rise. if planning regulations in southeast
Queensland did not allow further
developments in high-risk areas—but
with no action to protect existing
housing stock—the impact of 2.5 m
storm tides with an additional 0.2 m
sea level rise in 2030 could be limited
to approximately 40,300 residential
buildings, and a cost of about $1.3 billion
(compared to 61,500 buildings and
about $2 billion without adaptation).
this same adaptation could limit the
impact of these storm tides in 2070
to approximately 48,000 residential
buildings and a cost of about $1.5 billion,
compared to 121,000 buildings and
about $3.9 billion without adaptation
(Wang et al. 2010).
a recent study by CSiro (2014) found
that some proactive adaptation
measures nationally could provide
net present benefits (damage avoided
minus prevention cost) of up to $4
billion ($2006, nominal discount rate
5.6%, medium climate outlook) when
compared to implementing current
standards based on historic climate
information. note that that these
estimates are for residential housing
only, and do not include commercial,
industrial, road and rail infrastructure,
or the power and water infrastructure
needed to service the residences.
adaptation measures can come at
a variety of costs, subject to region
and method of estimation, but these
costs were consistently lower than the
damages that these measures help
to prevent (CSiro 2014). However,
this study assessed that, even after
appropriate adaption measures, there
would still be a present value of costs
of nearly $2 billion in residual damages
as well as the costs of adaptation.
Furthermore, there are a variety of
barriers in australia, in addition to
cost, that may prevent the adoption of
essential adaptation measures. these
can include difficulties with governance,
lack of policy certainty, and lack of local
resources (Barnett et al. 2013).
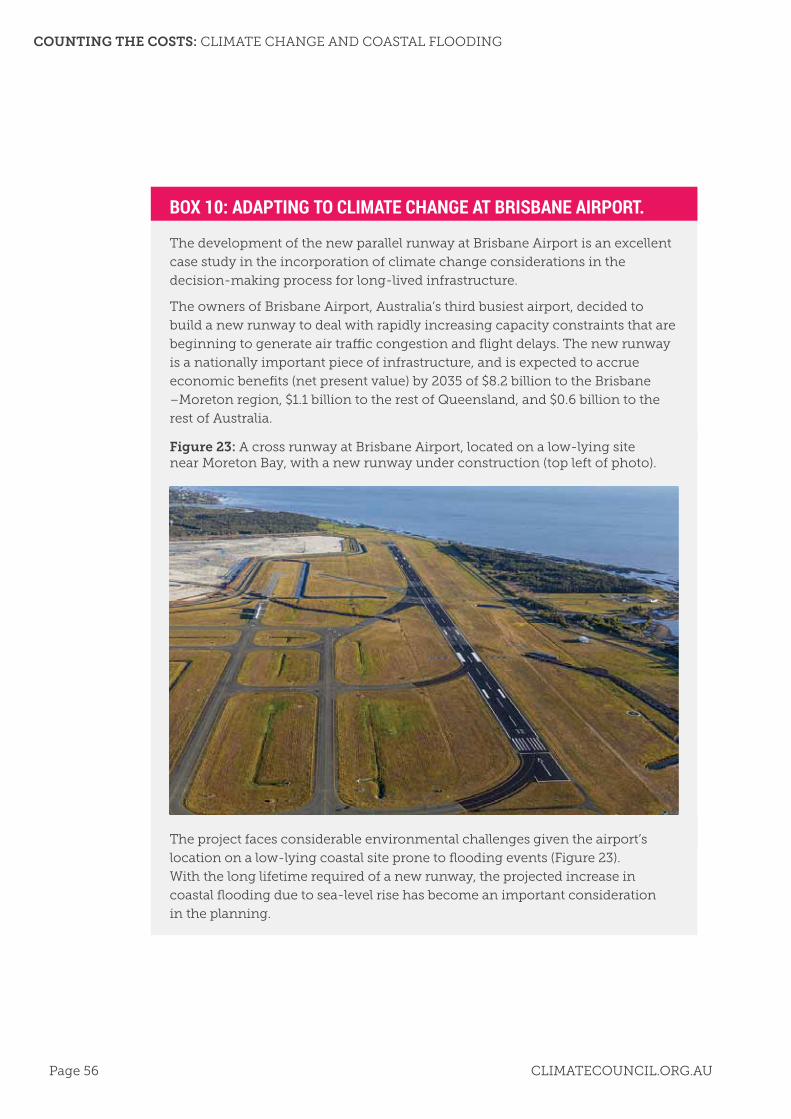
Page 56
COUNTING THE COSTS: CLIMATE CHANGE AND COASTAL FLOODING
ClimateCounCil.org.au
the development of the new parallel runway at Brisbane airport is an excellent
case study in the incorporation of climate change considerations in the
decision-making process for long-lived infrastructure.
the owners of Brisbane airport, australia’s third busiest airport, decided to
build a new runway to deal with rapidly increasing capacity constraints that are
beginning to generate air traffic congestion and flight delays. the new runway
is a nationally important piece of infrastructure, and is expected to accrue
economic benefits (net present value) by 2035 of $8.2 billion to the Brisbane
–moreton region, $1.1 billion to the rest of Queensland, and $0.6 billion to the
rest of australia.
Box 10: adaPting to climate change at BriSBane airPort.
Figure 23: a cross runway at Brisbane airport, located on a low-lying site near moreton Bay, with a new runway under construction (top left of photo).
the project faces considerable environmental challenges given the airport’s
location on a low-lying coastal site prone to flooding events (Figure 23).
With the long lifetime required of a new runway, the projected increase in
coastal flooding due to sea-level rise has become an important consideration
in the planning.

Page 57ClimateCounCil.org.au
04How can we deal witH tHe risks?
the decision process already had a number of important considerations to
deal with, including:
› interests of stakeholders, which include federal, state and local government
agencies, airlines, nearby residents and passengers from the broader area.
› Cost, an important consideration for owners and investors; the airport is majority owned (81%) by superannuation funds.
› Safety considerations, which require the airport to meet regulatory requirements to ensure a very high standard of aviation safety.
› operational and noise restrictions, which place limitations on the possible location of the new runway.
added into this mix were the implications of climate change, and the need to ensure that the runway would remain viable during its lifetime in the face of a rising sea level. the trade-off between viability and cost was an interesting one, as the cost of increasing the height of a 3,300 m long runway, even by a few centimetres, is very large.
the decision-making process was supported by the most up-to-date, authoritative scientific advice and modelling tools on the increasing risks of coastal flooding, information supplied by the antarctic Climate & ecosystems Cooperative research Centre (aCe CrC). the advice apparently was valuable, as the airport opted for a height of 4.1 m above current sea level (see Colonial First State global asset management 2012, fig 7), a decision that the aCe CrC described as “strongly precautionary”.
the decision on the new parallel runway at Brisbane airport demonstrates that taking a decision-oriented approach to climate adaptation, in the context of many other factors that need to be considered, can deliver an outcome that meets the needs of the various stakeholders whilst providing long-term resilience against the risks of coastal flooding.

5. the bottom lIne
Page 59ClimateCounCil.org.au
05The boTTom line
the risks associated with rising sea level
are largely under the radar despite the
enormous implications they have for our
economy and our way of life. in terms
of the potential for significant economic
damage and major social disruption,
coastal flooding is the sleeping giant.
› While the costs of transforming to a
low carbon economy are frequently
estimated and widely debated,
the costs of not making this
transformation are much less known.
› assessing the costs of coastal
flooding begins to redress this critical
imbalance. globally, one estimate
puts these costs at $uS 1 trillion by
2050, while others estimate that
costs could rise to over 9% of global
gDP annually. this is a scenario
for economic collapse.
› reducing these costs through
proactive adaptation is clearly
essential, but there will usually still be
significant residual risks and damages
even after appropriate adaptation.
› When the estimated economic costs
of increases in other extreme weather
events in addition to coastal flooding
(e.g., heatwaves, bushfires, storms and
wind damage) are also considered, the
costs of not reducing greenhouse
emissions becomes even greater.
Climate change is ultimately an ethical,
moral, equity and intergenerational
issue. nevertheless, the economic
risks from climate impacts are also
important and often neglected in the
public discourse. much more reliable
information on the rising economic
costs of climate change impacts and
risks, and a better understanding of
how to adaptively plan for the future
under uncertainty, are essential for
informed decision-making.
the bottom line is clear. the enormous
risks of sea-level rise, both in the short
and long terms, can be ultimately
managed only by stabilising the climate
system. this requires that greenhouse
gas emissions are reduced deeply and
quickly, and that the transition to a
carbon-free global economy is achieved
this century, the sooner the better.
this is the critical decade for action.
now is the time to get on with the job.
SourceS of data1. regional iPCC ar5 sea-level
projections were from:
ftp.icdc.zmaw.de/ar5_sea_level_rise/
2. global-average iPCC ar5 sea-level
projections:
www.met.rdg.ac.uk/~jonathan/data/
ar5_sealevel
3. tide-gauge data:
“Sea-level data were supplied by the
national tidal Centre (Bureau of
meteorology, australia)”.

Page 60
COUNTING THE COSTS: CLIMATE CHANGE AND COASTAL FLOODING
ClimateCounCil.org.au
aBC (australian Broadcasting
Corporation) (13 September 2005)
Croker island rebuilding bill tops $5m.
accessed at http://www.abc.net.au/
news/2005-09-13/croker-island-
rebuilding-bill-tops-5m/2102070.
abel n, gorddard r, Harman B, leitch
a, langridge J, ryan a and Heyenga S
(2011) Sea level rise, coastal development
and planned retreat: analytical
framework, governance principles and
an australian case study. Environmental
Science & Policy 14: 279-288.
adger Wn, Pulhin Jm, Barnett J, Dabelko
gD, Hovelsrud gK, levy m, oswald
Spring Ú and Vogel CH (2014) Human
security. in: Climate Change 2014:
impacts, adaptation and Vulnerability.
Part a: global and Sectoral aspects.
Contribution of Working group ii to
the Fifth assessment report of the
intergovernmental Panel on Climate
Change [Field CB, Barros Vr, Dokken
DJ, mach KJ, mastrandrea mD, Bilir
te, Chatterjee m, ebi Kl, estrada Yo,
genova rC, girma B, Kissel eS, levy
an, macCracken S, mastrandrea Pr and
White ll (eds.)]. Cambridge university
Press, Cambridge, united Kingdom and
new York, nY, uSa, pp. XXX-YYY.
aem (australian emergency
management) (2014) resource –
australian emergency management
Knowledge Hub. accessed at
https://www.emknowledge.gov.au/
resource/?id=345.
amelung B and nicholls S (2014)
implications of climate change
for tourism in australia. Tourism
Management 41: 228–244.
anthoff D, nicholls rJ and tol rSJ (2010)
the economic impact of substantial
sea-level rise. Mitigation and Adaptation
Strategies for Global Change 15(4):
321–335.
aS/nZS iSo 31000:2009 Standards
australia / Standards new Zealand
(2009) risk management-Principles
and guidelines.
Barbier eB, Hacker SD, Kennedy C,
Koch eW, Stier aC and Silliman Br
(2011) the value of estuarine and
coastal ecosystem services. Ecological
Monographs 81: 169-193.
Barnett J and Chamberlain n (2010)
migration as Climate Change adaptation:
implications for the Pacific. in: Climate
Change and migration, South Pacific
Perspectives. Burson B (ed). institute
of Policy Studies, Victoria university of
Wellington, Wellington, new Zealand,
pp. 51–60.
Barnett J and o’neill S (2010)
maladaptation. global environmental
Change 20: 211–213.
Barnett J and o’neill SJ (2012) islands,
resettlement and adaptation. nature
Climate Change 2: 8–10.
Barnett J, Waters e, Pendergast S and
Puleston a (2013) Barriers to adaptation
to sea-level rise: final report. national
Climate Change adaptation research
references

Page 61ClimateCounCil.org.au
RefeRences
Facility. accessed at http://www.nccarf.
edu.au/sites/default/files/attached_files_
publications/Barnett_2013_Barriers_to_
adaptation_to_sea_level_rise.pdf.
Bedford r and Bedford C (2010)
international migration and Climate
Change: a Post-Copenhagen Perspective
on options for Kiribati and tuvalu.
in: Climate Change and migration:
South Pacific perspectives, Burson B
(ed). institute of Policy Studies, Victoria
university of Wellington, Wellington,
pp. 89-134.
Belperio aP (1993) land subsidence
and sea-level rise in the Port adelaide
estuary: implications for monitoring the
greenhouse effect. Australian Journal
of Earth Sciences 40(4), 359–368,
doi:10.1080/08120099308728087.
Blanco g, gerlagh r, Suh S, Barrett
J, de Coninck HC, Diaz morejon CF,
mathur r, nakicenovic n, ofosu
ahenkora a, Pan J, Pathak H, rice J,
richels r, Smith, SJ, Stern Di, toth
Fl and Zhou P (2014) Drivers, trends
and mitigation. in: Climate Change
2014: mitigation of Climate Change.
Contribution of Working group iii
to the Fifth assessment report of the
intergovernmental Panel on Climate
Change. [edenhofer o, Pichs-madruga r,
Sokona Y, Farahani e, Kadner S, Seyboth
K, adler a, Baum i, Brunner S, eickemeier
P, Kriemann B, Savolainen J, Schlömer
S, von Stechow C, Zwickel t and minx
JC (eds.)] Cambridge university Press,
Cambridge, united Kingdom and new
York, nY, uSa.
Bmt WBm (2011) Kakadu: Vulnerability
to climate change impacts. léger, l,
Ward m, andrews m, richardson D,
Stewart J, mckemey m and robinson J
(eds). Canberra, Department of Climate
Change and energy efficiency.
Bom (Bureau of meteorology) (1999)
tropical Cyclone Vance. Perth tropical
Cyclone Warning Centre: Bureau
of meteorology. accessed at http:
//www.bom.gov.au/cyclone/history/
pdf/vance.pdf.
Bom (2005) tropical Cyclone ingrid:
report. Bureau of meteorology. accessed
at http://www.bom.gov.au/cyclone/
history/pdf/ingrid.pdf.
Bom (2014a) Severe tropical Cyclone
larry: Summary. Bureau of meteorology.
accessed at http://www.bom.gov.au/
cyclone/history/larry.shtml.
Bom (2014b) Severe tropical
Cyclone Vance: Summary. Bureau
of meteorology. accessed at http:
//www.bom.gov.au/cyclone/history/
vance.shtml.
Bom (2014c) Storm Surge Preparedness
and Safety. Bureau of meteorology.
accessed at http://www.bom.gov.au/
cyclone/about/stormsurge.shtml.
Bom (2014d) monthly Data report—
June 2014, australian Baseline Sea
level monitoring array, Bureau of
meteorology. accessed at www.bom.
gov.au/oceanography/projects/abslmp/
reports.shtml.
Bowman D, Prior lD and De little SC
(2010) retreating melaleuca swamp
forests in Kakadu national Park:
evidence of synergistic effects of climate
change and past feral buffalo impacts.
Austral Ecology 35: 898–905.

Page 62
COUNTING THE COSTS: CLIMATE CHANGE AND COASTAL FLOODING
ClimateCounCil.org.au
Burgette rJ, Watson CS, Church Ja,
White nJ, tregoning P and Coleman r
(2013) Characterizing and minimizing
the effects of noise in tide gauge time
series: relative and geocentric sea
level rise around australia. Geophysical
Journal International, doi: 10.1093/
gji/ggt131.
Business gold Coast (2011) tourism
industry. accessed at http://www.
businessgc.com.au/uploads/touriSm/
Business%20gold%20Coast%20
tourism%20Factsheet.pdf.
Carbon tracker and the grantham
research institute (2013) unburnable
carbon 2013: Wasted capital and
stranded assets. accessed at http://www.
carbontracker.org/site/wastedcapital.
Carruthers tJB, Dennison WC,
Kendrick ga, Waycott m, Walker Di
and Cambridge ml (2007) Seagrasses
of south-west australia: a conceptual
synthesis of the world’s most diverse
and extensive seagrass meadows.
Journal of Experimental Marine
Biology and Ecology 350: 21–45.
Castelle B, le Corre Y and tomlinson
r (2008) Can the gold coast beaches
withstand extreme events? Geo-Marine,
Letters 28: 23–30.
Catford Ja, naiman rJ, Chambers le,
roberts J, Douglas m and Davies P (2013)
Predicting novel riparian ecosystems
in a Changing Climate. Ecosystems 16:
382–400.
Cazenave a and remy F (2011) Sea level
and climate: measurements and causes
of changes. Wiley interdisciplinary
reviews: Climate Change 2(5): 647–662.
Chambers le, Dann P, Devney C,
Dunlop n and Woehler e (2012) Seabirds.
in: marine Climate Change impacts
and adaptation report Card for australia
2012. Poloczanska eS, Hobday aJ and
richardson aJ (eds). accessed at
http://www.oceanclimatechange.org.au.
iSBn: 978-0-643-10928-5.
Chen K and mcaneney J (2006)
High-resolution estimates of australian
coastal population: with validations of
global data on population, shoreline and
elevation. Geophysical Research, Letters
33, l16601, doi:10.1029/2006gl026981.
Church Ja, Hunter Jr, mcinnes Kl
and White nJ (2006) Sea-level rise
around the australian coastline and
the changing frequency of extreme
sea-level events, Australian
Meteorological Magazine 55: 253–260.
Church J, White n, aarup t, Wilson W,
Woodworth P, Domingues C, Hunter J
and lambeck K (2008) understanding
global sea levels: past, present and
future. Sustainability Science 3: 9–22.
Church Ja and White nJ (2011)
Sea-level rise from the late 19th to
the early 21st century. Surveys in
Geophysics 32: 585–602.
Church Ja, White nJ, Konikow lF,
Domingues Cm, Cogley Jg, rignot
e, gregory Jm, van den Broeke mr,
monaghan aJ and Velicogna i (2011)
revisiting the earth’s sea-level and
energy budgets from 1961 to 2008.
Geophysical Research, Letters 38:
18601, doi:10.1029/2011gl048794.

Page 63ClimateCounCil.org.au
RefeRences
Church Ja, monselesan D, gregory
Jm and marzeion B (2013a) evaluating
the ability of process based models to
project sea-level change, Environmental
Research, Letters, 8: 014051,
doi:10.1088/1748-9326/8/1/01405.
Church Ja, Clark Pu, Cazenave a,
gregory Jm, Jevrejeva S, levermann
a, merrifield ma, milne ga, nerem
rS, nunn PD, Payne aJ, Pfeffer Wt,
Stammer D. and unnikrishnan aS
(2013b). Sea level Change. in: Climate
Change 2013b: the Physical Science
Basis. Contribution of Working group
i to the Fifth assessment report of the
intergovernmental Panel on Climate
Change [Stocker tF, Qin D, Plattner gK,
tignor m, allen SK, Boschung J, nauels
a, Xia Y, Bex V and midgley Pm (eds)].
Cambridge university Press, Cambridge,
united Kingdom and new York, nY, uSa.
Climate Commission (2013a) the
Critical Decade: extreme Weather.
Steffen W, Hughes W and Karoly
D. accessed at http://www.igcc.
org.au/resources/Documents/
extremeWeatherreport_web.pdf.
Climate Commission (2013b) the
Critical Decade 2013: Climate Change
Science, risks and responses.
Steffen W and Hughes l. accessed at
http://www.climatecouncil.org.au/
uploads/b7e53b20a7d6573e1ab269d
36bb9b07c.pdf.
Colonial First State global asset
management (2012) Climate change
adaptation at Brisbane airport. Case
Study: new Parallel runway project,
December 2012, accessed at http://
www.cfsgam.com.au/uploadedFiles/
Content/insights/reports(1)/121221_
infrasrtucture_Brisbane_airport.pdf.
Commonwealth of australia (2010)
australia to 2050: future challenges.
Circulated by the Hon. Wayne Swan
mP treasurer of the Commonwealth
of australia, January 2010. iSBn 978-0-
642-74576-7. accessed at http://archive.
treasury.gov.au/igr/igr2010/report/pdf/
igr_2010.pdf.
Cooper Jag and lemckert C (2012)
extreme sea-level rise and adaptation
options for coastal resort cities:
a qualitative assessment from the
gold Coast, australia. Ocean & Coastal
Management 64: 1–14.
CSiro (Commonwealth Scientific
and industrial research organisation)
Climate adaptation Flagship (2014)
Policy analysis Summary—national
responses to current and future hazards
to residential Housing, CSiro, australia.
DCC (Department of Climate Change)
(2009) Climate Change risks to
australia’s Coast: a First Pass national
assessment, DCC, Canberra. accessed at
http://www.climatechange.gov.au/sites/
climatechange/files/documents/03_2013/
cc-risks-full-report.pdf.
DCCee (Department of Climate Change
and energy efficiency) (2011) Climate
Change risks to Coastal Buildings
and infrastructure, DCC, Canberra.
accessed at http://www.climatechange.
gov.au/sites/climatechange/files/
documents/03_2013/risks-coastal-
buildings.pdf.
Deloitte access economics (2013)
Building our nation’s resilience to
natural disasters, australian Business
roundtable for Disaster resilience
and Safer Communities.
Dennison WC (2009) global trajectories
of seagrasses, the biological sentinels

Page 64
COUNTING THE COSTS: CLIMATE CHANGE AND COASTAL FLOODING
ClimateCounCil.org.au
of coastal ecosystems. in: global loss
of Coastal Habitats: rates, Causes
and Consequences. Duarte C m (ed).
pp. 89–106.
Douglas BC (2001) Sea level Change
in the era of the recording tide
gauge, in Sea level rise, History and
Consequences. Douglas BC, Kearney m,
leatherman S (eds). 37–64, academic
Press, San Diego.
Duarte Cm, middelburg JJ and
Caraco n (2005) major role of marine
vegetation on the oceanic carbon cycle.
Biogeosciences 2: 1–8.
Finlayson Cm, eliot i and eliot m (2009)
a Strategic Framework for monitoring
Coastal Change in australia’s Wet
tropics—Concepts and Progress.
Geographical Research 47: 109–123.
Fletcher CS, taylor Bm, rambaldi an,
Harman, BP, Heyenga S, ganegodage Kr,
lipkin F and mcallister rrJ (2013) Costs
and coasts: an empirical assessment
of physical and institutional climate
adaptation pathways, national Climate
Change adaptation research Facility,
gold Coast, p.53.
Foerster a, macintosh a and mcDonald J
(2014) trade-offs in adaptation planning.
Protecting public interest environmental
values, in review.
Freij-ayoub r, underschultz J, li F, trefry
C, Hennig a, otto C and mcinnes K
(2007) Simulation of Coastal Subsidence
and Storm Wave inundation risk in
the gippsland Basin, CSiro Petroleum
report 07–003.
Fuentes mmPB, limpus CJ, Hamann m
and Dawson J (2010) Potential impacts
of projected sea-level rise on sea turtle
rookeries. Aquatic Conservation-Marine
and Freshwater Ecosystems 20: 132–139.
Fuentes mmPB, abbs D (2010) effects
of projected changes in tropical cyclone
frequency on sea turtles. Marine Ecology
Progress Series, 412: 283–292.
Fuentes mPB, Hamann m and
lukoschek V (2012) marine reptiles.
in: a marine Climate Change impacts
and adaptation report Card for australia
2012. Poloczanska eS, Hobday aJ and
richardson aJ (eds). accessed at http://
www.oceanclimatechange.org.au.
garnaut r (2008) the garnaut Climate
Change review. australian national
university Press, australia. accessed
at http://www.garnautreview.org.
au/2008-review.html.
gBrmPa (great Barrier reef marine Park
authority) (2012) extreme weather and
the great Barrier reef. Published by the
great Barrier reef marine Park authority.
iSBn 978 1 921682 74 2 (pdf). pp. 26.
gibbs m t (2013) asset anchoring
as a constraint to sea level rise
adaptation. Ocean & Coastal
Management 85: 119–123.
gibbs m and Hill t (2012) Coastal
Climate Change risk—legal and
Policy responses in australia.
Department of Climate Change and
energy efficiency, Canberra, pp.89.
good m (2011) technical report:
government Coastal Planning responses
to rising Sea levels, australia and
overseas. antarctic Climate & ecosystems
Cooperative research Centre, July 2011.
iSBn 978-1-921197-13-0.

Page 65ClimateCounCil.org.au
RefeRences
gorddard r, Wise r, alexander K,
langston a, leitch a, Dunlop m, ryan
a and langridge J (2012) Striking the
balance: coastal development and
ecosystem values. Department of
Climate Change and energy
efficiency, Canberra, pp.114.
green D, alexander l, mcinnes K,
Church J, nicholls, n and White n
(2010) an assessment of climate change
impacts and adaptation for the torres
Strait islands, australia. Climatic Change
102: 405–433.
Hallegatte S, green C, nicholls rJ and
Corfee-morlot J (2013) Future flood
losses in major coastal cities. nature
Climate Change 3(9): 802-806.
Halverson, JB and rabenhorst t (2013)
Hurricane Sandy: the Science and
impacts of a Superstorm. Weatherwise
66(2): 14–23.
Hennessy K, Fitzharris B, Bates B,
Harvey n, Howden m, Hughes l,
Salinger J, Warrick r (2007) australia
and new Zealand. in: Climate Change
2007: impacts, adaptation and
Vulnerability. Contribution of Working
group ii to the Fourth assessment
report of the intergovernmental Panel
on Climate Change [Parry m, Canziani
o, Palutikof J, D lpv, Hanson C (eds.)].
pp.507–40 Cambridge university Press,
Cambridge, uK.
Hinkel J, Brown S, exner l, nicholls
rJ, Vafeidis at and Kebede aS (2011)
Sea-level rise impacts on africa and the
effects of mitigation and adaptation:
an application of DiVa. regional
environmental Change 12: 207-224.
Hinkel J van Vuuren DP, nicholls rJ and
Klein rJt (2013) the effects of mitigation
and adaptation on coastal impacts in the
21st century. Climatic Change 117 (17):
783–794.
Hinkel J, lincke D, Vafeidis at, Perrette
m, nicholls rJ, tol rS, marzeion B,
Fettweis X, ionescu C and levermann
a (2014) Coastal flood damage and
adaptation costs under 21st century
sea-level rise. Proceedings of the
national academy of Sciences, 111(9):
3292–3297.
Hoegh-guldberg o (2011) Coral reef
ecosystems and anthropogenic climate
change. Regional Environmental
Change 11: 215–227.
Hoeke rK, mcinnes Kl, Kruger J,
mcnaught r, Hunter J, and Smithers S
(2013) Widespread inundation of
Pacific islands by distant-source
wind-waves. Global and Planetary
Change 108: 128–138.
Hughes r, Williams S, Duarte, C., Heck,
K.J, Waycott m (2009) associations
of concern: declining seagrasses and
threatened dependent species. Frontiers
in Ecology and Environment 7: 242–6.
Hunter J (2012) a simple technique for
estimating an allowance for uncertain
sea-level rise. Climatic Change 113:
239–252, doi:10.1007/s10584-011-0332-1.
Hunter J, Coleman r and Pugh D
(2003) the sea level at Port arthur,
tasmania, from 1841 to the present.
Geophysical Research, Letters 30(7):
1401, doi:10.1029/2002gl016813.

Page 66
COUNTING THE COSTS: CLIMATE CHANGE AND COASTAL FLOODING
ClimateCounCil.org.au
iPCC (intergovernmental Panel on
Climate Change) (2012) managing the
risks of extreme events and Disasters
to advance Climate Change adaptation.
a Special report of Working groups i
and ii of the intergovernmental Panel
on Climate Change [Field CB, Barros
V, Stocker tF, Qin D, Dokken DJ, ebi
Kl, mastrandrea mD, mach KJ, Plattner
g-K, allen SK, tignor m and midgley
Pm (eds.)]. Cambridge university Press,
Cambridge, uK, and new York, nY, uSa,
582 pp.
iPCC, 2013: Summary for Policymakers.
in: Climate Change 2013: the Physical
Science Basis. Contribution of Working
group i to the Fifth assessment report of
the intergovernmental Panel on Climate
Change [Stocker tF, Qin D, Plattner
g-K, tignor m, allen SK, Boschung J,
nauels a, Xia Y, Bex V and midgley Pm
(eds.)]. Cambridge university Press,
Cambridge, united Kingdom and new
York, nY, uSa, pp. 1–30, doi:10.1017/
CBo9781107415324.004.
Jevrejeva S, moore SJC, grinsted a and
Woodworth Pl (2008) recent global sea
level acceleration started over 200 years
ago? Geophysical Research, Letters 35:
l08715.
Joughin i and alley r B (2011) Stability
of the West antarctic ice sheet in a
warming world nature geoscience 4:
506–513.
Joughin i, Smith Be and medley B (2014)
marine ice Sheet Collapse Potentially
under Way for the thwaites glacier
Basin, West antarctica Science 344:
no. 6185 pp.735–738.
Kabat P, Fresco lo, Stive mJF, Veerman
CP, van alphen JSlJ, Parmet BWaH,
Hazeleger W and Katsman Ca (2009)
Dutch coasts in transition. Nature
Geoscience 2: 450–452.
Kirkman H (1997). Seagrasses of australia.
australia: State of the environment
technical Paper Series (estuaries and
the Sea), Department of the
environment, Canberra.
Koehn JD, Hobday aJ, Pratchett mS
and gillanders Bm (2011) Climate change
and australian marine and freshwater
environments, fishes and fisheries:
synthesis and options for adaptation.
Marine and Freshwater Research 62:
1148–1164.
Kolstad C, urama K, Broome J, Bruvoll
a, Cariño olvera m, Fullerton D, gollier
C, Hanemann Wm, Hassan r, Jotzo
F, Khan mr, meyer l and mundaca l
(2014) Social, economic and ethical
Concepts and methods. in: Climate
Change 2014: mitigation of Climate
Change. Contribution of Working group
iii to the Fifth assessment report of the
intergovernmental Panel on Climate
Change [edenhofer o, Pichs-madruga r,
Sokona Y, Farahani e, Kadner S, Seyboth
K, adler a, Baum i, Brunner S, eickemeier
P, Kriemann B, Savolainen J, Schlömer
S, von Stechow C, Zwickel t and minx
JC (eds.)].Cambridge university Press,
Cambridge, united Kingdom and new
York, nY, uSa.
lewandowsky S, risbey JS, Smithson m,
newell Br and Hunter J (2014) Scientific
uncertainty and climate change: Part i.,
uncertainty and unabated emissions,
Climatic Change 124: 21–37, doi:10.1007/
s10584-014-1082-7.

Page 67ClimateCounCil.org.au
RefeRences
lin BB, Khoo BY, inman m, Wang CH,
tapsuwan S and Wang X (2014)
assessing inundation damage and
timing of adaptation: sea level rise
and the complexities of land use in
coastal communities. Mitigation and
Adaptation Strategies for Global Change
15(5): 551-568.
lin n, emanuel K, oppenheimer m and
Vanmarcke e (2012) Physically based
assessment of hurricane surge threat
under climate change. Nature Climate
Change 2(6): 462–467.
lovelock Ce, Skilleter g and Saintilan n
(2012) tidal wetlands. in: marine Climate
Change impacts and adaptation report
Card for australia 2012. Poloczanska
eS, Hobday aJ and richardson
aJ (eds). accessed at http://www.
oceanclimatechange.org.au/content/
index.php/2012/report_card_extended/
category/tidal_wetlands.
manson FJ, loneragan nr, Harch
BD, Skilleter ga and Williams l
(2005) a broad-scale analysis of links
between coastal fisheries production
and mangrove extent: a case-study
for northeastern australia. Fisheries
Research 74: 69–85.
mapstone B, appleford P, Broderick
K, Connolly r, Higgins J, Hobday a,
Hughes t, marshall P, mcDonald J,
Waschka m (2010) national Climate
Change adaptation research Plan for
marine Biodiversity and resources,
national Climate Change adaptation
research Facility, gold Coast, pp.68.
matthäus W (1972) on the history of
recording tide gauges. Proceedings of
the royal Society of edinburgh. Section
B. Biology 73: 26–34.
mcarthur lC and Boland JW (2006) the
economic contribution of seagrass to
secondary production in South australia.
Ecological Modelling 196: 163–172.
mcDonald r and redford r (2008) rising
Waters: an assessment of the economic
and Social impacts of the 2007 June
long Weekend—Pasha Bulker Storm.
Hunter river research Foundation, nSW.
mcleod e, Chmura gl, Bouillon S,
Salm r, Bjork m, Duarte Cm, lovelock
Ce, Schlesinger WH and Silliman Br
(2011) a blueprint for blue carbon:
toward an improved understanding of
the role of vegetated coastal habitats in
sequestering Co2. Frontiers in Ecology
and the Environment 9: 552–560.
mcmichael C, Barnett J and mcmichael
aJ (2012) an ill Wind? Climate Change,
migration, and Health. Environmental
Health Perspective 120: 646–654.
mcnamara Ke, Smithers Sg, Westoby
r and Parnell K (2012) limits to climate
change adaptation for low-lying
communities in the torres Strait,
national Climate Change adaptation
research Facility, gold Coast, p.87.
meinshausen m, meinshausen n,
Hare W, raper SC, Frieler K, Knutti
r, Frame DJ and allen mr (2009)
greenhouse-gas emission targets
for limiting global warming to 2°C
Nature 458(7242): 1158–1162.
mulrennan me and Woodroffe CD
(1998) Saltwater intrusion into the
coastal plains of the lower mary river,
northern territory, australia. Journal of
Environmental Management 54, 169–188.

Page 68
COUNTING THE COSTS: CLIMATE CHANGE AND COASTAL FLOODING
ClimateCounCil.org.au
myers n (2002) environmental refugees:
a growing phenomenon of the 21st
century. Philosophical transactions of
the royal Society of london. Series B:
Biological Sciences 357: 609–613.
nCCoe (national Committee on
Costal and ocean engineering) (2012a)
Climate Change adaptation guidelines
in Coastal management and Planning.
engineers australia. accessed at http://
www.engineersaustralia.org.au/sites/
default/files/shado/learned%20groups/
national%20Committees%20and%20
Panels/Coastal%20and%20ocean%20
engineering/climate_change
_adaptation_guidelines.pdf.
nCCoe (2012b) Coastal engineering
guidelines for working with the australia
coast in an ecologically sustainable way.
engineers australia. accessed at http://
www.engineersaustralia.org.au/sites/
default/files/shado/learned%20groups/
national%20Committees%20and%20
Panels/Coastal%20and%20ocean%20
engineering/coastal_engineering_
guidelinesecologicallysustainable.pdf.
nCCoe (2012c) guidelines for
responding to the effects of
Climate Change in Coastal and
ocean engineering. engineers
australia. accessed at http://www.
engineersaustralia.org.au/sites/default/
files/shado/learned%20groups/
national%20Committees%20and%20
Panels/Coastal%20and%20ocean%20
engineering/vol_1_web.pdf.
nicholls rJ and tol rSJ (2006) impacts
and responses to sea-level rise: a global
analysis of the SreS scenarios over
the twenty-first century. Philosophical
transactions of the royal Society a:
Mathematical, Physical and Engineering
Sciences 364(1841): 1073–1095.
nicholls rJ, Wong PP, Burkett Vr,
Codignotto Jo, Hay Je, mclean rF,
ragoonaden S and Woodroffe CD
(2007) Coastal systems and low-
lying areas. Climate Change 2007:
impacts, adaptation and Vulnerability.
Contribution of Working group ii to
the Fourth assessment report of the
intergovernmental Panel on Climate
Change [Parry ml, Canziani oF, Palutikof
JP, van der linden PJ and Hanson Ce
(eds.)]. Cambridge university Press,
Cambridge, uK, 315–356.
nicholls rJ, marinova n, lowe Ja,
Brown S, Vellinga P, De gusmão D,
Hinkel J and tol rSJ (2011) Sea-level rise
and its possible impacts given a ‘beyond
4°C world’ in the twenty-first century.
Philosophical transactions of the royal
Society a: Mathematical Physical and
Engineering Sciences 369: 161–181.
noaa (national oceanic and
atmospheric administration) (2013)
Service assessment: Hurricane/Post-
tropical Cyclone Sandy october 22–29,
2012. uS Department of Commerce and
noaa, may 2013. accessed at http://
www.nws.noaa.gov/os/assessments/
pdfs/Sandy13.pdf.
noC (natural oceanography Centre)
(2014) Permanent Service for mean Sea
level. accessed at http://www.psmsl.org/.
northern territory government
(2005) Disaster relief activated for
Cyclone ingrid Damage. media
release. accessed at http://www.
territorystories.nt.gov.au/bitstream/
handle/10070/77428/20050402_
SydCycloneingridnDra.
pdf?sequence=2&isallowed=y.

Page 69ClimateCounCil.org.au
RefeRences
nurse l, mclean r, agard J, Briguglio
lP, Duvat V, Pelesikoti n, tompkins e,
Webb a (2014) Small islands. in: Climate
Change 2014: impacts, adaptation, and
Vulnerability. Part B: regional aspects.
Contribution of Working group ii to
the Fifth assessment report of the
intergovernmental Panel on Climate
Change Small islands. in: Climate
Change 2014: impacts, adaptation, and
Vulnerability. Part B: regional aspects.
Contribution of Working group ii to
the Fifth assessment report of the
intergovernmental Panel on Climate
Change [Barros Vr, Field CB, Dokken
DJ, mastrandrea mD, mach KJ, Bilir
te, Chatterjee m, ebi Kl, estrada Yo,
genova rC, girma B, Kissel eS, levy
an, macCracken S, mastrandrea Pr and
White ll (eds)]. Cambridge university
Press, Cambridge, united Kingdom and
new York, nY, uSa, pp. XXX-YYY.
Park Se, marshall na, Jakku e, Dowd am,
Howden Sm, mendham e and Fleming
a (2012) informing adaptation responses
to climate change through theories of
transformation. Global Environmental
Change 22: 115–126.
Pham tD, Simmons Dg and Spurr
r (2010) Climate change-induced
economic impacts on tourism
destinations: the case of australia.
Journal of Sustainable Tourism 18:
449–473.
Pollard PC and greenway m (2013)
Seagrasses in tropical australia,
productive and abundant for decades
decimated overnight. Journal of
Biosciences 38: 157–166.
Preston-thomas a, gair rW, Hosking
Ka, Devine gJ and Donohue SD
(2012). an outbreak of Plasmodium
falciparum malaria in the torres Strait.
Communicable diseases intelligence
quarterly report 36: e180–185.
Pugh D and Woodworth P (2014)
Sea-level Science. Cambridge university
Press, Cambridge, u.K.
Queensland government (2005)
Disaster relief Funding activated
Following Cyclone ingrid. Queensland
Disaster management. accessed at:
http://www.disaster.qld.gov.au/news/
view.asp?id=1024.
Queensland Floods Commission of
inquiry (2011) interim report. accessed
at http://www.floodcommission.qld.gov.
au/__data/assets/pdf_file/0006/8781/
QFCi-interim-report-august-2011.pdf.
Queensland government (2011)
State Budget 2011–12: budget strategy
outlook. accessed at http://www.budget.
qld.gov.au/budget-papers/2011-12/bp2-
2011-12.pdf.
rambaldi an, Cameron SF, Collins K and
mcallister rJr (2013) Housing shadow
prices in an inundation-prone suburb.
Urban Studies 50(9): 1889–1905.
ray rD and Douglas BC (2011)
experiments in reconstructing
twentieth-century sea levels. Progress
in Oceanography 91: 495–515.
rBP (risky Business Project) (2014) risky
Business: the economic risks of Climate
Change in the united States. a Climate
risk assessment for the united States.
Co-chairs: Bloomberg mr, Paulson,
Jnr. Hm and Steyer tF. accessed at
http://riskybusiness.org/uploads/files/
riskyBusiness_report_WeB_7_22_14.pdf.

Page 70
COUNTING THE COSTS: CLIMATE CHANGE AND COASTAL FLOODING
ClimateCounCil.org.au
reisinger a, lawrence J, Hart g,
Chapman r (2014) From coping to
resilience: the role of managed retreat
in highly developed coastal regions. in:
Climate Change and the Coast: Building
resilient Communities. glavovic B, Kaye
r, Kelly m, travers a (eds). CrC Press,
london, uK.
rhein m, rintoul Sr, aoki S, Campos e,
Chambers D, Feely ra, gulev S, Johnson
gC, Josey Sa, Kostianoy a, mauritzen
C, roemmich D, talley lD and Wang F
(2013) observations: ocean. in: Climate
Change 2013: the Physical Science
Basis. Contribution of Working group
i to the Fifth assessment report of the
intergovernmental Panel on Climate
Change [Stocker tF, Qin D, Plattner
g-K, tignor m, allen SK, Boschung J,
nauels a, Xia Y, Bex V and midgley Pm
(eds.)]. Cambridge university Press,
Cambridge, united Kingdom and new
York, nY, uSa, pp. 255–316, doi:10.1017/
CBo9781107415324.010.
rignot e, mouginot J, morlighem m,
Seroussi H, Scheuchi B (2014) Widespread
rapid grounding line retreat of Pine
island, thwaites, Smith, and Kohler
glaciers, West antarctica, from 1992 to
2011 geophysical research letters 41:
3502–3509.
rogers K, Saintilan n, Howe aJ and
rodriguez JF (2013) Sedimentation,
elevation and marsh evolution in a
south-eastern australian estuary during
changing climatic conditions. Estuarine
Coastal and Shelf Science 133: 172–181.
rogers K, Saintilan n and Copeland C
(2014) managed retreat of Saline Coastal
Wetlands: Challenges and opportunities
identified from the Hunter river estuary,
australia. estuaries and Coasts 37: 67–78.
ruhanen l and Shakeela a (2013)
responding to Climate Change:
australian tourism industry Perspectives
on Current Challenges and Future
Directions. Asia Pacific Journal of
Tourism Research 18: 35–51.
Saintilan n and rogers K (2013)
the significance and vulnerability
of australian saltmarshes: implications
for management in a changing
climate. Marine and Freshwater
Research 64: 66–79.
Saunders mi, leon J, Phinn Sr,
Callaghan DP, o’Brien Kr, roelfsema
Cm, lovelock Ce, lyons mB and mumby
PJ (2013) Coastal retreat and improved
water quality mitigate losses of seagrass
from sea level rise. Global Change
Biology 19: 2569–2583.
Serrao-neumann S, Crick F, Harman B,
Sano m, Sahin o, Staden r, Schuch g,
Baum S, low Choy D (2013) improving
cross-sectoral climate change adaptation
for coastal settlements: insights from
South east Queensland, australia.
regional environmental Change,
advance online, doi: 10.1007/s10113
-013-0442-6.
Sheaves m, Brookes J, Coles r, Freckelton
m, groves P, Johnston r and Winberg
P (2014) repair and revitalisation of
australia’s tropical estuaries and coastal
wetlands: opportunities and constraints
for the reinstatement of lost function and
productivity. Marine Policy 47: 23–38.
Spalding mD, mcivor al, Beck mW,
Koch eW, moller i, reed DJ, rubinoff P,
Spencer t, tolhurst tJ, Wamsley tV,
van Wesenbeeck BK, Wolanski e and
Standing Committee on Climate Change,
Water, environment and the arts
(SCCCWea) (2009) managing our coastal
zone in a changing climate. House
Page 71ClimateCounCil.org.au
RefeRences
of representatives: Parliament of the
Commonwealth of australia. accessed at
http://www.aph.gov.au/parliamentary_
business/committees/house_of_
representatives_committees?url=ccwea/
coastalzone/report.htm.
Spalding mD, mcivor al, Beck mW, Koch
e, moller i, reed D, robinoff P, Spencer t,
tolhurst t, Wamsley t, van Wesenbeeck
B, Wolanski e and Woodroffe C (2014).
Coastal ecosystems: a Critical element
of risk reduction. Conservation,
Letters 7: 293–301.
Standing Committee on Climate
Change, Water, environment and the
arts (SCCCWea) (2009) managing
out coastal zone in a changing
climate. House of representatives:
Parliament of the Commonwealth of
australia. accessed at: http://www.
aph.gov.au/parliamentary_business/
committees/house_of_representatives_
committees?url=ccwea/coastalzone/
report.htm.
Stern n (2007) Standing Committee on
Climate Change, Water, environment
and the arts (SCCCWea) (2009)
managing out coastal zone in a changing
climate. House of representatives:
Parliament of the Commonwealth of
australia. accessed at: http://www.
aph.gov.au/parliamentary_business/
committees/house_of_representatives_
committees?url=ccwea/
Sullivan K (2009) Submission to
Standing Committee on Climate
Change, Water, environment and
the arts. the insurance Council of
australia. accessed at http://www.
aph.gov.au/parliamentary_business/
committees/house_of_representatives_
committees?url=ccwea/coastalzone/
subs.htm.
Suppiah r, Bathols J, Collier m, Kent
D and o’grady J (2010) observed and
future climates of the torres Strait
region. CSiro, marine and atmospheric
research. report to the torres Strait
regional authority, p.66.
tasmanian Climate Change office (2012)
Derivation of the tasmanian Sea level
rise Planning allowances. accessed at
http://www.dpac.tas.gov.au/divisions/
climatechange/adapting/new_tools_to_
improve_planning_for_sea_level_rise_
and_coastal_hazards/planning_for_sea_
level_rise_and_coastal_hazards).
tollefson J (2013) “new York vs the Sea.”
Nature 494 (7436), 163–164.
tourism research australia (2013)
gold Coast Visitor Profile and
Satisfaction report. accessed at http://
www.tra.gov.au/documents/vps/gold_
Coast_Visitor_Profile_and_Satisfaction_
report_nov2013_Final2.pdf.
tourism research australia (2014)
tourism ready reckoner. accessed
at http://www.tra.gov.au/documents/
ready_reckoner_DecQtr2013_
Final_09052014.pdf.
traill lW, Bradshaw CJa, Delean S and
Brook BW (2010) Wetland conservation
and sustainable use under global change:
a tropical australian case study using
magpie geese. ecography 33: 818–825.
tremblay P (2007) economic
contribution of Kakadu national Park to
tourism in the northern territory. CrC
for Sustainable tourism. accessed at
http://www.crctourism.com.au/wms/
upload/images/disc%20of%20images%20
and%20pdfs/for%20bookshop/
documents/tremblay_KakadunP.pdf.

Page 72
COUNTING THE COSTS: CLIMATE CHANGE AND COASTAL FLOODING
ClimateCounCil.org.au
tSra (torres Strait regional authority)
(2008) Submission to the House of
representative Standing Committee
on Climate Change, Water, environment
& the arts. Climate Change in the torres
Strait and the impact on indigenous
peoples. accessed at http://www.
aph.gov.au/Parliamentary_Business/
Committees/House_of_representatives_
Committees?url=ccwea/coastalzone/
subs.htm.
tSra (2010). torres Strait Climate Change
Strategy 2010–2013. report prepared
by the environmental management
Program, torres Strait regional
authority, may 2010, p20. accessed at
http://www.tsra.gov.au/__data/assets/
pdf_file/0020/1775/tS-Climate-Change-
Strategy-2010–2013.pdf.
Valiela i, Kinney e, Bulbertson J, Peacock
e and Smith S (2009) global losses of
mangroves and salt marshes. in: global
loss of Coastal Habitats: rates, Causes
and Consequences. Duarte Cm (ed).
pp. 107–138.
van Vuuren DP, edmonds J, Kainuma m,
Keywan riahi K, thomson a, Hibbard K,
Hurtt gC, Kram t, Krey V, lamarque JF,
masui t, meinshausen m, nakicenovic
n, Smith SJ and rose SK (2011) the
representative concentration pathways:
an overview. Climatic Change, 109:
5–31, doi:10.1007/s10584-011-0148-z.
Verdon-Kidd D, Kiem aS, Willgoose g
and Haines P (2010) east Coast lows
and the newcastle/Central Coast
Pasha Bulker storm, national Climate
Change adaptation research Facility,
gold Coast, p.61.
Verschuuren J, and mcDonald J (2012)
towards a legal framework for coastal
adaptation: assessing the first steps in
europe and australia. Transnational
Environmental Law 1(2): 355–379.
Wang X, Stafford Smith m, mcallister
rrJ, leitch a, mcFallan S and meharg S
(2010) Coastal inundation under climate
change: a case study in South east
Queensland. CSiro Climate adaptation
Flagship Working paper no. 6. accessed
at http://www.csiro.au/resources/
CaF-working-papers.html.
Waycott m, Duarte Cm, Carruthers tJB,
orth rJ, Dennison WC, olyarnik S,
Calladine a, Fourqurean JW, Heck Jr Kl,
Hughes ar, Kendrick ga, Kenworthy
WJ, Short Ft and Williams Sl (2009)
accelerating loss of seagrasses across
the globe threatens coastal ecosystems.
Proceedings of the national academy
of Sciences 106: 12377–12381.
Werner ad and lockington Da (2006)
tidal impacts on riparian salinities
near estuaries. Journal of Hydrology,
328: 511–522.
White nJ, Haigh iD, Church Ja, Koen
t, Watson CS, Pritchard tr, Watson PJ,
Burgette rJ, mcinnes Kl, You Z-J, Zhang
X and tregoning P (2014) australian
sea levels—trends, regional variability
and influencing factors, Earth Science
Reviews 136: 155–174, doi:10.1016/j.
earscirev.2014.05.011.
Williamson g.t, Boggs gS and Bowman
D (2011) late 20th century mangrove
encroachment in the coastal australian
monsoon tropics parallels the regional
increase in woody biomass. Regional
Environmental Change 11: 19–27.

Page 73ClimateCounCil.org.au
RefeRences
Winn Ko, Saynor mJ, eliot mJ and
eliot i (2006) Saltwater intrusion and
morphological change at the mouth
of the east alligator river, northern
territory. Journal of Coastal Research 22:
137–149.
Wise r m, Fazey i, Stafford Smith
m, Park Se, eakin HC, archer Van
garderen erm and Campbell B (2014)
reconceptualising adaptation to climate
change as part of pathways of change
and response. Global Environmental
Change 28 in press.
Wong PP, losada iJ, gattuso J-P, Hinkel
J, Khattabi a, mcinnes Kl, Saito Y and
Sallenger a (2014) Coastal systems
and low-lying areas. in: Climate
Change 2014: impacts, adaptation, and
Vulnerability. Part a: global and Sectoral
aspects. Contribution of Working group
ii to the Fifth assessment report of the
intergovernmental Panel on Climate
Change [Field CB, Barros Vr, Dokken
DJ, mach KJ, mastrandrea mD, Bilir
te, Chatterjee m, ebi Kl, estrada Yo,
genova rC, girma B, Kissel eS, levy
an, macCracken S, mastrandrea Pr and
White ll (eds.)]. Cambridge university
Press, Cambridge, united Kingdom and
new York, nY, uSa, pp. XXX-YYY.
Woodroffe CD and Webster Jm (2014)
Coral reefs and sea-level change.
Marine Geology 352, 248–267.
Zhang K, Douglas BC and leatherman
SP (2004) global warming and coastal
erosion. Climatic Change 64: 41–58.

IMAGE CREDITS:Cover photo: Figure 18 “Seawater overflowing a protective sea wall on Sabai, torres Strait islands” David Hanslow tSra.
Section 1 cover photo: King tide floods the footbridge under thrower Bridge on Currumbin Creek, Queensland by Flickr user Witness King tides licensed under CC by -nC-Sa 2.0
Section 2 cover photo: Pine island glacier rift from landsat, Western antarctica by Flickr user naSa goddard Space Flight Centre licensed under CC by 2.0.
Section 3 cover photo: Figure 12 “an example of damage to a road from coastal flooding at mission Beach in Queensland” by Flickr user Paul toogood licensed under CC by 2.0.
Section 4 cover photo: Figure 17 “Coastal erosion on the gold Coast” by Flickr user HolidayPointau licensed under CC by-nC 2.0.
Section 5 cover photo: Figure 1 “an example of coastal recession at Broadbeach Queensland” by Flickr user Simon morris licensed under CC by 2.0.
--------------------------------------------
Page 2: Figure 1 “an example of coastal recession at Broadbeach Queensland” by Flickr user Simon morris licensed under CC by 2.0.
Page 24: Figure 12 “an example of damage to a road from coastal flooding at mission Beach in Queensland” by Flickr user Paul toogood licensed under CC by 2.0.
Page 28: Figure 13 “Danger Zone map” from tollefson J (2013) “new York vs the Sea.” nature 494 (7436), 163–164.
Page 36: Figure 15 “dugongs” by Flickr user Frank gloystein licensed under CC by -nC-nD 2.0.
Page 38: Figure 16 “mangroves” by Flickr user sunphlo licensed under CC by -nC-nD 2.0.
Page 41: Figure 17 “Coastal erosion on the gold Coast” by Flickr user HolidayPointau licensed under CC by-nC 2.0.
Page 43: Figure 18 “Seawater overflowing a protective sea wall on Sabai, torres Strait islands” David Hanslow tSra.
Page 47: Figure 20 “Visual artists depict the impact of rising sea levels” John Boyd macDonald (Humpback fight. 2013) and Heike Qualitz (Contemplating adaptation. 2013).
Page 56: Figure 23 “Brisbane airport runway” by Brisbane airport Corporation.