Count Vehicle Over Region of Interest Using Euclidean Distance
6
International Research Journal of Computer Science (IRJCS) ISSN: 2393-9842 Issue 05, Volume 3 (May 2016) www.irjcs.com _________________________________________________________________________________________________ IRJCS: Impact Factor Value - Scientific Journal High Impact Factor value for 2014= 2.023 © 2014-16, IRJCS- All Rights Reserved Page -9 Count Vehicle Over Region of Interest Using Euclidean Distance Bagus Priambodo Nur Ani Information System University of Mercu Buana Information System University of Mercu Buana Abstract— This paper propose a system to calculate the vehicle from video file. Vehicles will be calculated when passing through a Region Of Interest that has been set by the user. Calculation of the vehicle obtained by calculating the number of pixels that differ between frames. Pixel difference between frames is obtained by calculating RGB value using euclidean distance. Experiment results show that system able to count vehicle using euclidean distance method. Keywords— Count Vehicle, Euclidean Distance, Image Similarity I. INTRODUCTION To minimize human error, computer can be used to count the number of vehicles passing through the toll gate. Utilization of information technology especially in the field of computer vision can be used to count the number of vehicles. In this research as shown at fig 1. There are two gate so we need to set ROI (Region Of Interest) based on user interest. Vehicle that move over ROI will be count. This paper propose simple method to count vehicle, rather using powerful image recognition technique such as SVM, LDA or PCA. There are practice method to check similarity between frame image such as gabor feature[10], wavelet feature, color histogram and euclidean distance of image. Fig 1. Toll Gate with vehicle Euclidean distance are chose because its easy and fast to implement. But using this method the system can't recognice type of vehicle, and of course system can't diference between vehicle or cat. Because this method only check similar pixel in ROI between frame. Also there is problem when system run at day or night. Image will be more dark at night and more bright at day. So the system need to have a threshold. How many pixel similar in ROI are set as an input threshold of tolerence difference pixel from user. To adjust system accuracy for detecting similar image. In what follows, we will discuss some related work in section 2. In section 3,4 we will give an overview to bitmap pixel and euclidean distance. In section 5, we will explain about the methodology of research, in section 6, we will explain about the experiment and result. and finally in section 7, we will conclude the paper. II. RELATED WORK There are many research in image similarity. Structure similarity using wavelet[12], image similarity through rangking using Passive-Aggresive with generarly deformable model, image similarity based on perseptual user[8], also learning similarity from relevance feedback[11], texture feature using gabor, and using euclidean distance[9].
-
Upload
irjcs-journal-division -
Category
Travel
-
view
35 -
download
2
Transcript of Count Vehicle Over Region of Interest Using Euclidean Distance
International Research Journal of Computer Science (IRJCS) ISSN: 2393-9842 Issue 05, Volume 3 (May 2016) www.irjcs.com
_________________________________________________________________________________________________ IRJCS: Impact Factor Value - Scientific Journal High Impact Factor value for 2014= 2.023
© 2014-16, IRJCS- All Rights Reserved Page -9
Count Vehicle Over Region of Interest Using Euclidean Distance
Bagus Priambodo Nur Ani Information System University of Mercu Buana Information System University of Mercu Buana Abstract— This paper propose a system to calculate the vehicle from video file. Vehicles will be calculated when passing through a Region Of Interest that has been set by the user. Calculation of the vehicle obtained by calculating the number of pixels that differ between frames. Pixel difference between frames is obtained by calculating RGB value using euclidean distance. Experiment results show that system able to count vehicle using euclidean distance method.
Keywords— Count Vehicle, Euclidean Distance, Image Similarity
I. INTRODUCTION
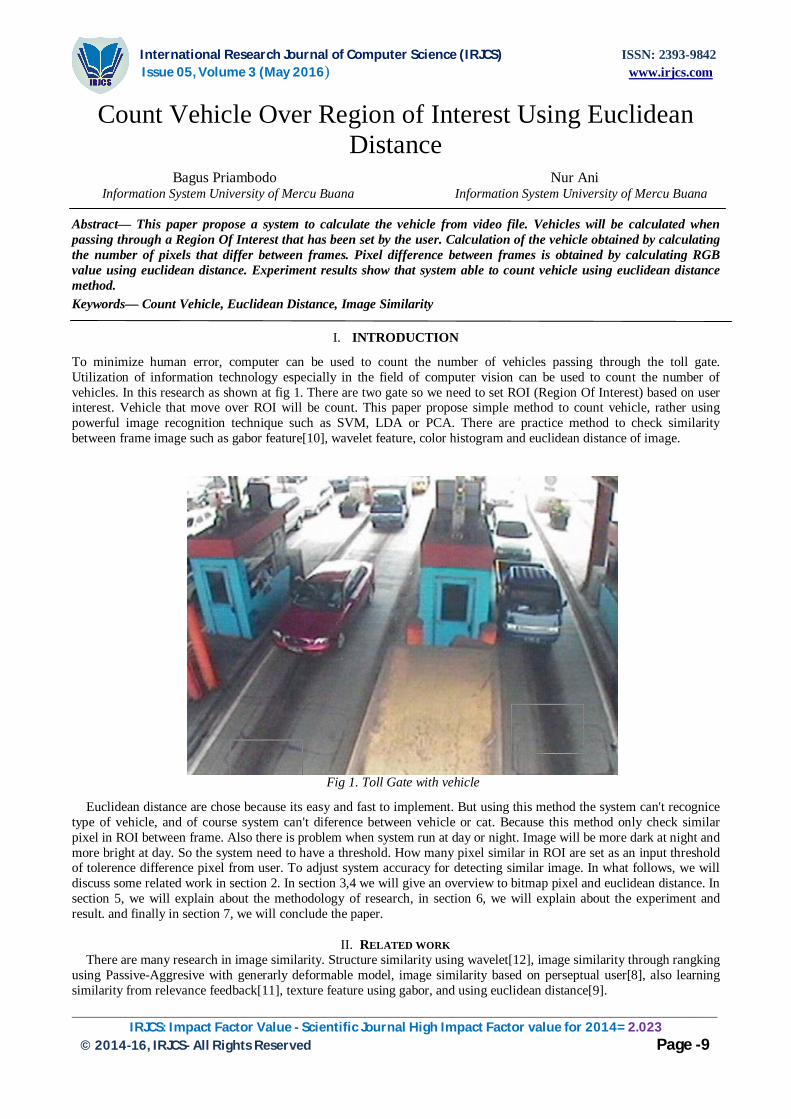
To minimize human error, computer can be used to count the number of vehicles passing through the toll gate. Utilization of information technology especially in the field of computer vision can be used to count the number of vehicles. In this research as shown at fig 1. There are two gate so we need to set ROI (Region Of Interest) based on user interest. Vehicle that move over ROI will be count. This paper propose simple method to count vehicle, rather using powerful image recognition technique such as SVM, LDA or PCA. There are practice method to check similarity between frame image such as gabor feature[10], wavelet feature, color histogram and euclidean distance of image.
Fig 1. Toll Gate with vehicle
Euclidean distance are chose because its easy and fast to implement. But using this method the system can't recognice type of vehicle, and of course system can't diference between vehicle or cat. Because this method only check similar pixel in ROI between frame. Also there is problem when system run at day or night. Image will be more dark at night and more bright at day. So the system need to have a threshold. How many pixel similar in ROI are set as an input threshold of tolerence difference pixel from user. To adjust system accuracy for detecting similar image. In what follows, we will discuss some related work in section 2. In section 3,4 we will give an overview to bitmap pixel and euclidean distance. In section 5, we will explain about the methodology of research, in section 6, we will explain about the experiment and result. and finally in section 7, we will conclude the paper.
II. RELATED WORK
There are many research in image similarity. Structure similarity using wavelet[12], image similarity through rangking using Passive-Aggresive with generarly deformable model, image similarity based on perseptual user[8], also learning similarity from relevance feedback[11], texture feature using gabor, and using euclidean distance[9].
International Research Journal of Computer Science (IRJCS) ISSN: 2393-9842 Issue 05, Volume 3 (May 2016) www.irjcs.com
_________________________________________________________________________________________________ IRJCS: Impact Factor Value - Scientific Journal High Impact Factor value for 2014= 2.023
© 2014-16, IRJCS- All Rights Reserved Page -10
Also there are many researches to count vehicle or traffic. Count vehicle from multiple occlusion using general deformable model of vehicle[2], vehicle recognition from axle truck using viola jones[3]. Also count and tracking can use background subtraction method, feature based, frame differencing [4], classification vehicle using deformable object method[6]. Gabor feature have better performance than wavelet and euclidean distance in check similarity between image[10], gabor feature 74 % and euclidean distance 73% in retrieval performance. This paper tries to use euclidean distance and differencing frame to count vehicle in ROI.
III. BITMAP DIMENSIONS
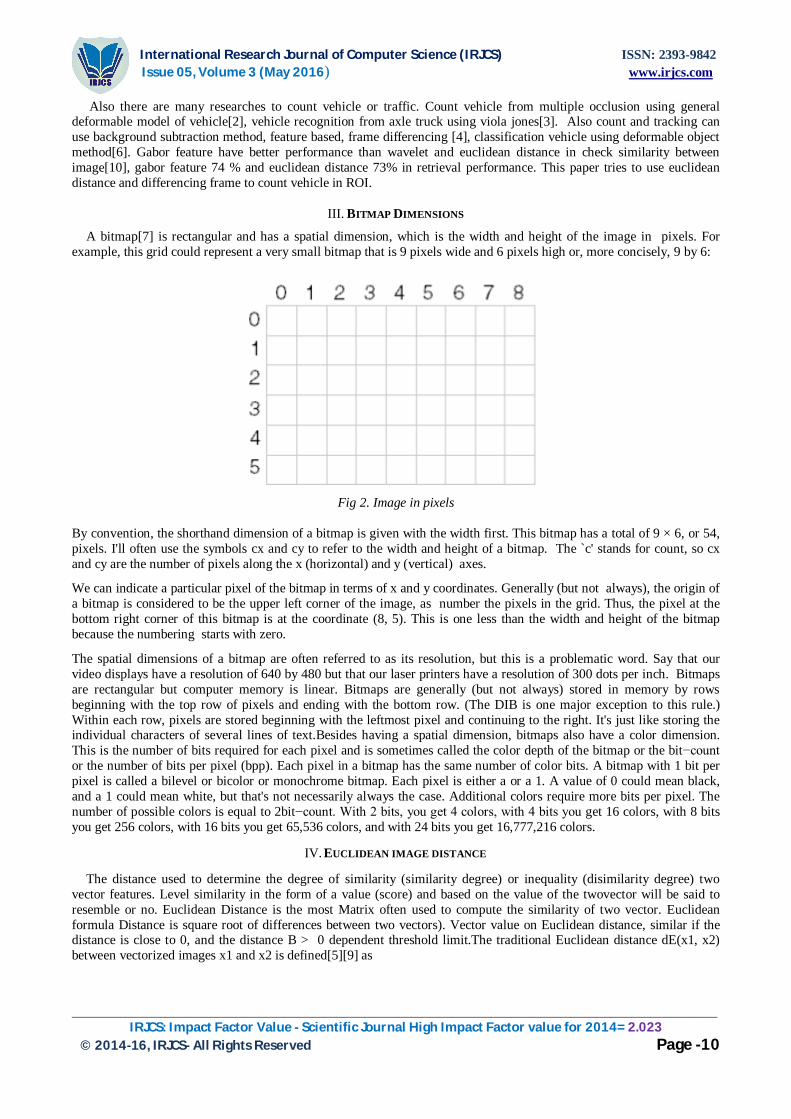
A bitmap[7] is rectangular and has a spatial dimension, which is the width and height of the image in pixels. For example, this grid could represent a very small bitmap that is 9 pixels wide and 6 pixels high or, more concisely, 9 by 6:
Fig 2. Image in pixels
By convention, the shorthand dimension of a bitmap is given with the width first. This bitmap has a total of 9 × 6, or 54, pixels. I'll often use the symbols cx and cy to refer to the width and height of a bitmap. The `c' stands for count, so cx and cy are the number of pixels along the x (horizontal) and y (vertical) axes.
We can indicate a particular pixel of the bitmap in terms of x and y coordinates. Generally (but not always), the origin of a bitmap is considered to be the upper left corner of the image, as number the pixels in the grid. Thus, the pixel at the bottom right corner of this bitmap is at the coordinate (8, 5). This is one less than the width and height of the bitmap because the numbering starts with zero.
The spatial dimensions of a bitmap are often referred to as its resolution, but this is a problematic word. Say that our video displays have a resolution of 640 by 480 but that our laser printers have a resolution of 300 dots per inch. Bitmaps are rectangular but computer memory is linear. Bitmaps are generally (but not always) stored in memory by rows beginning with the top row of pixels and ending with the bottom row. (The DIB is one major exception to this rule.) Within each row, pixels are stored beginning with the leftmost pixel and continuing to the right. It's just like storing the individual characters of several lines of text.Besides having a spatial dimension, bitmaps also have a color dimension. This is the number of bits required for each pixel and is sometimes called the color depth of the bitmap or the bit−count or the number of bits per pixel (bpp). Each pixel in a bitmap has the same number of color bits. A bitmap with 1 bit per pixel is called a bilevel or bicolor or monochrome bitmap. Each pixel is either a or a 1. A value of 0 could mean black, and a 1 could mean white, but that's not necessarily always the case. Additional colors require more bits per pixel. The number of possible colors is equal to 2bit−count. With 2 bits, you get 4 colors, with 4 bits you get 16 colors, with 8 bits you get 256 colors, with 16 bits you get 65,536 colors, and with 24 bits you get 16,777,216 colors.
IV. EUCLIDEAN IMAGE DISTANCE
The distance used to determine the degree of similarity (similarity degree) or inequality (disimilarity degree) two
vector features. Level similarity in the form of a value (score) and based on the value of the twovector will be said to resemble or no. Euclidean Distance is the most Matrix often used to compute the similarity of two vector. Euclidean formula Distance is square root of differences between two vectors). Vector value on Euclidean distance, similar if the distance is close to 0, and the distance B > 0 dependent threshold limit.The traditional Euclidean distance dE(x1, x2) between vectorized images x1 and x2 is defined[5][9] as
International Research Journal of Computer Science (IRJCS) ISSN: 2393-9842 Issue 05, Volume 3 (May 2016) www.irjcs.com
_________________________________________________________________________________________________ IRJCS: Impact Factor Value - Scientific Journal High Impact Factor value for 2014= 2.023
© 2014-16, IRJCS- All Rights Reserved Page -11
example There is two vector as follow : A= [1, 3, 5, 7] B = [15, 12, 10, 9] Euclidean distance from vector A and vector B is :
dab=√(1− 15)2+(3− 12)2+(5− 10)2+(7− 9)2
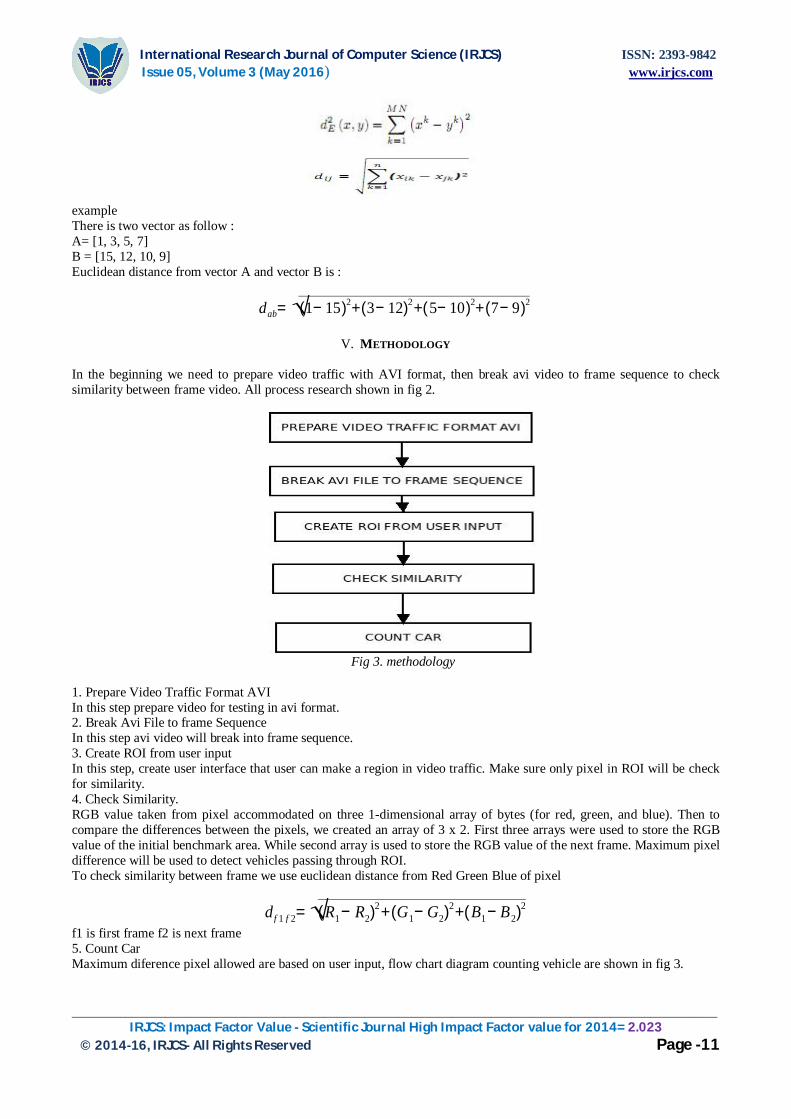
V. METHODOLOGY
In the beginning we need to prepare video traffic with AVI format, then break avi video to frame sequence to check similarity between frame video. All process research shown in fig 2.
Fig 3. methodology
1. Prepare Video Traffic Format AVI In this step prepare video for testing in avi format. 2. Break Avi File to frame Sequence In this step avi video will break into frame sequence. 3. Create ROI from user input In this step, create user interface that user can make a region in video traffic. Make sure only pixel in ROI will be check for similarity. 4. Check Similarity. RGB value taken from pixel accommodated on three 1-dimensional array of bytes (for red, green, and blue). Then to compare the differences between the pixels, we created an array of 3 x 2. First three arrays were used to store the RGB value of the initial benchmark area. While second array is used to store the RGB value of the next frame. Maximum pixel difference will be used to detect vehicles passing through ROI. To check similarity between frame we use euclidean distance from Red Green Blue of pixel
d f 1 f 2=√(R1− R2)2+(G1− G2)
2+(B1− B2)2
f1 is first frame f2 is next frame 5. Count Car Maximum diference pixel allowed are based on user input, flow chart diagram counting vehicle are shown in fig 3.
International Research Journal of Computer Science (IRJCS) ISSN: 2393-9842 Issue 05, Volume 3 (May 2016) www.irjcs.com
_________________________________________________________________________________________________ IRJCS: Impact Factor Value - Scientific Journal High Impact Factor value for 2014= 2.023
© 2014-16, IRJCS- All Rights Reserved Page -12
fig 4. Flow Chart Count Vehicle
VI. DISCUSSION
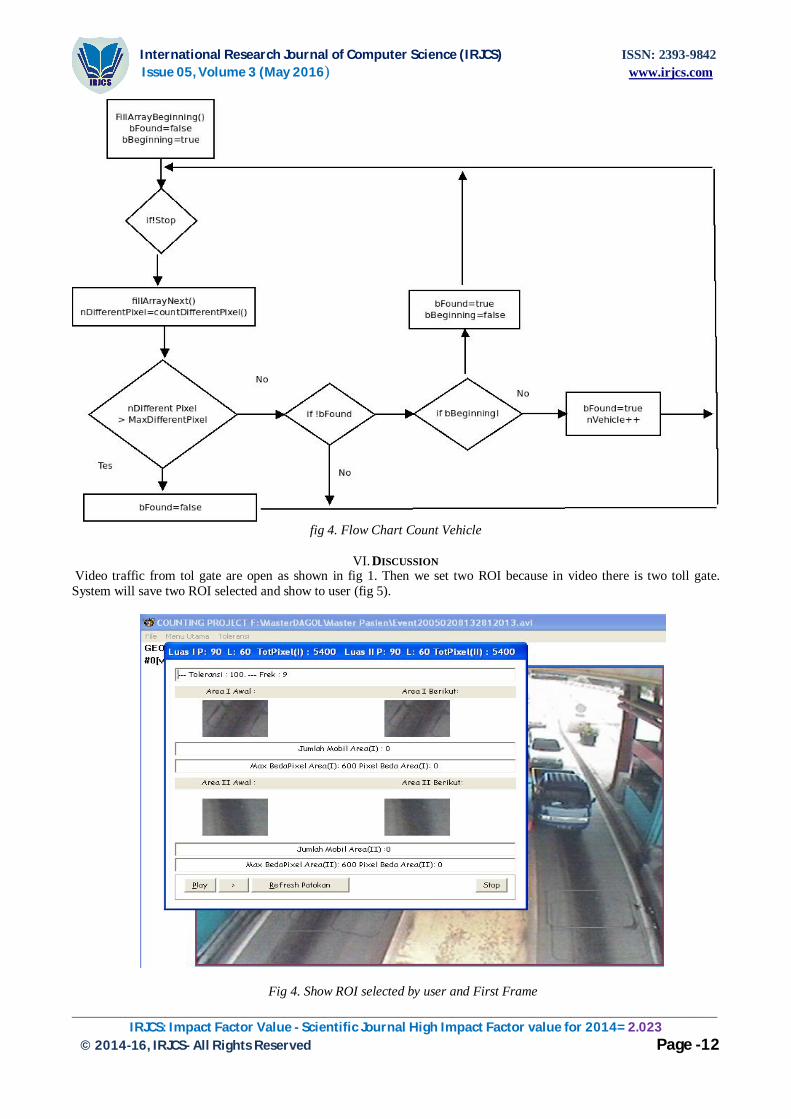
Video traffic from tol gate are open as shown in fig 1. Then we set two ROI because in video there is two toll gate. System will save two ROI selected and show to user (fig 5).
Fig 4. Show ROI selected by user and First Frame
International Research Journal of Computer Science (IRJCS) ISSN: 2393-9842 Issue 05, Volume 3 (May 2016) www.irjcs.com
_________________________________________________________________________________________________ IRJCS: Impact Factor Value - Scientific Journal High Impact Factor value for 2014= 2.023
© 2014-16, IRJCS- All Rights Reserved Page -13
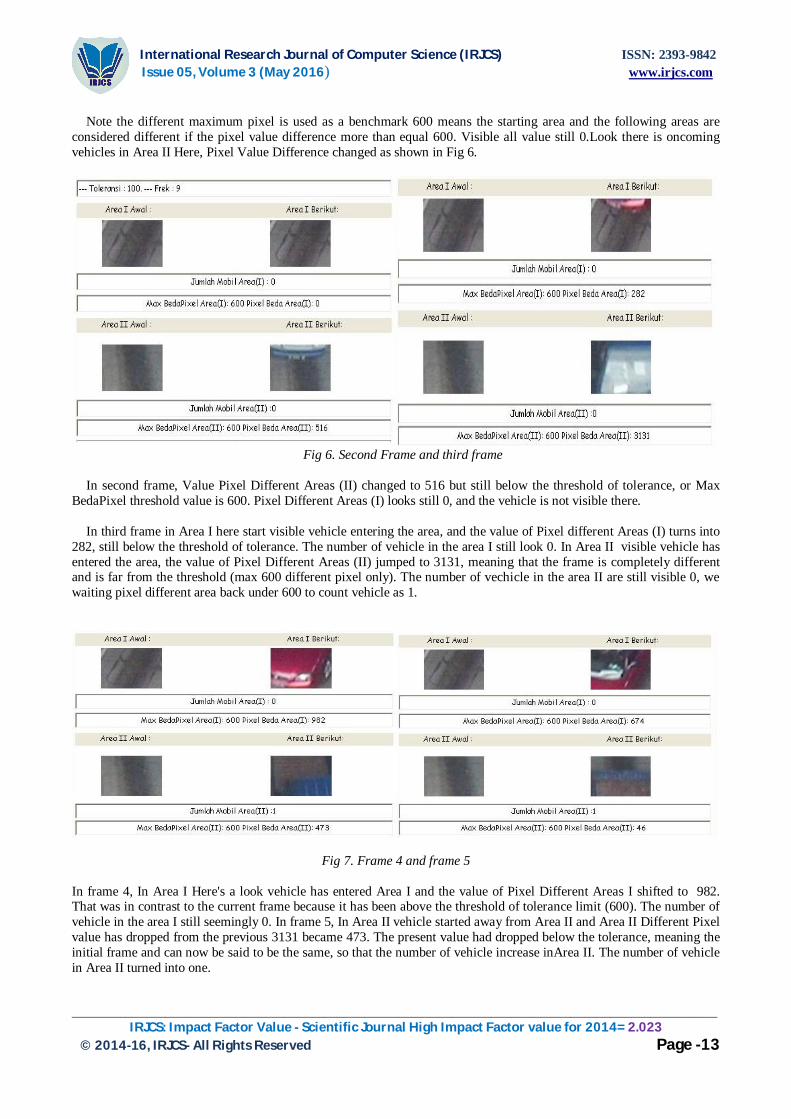
Note the different maximum pixel is used as a benchmark 600 means the starting area and the following areas are
considered different if the pixel value difference more than equal 600. Visible all value still 0.Look there is oncoming vehicles in Area II Here, Pixel Value Difference changed as shown in Fig 6.
Fig 6. Second Frame and third frame
In second frame, Value Pixel Different Areas (II) changed to 516 but still below the threshold of tolerance, or Max
BedaPixel threshold value is 600. Pixel Different Areas (I) looks still 0, and the vehicle is not visible there. In third frame in Area I here start visible vehicle entering the area, and the value of Pixel different Areas (I) turns into
282, still below the threshold of tolerance. The number of vehicle in the area I still look 0. In Area II visible vehicle has entered the area, the value of Pixel Different Areas (II) jumped to 3131, meaning that the frame is completely different and is far from the threshold (max 600 different pixel only). The number of vechicle in the area II are still visible 0, we waiting pixel different area back under 600 to count vehicle as 1.
Fig 7. Frame 4 and frame 5
In frame 4, In Area I Here's a look vehicle has entered Area I and the value of Pixel Different Areas I shifted to 982. That was in contrast to the current frame because it has been above the threshold of tolerance limit (600). The number of vehicle in the area I still seemingly 0. In frame 5, In Area II vehicle started away from Area II and Area II Different Pixel value has dropped from the previous 3131 became 473. The present value had dropped below the tolerance, meaning the initial frame and can now be said to be the same, so that the number of vehicle increase inArea II. The number of vehicle in Area II turned into one.
International Research Journal of Computer Science (IRJCS) ISSN: 2393-9842 Issue 05, Volume 3 (May 2016) www.irjcs.com
_________________________________________________________________________________________________ IRJCS: Impact Factor Value - Scientific Journal High Impact Factor value for 2014= 2.023
© 2014-16, IRJCS- All Rights Reserved Page -14
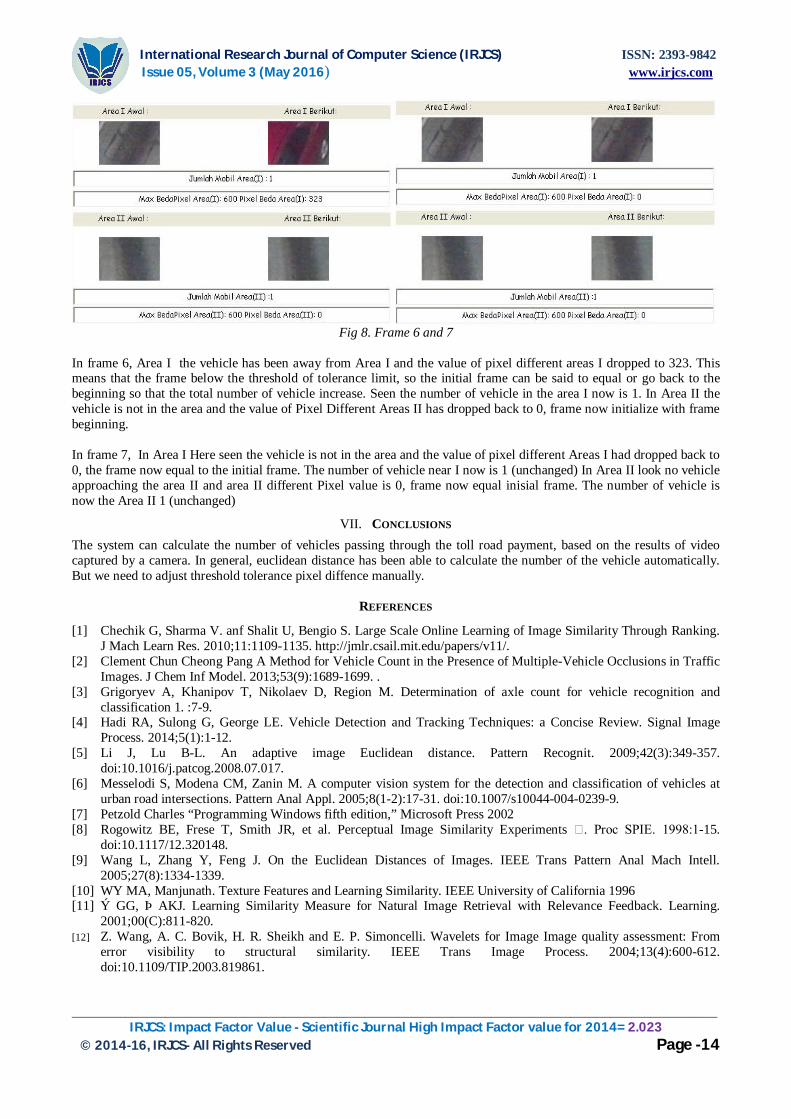
Fig 8. Frame 6 and 7
In frame 6, Area I the vehicle has been away from Area I and the value of pixel different areas I dropped to 323. This means that the frame below the threshold of tolerance limit, so the initial frame can be said to equal or go back to the beginning so that the total number of vehicle increase. Seen the number of vehicle in the area I now is 1. In Area II the vehicle is not in the area and the value of Pixel Different Areas II has dropped back to 0, frame now initialize with frame beginning. In frame 7, In Area I Here seen the vehicle is not in the area and the value of pixel different Areas I had dropped back to 0, the frame now equal to the initial frame. The number of vehicle near I now is 1 (unchanged) In Area II look no vehicle approaching the area II and area II different Pixel value is 0, frame now equal inisial frame. The number of vehicle is now the Area II 1 (unchanged)
VII. CONCLUSIONS
The system can calculate the number of vehicles passing through the toll road payment, based on the results of video captured by a camera. In general, euclidean distance has been able to calculate the number of the vehicle automatically. But we need to adjust threshold tolerance pixel diffence manually.
REFERENCES
[1] Chechik G, Sharma V. anf Shalit U, Bengio S. Large Scale Online Learning of Image Similarity Through Ranking. J Mach Learn Res. 2010;11:1109-1135. http://jmlr.csail.mit.edu/papers/v11/.
[2] Clement Chun Cheong Pang A Method for Vehicle Count in the Presence of Multiple-Vehicle Occlusions in Traffic Images. J Chem Inf Model. 2013;53(9):1689-1699. .
[3] Grigoryev A, Khanipov T, Nikolaev D, Region M. Determination of axle count for vehicle recognition and classification 1. :7-9.
[4] Hadi RA, Sulong G, George LE. Vehicle Detection and Tracking Techniques: a Concise Review. Signal Image Process. 2014;5(1):1-12.
[5] Li J, Lu B-L. An adaptive image Euclidean distance. Pattern Recognit. 2009;42(3):349-357. doi:10.1016/j.patcog.2008.07.017.
[6] Messelodi S, Modena CM, Zanin M. A computer vision system for the detection and classification of vehicles at urban road intersections. Pattern Anal Appl. 2005;8(1-2):17-31. doi:10.1007/s10044-004-0239-9.
[7] Petzold Charles “Programming Windows fifth edition,” Microsoft Press 2002 [8] Rogowitz BE, Frese T, Smith JR, et al. Perceptual Image Similarity Experiments . Proc SPIE. 1998:1-15.
doi:10.1117/12.320148. [9] Wang L, Zhang Y, Feng J. On the Euclidean Distances of Images. IEEE Trans Pattern Anal Mach Intell.
2005;27(8):1334-1339. [10] WY MA, Manjunath. Texture Features and Learning Similarity. IEEE University of California 1996 [11] Ý GG, Þ AKJ. Learning Similarity Measure for Natural Image Retrieval with Relevance Feedback. Learning.
2001;00(C):811-820. [12] Z. Wang, A. C. Bovik, H. R. Sheikh and E. P. Simoncelli. Wavelets for Image Image quality assessment: From
error visibility to structural similarity. IEEE Trans Image Process. 2004;13(4):600-612. doi:10.1109/TIP.2003.819861.