Council Improvement Proposal - IPART · Council Improvement Proposal (Existing Structure) Council...
61
Template 2 Council Improvement Proposal (Existing Structure)
-
Upload
phamkhuong -
Category
Documents
-
view
217 -
download
1
Transcript of Council Improvement Proposal - IPART · Council Improvement Proposal (Existing Structure) Council...

�
Template 2
Council Improvement Proposal
(Existing Structure)

�
Council name: Wollongong City Council Date of Council resolution endorsing this submission: 22 June 2015 1.1 Executive Summary Provide a summary (up to 500 words) of the key points of your Proposal including current performance, the issues facing your council and your planned improvement strategies and outcomes.
The ability to provide appropriate services and fund the maintenance renewal of community assets as and when required is a key challenge for NSW local government and a major risk to many councils long term financial sustainability. Wollongong City Council (‘the Council’) is not immune to this issue. In 2013 the NSW Treasury Corporation (TCorp) found that Wollongong City Council’s medium term financial position to be sound, however that Council’s deteriorating operating results are ‘primarily due to increasing depreciation and amortisation expenses’, and that ‘this is a significant issue that could impact the long term financial sustainability of the Council’.
At the time of the TCorp assessment Council was already responding to the issues raised and has since that time firmed its plan to address the issues, and is now well positioned in preparing its Fit for the Future Proposal. Since 2007, Council has taken an approach focussed on achieving operational savings to free up funds to be used for asset renewal. In 2009, Council adopted a Financial Strategy to provide direction for decision making in the allocation and management of Council’s financial resources. The Strategy recognised the asset challenge, and that there was a need to develop actions in consultation with the community to move towards surplus budgets. This program utilised a number of strategies to achieve recurrent budget improvements without having a negative impact on the community. The improvement achieved by the end of the 2013-14 financial year was approximately $21M per annum.
Whilst the asset challenge and improving our financial position have been part of Council’s strategic planning since 2007, and forms a key deliverable under Wollongong 2022 Community Strategic Plan, targeted community engagement was undertaken during 2013 and 2014 for the Securing our Future Financial Sustainability Review. This program worked with the community to identify options and strategies for financial sustainability via efficiencies, service levels and funding sources. The outcome included a revised, more sustainable Resourcing Strategy, which included an approved special rate variation over three years commencing 2014/15.
1

�
This improvement proposal builds upon the Independent Local Government Review Panel’s position that the Council has enough scale and capacity to maintain its operations as an independent Council, yet seeks to strengthen its relationships with other Councils in the Illawarra region. Council is currently participating in the Illawarra Regional Joint Organisation Pilot, and intends continuing exploring regional partnership opportunities beyond the pilot.
Other key improvement strategies include:
· Implement an efficiency program which would reduce a forecast expenditure of $4.5M per annum without material impact on service levels · A minor change to some service levels, reducing costs by $1.5M per annum · Small increases revenue from fees and charges, totalling $0.5M per annum · A rating increase, bringing an additional $14.5M per annum over three years · Consider and plan for the longer term impacts of development at West Dapto · Maintain Available Funds between 3.5% and 5.5% of operational revenue · Remain a low debt user by maintaining a debt service ratio below 4% · The full life cost of capital expenditure will be considered before capital projects are approved · Apply at least 85% of Operational Funds Available for Capital to the renewal of existing assets. · Continuously improve efficiency in delivery of services, including an ongoing review of services. · Actively pursue grant funding and other contributions to assist in the delivery of core services.

�
1.2 Scale and Capacity
Does your council have the scale and capacity broadly consistent with the recommendations of the Independent Local Government Review Panel?
Yes Discussion The Independent Local Government Review panel identified in its final report Council’s current rating by TCorp as Moderate. Furthermore, it stated that in terms of economic, social, environmental and transport linkages, and for strategic planning purposes, the three Illawarra councils form a well-established region and have cooperated for many years through regional organisations, although shared services activity is very limited.
The Panel noted the Illawarra faces major economic and social challenges, coupled with substantial urban growth in Wollongong and Shellharbour. The Panel considered whether a merger or mergers was necessary at this stage. It took into account a combination of four key factors:
· Each council appears sustainable for at least the medium term · Existing boundaries do not pose significant urban management problems · Water supply and sewerage are handled separately by Sydney Water · Kiama’s distinctive rural and coastal setting and ‘country town’ character, compared to Wollongong and Shellharbour.
On that basis, the Panel considered that closer collaboration through a Joint Organisation should enable a sufficient response to regional challenges for some time to come.
Since the Panel’s recommendation, the three councils plus the Shoalhaven successfully applied to be a pilot Joint Organisation (JO). The pilot allows for further consideration of the Panel’s feedback and the opportunity to identify and address regional challenges in the medium to long term. The pilot also provides an opportunity to build on regional shared service opportunities such as the regional procurement project currently under the auspice of the Southern Councils Group. The draft Regional Strategic Priorities Statement prepared by the pilot further identifies opportunities related to regional training and asset management.

�
Underpinning the work of the JO is the establishment of an operational working group, working across the four councils investigating other shared service potential. Whilst Wollongong City Council meets the scale and capacity criterion as recommended by the Panel – no merger is proposed – it is further argued that Council can remain independent for the following reasons:
· Council’s existing population is exceeds 200,000 and is expected to be 243,156 by 2036 with development well underway at West Dapto · Wollongong is the regional centre for the Illawarra · Wollongong City Council is one of the biggest employers in the region. Council is also is part of a shared skill based program where
employees are exchanged with neighbouring when specialist skills are needed for short periods of time. There are current discussions to expand this arrangement.
· Council also had a strong relationship with the former Southern Councils Group, and is now participating in a Pilot JO with additional work underway on shared services.
· Council has demonstrated it is a capable partner with State and Federal agencies with such programs as the Illawarra Growth and Infrastructure Plan.
· Despite reducing operational costs of $21M to redirect to asset renewal, Council has also successfully enhanced and expanded the range and level of service provided to the local community. For example since 2008, Council has established and expanded services such as a centralised Customer Service centre, Regulation and Enforcement, Development and Construction Compliance, commissioned the Thirroul Library and Community Centre, created a Professional Conduct Coordinator role and a CBD coordinator, transferred Wollongong City Gallery across under the organisational establishment, created two Corporate Lawyers and reopened the Town Hall.
�
2. Your council’s current position
2.1 About your local government area Explain the key characteristics of your local government area, your community’s goals and priorities and the challenges you face in the future (up to 500 words).
“From the mountains to the sea, we value and protect our natural environment and we will be leaders in building an educated, creative and connected community” (Community Vision, Wollongong 2022).
Wollongong is the third largest city in New South Wales and ninth largest city in Australia in terms of population (pop 205,231 (ABS ERP 2013), with steady growth rates expected until 2031 with land release areas at Tallawarra and West Dapto. Whilst these developments will bring business investment and job opportunities to the area, there remains to be challenges regarding short and long term infrastructure funding and prioritisation. The population is ageing with consistent growth in the proportion of people aged 50 years and over. With this comes increased pressure on physical infrastructure, health, education, housing, employment, transport, revenue, aged care, waste and recreation. The median weekly household income was $1,101, which is below the state and national median income levels of $1,237 and $1,234 respectively. Wollongong’s unemployment rate is also higher than state and national averages at 7%, compared with 6% for both NSW and Australia (.id Profile, accessed 2015). There is a need to focus on job creation and economic development in light of these trends and the decline in local manufacturing and steel industries. During the development of the Wollongong’s Community Strategic Plan “Wollongong 2022” in 2012, the community identified the following big issues:
· Infrastructure and standard of assets · Area needs a revamp and revitalisation · Lack of jobs · Need for improve public transport , including a fast train to Sydney · Better/upgraded infrastructure · Preservation of the natural environment · Safety
2

�
“Wollongong 2022” has six interconnected goals:
1 We value and protect our environment. 2 We have an innovative and sustainable economy. 3 Wollongong is a creative, vibrant city. 4 We are a connected and engaged community. 5 We are a healthy community in a liveable city. 6 We have sustainable, affordable and accessible transport.
To help achieve the Wollongong 2022 community vision and six community goals our Councillors have made an additional commitment through five key focus areas (strategic programs) for the next five years:
1 Improving the standards of community assets over the 5 year Council term. This will be achieved by directing 85% of all capital investment into asset renewal, and a strong emphasis on cost effectiveness in service provision.
2 Council will work in collaboration with key agencies to provide the infrastructure needed to support growth within the West Dapto Urban Release Area.
3 Work to reduce the environmental impact of waste by improving waste management across the city. 4 Improve the attractiveness of the Wollongong City Centre to work and visit, reinforcing its role as the region’s major hub for investment and jobs
growth. 5 Improve the connectivity of the Local Government Area (LGA) through the upgrade of our network of footpaths and cycleways.
In 2013-14 Council undertook a significant community engagement process as part of a ‘Securing our Future’ program. The program focused on the long term financial sustainability of the organisation, with a focus on the need to renew a substantial asset portfolio of $4.05b (replacement cost). Part of the process included a review of the Council’s Resource Strategy and Delivery Program and led to the adoption of a revised scenario including a combination of efficiency, minor adjustments to service levels, increased fees and charges and a special rate variation. Further detail on the options considered with the community and the final outcome are detailed in section 3.4 of this template. Council’s current draft Annual (operational) Plan progresses the ‘Securing our Future’ program and this Improvement Proposal remains consistent with the endorsed approach.

�
2.2 Key challenges and opportunities
Strengths Weaknesses - Strengths associated with a relatively large Council - Large rate base, economies of scale,
etc. - Regional centre with increasing private investment - Strong cash holdings and low levels of debt - Strong own source revenue record - High value of properties owned, with some in the position of sale. - Existing Financial Sustainability Policy and program in place - Annual improvement to 2013/14 was $20.3Mil of operational funds recurrent leading to a
110% increase in capital expenditure over the last 5 years. - Three year SRV approved in 2014. - Strong community engagement practices - Increasing community satisfaction with Council’s overall performance (source: Community
Satisfaction Surveys, 2010, 2012, 2014). - Diverse and highly professional internal expertise - Full costing information available for all of Councils services and delivery streams and
improving knowledge of full cost of service - Business proposal process (rigorous process for prioritising non-allocated funds). - Journey toward fully integrated plans (links to business proposal process)
- Prior to attainment of the 13/14 SRV (over three years) deteriorating operating results “primarily due to increasing depreciation and amortisation expenses” (TCorp, 2012).
- Currently failing to meet TCorp Infrastructure and Asset Management benchmarks: Infrastructure Backlog, Building and Infrastructure Asset Renewals Ratio, and Asset maintenance ratio.
- Low community satisfaction with maintenance of local roads and footpaths (source: Community Satisfaction Survey, 2014)
- High expenditure on overtime - High service and infrastructure levels – 17 patrolled beaches, 10 fresh
water/aquatics facilities, 9 salt water rock pools, 700 community buildings, etc. - Higher than average business rates - Unplanned external funding (esp. capital) - Too much data in some areas, and not appropriate data in others - Reactive approach / resistance to change. - Tendency to maintain status quo - Historically, the Enterprise Agreement limits flexibility for workforce planning
Opportunities Threats - “Securing our Future” project and our ongoing Financial Sustainability Program means both
internally and in the community there is a common understanding about financial sustainability
- Joint Organisation - Shared services (at operational level) - Operational savings target - Special Rate Variation – opportunity to improve performance in benchmarks - Development and improvements to asset management plans, systems and processes,
including data management, further definition of levels of service for individual asset classes. - Improvements to capital works prioritisation process - Costing annual deliverables / activity based costing - Increase non-rate revenue - Other methods to resource and deliver our services including – delivery methods (including
Outsourcing services) / staff structures / reviewing management and operational structures - Greenfields development at West Dapto – increased rates income, increased economic
activity.
- Redistribution of FAG grants to rural Councils. - Council not supporting the SRV 16/17 as part of the annual budget process - Reliability of asset data and timing/costs for renewals - Development at West Dapto and the potential and realistic increasing costs of
infrastructure as a result of significant development constraints. Also caps on developer contributions.
- Lack of appetite to review service levels - Ageing workforce (loss of corporate knowledge) and low turnover of staff - Lack of appropriate asset data and poor use of data means continued incorrect
benchmarking information (e.g. Infrastructure Backlog) - Lack of State Government guidelines or industry guidelines resulting in
benchmarking being subjective (e.g. useful life) for asset management.

�
2.3 Performance against the Fit for the Future benchmarks
Sustainability
Measure/ benchmark
2013 / 2014 performance
Achieves FFTF benchmark?
Forecast 2016 / 2017 performance
Achieves FFTF benchmark?
Operating Performance Ratio (Greater than or equal to break-even average over 3 years) -5.61%
No
-0.94%
No
Own Source Revenue Ratio (Greater than 60% average over 3 years)
77.30% Yes 81.92% Yes
Building and Infrastructure Asset Renewal Ratio (Greater than 100% average over 3 years)
49.22% No 95.09% No

��
If the Fit for the Future benchmarks are not being achieved, please indicate why. Operating Performance Ratio: The historical trend indicates a negative result for the last three financial years. This trend was described in detail in Council’s 2014-15 application to IPART for a Special Rate Variation. The 2013-14 result has been distorted due to the change in timing of Financial Assistance Grants. Without this there would have been a continuing improvement over the 2012-13 year based on the improvement program in place. The purpose of Council’s 2013-14 ‘Securing our Future’ program, which included efficiency improvements, service adjustments, fees & charge increases and a Special Rate Variation, was to assist Council in improving its operating result, and to reach break-even. With these changes in place, it is forecasted that this will be achieved by 2017-18.

��
OWN SOURCE REVENUE: Performance meets benchmark.
INFRASTRUCTURE ASSET RENEWAL:
1) Council meets this benchmark in 2019/20. The result is positive and shows Wollongong is progressively realising strong improvements in infrastructure renewal works. Council’s ‘Securing our Future’ program was adopted in 2014 and further budget revision additional to this program bridges the gap over the next five years. Council’s progress on this benchmark measure can be seen in the graph below, highlighting the benefit of the SRV allocations, which increase over 14/15 to 16/17. Council has also been refining its asset management data including the renew/new split. The older style of calculation (13/14 and earlier) was using an “either/ or” approach for the new-renew, that is allocating each project as either new or renew. The newer methodology, using the data now driven from the capital budget worksheets, allows a percentage split for each project. The higher granularity allows a better estimate of the renew expenditures than was previously possible. This accounts for the significant improvements in the ratio from 13/14 to 15/16.
2) There are limitations of the benchmark worth noting. Depreciation does not equal required expenditure: The benchmark compares capital budget allocated to renewal of infrastructure assets against the depreciation amount of those assets. The assumption is that the required expenditure to achieve level of service is equal to this depreciation amount in any one year. However, this is not necessarily the case. For example, Wollongong Council’s transport assets were shown in the 2011 Asset Management Plan to have a current replacement cost of $1.3b (2011 dollars). The annual straight-line depreciation calculation was $23m p.a. of these assets combined. However, due to an asset stock in generally good condition compared to the levels of service standards and many transport assets having long lives, the required annual expenditure on asset renewal was determined to be $14m p.a. Therefore the amount required to be spent on renewing those assets was/is (considerably) less than the annual straight line deprecation amount. This is similar for Wollongong’s stormwater assets, which value ¼ of Councils total asset stock by CRC. However, for other asset types, such playgrounds, matching depreciation may not be sufficient to cover changing safety and specification improvements necessary in replacement of failed assets. The outcome of this ratio will depend clearly on the point in an asset class’s lifecycle and the depreciation methodology applied. This issue will be significant in Councils that have a high growth level where the majority of assets are relatively new (do not require renewal) and depreciation is high.

��
3) Further, Wollongong is a growing city with significant new greenfield development taking place at West Dapto as per the State Government’s Illawarra Regional Growth and Infrastructure Plan. Council plans to construct in excess of $500M in new infrastructure as part of this development over the next 40 years. This measure will therefore be skewed by this new development where it is necessary to provide new infrastructure to service the new community, as well as focus on renewal in our established communities. Indexation and changes over time also effect residual value.
In reference to entire capital works program, the graph below shows a major increase in total capital budget allocation (including new and renew) over the period 2009-10 to 2018-19. The average spend of Councils Capital works program for the 5 years to 2013-14 was $63.3m annually. The average of the 5
0.00%
20.00%
40.00%
60.00%
80.00%
100.00%
120.00%
2014 15 2015 16 2016 17 2017 18 2018 19 2019 20 2020 21 2021 22 2022 23
Asset Renewal Ratio (3 year ave)

��
years 2014-15 to 2018-19 is programmed to be $93.5m. While some of the increase is for ‘new’ assets as described above, the majority of this expenditure is renewal of existing assets stock, based on Council’s financial strategy which requires at least 85% of operational revenue to capital be expended on renewal, an SRV increase and operational savings devoted to renewal.
Programmed renewal budget on buildings and infrastructure:
2014-15 = $48.6m 2015-16 = $51.3m 2016-17 = $55.0m 2017-18 = $56.7m (includes future grant allocation)
2009/10 2010/11 2011/12 2012/13 2013/14 2014/15 2015/16 2016/17 2017/18 2018/19Expenditure 54.2 57.6 64.7 53.9 86.2 86.9 86.3 96.7 100.9 96.5
0.0
20.0
40.0
60.0
80.0
100.0
$M
Historical and Forecast Capital Expenditure
��
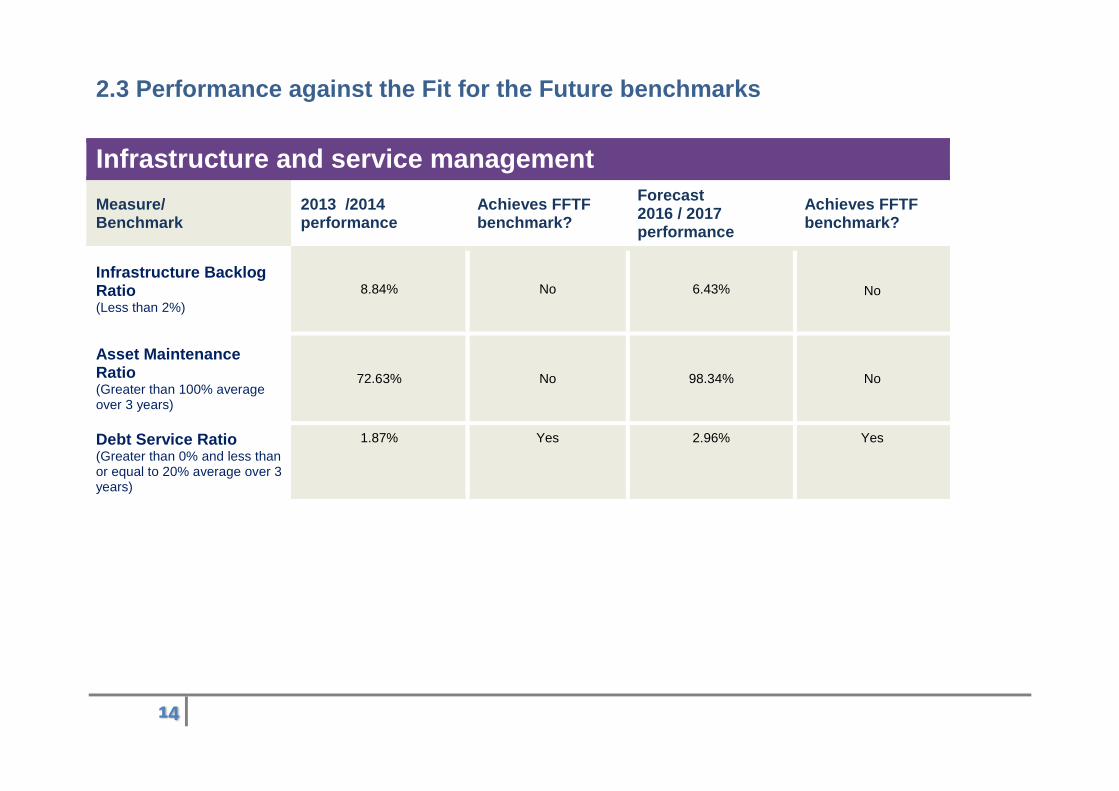
2.3 Performance against the Fit for the Future benchmarks
Infrastructure and service management Measure/ Benchmark
2013 /2014 performance
Achieves FFTF benchmark?
Forecast 2016 / 2017 performance
Achieves FFTF benchmark?
Infrastructure Backlog Ratio (Less than 2%)
8.84% No 6.43%
No
Asset Maintenance Ratio (Greater than 100% average over 3 years)
72.63% No 98.34% No
Debt Service Ratio (Greater than 0% and less than or equal to 20% average over 3 years)
1.87% Yes 2.96% Yes

��
If the Fit for the Future benchmarks are not being achieved, please indicate why. INFRASTRUCTURE BACKLOG:
The difference in the benchmark and the result for Council could largely be attributed to the method Council applies to get our result. Council also believes there are some significant limitations to the benchmark itself.
a) Limitations of the benchmark: i. “Cost to bring to satisfactory” is a notional concept that is not based on any asset planning principles.
ii. Measuring “Cost to bring to satisfactory” over the written down value of assets means that the reported backlog percentage can change without any additional backlog items. The denominator effectively measures relative age of assets within portfolios and also eliminates impaired assets that have no value. The measurement will therefore impact the relative significance (size) of the result without measuring capacity to renew.
iii. The notions that appear to be espoused in the OLG documents measures assets that are within a life cycle and not due for renewal as backlog in the numerator of this calculation. That is an asset in condition 3, still years off renewal requirements, is being included in the backlog ratio.
iv. The denominator of written down value versus replacement cost can overstate the size of the problem. It would be argued a fairer representation would be achieved by using renewal cost of assets that have passed their actual used by condition and life over the CRC of the assets. An assessment against of this benchmark using CRC as the denominator has been undertaken in section 4.1 of this report.
b) Limitations of the method WCC applies to obtain backlog result: i. Council’s Special Schedule 7 defines the cost to bring to satisfactory as the current replacement cost for assets in categories 4 and 5 to bring
the asset to at least category 3. When Council renews an asset, it is not in the practice to simply bring it to “satisfactory” (see point ii on how “satisfactory” is defined); rather the asset is generally renewed to the excellent condition, condition 1. Council’s previous auditors identified that “simply using the total renewal costs for the purposes of SS7 would overstate the costs to be disclosed” (Hill Rogers Spencer Steer Assurance Partners, 27/2/15).
ii. Council’s use of condition 3 for satisfactory has only been supported by extensive community engagement for footpath and cycleway assets. This was done as part of Council’s ‘Securing our Future’ process. Further engagement is required to determine satisfactory levels of service for other asset types, hence the ratio has taken the conservative approach of using condition 2 as ‘satisfactory’ for all asset types other than paths. This is an indicator of the need to include an action regarding service levels in our improvement plan.

��
iii. For the majority of assets, asset lives are determined by condition assessment in the field, with a resultant calculation of remaining useful life. As not all assets types can be inspected this way (e.g. stormwater pipes), to achieve a condition consistent across all assets, condition is calculated from the remaining useful life of the asset. However, an asset with 4 years to renewal is considered level 4 (not satisfactory). The same measure is currently applied equally to all asset classes that have differing useful lives. This distorts the result for some asset classes.
iv. Condition data is not consistent across asset types. Most assets have condition inspected on regular inspections cycles, however, some asset types, e.g. stormwater pipes, only have condition data based on their lives, not on inspection data. Council intends on improving the maturity rating of its data over the life of the Asset Management Plan.
Across the sector, there is strong recognition of the limitations of this measure, as outlined above, and Council continues to hold the position that this indicator does not provide meaningful information regarding the status of Council’s infrastructure portfolio. Council has, however, reworked its model based on advice received from our auditors to consider assets in condition four and five to be brought to condition two (except for footpaths which are to three based on the ‘Securing our Future’ project), rather than one. This has resulted in the backlog cost as at 2014-15 being reduced from $129M to $93.5M, based on the reworked model. Councils Asset Management Plans combined provide a projected asset renewal profile which provides an average required expenditure of $49m per year to ensure assets remain in satisfactory standard. Councils Long Term Financial Plan is committed to increasing forward capital works budget renewal allocations above this amount to reduce the calculated infrastructure backlog over time. This achieves a ratio of 6.4% for 2016-17.

��
ASSET MAINTENANCE RATIO: Council’s Special Schedule 7 determines required maintenance from historical allocation based on a considered percentage of Current Replacement Cost (CRC). This has been refined over years to a reasonable position, but is not directly related to asset condition. With no clear definition of what is ‘required’ maintenance from OLG this process is based on Council’s asset management experience. Council’s auditors have recently suggested refinement of these measures to address changing maintenance needs over the life of an asset, with weighting towards the end of an asset life. Accordingly, a review of Special Schedule 7 process for actual and required maintenance has been undertaken. Actual maintenance expenditure requires some process improvements to confirm maintenance expenditure in the 2014-15 financial year. Our entire maintenance and operational budgets actually total over $35m, with improvements in the financial reporting of maintenance costs versus operational costs highlighting an increase in reported maintenance expenditure.
0
0.01
0.02
0.03
0.04
0.05
0.06
0.07
14/15 15/16 16/17 17/18 18/19 19/20 20/21 21/22 22/23
Infrastructure Backlog ratio

��
Accelerated operational savings has resulted in an additional $500k recurrent and indexed allocated to maintenance budgets from 2015/16 onward.
Therefore Councils Asset maintenance ratio has been, and is programmed to be, as graphed, rising to a 3 year average ratio of 100.3%
DEBT SERVICE RATIO: Performance meets benchmark. Additional borrowing over time may be required for development at West Dapto, and if this is the case, it is expected that Council would remain within the benchmark given its current positive performance.
0.0
20.0
40.0
60.0
80.0
100.0
2013 14 2014 15 2015 16 2016 17 2017 18 2018 19 2019 20
Maintenance ratio (3 year ave)

��
2.3 Performance against the Fit for the Future benchmarks
Efficiency
Measure/ benchmark
2013 /2014 performance
Achieves FFTF benchmark?
Forecast 2016 / 2017 performance
Achieves FFTF benchmark?
Real Operating Expenditure per capita A decrease in Real Operating Expenditure per capita over time
1.02 No 1.00
Yes
If the Fit for the Future benchmarks are not being achieved, please indicate why.
There is a decreasing trend commencing 2011-12 which is consistent with restrained expenditure over recent years. There are some areas of increase that offset efficiency particularly in external payments such as the Waste Levy and Emergency services payments. There have also been increases in some employee costs around penalty rates and some increases in services. The number is also impacted from year to year by projects funded from external funding including recent decreases in WASIP.
It is worth noting that there are limitations with this benchmark. The result is influenced by the deflation factor used. The deflator for future years Wollongong City Council has applied is based on rate peg up to and including 2015-16 and then 2.5% as advised by OLG in their online portal and verbally at regional forums. This means that Council's expenditure projections are indexed at a higher rate than the deflator. This will result in a slight increase in the per capita cost.

��
2.4 Water utility performance NB: This section should only be completed by councils who have direct responsibility for water supply and sewerage management Does your council currently achieve the requirements of the NSW Government Best Practice Management of Water Supply and Sewerage Framework? Not applicable. Sydney Water undertake all roles for water supply and sewerage management.

��
3. How will your council become/remain Fit for the Future?
3.1 Sustainability Summarise your council’s key strategies to improve performance against the Sustainability benchmarks in the 2016-20 period, including the outcomes you expect to achieve. Prior to Council’s application for a SRV in 2014, the baseline forecast indicated a $21M annual shortfall in its operating position (pre-capital). This shortfall directly related to a gap in funding full depreciation. As part of the Council’s Resourcing Strategy 2012-22 and Delivery Program 2012-2017, the adopted scenario addresses the shortfall in funding to achieve small surplus budgets by 2016-17, achieved through a combination of internal efficiency improvements, reductions to some service levels, and increased revenue through rates and fees and charges and a special rate variation.
The range of strategies Council is implementing to move from its existing position to one of long term sustainability is addressed by Council’s Financial Strategy. The Strategy has a number of clear objectives and targets that aim to improve Council’s long term sustainability. The principles of the strategy have underpinned the revised Resourcing Strategy, and in turn, inform Council’s Delivery Program and Annual Plan.
With particular reference to the Sustainability Benchmarks, key strategies and outcomes to improve performance include:
· Maintain Available Funds between 3.5% and 5.5% of operational revenue · Move towards and maintain small surplus budgets in the future – achieved through efficiency improvements, reductions in some service levels,
increased revenue through rates and fees and charges. · Council will move towards creating annual operational funds available for Capital equal to depreciation. · Increased annual rate revenue created from subdivision in West Dapto will be restricted and only allocated to operational expenditure as the area
develops. In the interim period, the annual revenue should be made available to meet infrastructure or planning requirements in the area.
Many of these actions have been developed as a result of Council’s ‘Securing our Future’ project, which included a significant community engagement process.
3

��
West Dapto West Dapto is the last significant ‘green fields’ development in Wollongong. It will have significant financial impacts over a period of time. There will be substantial developer contributions, capital expenditure, financing issues and increased revenue. The management of all these elements has inherent risks due to the external section 94 pricing limits, estimating, scoping, and timing variables; and also the common infrastructure construction risks which are exacerbated when planning out at concept level. Rate revenue will precede operational cost demand and new assets will require little renewal and lower levels of maintenance some years creating a short to medium term perception of improved financial performance. Control is required to ensure the negative long term impacts that the delayed expense pattern could have if additional rate revenue is built into other recurrent operations. Explain the key assumptions that underpin your strategies and expected outcomes. For example the key assumptions that drive financial performance including the use of SRVs, growth in rates, wage increases, Financial Assistance or other operating grants, depreciation, and other essential or major expense or revenue items.
Financial Model Key Assumptions Assumption Commentary Securing Our Future Program The adopted Resourcing Strategy and Delivery Plan include the ‘Securing Our Future’ outcomes that will
facilitate a $21 Million per annum improvement that is intended to be delivered by:
• An Efficiency Program to be implemented over three years that would reduce expenditure requirements by a minimum of $4.5 Million without material impact on service levels.
• A minor change to some service levels that would reduce cost by $1.5 Million over a four year period. This adjustment included a change to the life of footpaths that would reduce the renewal requirement by approximately $1 Million per annum.
• An increase in revenue from fees and charges of $0.5 Million over three years.
• A rate increase that will build to an additional $14.5 Million per annum over three years.
Special Rate Variation Rate income projections are inclusive of the Special Rate Variation (SRV) that was approved by IPART on 3 June 2014 and allows for annual increases for ‘General Income from Rates’ of 6.13% in 2014-15, 6.23% in 2015-16 and 6.24% in 2016-17. This is a cumulative increase of 19.78% by 2016-17 (11.25% above the anticipated rate peg). Rates for 3(c) Regional Business and Heavy 1 Activity 1 Business subcategories (that currently pay a higher than average rate in the dollar on property valuation), and Special Rates, are indexed

��
by 3% for 2015-16 and 2016-17.
Forecasts beyond the SRV included in the ten year forecasts are based on increases aligned to CPI projections. Forecasts beyond 2015-16 also include a 0.4% growth in rates that represents approximately 420 additional properties per annum.
The rate categories and sub-categories are proposed to remain unchanged. These structures have been applied since 1994 when the provisions of the then new Local Government Act came into force. A change in pricing structure for residential rates to include a base charge was introduced in 2002.
Service Levels
Estimates for expenses and income in future years have been applied based on existing service levels unless a decision has been made (e.g. footpath condition through the ‘Securing our Future’ program), or a plan is in place, to vary this level. The outcomes of Service Reviews are incorporated into forward estimates as deployment strategies are confirmed. Variations in recurrent budget costs in excess of expected indices have been considered and are included in the budget where necessary.
Efficiency / Service Reductions
The targeted efficiency improvement is based on reducing delivery costs for services across the breadth of Council’s operations; it will require some industrial change and operational transformation. It is intended that these efficiency adjustments will not impact negatively on service delivery.
Financial Assistance Grant
The Financial Assistance Grant (FAG) is usually subject to indexation however, the 2014 Federal Government Budget included a “pause” in indexation until 2017-18. This has been indexed by 2.5% for 2017-18 and years beyond.
Employee Costs
Employee costs are inclusive of labour on costs such as superannuation, workers’ compensation costs, parental leave, annual leave, provision for long service leave and payroll tax, where applicable. Councils have also been required to make an additional annual contribution of $1.8M to the defined benefits superannuation scheme to address the fund shortfall resulting from the global financial crisis. The final payment of this top up is currently assumed to be in 2016-17.
Recurrent casual and overtime budgets are maintained to match the service and structure levels required for 2015-16
Labour costs are generally indexed by the Enterprise Agreement (EA) rates of pay. The current EA ends in June 2015 with Council currently in the process of renegotiating. The indexation figure has not yet been finalised, however it is anticipated that wage and salary movements will be indexed at the rate of 2.7% from 1 July 2015, which is consistent with the Local Government (State) Award 2014.
The cost of employees working on capital projects is allocated to specific projects as work is completed. This includes design, survey, project management, and supervision and construction staff.
��
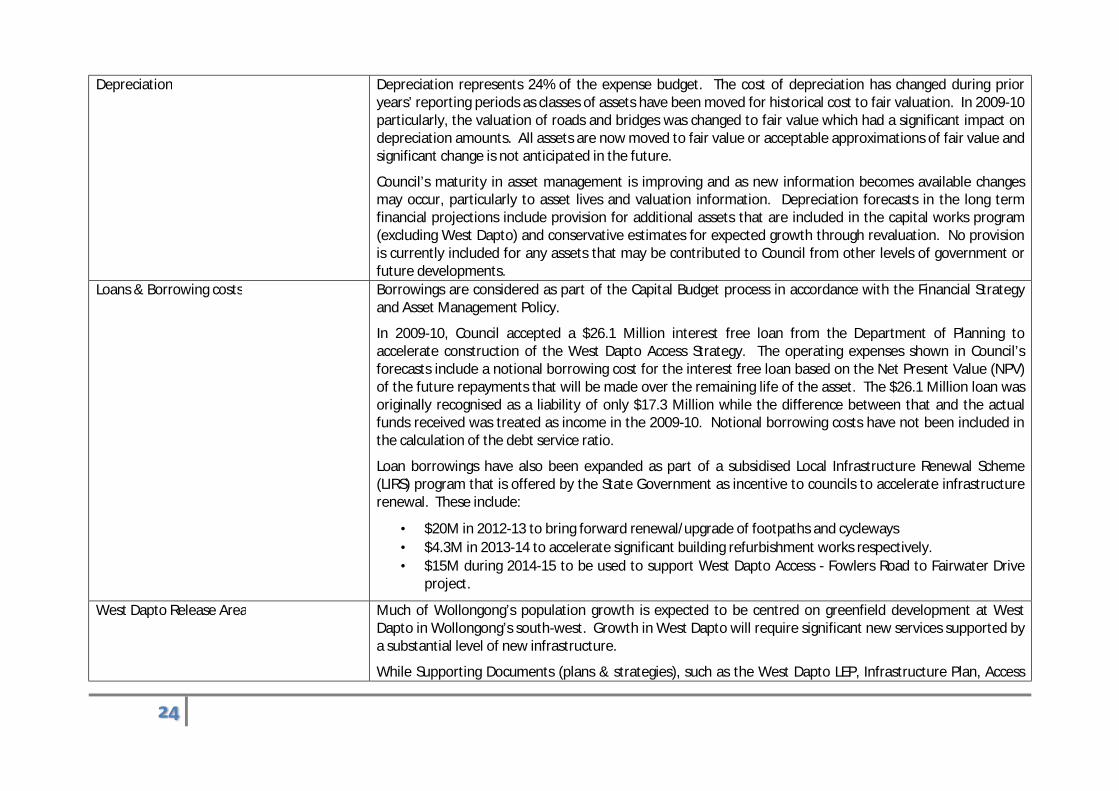
Depreciation Depreciation represents 24% of the expense budget. The cost of depreciation has changed during prior years’ reporting periods as classes of assets have been moved for historical cost to fair valuation. In 2009-10 particularly, the valuation of roads and bridges was changed to fair value which had a significant impact on depreciation amounts. All assets are now moved to fair value or acceptable approximations of fair value and significant change is not anticipated in the future.
Council’s maturity in asset management is improving and as new information becomes available changes may occur, particularly to asset lives and valuation information. Depreciation forecasts in the long term financial projections include provision for additional assets that are included in the capital works program (excluding West Dapto) and conservative estimates for expected growth through revaluation. No provision is currently included for any assets that may be contributed to Council from other levels of government or future developments.
Loans & Borrowing costs Borrowings are considered as part of the Capital Budget process in accordance with the Financial Strategy and Asset Management Policy.
In 2009-10, Council accepted a $26.1 Million interest free loan from the Department of Planning to accelerate construction of the West Dapto Access Strategy. The operating expenses shown in Council’s forecasts include a notional borrowing cost for the interest free loan based on the Net Present Value (NPV) of the future repayments that will be made over the remaining life of the asset. The $26.1 Million loan was originally recognised as a liability of only $17.3 Million while the difference between that and the actual funds received was treated as income in the 2009-10. Notional borrowing costs have not been included in the calculation of the debt service ratio.
Loan borrowings have also been expanded as part of a subsidised Local Infrastructure Renewal Scheme (LIRS) program that is offered by the State Government as incentive to councils to accelerate infrastructure renewal. These include:
· $20M in 2012-13 to bring forward renewal/upgrade of footpaths and cycleways · $4.3M in 2013-14 to accelerate significant building refurbishment works respectively. · $15M during 2014-15 to be used to support West Dapto Access - Fowlers Road to Fairwater Drive
project.
West Dapto Release Area Much of Wollongong’s population growth is expected to be centred on greenfield development at West Dapto in Wollongong’s south-west. Growth in West Dapto will require significant new services supported by a substantial level of new infrastructure.
While Supporting Documents (plans & strategies), such as the West Dapto LEP, Infrastructure Plan, Access

��
Strategy and West Dapto Section 94 Plans articulate proposed services, assets and some potential future sources of funds or redirection of existing funding, Council’s Delivery Plan and proposed Annual Plan only include those elements of the Plan that have passed through that part of the planning process. The full extent of services expected from development in West Dapto is still in the planning phase.
The Draft Annual Plan 2015-16 includes funding for a West Dapto Review project that will review the Supporting Documents over a two year period and will provide more definitive information, revised cost estimates and proposed timing of infrastructure works in the growth area.
The aspects of the West Dapto Release Area that have been introduced into Council’s Delivery Plan and Annual Budget from a capital budget perspective are the Princes Highway/Fowlers Road to Fairwater Drive extension ($62.7 Million) and Wongawilli Road ($13 Million). These works are to be funded from Section 94, the interest free loan from the Department of Planning, grant funds including Building Better Regional Cities and Restart NSW, Illawarra Infrastructure funding ($22.5 Million), loans under LIRS (3) ($15 Million) and some general revenue.
The scope and estimates for these projects are currently being reviewed with potential costs for Princes Highway/Fowlers Road to Fairwater Drive extension in the order of $93.5 million over the next five years, and Wongawilli Road in the vicinity of $36.5 Million. As the scope, design, and estimates for these projects are further developed, funding and potentially financing decisions will need to be made to progress them to completion. These considerations will be assessed against other budget requirements and included as decisions are made.
The forward operating budgets do include the estimated payment of Section 94 contributions (based on currently assumed development rates and the currently capped pricing for the West Dapto Section 94 Plan). Loans and grants that have been approved have also been included and are applied to fund the capital works included in the Delivery Plan.
Loan repayments for the West Dapto Access Loan have been set by the Department of Planning over a ten year period and are included in estimates. It is intended that for the most part, the loan repayment will be funded by future Section 94 contributions and rates revenue from West Dapto.
In accordance with Council’s Financial Strategy, additional rate revenue raised through subdivisions in the West Dapto Release Area are planned to be transferred to an internal restriction and used in the early years of the development to assist in funding West Dapto works. These funds have been applied to debt repayments over the first ten years. As the development progresses, revenue from the area will be used to fund the maintenance and operation of new assets as part of Council’s overall budget.

��
Other potential initiatives or programs There are a large number of other potential initiatives or programs that have not been included in the financial estimates at this stage due to the lack of certainty around the timing, funding and/or probability of completion. These include:
• The potential sale of property in Flinders Street (under agreement subject to conditions);
• The longer term capital works and impacts of development and operations within West Dapto (Incl. asset management costs);
• Unknown implications of the transfer of responsibility of Lake Illawarra from a State authority;
• Mount Keira power installation and water system design only funded in 2014-15, the future development of the site is not funded;
• Warrawong Library and Community Centre - capital indicatively provided in forward capital programs while any additional operational costs are not yet funded;
• Grand Pacific Walk - Stage 1 is funded, future stages are not yet fully funded;
• Some Blue Mile projects are funded (Stuart Park playground, toilet block and car park), while others are not yet funded;
These initiatives or projects may be introduced through the budget review process when they reach a point of clarity and funding is available that enables their inclusion.
Capital Income
Capital income refers to revenue that is specifically used for additional assets acquired by Council and may include cash contributions or value of assets dedicated to Council by land developers or other levels of Government.
Capital income is a source of funds that allow increased assets that can improve services and/or provide new services to growing areas such as roads, bridges, drains and playing fields in a new release area such as West Dapto. The operation of these assets will be reflected in Council’s operating costs in future years and will form part of the operating financial measures at that time.
Capital income is inconsistent from one period to another and is also difficult to predict due to the nature of the transactions. Any changes in the quantum or timing in the availability of these grants and contributions will have a direct impact on the capital works program. Impacts may include changes in timing of projects pending as alternate sources of funding or substitution of Council funding which may result in a delay in non-funded projects.

��
Indexation The financial forecasts are comprised of both recurrent and non-recurrent income and expenditure. The non-recurrent items have specified values and timing of delivery. Recurrent items may be subject to the application of indices, or may be set based on known commitments for expenditure such as loan repayments or may be adjusted for volume impacts or future pricing changes. General indexation is used where specific information is not available.
The proposed indices are based on information from a number of sources including long term economic projections published by the Federal Government including the Reserve Bank and Australian Bureau of Statistics (ABS), various banks, the Quarterly Economic Brief from Deloitte Access Economics and IPART recommendations for various utilities and rates pegging. The indices are presented in the tables below.
Asset related assumptions Please refer to section 2 of this document.
Table 1 – Indexation – Indices for Revenue
Indices for Revenue2014/15 2015/16 2016/17 2017/18 +
Fees and Charges-Commercial 3.0 3.0 3.0 3.0-Other 3.0 3.0 3.0 3.0
Rates Increase - inclusive of SRV * 6.13 6.23 6.24 3.00Rates Increase - growth 0.20 0.40 0.40
Interest Rates (90 day bill rate) ** 3.00 3.00 3.00 4.70
* Overall rate income forecasts are based on the Special Rate Variation (SRV) that w as approved by IPART. Rates on Business 3C Regional and Heavy 1 Activity 1 and Special Rates are increased by 3% w hilst remaining categories are expected to increase by 6.63% in 2015/16 and a similar level in 2016/17. Years beyond 2016/17 are not subject to SRV and all categories have been indexed by an estimated rate peg .
** Indicative benchmark rate for new investments. Actual interest rate may vary w here Council has committed funds in a prior period.

��
Table 2 – Indexation- Indices for Expenses
Indices for Expenditure2014/15 2015/16 2016/17 2017/18 +
% % % %CPI - general expenditure 2.30 2.75 2.70 2.60
Employee Costs-Wages costs (wage price index) 2.60 3.00 3.00 3.00-Superannuation levy increase 0.25 0.00 0.00 0.00
Interest Rates (90 day bill rate) 3.00 3.00 3.00 4.70
Loan borrowing rate 5.60 4.00 7.60 7.60
Utilities-Electricity 7.0 7.0 7.0 7.0-Other Utilities 3.3 3.7 3.7 3.6-Street lighting 3.3 3.7 3.7 3.6

��
3.1 Sustainability Outline your strategies and outcomes in the table below.
3.1 Sustainability
Objective Strategies Key milestones Outcome Impact on other measures
Maintain Available Funds between 3.5% and 5.5% of operational revenue (pre-capital)
Council’s annual allocations to operational and capital budgets will generally not exceed anticipated cash inflows. Where Available Funds level are above minimum requirements, consideration will be given to the allocation of funds to deferred asset renewals or investments that reduce future operational costs.
Annual Budgets adopted in accordance with strategy. Actual results consistent with Strategy targets
Available funds made available to provide buffer against unanticipated costs or to be used to take advantage of opportunities that may arise.
n/a
Council will continue to develop actions in consultation with its community to move towards and maintain small surplus budgets.
Council’s Resourcing Strategy (adopted February 2014) will be implemented. The strategy includes the Securing our Future Outcomes that plan for a $21 million per annum improvement to be delivered by:
Annual Budgets adopted in accordance with strategy. Actual results consistent with Strategy targets
Reduced Deficit from Operations ($4.5M per annum by 2016/17) without a major impact on staffing, industrial relations or service delivery. Additional $4.5 million
Real Operating Expenditure Operating Performance Ratio Infrastructure Backlog Ratio

��
a) An efficiency program to be achieved within three years that would reduce forecast expenditure by a minimum of $4.5 million per annum without material impact on service levels
dollars allocated to asset renewal program.
Building and Infrastructure Asset Renewal
b) A minor change to some service levels that will reduce cost by $1.5 million per annum within a four year period (commencing 14/15).
Service revision programs developed and adopted in in accordance with Resourcing Strategy. Implementation and actual results consistent with Strategy targets and change plans.
Reduced Deficit from Operations by $1.5M per annum by 2016/17. Additional $1.5 million dollars allocated to asset renewal program.
Operating Performance Ratio Infrastructure Backlog Ratio Real Operating Expenditure Building and Infrastructure Asset Renewal
c) An increase in revenue from fees and charges of $0.5M per annum within three years.
$150,000 revenue improvement for 2014/15 has been budgeted and achieved. $250,000 revenue improvement for 2015/16 has been identified and included in draft Annual Plan for
Reduced Deficit from Operations by $0.5M per annum by 2016/17. Additional $0.5 million dollars allocated to asset renewal program.
Operating Performance Ratio Infrastructure Backlog Building and Infrastructure Asset Renewal Own source revenue

��
exhibition. $130,000 target for 2016/17 to be identified and adopted.
ratio
d) A rate increase that will bring an additional $14.5Million per annum over three years.
Special Rate Variation over three years approved in 2014. Implementation of year one of approval achieved for 2104/15. Approval of final two years of variation in accordance with resource Strategy. Compliance with conditions attached to SRV is reported to OLG (including additional income is used for the purposes of improving its financial sustainability).
Apply a 6.24% rating increase in 2016/17 (year 1 & 2 already complete). Reduced Deficit from Operations by $14.5 million per annum by 2016/17. Additional $14.5 million dollars allocated to asset renewal program.
Operating Performance Ratio Infrastructure Backlog Ratio Real Operating Expenditure Building and Infrastructure Asset Renewal Own source revenue ratio
Consider the longer term impacts of additional revenue at West Dapto, and ensure appropriate long term provisions are made from the commencement of the
a) Undertake forward planning to determine the long term impacts of development at West Dapto are appropriately managed, including:
Development of a long term financial impact statement for west Dapto. Maintenance of a
Maintenance of the forecast improvement in Operating Performance and asset renewal capabilities derived from Secure our Future
Operating Performance Ratio Infrastructure Backlog Ratio

��
development to ensure financial sustainability.
– Development of a long term financial impact statement for West Dapto - Maintain and update existing Section 94 Plan and West Dapto Infrastructure Plan - Ongoing review of Asset costing estimates.
b) Increased annual rate
revenue created from subdivision in West Dapto will be restricted and only allocated to operational expenditure as the area develops. In the interim period, the annual revenue should be made available to meet infrastructure or planning requirements in the area.
current and deliverable Section 94 Plan and West Dapto Infrastructure Plan. Delivery of assets to estimates. To be reviewed and assessed continuously.
adjustments. Clearer understanding of potential impacts of Fit for the Future Key Performance measures that may not imply reduced financial sustainability.
Real Operating Expenditure Building and Infrastructure Asset Renewal Own source revenue ratio

��
Council will develop actions in consultation with its community to move towards creating annual operational funds available for capital equal to depreciation
The Securing our Future actions described under creating a small surplus equally support this objective.
Annual Budgets adopted in accordance with strategy. Actual results consistent with Strategy targets
Improvement in asset renewal capacity to achieve sustainability.
Infrastructure Backlog Ratio
Building and Infrastructure Asset Renewal

��
3.2 Infrastructure and Service Management Summarise your council’s key strategies to improve performance against the Infrastructure and service management benchmarks in the 2016-20 period, including the outcomes you expect to achieve. Council endorsed an Asset Management Policy in June 2005 and an Asset Management Strategy and Improvement Plan in its Resourcing Strategy 2012-22. This Strategy and Plan mainly informs the strategies included in this section of the Improvement Plan, with additional actions added to focus on improving Council’s Asset Management Systems, data and processes, including condition data and service levels.
Council’s Strategic Asset Management objectives are to:
· Establish and maintain clear linkages between Council's agreed community driven services and the planning, delivery and performance measurement of our asset management delivery programs (our policy framework).
· Enable and demonstrate responsible and efficient management of Council’s assets to deliver services (our programs). · Establish and embed within the organisation core understanding, appreciation and accountability to enable delivery of mature asset management
practices (our people). · Improve the information, processes and systems supporting the management of our assets (our processes and systems).
Council is the custodian of community assets with a current replacement value of over $4billion. Council does face an increasing challenge to fund the ongoing maintenance and renewal of assets as they become due for replacement. Key strategies for improvement include:
· The full life cost of capital expenditure will be considered before capital projects are approved. Asset renewal, maintenance and operational costs impacting on future budgets will be included in forecasts as part of the capital budgeting process.
· Council will remain a low debt user by maintaining a debt service ratio (principal and interest repayments compared to operational revenue) below 4%
· Council will apply at least 85% of Operational Funds Available for Capital to the renewal of existing assets.

��
Explain the key assumptions that underpin your strategies and expected outcomes.
Asset Model Key Assumptions Assumption Commentary Funding income
Over the past 4 years Council has expended an average of $5.4m per annum in external grant and contribution funding capital renewal of infrastructure items. To calculate future funding expenditure it can be assumed that this amount can be added to the funds for capital renewal, indexed from the 2014/15 figure. This is only reasonable for 2017/18 onward as the earlier years already include such funding components. Council’s adopted capital budget does not include these figures in future years as the amounts are as yet unknown, however, for the purposes of modelling future expenditure for the asset renewal ratio in this report, this amount has been added to the capital budgeted. This can be seen in the below graph.
0
10,000,000
20,000,000
30,000,000
40,000,000
50,000,000
60,000,000
70,000,000
2014 15 2015 16 2016 17 2017 18 2018 19 2019 20
expected grants Renewal budget

��
Condition profile
Current condition profile of most assets is based on regular inspections in the field. However, some asset types do not have field condition, so a condition score is allocated based on the remaining life of the asset. This is reasonable for assets such as stormwater pipes, but not for visual assets. E.g. Councils building stock is componentised and currently holds condition data at the component level, not at the asset (sub-component) level. Condition data is continually being improved and obtained where possible to improve our ‘bring to satisfactory’ amount.
Service levels Council currently costs ‘bring to satisfactory’ for all assets (with the exception of footpaths) to a condition 2 based on advice from auditors and initial engagement on service levels through the ‘Securing our Future’ project. Footpaths were specifically identified in our ‘Securing our Future’ community discussion as being ‘satisfactory’ at condition 3. Further engagement is required specifically on asset service levels, and may result in other asset service levels also being acceptable at condition 3. This would result in a decrease in infrastructure backlog ratio, however in the absence of this information, the existing condition 2 rating is applied.
Funding Maintenance The Asset Maintenance Ratio is shown to be improving in outer years. Council is currently reviewing its maintenance budgets, specifically for buildings maintenance, and has increased maintenance expenditure by $500k indexed annually.
Councils Resourcing Strategy was revised in February 2014 to include ‘Securing our Future’ outcomes, specifically the Special Rate Variation. The graphs below clearly highlight Councils renewal verses depreciation position without the SRV, and now the preferred position, which is with the adopted SRV amendments.

��
Graph 1 shows Council ‘baseline’ position without SRV - Columns indicate renewal costs based on age of assets
Graph 2 shows Councils adopted position with SRV - A stronger and more sustainable position
$0
$20,000
$40,000
$60,000
$80,000
$100,000
$120,000
$140,000
$160,000
$180,000
$200,000
$220,000
$240,000
$260,000
$280,000
2010
2011
2012
2013
2014
2015
2016
2017
2018
2019
2020
2021
2022
2023
2024
2025
2026
2027
2028
2029
2030
2031
2032
2033
2034
2035
2036
2037
2038
2039
2040
2041
2042
2043
Transport Stormwater Buildings Other
Depreciation Planned Renewal OP Funds For CAP

��
3.2 Infrastructure and Service Management
Outline your strategies and outcomes in the table below.
3.2 Infrastructure and service management
Objective Strategies Key milestones Outcome Impact on other measures
Council will remain a low debt user by maintaining a debt service ratio (principal and interest repayments compared to operational revenue) below 4%
a) Debt will be considered as part of the Capital budget process and will only be approved where there is an agreed economic, social, or environmental benefit from a project and other sources of funding are not available. Council will only use debt to fund capital expenditure. The term of any debt shall not exceed the life of the asset it is used to fund
Annual Budgets adopted in accordance with strategy. Actual results consistent with Strategy targets
Debt provides opportunity to improve the delivery of assets and services where required without significantly impacting on financial sustainability.
Operating Performance Ratio
Infrastructure Backlog Ratio Building and Infrastructure Asset Renewal

��
The full life cost of capital expenditure will be considered before capital projects are approved.
Asset renewal, maintenance, and operational costs impacting on future budgets will be included in forecasts as part of the capital budgeting process to ensure future financial sustainability is not adversely impacted.
Annual Budgets adopted in accordance with strategy. Actual results consistent with Strategy targets
Positive operating results are maintained in future years.
Building and Infrastructure Asset Renewal Ratio
Council will apply at least 85% of Operational Funds Available for Capital to the renewal of existing assets.
a) To ensure the vast majority of self-source funds available are directed to asset renewal. This is a budget parameter applied to ensure additional funding available for capital is not unreasonably allocated to new capital works that may negatively impact future financial sustainability.
Annual Budgets adopted in accordance with strategy. Actual results consistent with Strategy targets
Improvement in asset renewal delivery to ensure sustainability capability is transferred to action.
Infrastructure Backlog Ratio Building and Infrastructure Asset Renewal
b) Review Council’s Asset Management Plans: Buildings, Recreation, Stormwater, Plant and Vehicles, Transport;
Review complete by 16/17
Building and Infrastructure Asset Renewal Ratio

��
c) Continue to work with the community to review levels of service;
Ongoing. Targeted project on infrastructure service levels scoped and consultation undertaken in 15/16 and completed in 16/17.
Improved financial and asset management capacity within Council to realise ‘core’ maturity for asset management planning
Implement Council’s detailed Asset Management Improvement Plan
Ongoing In progress
Implement a governance process for review, monitoring and reporting of progress, achievements, costs and risks associated with implementing the asset management improvement program.
Priorities, resources, outcomes and risks to achieve the asset management objectives are identified and acknowledged.
Asset Management Steering Committee (AMSC) established in February 2012.
��
3.3 Efficiency Summarise your council’s key strategies to improve performance against the Efficiency benchmark in the 2016-20 period, including the outcomes you expect to achieve. Council’s adopted Resourcing Strategy includes an efficiency program to be achieved within three years that would reduce forecast expenditure by a minimum of $4.5 million per annum without material impact on service levels. This was an action resulting from the “securing our Future” program. This efficiency program is currently in its first year of delivery reaching its 3rd year in 2016-17. The target is built into the forecast budget with a continued focus on business improvement such as efficiency and productivity gains, and better value for money through:
- Ongoing program of service reviews - Procurement review - Inter-council collaboration through the Joint Organisation - Budget reductions applied to each of Council’s 117 delivery streams as part of the annual budgeting process
Priority budget allocation to actions adopted by Council through Supporting Documents (adopted plans and strategies) Explain the key assumptions that underpin your strategies and expected outcomes. The efficiency program has been built on the principle of the organisation having the capacity to do more with the same or less. This is supported by a corporate program of service reviews and improved business improvement methodology. Further, Council intends on building on this through the scoping for introduction of a formal improvement framework. Current initiatives in 2015 see the investigation of the LEAN methodology. The efficiency target has been incorporated into budgets for each of Council’s 117 delivery streams. The financial model assumptions also apply to this benchmark. Please see section 3.1

��
3.3 Efficiency
Outline your strategies and outcomes in the table below.
Please note Council’s efficiency program is part of an overall sustainability agenda and many of the strategies have already been captured in 3.1.
3.3 Efficiency
Objective Strategies Key milestones Outcome Impact on other measures
Ensure efficiency in delivery of services is continuously improved.
a) Council will maintain an ongoing review of its services that seeks to better define service requirements, refine delivery methods and balance service aims against affordability for both the Council and our customers.
A minimum of three service reviews completed each year.
Annual efficiency targets achieved.
$4.5M operational improvement
Operating performance ratio Real Operating Expenditure
b) Council will deliver procurement savings through improved strategic procurement and collaboration with
Delivery of the Supply Action Plan Delivery of supply contracts through state and regional
Strategic Contracts established Identified savings achieved
Operating performance ratio

��
other authorities and agencies, including the Joint Organisation
collaboration.
c) Collaborate with other councils to explore additional shared service opportunities
Priorities agreed with partner organisations Business cases prepared and supported by the Council and partner organisations Shared service arrangement established
Collaborative arrangements and relationships established
Operating performance ratio
Council will actively pursue grant funding and other contributions to assist in the delivery of core services.
Continue to actively seek grants and contributions to deliver core community infrastructure and services
Development of Applications Approval of grants
Improved capacity to deliver enhanced or existing services.
Operating performance ratio Own source revenue ratio

��
3.4 Improvement Action Plan Summarise the key improvement actions that will be achieved in the first year of your plan.
This action plan builds on Council’s adopted revised Resource Strategy and revised Delivery Program 2012-17. It should be noted however the Integrated Planning and Reporting Act and Guidelines required council’s to prepare a new 4 year delivery program within nine months of the general election. This process will provide an opportunity for a review of councils direction and ensure the actions remain contemporary and in line with trends and other issues.
The improvement action plan remains consistent with the Council’s approved special rate variation conditions and the long term financial strategy.
Action plan
Actions Milestones Reduce Council's discretionary spend (excluding assets) by 2.75%, including the implementation of a 3 year internal efficiency program, with savings to be directed to asset renewal (4.4.5.3)
Target delivered by the end of 2016/17
Apply the special rate variation of 6.24% in 2016-17 (4.4.5.6) Adopted Annual Plan 2016-17 is consistent with Revenue Policy and applied.
Review and increase fees and charges to achieve a minimum of $0.5M by 2016/17 to ensure the financial sustainability of service provision (4.4.5.7)
Adopted Annual Plan2016-17 is consistent with Revenue Policy and applied.
Implement a new business improvement framework, utilising and focussing on information and data available (e.g. PWC benchmarking report) that identifies gaps in performance around our operations.
Business Improvement Framework chosen and commenced rolling out by 2016/17.

��
Explore innovative options to increase revenue at Council facilities (4.4.5.10)
Additional revenue targets achieved through annual budget process.
Continue to undertake pricing reviews to confirm and maintain appropriate subsidy levels (4.4.5.8) Ongoing review.
Allocation of additional funds from the financial sustainability for renewal of major building projects as per capital program, including road resurfacing and reconstruction (deliver road resurfacing and reconstruction program), replacement of below standard playground facilities (develop and implement replacement program), and accelerate footpath renewal (accelerate capital program for footpath renewal). (5.3.2.3; 6.2.1.3; 5.5.2.6; 6.1.3.2)
Additional funds allocated through annual planning cycle process.
Continued delivery of improvements identified in the Strategic Asset Management Plan, internal service level agreements for asset maintenance and capital. (4.4.2.2)
Overarching priorities established. Policy framework adopted. Processes and specific programs and projects identified and delivered. Service level agreements developed and implemented.
Review the maturity assessment bi-annually to ensure continued improvement in asset management planning and practices. (AMP) Rolling program.
Implement outcomes from engagement with the community on levels of service into our asset management system. Further develop performance measures, metrics and rating systems for identified levels of service to reflect the needs and expectations of our community.
Community desired levels of service incorporated into asset management system.
Annually review and report on the completeness and accuracy of the data for all assets using the confidence grading system adopted in the detailed AMPS (AMP)
Reported through the Annual planning and reporting process

��
Develop a long term financial impact statement for West Dapto, informed by the review of the existing West Dapto Infrastructure Plan and West Dapto Section 94 Plan.
Financial impact statement developed. Planning for future additional funding commenced.
Implement the Play Strategy, Aquatics Facilities Strategy and the Sportsfields Strategy to either rationalise, enhance or expand to meet community needs. Ongoing over life of the strategies
Continue to actively seek grants and contributions to deliver core community infrastructure and services (4.4.5.9)
Ongoing action.
Improve the efficiency of supply management in order to achieve operational efficiencies (4.4.5.11)
Ongoing. Partially achieved through the Joint Organisation.
Investigate provision of cremation services across the region and determine Council's role in the market (4.4.2.3)
Council’s role in the market determined.
Implement outcomes of review of opening hours of Unanderra Library (4.3.2.3) Opening hours adjusted.
Review community facilities and consider rationalisation, replacement or refurbishment to achieve facilities that are strategically located, good quality and meet identified community need. Strategy being developed.
Undertake annual service review program (4.4.2.1).
Process improvements and/or financial savings achieved.

��
Ongoing action.
Participate in the shared service activities of the Illawarra Joint Organisation relevant to Wollongong City Council (4.4.1.2 / 4.4.2.1)
Pilot completed. New JO model implemented 2016/17
Continue to undertake Council’s surplus land review (5.3.3.1)
Category 2 lands identified for sale.
*Note – number references equal alignment with current Delivery Program.
* Please attach detailed action plan and supporting financial modelling Attach- WCC Revised Resource Strategy 2012-2022, Revised Delivery Program 2012-17, Draft Annual Plan 2014-15. Strategic Asset Management Plan
Outline the process that underpinned the development of your Action Plan. This Improvement Plan is the culmination of work undertaken for the Securing Our Future Financial Sustainability Review commencing in September, 2013. Council engaged the community in conversations about long-term financial sustainability and the options for financial security via efficiencies, service levels and funding sources. This engagement process with the community went through four phases/steps.
Step 1 – Call for submissions to inform the Citizen’s Panel
In the lead up to the Citizen’s Panel deliberations, Council invited the community to make submissions to the panel via online surveys, open submissions and an online discussion board. There was also a staff workshop.

��
Step 2 – Citizen’s Panel
A panel of 34 randomly selected residents met to review Council services, options for operational efficiencies and revenue opportunities. The appointment of a small diverse, but representative, randomly selected group of citizens in the form of a panel was chosen over quantitative methods to allow them time and support to review information and deliberate together over the challenge. The panel provided a set of recommendations in the form of a report.
Step 3 - Exhibition of the Citizen’s Panel’s report on recommended changes.
With the release of the Citizen’s Panel report, the community were invited to provide feedback on the findings and recommendations. This provided the general community with an opportunity to comment on the proposals.
The engagement was based on the following questions, considering the $21 million operating deficit:
1 What are the priority services for Council to deliver and what level should Council deliver these services?
2 What are the opportunities to achieve operational improvements?
3 How should Council fund the delivery of these services to the desired level?
The majority of participants in step 1 indicated a preference for existing levels of Council service. There were mixed attitudes throughout the engagement regarding streamlining staff efficiencies and projects, conditional rate rises and increases in user pays.
The Citizen’s Panel were particularly focussed on trying to minimise the impact on the ratepayer by ‘tightening the belt’ through efficiencies and service level changes. The panel considered a range of information available to them, including community survey feedback, demographic information, and detailed financial and service output information on each of Council’s 117 service delivery streams. The panel reached consensus on services levels, and whilst a rate rise was not welcomed, the panel accepted a small rate rise was part of the solution given the magnitude of savings required to ensure financial sustainability. The proposed rate was considered by the panel as reasonable for the average rate payer.
Step 3 of the engagement process highlighted the importance of maintaining existing service levels to the community, particularly our rock pools and other social and recreational infrastructure.
Results from the engagement process directly informed the three scenarios/options put forward in the draft Resourcing Strategy.

��
Step 4 –Exhibition of Options, draft Resourcing Strategy and Draft Delivery Program
Following the development of the three options, Council resolved to exhibit the options, draft Resourcing Strategy and draft Delivery Program. The community were asked to consider the options and indicate their preference as well as review and comment on the draft strategies which explain the impacts of each option. The three options reflect the diversity of opinion obtained from the first round of consultation on the Panel’s report.
The community were asked to provide feedback on different combinations of the following elements:
v Efficiencies including possible outsourcing and staff level changes v Service changes including possible cuts, closures or privatisation v Fees and charges increases v Rates increases of varying levels.
The options are summarised as follows:
Option 1: Citizens’ Panel recommendations including service cuts and outsourcing, moderate fee rise, small rate rise.
Option 2: Limited service cuts, moderate fee and rate rise, efficiencies including some outsourcing.
Option 3: More significant rate rise, efficiencies with low impact on services and staff.
The purpose of Step 4 was to measure both the community’s views of acceptable levels of service, and community capacity and appetite for a potential rate rise.
Council placed on exhibition three scenarios in addition to the baseline scenario (status quo), to invest in asset renewal and achieve long term financial sustainability. These scenarios are presented below:
Scenario 1: Efficiencies $7 million, service level adjustments $4.3 million, increased fees & charges $1.6 million and small rate rise (4.8%, 5.5%, 5.5% increase over three years).
Scenario 2: Efficiencies $5 million, service level adjustments $2.3 million, increased fees & charges $370,000 and moderate rate rise (6.3%, 7.0%, 7.0% increase over three years).
Scenario 3: Efficiencies $3.5 million, service level adjustments $1 million, and higher rate rise (7.3%, 8.0%, 8.0% increase over three years).

��
Note is made that each of the above scenarios exclude rate increases for Business Subcategories ‘Heavy 1 Activity 1’ and ‘3c Regional Business (City Centre)’ and special rates (aside from the estimated rate peg) due to the higher than average rates in the dollar already applied to their property values and the application of special rates to specific tasks that are not associated with the financial sustainability issues.
The community were given a number of opportunities to participate in each step of the engagement including online discussion, quick polls and surveys, and kiosks at community locations in each ward. During this stage in particular, the community were engaged through a Securing our Future website, a community newsletter letterbox dropped to more than 80,000 households, a TV commercial and You Tube clip, prominent advertisements in local papers, not to mention a number of stories picked up by these media outlets. Community members submitted letters, emails, quick poll responses and petitions.
Council considered the community feedback on each of the three scenarios given the diversity of opinion consider an alternate “hybrid” scenario. The alternate scenario was prepared in direct response to community feedback and was adopted as the preferred scenario. It remains consistent with Council’s resolution of 9 December 2013:
“Endorse the approach that a combination of increased revenue, operational efficiencies and service adjustments must be part of the solution toward achieving financial sustainability, and therefore is an essential component to the Securing Our Future Review”.
The preferred scenario is as follows: efficiencies $4.5 million (minimum target), service level adjustments $1.5 million, increased fees & charges $500,000 (minimum) and a rate rise yielding $15 million. This would be reflected by a 6.76% rate increase, to those properties impacted by the special rate variation, in each of the next three years inclusive of any rate peg.
This scenario takes into account the strong community feedback to:
· Focus continued efforts on business improvement such as efficiency and productivity gains, and better value for money.
· Limit the need to reduce service levels considered to be core business by the community, and focus on the delivery of services which meet the changing needs of the Wollongong community as evidenced by the strong community opposition to the level of efficiency and service changes proposed by the Citizens’ Panel (Scenario 1).
· Investigate further scenarios for user-pays where appropriate, to minimize the impact of higher rates on community members.
· Seek a special rate variation (SRV) in order to maintain the majority of Council services and deliver quality assets for the community today and for future generations, notwithstanding the points above.
· The SRV takes into account the community’s (including local businesses) capacity to pay and seeks a moderate rate increase as opposed to the highest advertised rate proposed.

��
The Delivery Program was been revised to take into account the community feedback and to reflect the adopted preferred scenario. Council’s Annual Plans and this action plan have been developed following the results of the community engagement and the detail behind the preferred scenario.
3.5 Other actions considered In preparing your Improvement Action Plan, you may have considered other strategies/actions but decided not to adopt them. Please identify what these strategies/actions were and explain why you chose not to pursue them. The funding options in the form of scenarios that were considered to enable Council’s operating result to be in a more sustainable position were discussed in the previous section. As a preferred scenario was determined at the time of the adoption of the revised Resourcing Strategy, a discussion here outlines the proposals that were considered during that time. The scenarios encompass three key focus areas as reflected in the schematic figure.

��
The table below reflects the details on each scenario and the implications for the 3 areas of efficiency, service and revenue.
EFFICIENCY SERVICE REVENUE
Fees and Charges Rates
Scenario 1 $7M
• $3.5M low impact efficiency dividend
• $3.5M higher impact – outsource management of tourist parks, review Russell Vale Golf Course, some operational activities, reduce back office resourcing, integrate management at key facilities, Employee Enterprise Agreement.
$4M
Includes sale of some facilities (including Lakeside Leisure Centre, closure of the cremators’ operations and Unanderra Library, 10% playgrounds, parks and community centres), and reduction in others (ocean rock pools, pool season, street sweeping, cadet and apprenticeship program, events funding, urban renewal program, discontinuation of the Crown Street Façade Program).
$1M extend lives of footpaths.
$1.6M
Increase in fees and charges for car parking, heated pools, fitness trainers, sports fields, community pools (gold coin donation).
$8.4M
2.5% for each year for three years over and above 2.3% rate cap.
NOTE: Proposals for increases to fees and charges are over and above the annual increases associated with indicates and statutory changes and will be reviewed as part of the annual planning process.
Scenario 1 is based upon the Citizen’s Panel recommendations which are detailed in the Citizens Panel Report. It was the view of the Panel that this combination of recommendations reflects a balanced approach and is based on all of the information and data made available to it by Council. The Panel made its recommendations in an effort to minimise the impact on the least number of people and to minimise the impact on rates. Scenario 1 therefore includes a maximum rates increase of 2.5% per annum over and above the rate peg for three years, together with operational efficiencies and service reductions. Impacts of this scenario are estimated to be a real increase of $102.71 for the average household after three years. There would also be a localised impact on the specific removal or reduction of services, although the risk is lower of unplanned service reduction due to failure to renew assets and a better quality of service (because of renewed services) than the baseline.
The Panel includes several proposals that have been interpreted as follows:

��
· Lakeside Leisure Centre – Disposal of land and facility. The Panel considered that future demand will be met by new facilities at West Dapto. This proposal suggests closing the asset and selling the land.
· Pensioner interest – remove interest exemption for full payment by May from Pensioner Policy. Pensioners are currently exempted from paying interest on overdue rates. The proposal is to discontinue doing this, so they are charged interest in line with the remaining rate paying population.
· Unanderra Library – Closure of library service. This proposal refers to the library service only. It does not recommend disposal of the building as it is attached to the Unanderra Community Centre. The Panel’s decision took into account spatial, budgetary and utilisation information.
· Urban Renewal and Civic Improvement - halve the current program $300,000. This proposal recommends the reduction in the Urban Renewal and Civic Improvement Planning program, including the number of town and village centre plans undertaken each year.
· Pensioner waste exemptions – remove exemption. Elimination of the fee waiver for waste disposal (general and green waste) at Whytes Gully for Pensioners (i.e. charge them the same as everyone else). Based on the free twice yearly household pick up, this additional service was identified as no longer as great a need as previously.
· Crematorium - Exit the cremation operations and potential demolition of this part of the facility. This proposal includes closure of the existing ageing cremators. The surrounding Memorial Gardens (inclusive of infrastructure) is to continue to operate.
· Tourist Parks - lease - outsource all. The tourist parks at Bulli, Corrimal and Windang are located on Crown Land and managed under Trust. This proposal suggests externally sourcing the management and operations of the three tourist parks currently directly managed by Council staff.
Like all of the scenarios, Scenario 1 includes an efficiency target, however unlike Scenario 2 and 3 it has a higher degree of efficiency to be achieved via significant change to work practice, structure and service delivery models. These are referred to in the scenarios as high impact. Low impact refers primarily to a budget reduction without a major impact on staffing, industrial relations or service delivery.
The Panel’s recommendations could directly impact approximately 7% of the workforce and may result in reduced employment options. However, while there would be less employment directly provided by Council, there would be indirect local employment stimulation via contractors undertaking the bulk of the enhanced works program which will be funded by the savings.

��
3-year annual increase
Net SRV Increase (three year total) Average
Total Rates Increase incl. Rate Page (three year total) Average
Net SRV Increase per week Average
Total Rates Increase per week (total – SRV + Rate Peg) Average
$ $ $ $ SCENARIO 1 House 2.5% 102.71 215.75 1.98 4.15
Pensioner 102.67 215.68 1.97 4.15 Strata 67.45 141.68 1.3 2.72 Business
Scenario 2
Using the Citizen’s Panel recommendations as a starting point, Scenario 2 reflects community feedback and analysis from officers. It identifies where community feedback indicates strong opposition to key change points, particularly service reductions, but balances this with analysis of data and information that maintains some of the Panel’s key recommendations. Scenario 2 therefore includes a rates increase of 4% per annum above the rate peg for three years. Impacts of this scenario are higher rates, with an average increase of $166.72 after three years. There would be lower localised service level impacts compared to Scenario 1 and there would be lower risk of unplanned service reduction due to failure to renew assets, and a better quality of service (because of renewed assets) compared to the baseline.

��
EFFICIENCY SERVICE REVENUE
Fees and Charges Rates
Scenario 2 $5M
• $3.5M low impact efficiency dividend
• $1.5M higher impact - outsource management of tourist parks, review Russell Vale Golf Course, some operational activities, reduce back office resourcing, integrate management at key facilities.
$2.3M
Includes sale/outsourcing of Lakeside Leisure Centre, 10% playgrounds, parks and community centres, withdrawal (or lease or joint venture) of cremators’ operations, discontinuation of the Crown Street Façade Project.
$1M extend lives of footpaths.
$370K
Increase in fees and charges for leasing child care facilities, car parking, heated pools, and fitness trainers.
$13.4M
4% for each year for three years over and above 2.3% rate cap.
NOTE: Proposals for increases to fees and charges are over and above the annual increases associated with indicates and statutory changes and will be reviewed as part of the annual planning process.
Providing a variation of the Citizen’s Panel recommendations, Scenario 2 provides some variation to the recommendations in Scenario 1. For example, in addition to the closure and demolition of the cremators, Council may also choose to explore the feasibility of a joint venture or a lease to a private operator willing to invest in modern cremators. The tourist parks, if pursued, would need to be market tested as would any other outsourcing proposal. Market testing Lakeside may find a provider willing to operate the facility and maintain a similar service due to lower labour costs. Many of these options would need to be further explored.
Scenario 2 could impact on the workforce at a similar level to Scenario 1. However, it also could result in direct employment stimulation via contractors undertaking the bulk of the enhanced works program which will be funded by the savings.

��
3-year annual increase
Net SRV Increase (three year total) Average
Total Rates Increase incl. Rate Page (three year total) Average
Net SRV Increase per week Average
Total Rates Increase per week (total – SRV + Rate Peg) Average
$ $ $ $ SCENARIO 2 House 4% 166.72 279.76 3.21 5.38
Pensioner 166.66 279.67 3.21 5.38 Strata 109.48 183.71 2.11 3.53 Business* …
Scenario 3
This scenario explores the option to focus primarily on revenue (rates) and internal efficiencies. This responds to the call by some members within the community to leave services as they are. This means a more significant increase in rates of 5% for three years above the rate peg, with the average increase of $210.40 after the three years. There would be internal efficiency gains delivered with minimal service reductions. There would also be minimal employment reductions (the reductions would be offset by indirect employment stimulation via local contractors), but more significant financial impacts for the ratepayer. There would be a lower risk of unplanned service reduction due to failure to renew assets and a better quality of service (because of renewed assets) compared to the baseline.
EFFICIENCY SERVICE REVENUE
Fees and Charges Rates
Scenario 3 $3.5M
$3.5M low impact efficiency dividend.
$1M
$1M extend lives of footpaths.
$16.5M
5% for each year for three years over and above the 2.3% rate cap.
NOTE: Proposals for increases to fees and charges are over and above the annual increases associated with indicates and statutory changes and will be reviewed as part of the annual planning process.

��
3-year annual increase
Net SRV Increase (three year total) Average
Total Rates Increase incl. Rate Page (three year total) Average
Net SRV Increase per week Average
Total Rates Increase per week (total – SRV + Rate Peg) Average
$ $ $ $ SCENARIO 3 House 5% 210.40 323.44 4.05 6.22
Pensioner 210.34 323.34 4.04 6.22 Strata 138.17 212.40 2.66 4.08 Business* … … … …
Scenario 4 – Not Recommended
A fourth scenario was scoped that only included service adjustments and efficiencies as an option (with no rates increase above the annual rate peg) but it is not recommended. It included $7.0 million efficiency measures and $14.0 million in service adjustments. This would mean a significant reduction of non-mandated services, significant market testing to outsource delivery of Council’s community, cultural, recreational and environmental services, an estimated six year delivery due to phase in of significant workforce and service change, a reduction of 20% in staffing establishment, and impact on the delivery of Wollongong 2022.
Community response during the Citizen’s Panel exhibition period that indicated strong opposition to significant service reductions has resulted in this option being excluded from the recommended scenarios.

��
4. How will your plan improve performance?
4.1 Expected improvement in performance Measure/ benchmark 2014/15 2015/16 2016/17 2017/18 2018/19 2019/20 Achieves FFTF
benchmark?
Operating Performance Ratio (Greater than or equal to break-even average over 3 years) -3.97% -3.38% -0.94% 0.23% 2.01% 2.83% Yes
Own Source Revenue Ratio (Greater than 60% average over 3 years)
78.05% 81.20% 81.92% 83.11% 84.30% 86.13% Yes
Building and Infrastructure Asset Renewal Ratio (Greater than100% average over 3 years)
63.38% 78.55% 95.09% 97.65% 99.52% 100.12% Yes
Infrastructure Backlog Ratio (Less than 2%)
6.40% 6.49% 6.43% 6.42% 5.53% 4.87% No
Asset Maintenance Ratio (Greater than 100% average over 3 years)
81.92% 91.81% 98.34% 99.35% 99.56% 100.28% Yes
Debt Service Ratio (Greater than 0% and less than or equal to 20% average over 3 years)
2.28% 2.79% 2.96% 3.07% 2.98% 2.89% Yes
Real Operating Expenditure per capita A decrease in Real Operating Expenditure per capita over time
1.02 1.01 1.00 0.99 0.98 0.97 Yes
4

��
4.1 Expected improvement in performance If, after implementing your plan, your council may still not achieve all of the Fit for the Future benchmarks, please explain the likely reasons why. Infrastructure Backlog Ratio:
The use of written down value in the denominator of the Infrastructure Backlog Ratio is problematic as is the term "satisfactory condition" in the numerator, for reasons identified in section 2.3. Further, the notions that appear to be espoused in the OLG documents now measure assets that are within a life cycle and not due for renewal as backlog in the numerator of this calculation.
Council is seeing a significantly improving renewal ratio due to expenditure increases in asset renewal budget, and as a result Councils backlog position is shown to progressively decrease out beyond 2020. Improvements in condition data modelling, clarification of the definition from OLG regarding satisfactory condition, and use of ‘Current Replacement Cost’ instead of WDV would result in an improved position.
At 2014/15 Councils total infrastructure Written Down Value is $1.4b, while total replacement cost is $3.2b. The calculated cost to bring to satisfactory is $93m. The ratio utilising replacement cost in the denominator results at 2.9% for the current year. This ratio constantly decreases for future years as tabled below.
Year CRC backlog ratio
14/15 2.90% 15/16 2.88% 16/17 2.78% 17/18 2.56% 18/19 2.30% 19/20 2.01%

��
5. Putting your plan into action How will your council implement your Improvement Action Plan? The actions detailed within this plan will be directly referred to as key deliverables within Council’s Annual (operational) Plan each year. As such progress will be reported to Council via the Quarterly Reviews and Annual Report. In addition, updates will be provided to Council’s Corporate Governance Committee and Audit Committee consisting an independent Chair, Councillors and attended by Council management.
In addition, as a key element to Council’s improvement plan is the special rate variation, reports on compliance with regard to the IPART’s determination will also be required as part of the Annual Report.
Supporting this, Councils Asset Steering Committee oversees the implementation of items raised in our Strategic Asset Management Plan, in particular detailed improvements at an asset management and financial level.
5

��
ATTACHMENTS:
1. Council Resolution, 22 June 2015 2. Financial Benchmarks Worksheets and Notes at June 2015 3. Infrastructure Benchmarks Worksheets and Notes at June 2015 4. Wollongong City Council Annual Plan 2015-16 & Budget (Attachment 1) 5. Wollongong 2022 – Community Strategic Plan 6. Wollongong City Council Revised Resourcing Strategy 2012-2022 (Adopted 17 February 2014) 7. Wollongong City Council Application to IPART for a Special Rate Variation for 2014/15, Part B (February, 2014) 8. Wollongong City Council Application to IPART for a Special Rate Variation for 2014/15 – Attachment 1: Securing our Future Community
Engagement Report (February, 2014)