Corporate Presentation -...
26
Corporate Presentation March 2018
Transcript of Corporate Presentation -...
Corporate
Presentation
March 2018
Forward-lookingStatements
This presentation may contain forward-looking statements, thatshould be considered as good faith estimates. Such statements aresubject to risks and uncertainties outside of CMPC´s control thatcould cause the CMPC’s actual results to differ materially fromthose set forth in the forward-looking statements. These risksinclude in particular those described in CMPC’s FinancialStatements, Note 3 (“Gestión de Riesgos”).
Forward-looking statements speak only as of the date they aredelivered, CMPC undertake no obligation to publicly update orrevise them considering developments which differ from thoseanticipated.
I. CMPC
at a glance
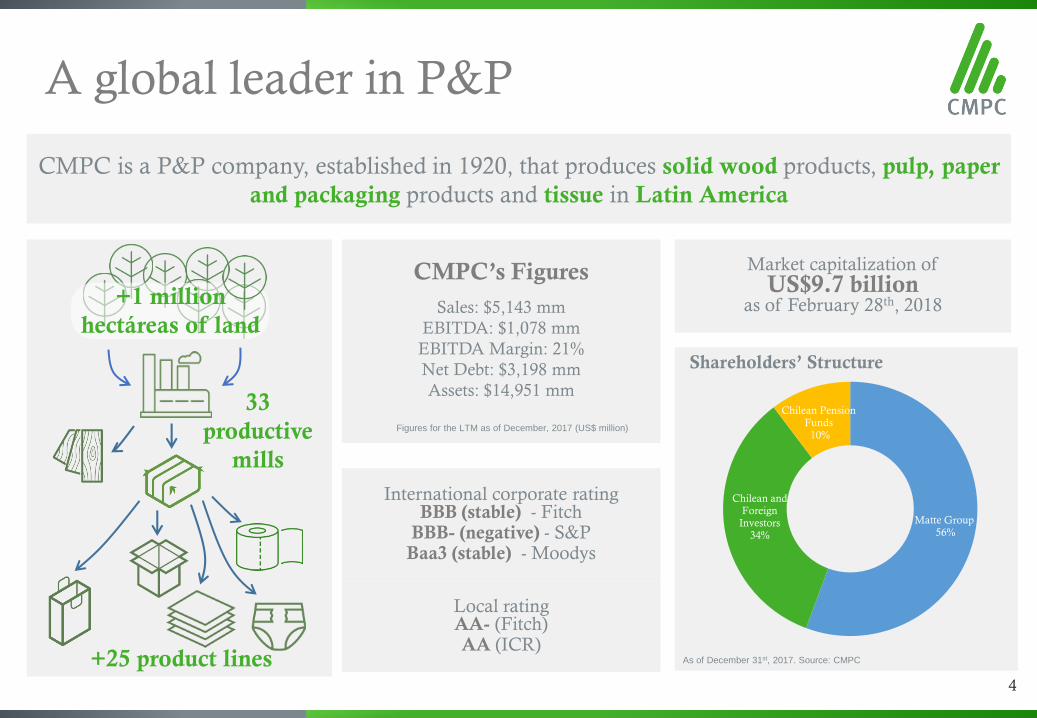
Matte Group56%
Chilean and Foreign
Investors 34%
Chilean Pension Funds
10%
4
A global leader in P&P
CMPC is a P&P company, established in 1920, that produces solid wood products, pulp, paper
and packaging products and tissue in Latin America
International corporate rating BBB (stable) - Fitch
BBB- (negative) - S&PBaa3 (stable) - Moodys
Local ratingAA- (Fitch)AA (ICR)
CMPC’s Figures
Sales: $5,143 mm
EBITDA: $1,078 mm
EBITDA Margin: 21%
Net Debt: $3,198 mm
Assets: $14,951 mm
Shareholders’ Structure
Market capitalization of
US$9.7 billion as of February 28th, 2018
Figures for the LTM as of December, 2017 (US$ million)
As of December 31st, 2017. Source: CMPC
+1 million
hectáreas of land
33
productive
mills
+25 product lines
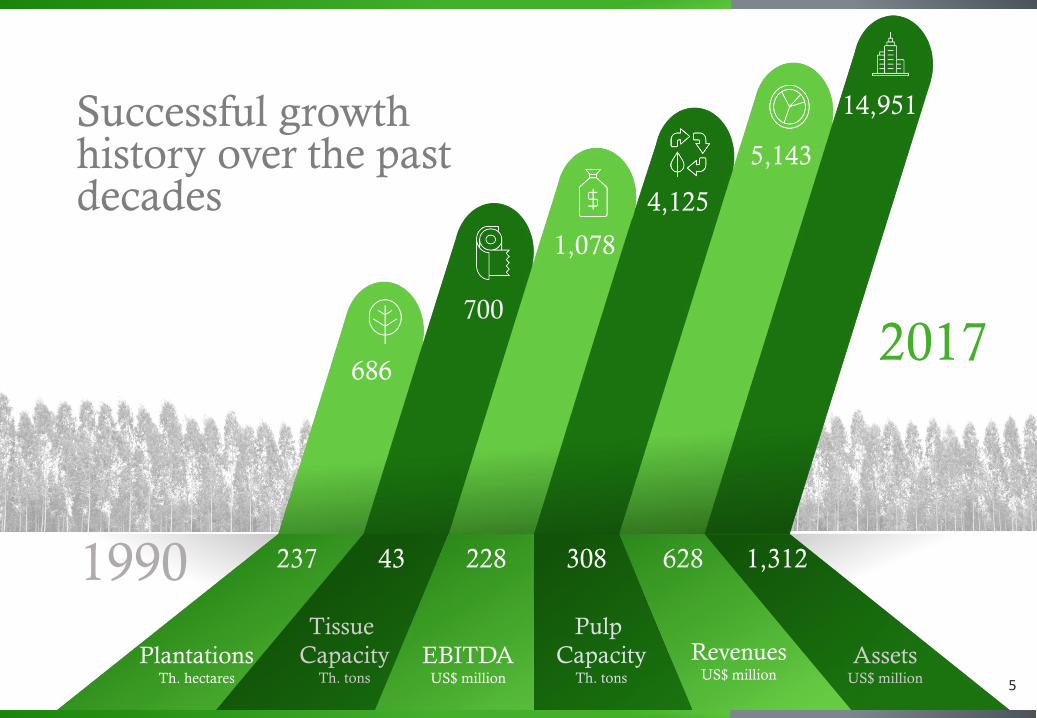
1,078
1990
2017
1,312
14,951
686
4,125
700
237 30843 628
AssetsUS$ million
PlantationsTh. hectares
Pulp
CapacityTh. tons
Tissue
CapacityTh. tons
RevenuesUS$ million
Successful growth history over the past decades
228
EBITDAUS$ million
5,143
5
Source: CMPC, RISI 15-year Forecast (2016-2031) & PPPC- Dec 2016
I
6
II. CMPC’s Value Proposal
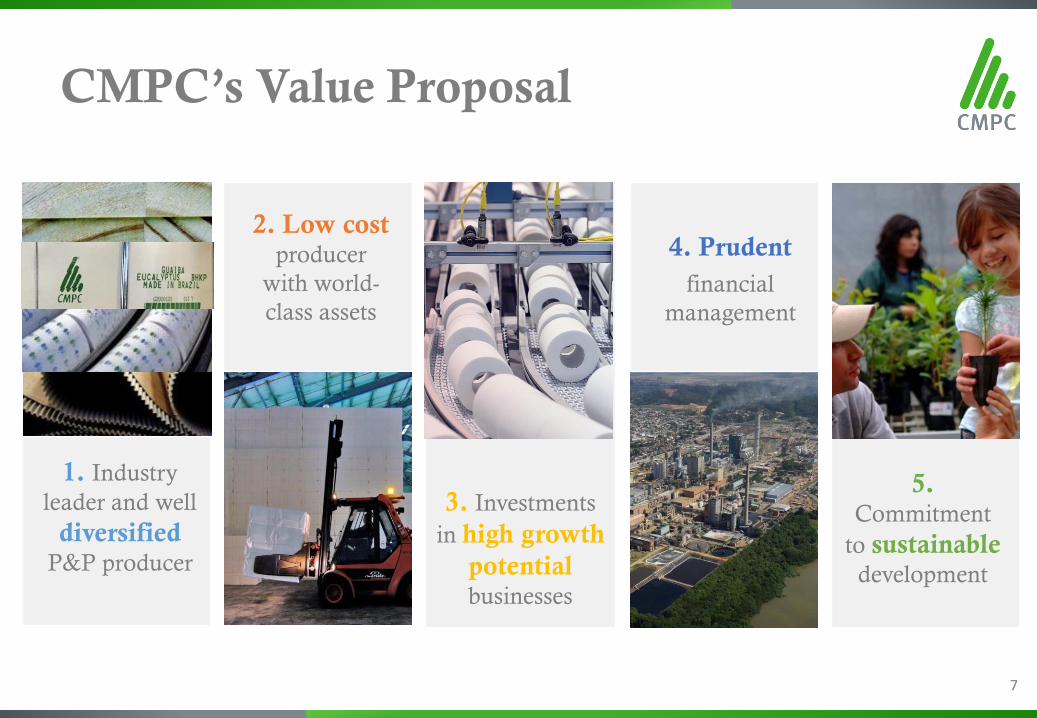
CMPC’s Value Proposal
1. Industry
leader and well
diversifiedP&P producer
7
2. Low cost producer
with world-
class assets
4. Prudent
financial
management
5. Commitment
to sustainabledevelopment
3. Investments
in high growth
potential businesses
8
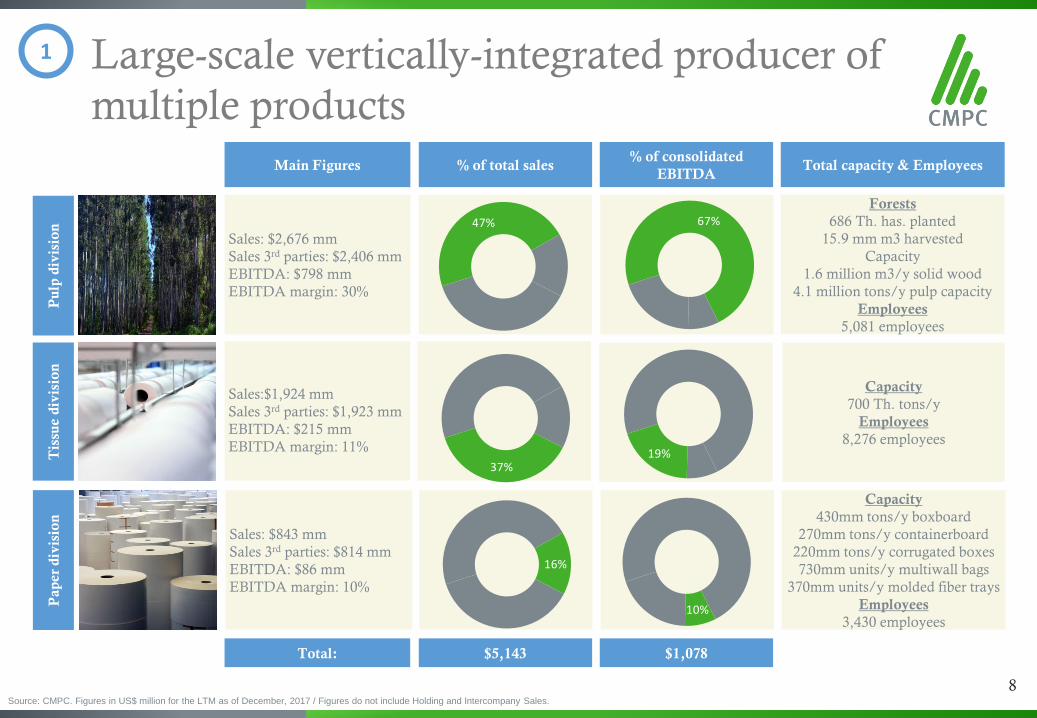
Large-scale vertically-integrated producer of
multiple products
Main Figures % of total sales% of consolidated
EBITDATotal capacity & Employees
Pu
lp d
ivis
ion
Sales: $2,676 mm
Sales 3rd parties: $2,406 mm
EBITDA: $798 mm
EBITDA margin: 30%
Forests
686 Th. has. planted
15.9 mm m3 harvested
Capacity
1.6 million m3/y solid wood
4.1 million tons/y pulp capacity
Employees
5,081 employees
Pap
er
div
isio
n
Sales: $843 mm
Sales 3rd parties: $814 mm
EBITDA: $86 mm
EBITDA margin: 10%
Capacity
430mm tons/y boxboard
270mm tons/y containerboard
220mm tons/y corrugated boxes
730mm units/y multiwall bags
370mm units/y molded fiber trays
Employees
3,430 employees
Tis
sue d
ivis
ion
Sales:$1,924 mm
Sales 3rd parties: $1,923 mm
EBITDA: $215 mm
EBITDA margin: 11%
Capacity
700 Th. tons/y
Employees
8,276 employees
$5,143 $1,078Total:
Source: CMPC. Figures in US$ million for the LTM as of December, 2017 / Figures do not include Holding and Intercompany Sales.
1
47% 67%
37%19%
16%
10%
9
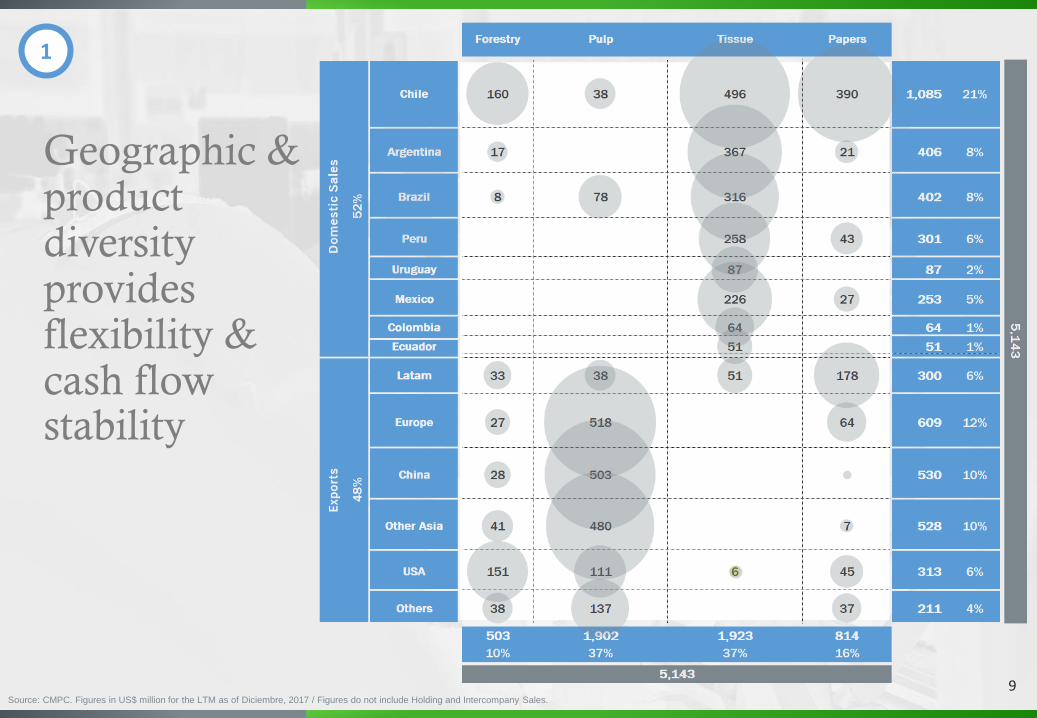
Geographic & productdiversityprovidesflexibility & cash flowstability
Source: CMPC. Figures in US$ million for the LTM as of Diciembre, 2017 / Figures do not include Holding and Intercompany Sales.
1
10
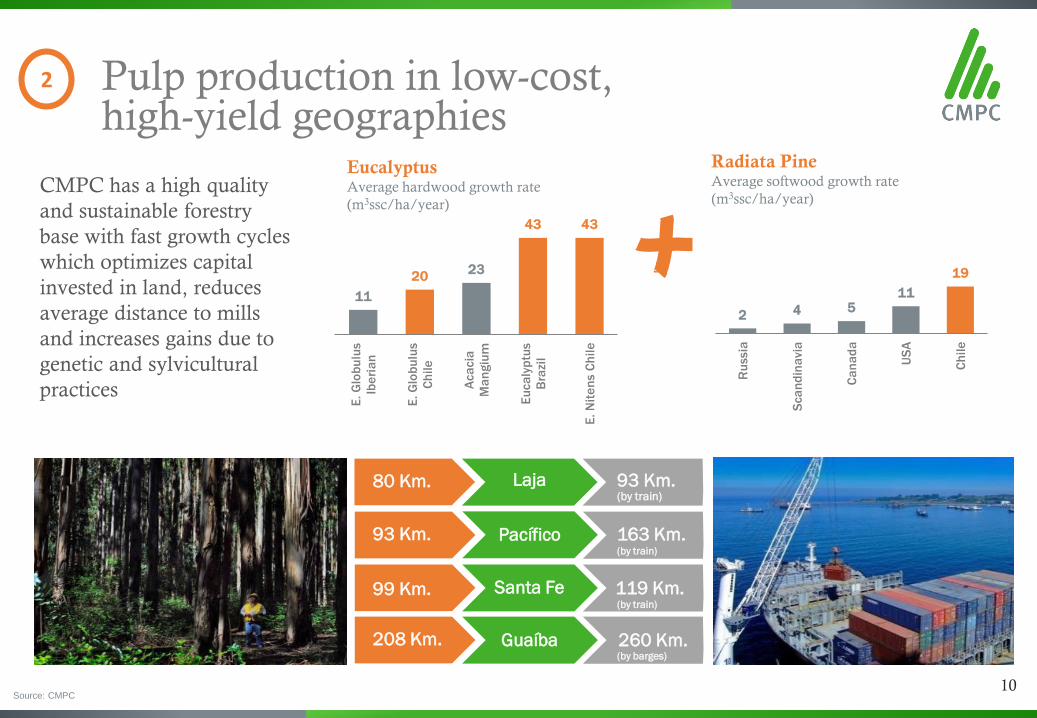
Pulp production in low-cost, high-yield geographies
2
Source: CMPC
Radiata PineAverage softwood growth rate
(m3ssc/ha/year)
EucalyptusAverage hardwood growth rate
(m3ssc/ha/year)
CMPC has a high quality
and sustainable forestry
base with fast growth cycles
which optimizes capital
invested in land, reduces
average distance to mills
and increases gains due to
genetic and sylvicultural
practices
163 Km.
93 Km.
119 Km.
208 Km.
80 Km.
93 Km.
99 Km.
260 Km.
(by train)
(by train)
(by train)
(by barges)
Laja
Guaíba
Pacífico
Santa Fe
11
2023
43 43
E. G
lob
ulu
s
Ibe
ria
n
E. G
lob
ulu
s
Ch
ile
Aca
cia
Ma
ng
ium
Eu
ca
lyp
tus
Bra
zil
E. N
ite
ns C
hile
2 4 511
19
Ru
ssia
Sca
nd
ina
via
Ca
na
da
US
A
Ch
ile
0
100
200
300
400
500
600
700
0 5,000 10,000 15,000 20,000 25,000
0
100
200
300
400
500
600
700
0 5,000 10,000 15,000 20,000 25,000 30,000
11
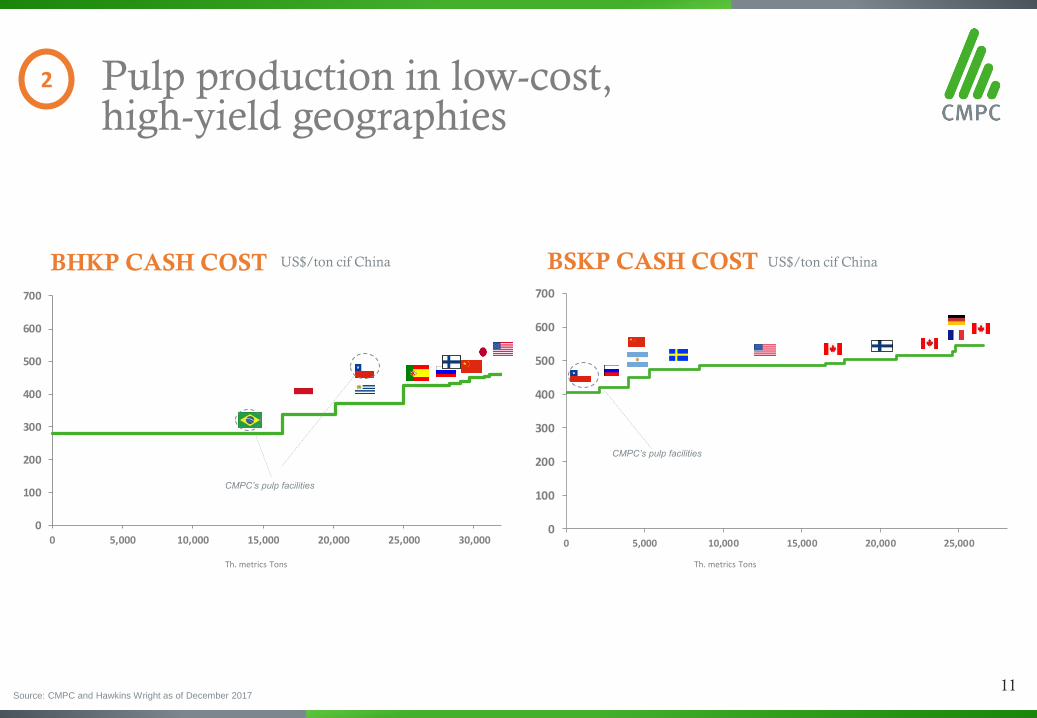
Pulp production in low-cost, high-yield geographies
2
BSKP CASH COST US$/ton cif China
Th. metrics Tons
CMPC’s pulp facilities
BHKP CASH COST US$/ton cif China
Th. metrics Tons
CMPC’s pulp facilities
Source: CMPC and Hawkins Wright as of December 2017
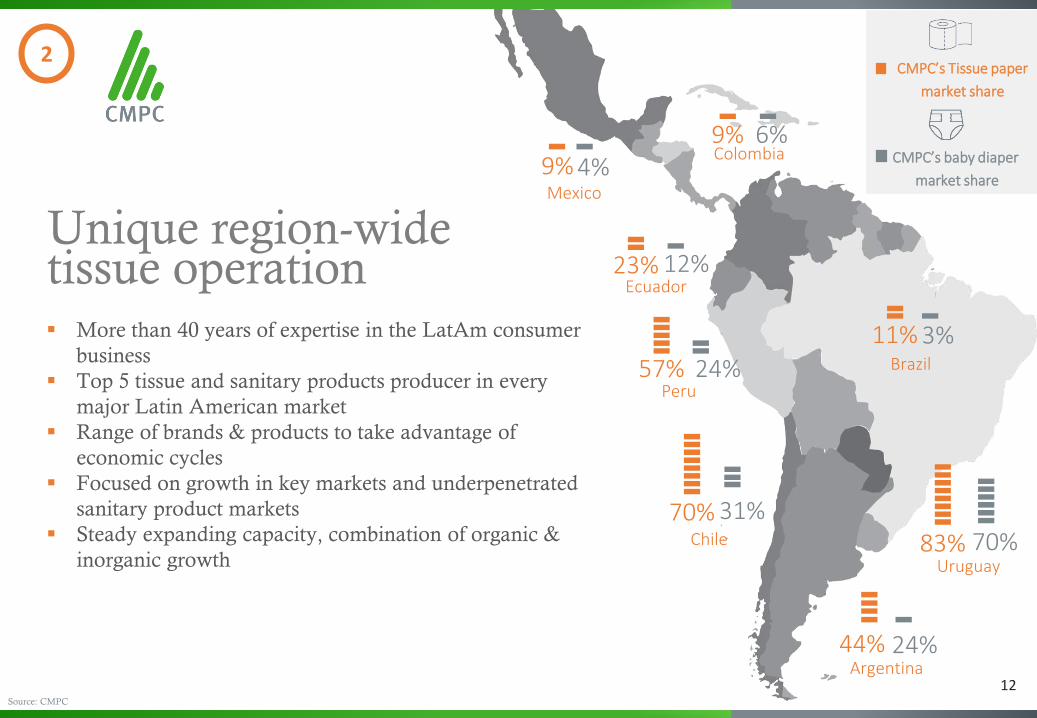
Unique region-wide tissue operation More than 40 years of expertise in the LatAm consumer
business
Top 5 tissue and sanitary products producer in every
major Latin American market
Range of brands & products to take advantage of
economic cycles
Focused on growth in key markets and underpenetrated
sanitary product markets
Steady expanding capacity, combination of organic &
inorganic growthChile
Brazil
Colombia
Mexico
44%
83%
9%9%
57%
11%
23%
Peru
Ecuador
Argentina
Uruguay
70%
CMPC’s Tissue paper
market share
12Source: CMPC
CMPC’s baby diaper
market share4%
24%
70%
6%
24%
3%
12%
31%
2
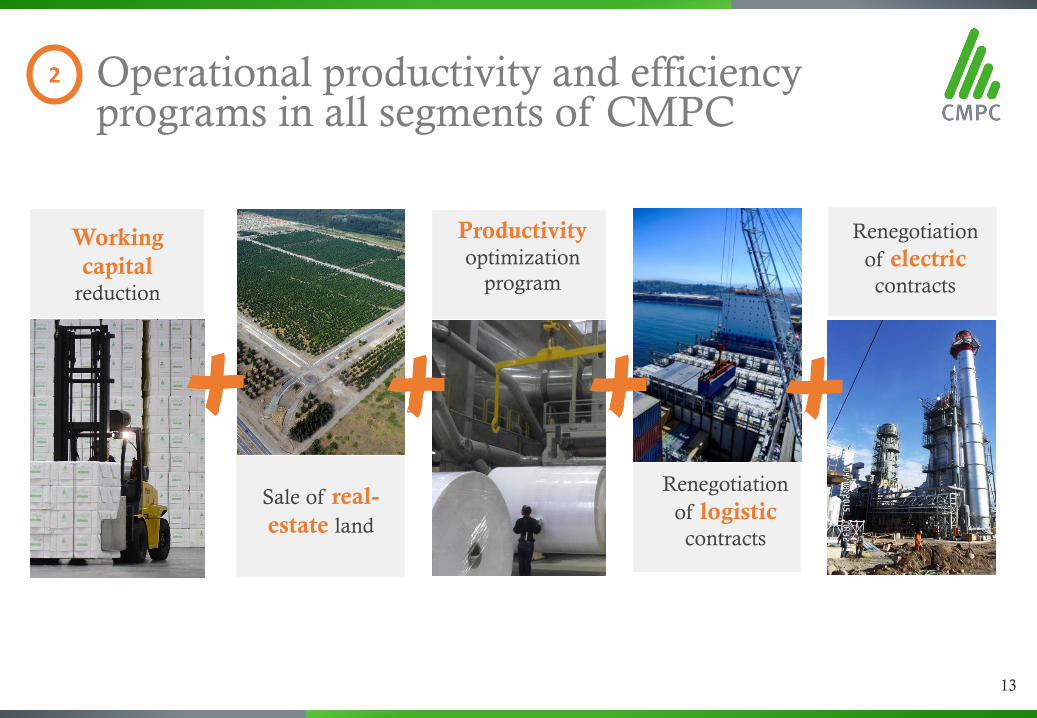
Renegotiation
of electriccontracts
Renegotiation
of logisticcontracts
Operational productivity and efficiency programs in all segments of CMPC
13
Productivity optimization
program
Sale of real-
estate land
Working
capital reduction
2
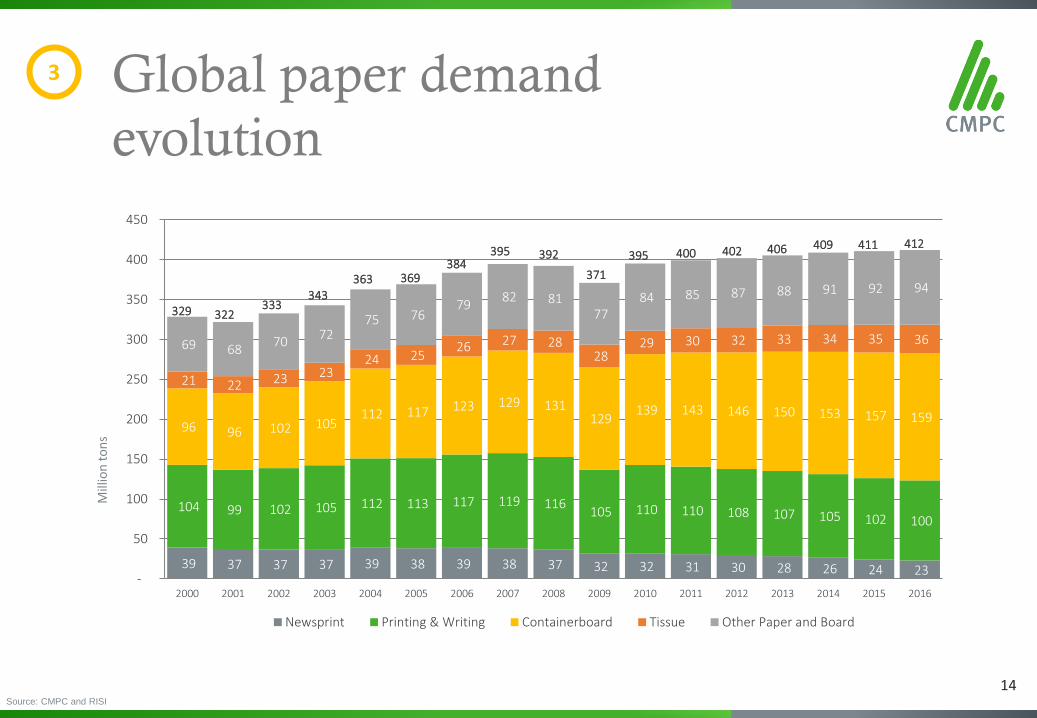
Global paper demand
evolution
Source: CMPC and RISI
14
Mill
ion
to
ns
3
39 37 37 37 39 38 39 38 37 32 32 31 30 28 26 24 23
104 99 102 105 112 113 117 119 116 105 110 110 108 107 105 102 100
96 96 102 105 112 117 123 129 131
129 139 143 146 150 153 157 159
21 22 23 23 24 25
26 27 28 28
29 30 32 33 34 35 36 69 68 70
72 75 76
79 82 81
77 84 85 87 88 91 92 94
-
50
100
150
200
250
300
350
400
450
2000 2001 2002 2003 2004 2005 2006 2007 2008 2009 2010 2011 2012 2013 2014 2015 2016
Newsprint Printing & Writing Containerboard Tissue Other Paper and Board
329 322333
343
363 369384
395 392
371
395 400 402 406 409 411 412
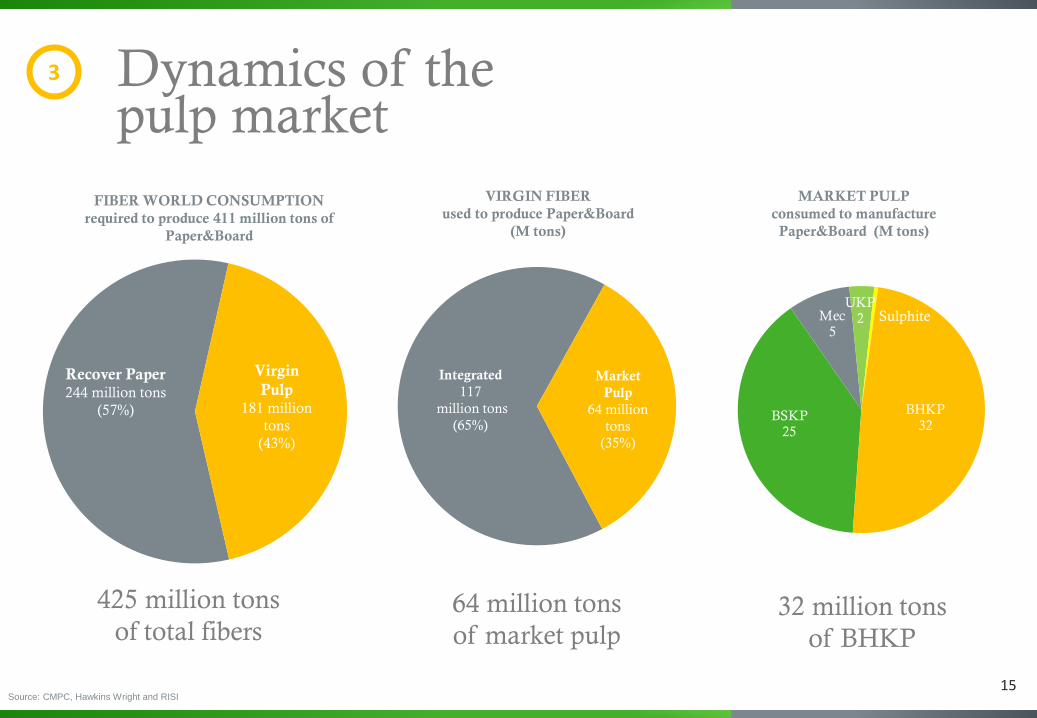
BHKP32
BSKP25
Mec5
UKP2
425 million tons
of total fibers64 million tons
of market pulp32 million tons
of BHKP
FIBER WORLD CONSUMPTION
required to produce 411 million tons of
Paper&Board
VIRGIN FIBER
used to produce Paper&Board
(M tons)
MARKET PULP
consumed to manufacture
Paper&Board (M tons)
Dynamics of the pulp market
Source: CMPC, Hawkins Wright and RISI15
Recover Paper244 million tons
(57%)
Virgin
Pulp181 million
tons
(43%)
Integrated
117
million tons
(65%)
Market
Pulp
64 million
tons
(35%)
Sulphite
3
16
Tissue Paper Demand Dynamics
IndiaPhilippines
IndonesiaVietnam
Thailand
RussiaEcuador
Colombia
MalaysiaChinaPeru
VenezuelaBrazil
Argentina
Mexico
Taiwan
CroatiaHungary
ChileCosta Rica Italy FrancePortugalSpain Australia
NetherlandsNew ZealandIsrael
IrelandUKFinland Denmark
SwitzerlandGermanyAustria
Sweden
Hong KongCanada
USA
0
5
10
15
20
25
0 5 10 15 20 25 30 35 40 45 50
Source: CMPC as of December 2015
Tiss
ue
Pap
erA
pp
.Co
nsu
mp
tio
n(k
/hab
)
GDP per capita in US$’000
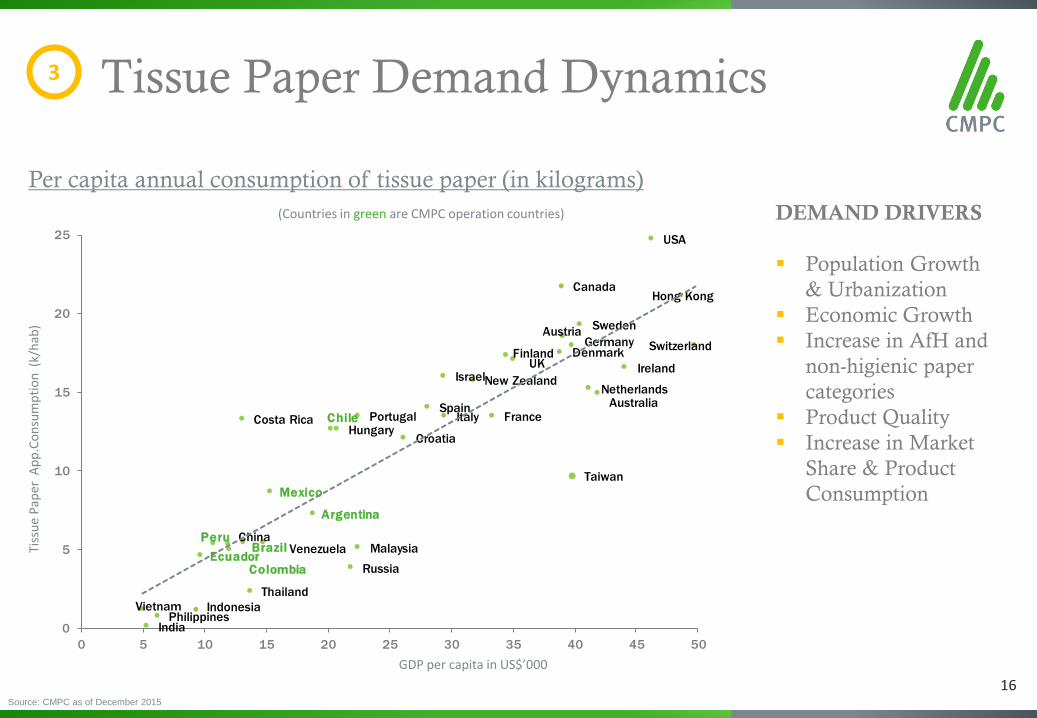
Per capita annual consumption of tissue paper (in kilograms)
(Countries in green are CMPC operation countries) DEMAND DRIVERS
Population Growth
& Urbanization
Economic Growth
Increase in AfH and
non-higienic paper
categories
Product Quality
Increase in Market
Share & Product
Consumption
3
17
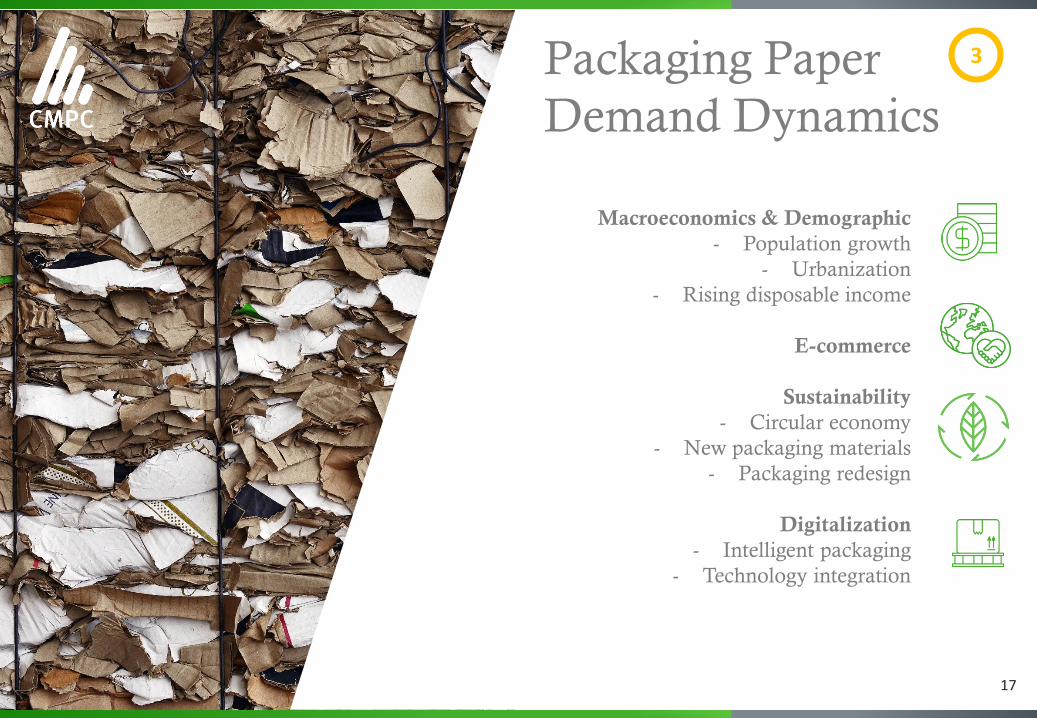
Packaging Paper
Demand Dynamics
3
Macroeconomics & Demographic
- Population growth
- Urbanization
- Rising disposable income
E-commerce
Sustainability
- Circular economy
- New packaging materials
- Packaging redesign
Digitalization
- Intelligent packaging
- Technology integration
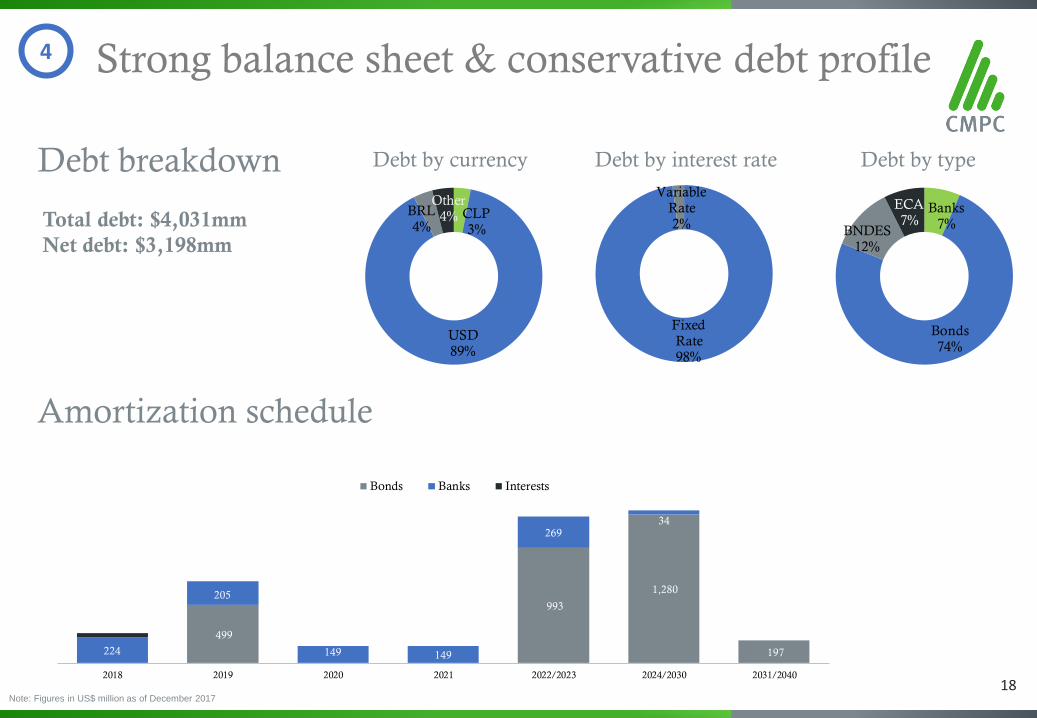
Debt breakdown
18
Debt by currency Debt by interest rate Debt by type
Note: Figures in US$ million as of December 2017
Strong balance sheet & conservative debt profile
Amortization schedule
Total debt: $4,031mm
Net debt: $3,198mm
4
Banks7%
Bonds74%
BNDES12%
ECA7%
Fixed Rate98%
Variable Rate2%
CLP3%
USD89%
BRL4%
Other4%
-
499
- -
993
1,280
197 224
205
149 149
26934
2018 2019 2020 2021 2022/2023 2024/2030 2031/2040
Bonds Banks Interests
19Source: CMPC
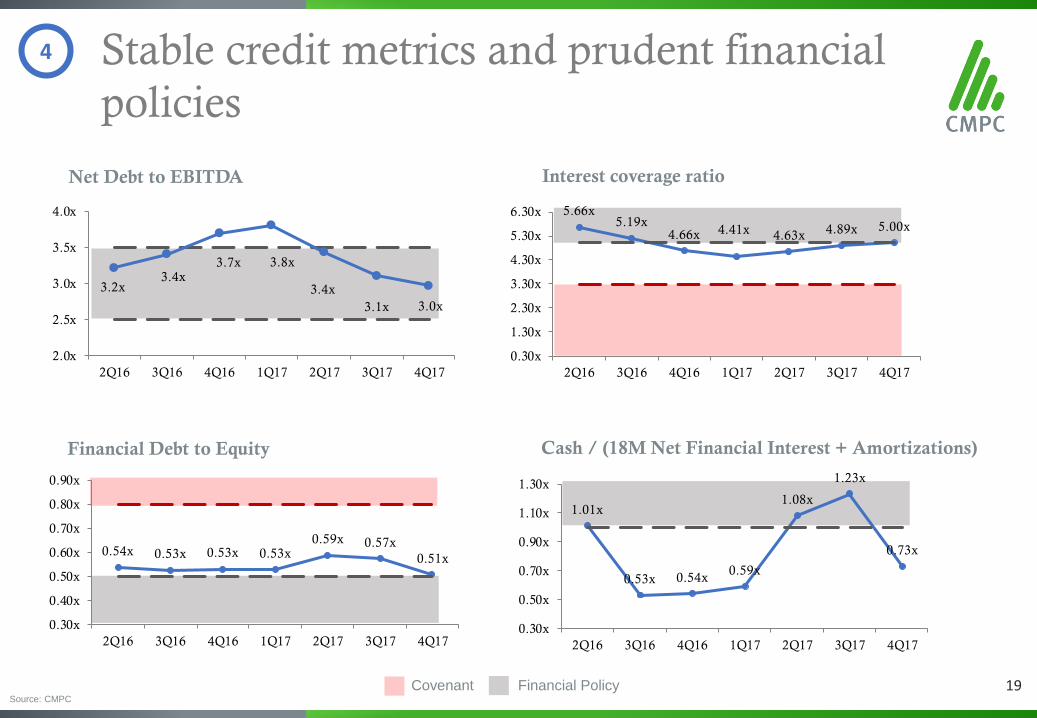
Interest coverage ratioNet Debt to EBITDA
Stable credit metrics and prudent financial
policies
Cash / (18M Net Financial Interest + Amortizations)Financial Debt to Equity
Covenant Financial Policy
4
3.2x3.4x
3.7x 3.8x
3.4x
3.1x 3.0x
2.0x
2.5x
3.0x
3.5x
4.0x
2Q16 3Q16 4Q16 1Q17 2Q17 3Q17 4Q17
5.66x5.19x
4.66x 4.41x 4.63x4.89x 5.00x
0.30x
1.30x
2.30x
3.30x
4.30x
5.30x
6.30x
2Q16 3Q16 4Q16 1Q17 2Q17 3Q17 4Q17
0.54x 0.53x 0.53x 0.53x0.59x 0.57x
0.51x
0.30x
0.40x
0.50x
0.60x
0.70x
0.80x
0.90x
2Q16 3Q16 4Q16 1Q17 2Q17 3Q17 4Q17
1.01x
0.53x 0.54x0.59x
1.08x
1.23x
0.73x
0.30x
0.50x
0.70x
0.90x
1.10x
1.30x
2Q16 3Q16 4Q16 1Q17 2Q17 3Q17 4Q17
20Source: CMPC
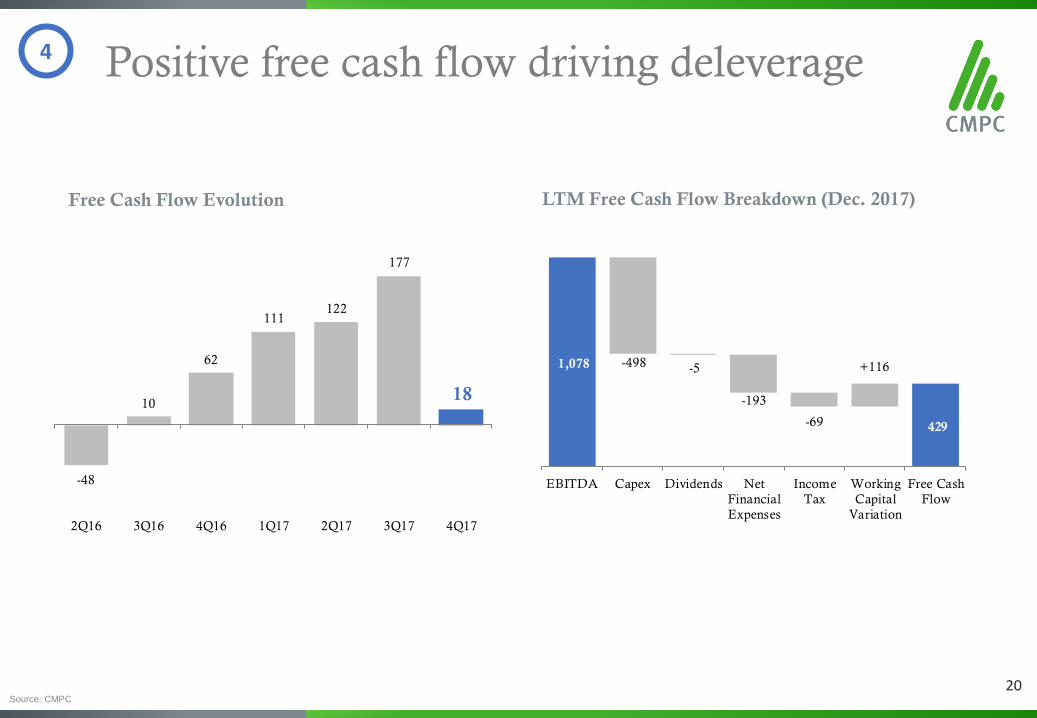
Positive free cash flow driving deleverage
LTM Free Cash Flow Breakdown (Dec. 2017)Free Cash Flow Evolution
4
-48
10
62
111122
177
18
2Q16 3Q16 4Q16 1Q17 2Q17 3Q17 4Q17
1,078 -498 -5
-193
-69
+116
429
EBITDA Capex Dividends Net
Financial
Expenses
Income
Tax
Working
Capital
Variation
Free Cash
Flow
Commitment to Sustainable Development
Energy Efficiency Gold Seal granted by
the Energy Ministry of
Chile and the Agency
for Energy Efficiency
21
Member of the
FTSE4GoodIndex, for third
consecutive year
Member of the
DJSI Chile, for
third consecutive
year
Member of the new
DJSI Mila
First Chilean
Company to issue
a Green Bond
5
22
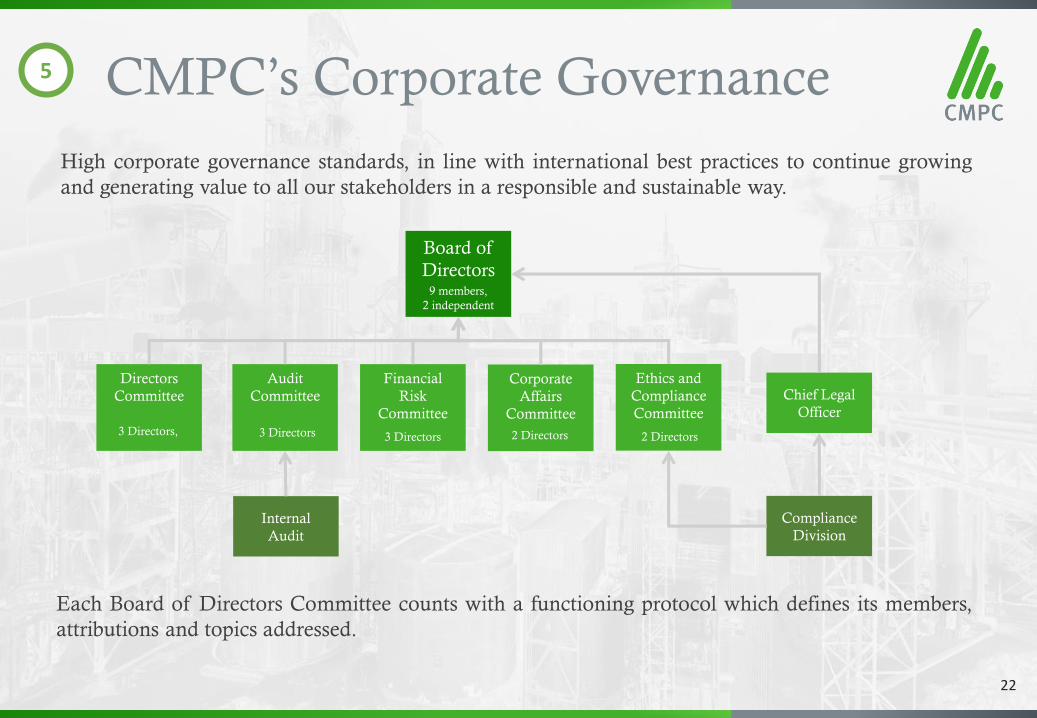
CMPC’s Corporate Governance
High corporate governance standards, in line with international best practices to continue growing
and generating value to all our stakeholders in a responsible and sustainable way.
Board of
Directors
Directors
Committee
Audit
Committee
Financial
Risk
Committee
Corporate
Affairs
Committee
Ethics and
Compliance
Committee
Chief Legal
Officer
Compliance
Division
Internal
Audit
Each Board of Directors Committee counts with a functioning protocol which defines its members,
attributions and topics addressed.
3 Directors, 3 Directors 3 Directors 2 Directors 2 Directors
9 members,
2 independent
5
Appendix: Business divisions
24
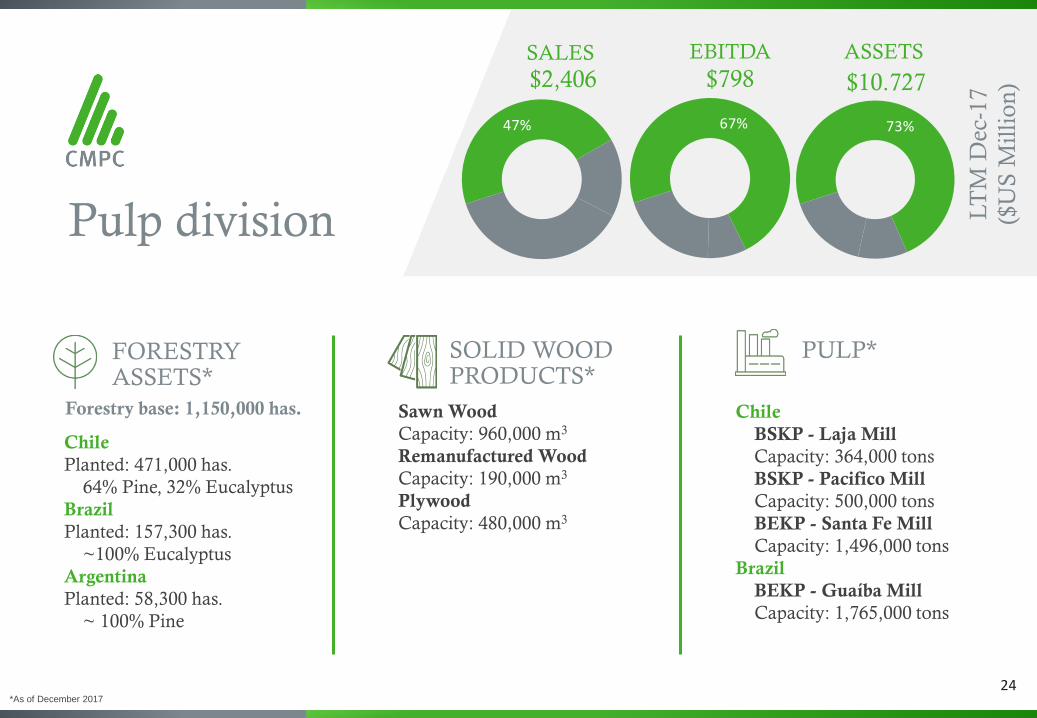
Pulp division
Chile
Planted: 471,000 has.
64% Pine, 32% Eucalyptus
Brazil
Planted: 157,300 has.
~100% Eucalyptus
Argentina
Planted: 58,300 has.
~ 100% Pine
FORESTRY ASSETS*
SOLID WOOD PRODUCTS*
PULP*
Sawn Wood
Capacity: 960,000 m3
Remanufactured Wood
Capacity: 190,000 m3
Plywood
Capacity: 480,000 m3
Chile
BSKP - Laja Mill
Capacity: 364,000 tons
BSKP - Pacifico Mill
Capacity: 500,000 tons
BEKP - Santa Fe Mill
Capacity: 1,496,000 tons
Brazil
BEKP - Guaíba Mill
Capacity: 1,765,000 tons
24
Forestry base: 1,150,000 has.
$2,406 $10.727
LT
M D
ec-1
7
($U
S M
illi
on
)
SALES EBITDA
$798
ASSETS
*As of December 2017
47% 67% 73%
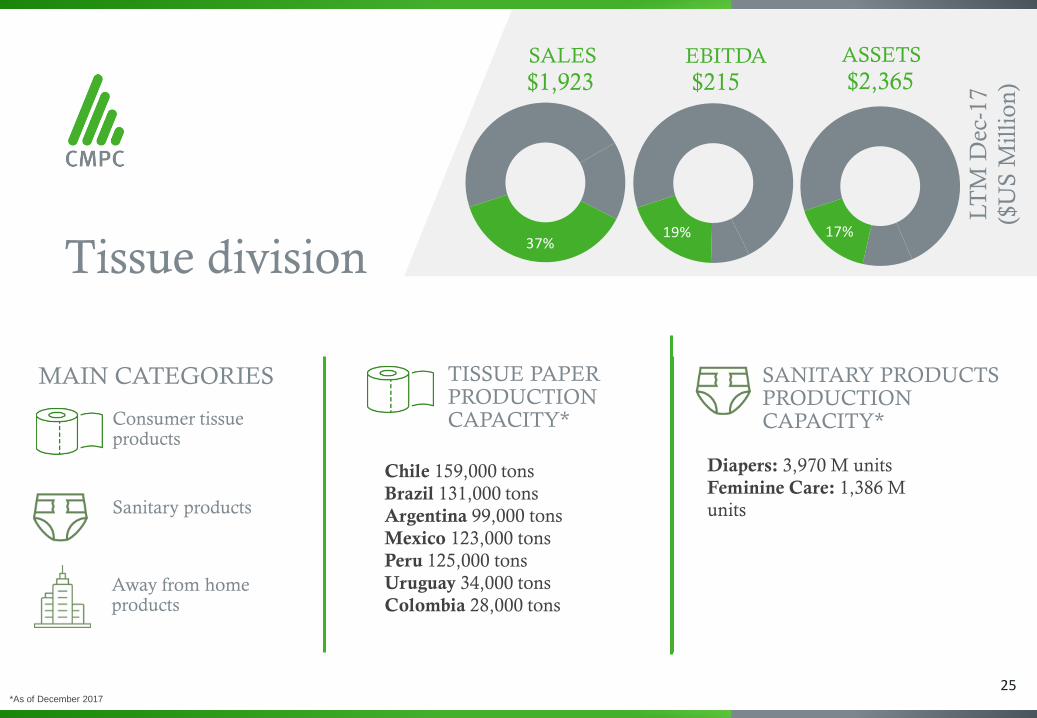
25
Consumer tissue products
Sanitary products
Away from home products
Chile 159,000 tons
Brazil 131,000 tons
Argentina 99,000 tons
Mexico 123,000 tons
Peru 125,000 tons
Uruguay 34,000 tons
Colombia 28,000 tons
TISSUE PAPER PRODUCTION CAPACITY*
MAIN CATEGORIES SANITARY PRODUCTSPRODUCTION CAPACITY*
Diapers: 3,970 M units
Feminine Care: 1,386 M
units
Tissue division
$1,923 $215 $2,365SALES EBITDA ASSETS
LT
M D
ec-1
7
($U
S M
illi
on
)
*As of December 2017
37%19% 17%
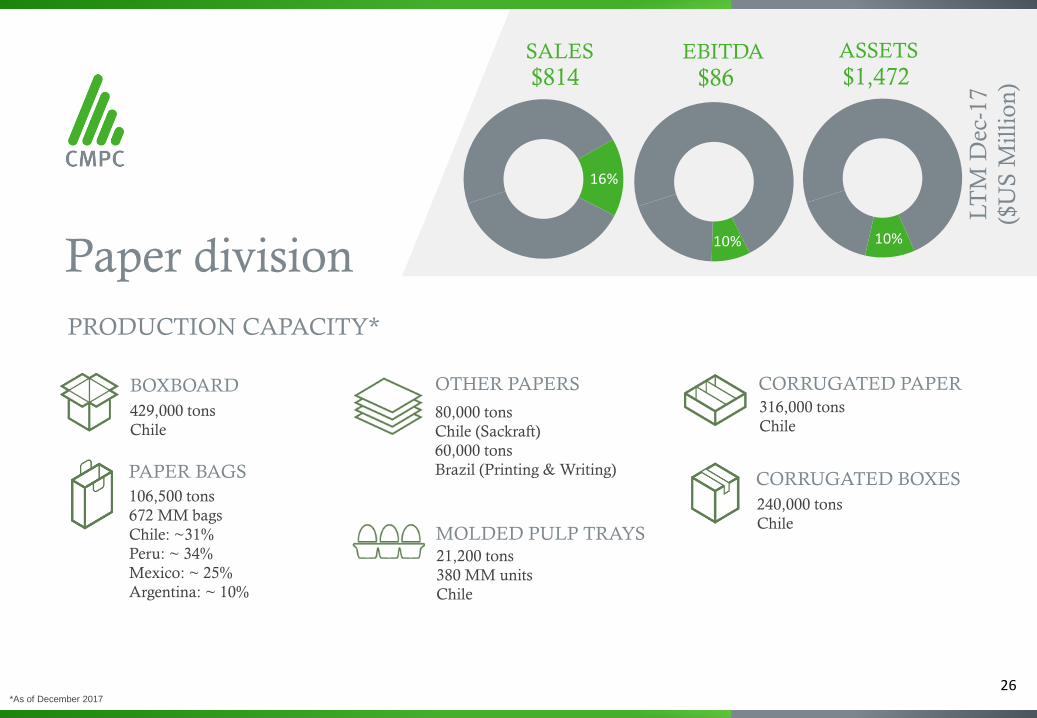
26
BOXBOARD
PAPER BAGS
OTHER PAPERS CORRUGATED PAPER
CORRUGATED BOXES
MOLDED PULP TRAYS
429,000 tons
Chile
106,500 tons
672 MM bags
Chile: ~31%
Peru: ~ 34%
Mexico: ~ 25%
Argentina: ~ 10%
80,000 tons
Chile (Sackraft)
60,000 tons
Brazil (Printing & Writing)
316,000 tons
Chile
240,000 tons
Chile
21,200 tons
380 MM units
Chile
Paper division
PRODUCTION CAPACITY*
$814 $86 $1,472SALES EBITDA ASSETS
LT
M D
ec-1
7
($U
S M
illi
on
)
*As of December 2017
16%
10% 10%