
Corporate Presentation March 2018s1.q4cdn.com/556167425/files/doc_presentations/2018/03/..., should...
43
Corporate Presentation March 2018
Transcript of Corporate Presentation March 2018s1.q4cdn.com/556167425/files/doc_presentations/2018/03/..., should...

Corporate PresentationMarch 2018
2
Cautionary Notes
This presentation, the information contained herein, any other materials provided in connection with this presentation and any oral remarks accompanying this presentation (collectively, this “Presentation”) has been prepared by Alamos Gold Inc. (“Alamos”) solely
for information purposes. No Stock exchange, securities commission or other regulatory authority has approved or disapproved of the information contained herein. This presentation does not constitute an offering of securities and the information contained herein is
subject to the information contained in the Company’s continuous disclosure documents at www.sedar.com.
Cautionary NotesCertain statements in this presentation are “forward-looking statements”, including within the meaning of applicable laws. All statements other than statements of historical fact included in this presentation, including, without limitation, statements Alamos’ net asset
value, operating cash flow, free cash flow, forecast gold production, Mineral Reserves, Mineral Resources, exploration potential, gold grades, recoveries, waste-to-ore ratios, total cash cost, all-in sustaining costs, debt levels and future plans and objectives of Alamos
are forward-looking statements based on forecasts of future operational or financial results, estimates of amounts not yet determinable and assumptions of management that involve various risks and uncertainties. Any statements that express or involve discussions
with respect to predictions, expectations, beliefs, plans, projections, objectives, assumptions or future events or performance (often, but not always, using words or phrases such as “expects” or “does not expect”, “is expected”, “anticipates” or “does not anticipate”,
“plans”, “estimates” or “intends”, or stating that certain actions, events or results “may”, “could”, “would”, “might”, or “will” be taken, occur or be achieved) are not statements of historical fact and may be “forward-looking statements.” Alamos cautions that
forward-looking information involves known and unknown risks, uncertainties and other factors that may cause Alamos’ actual results, performance or achievements to be materially different from those expressed or implied by such information, including, but not
limited to, gold and silver price volatility; fluctuations in foreign exchange rates and interest rates; the impact of any hedging activities; discrepancies between actual and estimated production, between actual and estimated Mineral Reserves and Mineral Resources or
between actual and estimated metallurgical recoveries; costs of production; capital expenditure requirements; the costs and timing of construction and development of new deposits; and the success of exploration and permitting activities. In addition, the factors
described or referred to in the section entitled “Risk Factors” in Alamos’ Annual Information Form for the year ended December 31, 2016, which along with other documents setting out risk factors affecting the Company is available on the SEDAR website at
www.sedar.com, should be reviewed in conjunction with the information found in this presentation. Although Alamos has attempted to identify important factors that could cause actual results, performance or achievements to differ materially from those contained
in forward-looking information, there can be other factors that cause results, performance or achievements not to be as anticipated, estimated or intended. There can be no assurance that such information will prove to be accurate or that management’s
expectations or estimates of future developments, circumstances or results will materialize. Accordingly, readers should not place undue reliance on forward-looking information.
Market data and other statistical information used throughout this Presentation are based on internal company research, independent industry publications, government publications, reports by market research firms or their published independent sources. Industry
publications, governmental publications, market research surveys and forecasts generally state that the information contained therein has been obtained from sources believed to be reliable. Although Alamos believes such information is accurate and reliable, it has
not independently verified any of the data from third party sources cited or used for our management’s industry estimates, nor has Alamos ascertained the underlying economic assumptions relied upon therein. While Alamos believes internal company estimates are
reliable, such estimates have not been verified by any independent sources, and Alamos makes no representations as to the accuracy of such estimates.
Note to U.S. Investors
Alamos prepares its disclosure in accordance with the requirements of securities laws in effect in Canada, which differ from the requirements of U.S. securities laws. Terms relating to Mineral Resources in this presentation are defined in accordance with National
Instrument 43-101 Standards of Disclosure for Mineral Projects under the guidelines set out in the Canadian Institute of Mining, Metallurgy, and Petroleum Standards on Mineral Resources and Mineral Reserves. The Unites States Securities and Exchange Commission
(the “SEC”) permits mining companies, in their filings with the SEC, to disclose only those mineral deposits that a company can economically and legally extract or produce. Alamos may use certain terms, such as “Measured Mineral Resources”, “Indicated Mineral
Resources”, “Inferred Mineral Resources” and “Probable Mineral Reserves” that the SEC does not recognize (these terms may be used in this presentation and are included in the public filings of Alamos, which have been filed with the SEC and the securities
commissions or similar authorities in Canada).
Cautionary non-GAAP Measures and Additional GAAP Measures
Note that for purposes of this section, GAAP refers to IFRS. The Company believes that investors use certain non-GAAP and additional GAAP measures as indicators to assess gold mining companies. They are intended to provide additional information and should not
be considered in isolation or as a substitute for measures of performance prepared with GAAP.
“Cash flow from operating activities before changes in non-cash working capital” is a non-GAAP performance measure that could provide an indication of the Company’s ability to generate cash flows from operations, and is calculated by adding back the change in
non-cash working capital to “Cash provided by (used in) operating activities” as presented on the Company’s consolidated statements of cash flows. “Free cash flow” is a non-GAAP performance measure that is calculated as cash flows from operations net of cash
flows invested in mineral property, plant and equipment and exploration and evaluation assets as presented on the Company’s consolidated statements of cash flows and that would provide an indication of the Company’s ability to generate cash flows from its
mineral projects. “Mine site free cash flow” is a non-GAAP measure which includes cash flow from operating activities at, less capital expenditures at each mine site. Return on Equity is defined as Earnings from Continuing Operations divided by the average Total
Equity for the current and previous year. “Mining cost per tonne of ore” and “Cost per tonne of ore” are non-GAAP performance measures that could provide an indication of the mining and processing efficiency and effectiveness of the mine. These measures are
calculated by dividing the relevant mining and processing costs and total costs by the tonnes of ore processed in the period. “Cost per tonne of ore” is usually affected by operating efficiencies and waste-to-ore ratios in the period. “Total cash costs per ounce”, “all-in
sustaining costs per ounce”, and “mine-site all-in sustaining costs” as used in this analysis are non-GAAP terms typically used by gold mining companies to assess the level of gross margin available to the Company by subtracting these costs from the unit price realized
during the period. These non-GAAP terms are also used to assess the ability of a mining company to generate cash flow from operations. There may be some variation in the method of computation of these metrics as determined by the Company compared with
other mining companies. In this context, “total cash costs” reflects mining and processing costs allocated from in-process and dore inventory associated and associated royalties with ounces of gold sold in the period. Total cash costs per ounce are exclusive of
exploration costs. “All-in sustaining costs per ounce” include total cash costs, exploration, corporate and administrative, share based compensation and sustaining capital costs. “Mine-site all-in sustaining costs” include total cash costs, exploration, and sustaining
capital costs for the mine-site, but exclude an allocation of corporate and administrative and share based compensation.
Additional GAAP measures that are presented on the face of the Company’s consolidated statements of comprehensive income and are not meant to be a substitute for other subtotals or totals presented in accordance with IFRS, but rather should be evaluated in
conjunction with such IFRS measures. This includes “Earnings from operations”, which is intended to provide an indication of the Company’s operating performance, and represents the amount of earnings before net finance income/expense, foreign exchange
gain/loss, other income/loss, and income tax expense. Non-GAAP and additional GAAP measures do not have a standardized meaning prescribed under IFRS and therefore may not be comparable to similar measures presented by other companies. A reconciliation of
historical non-GAAP and additional GAAP measures are available at www.alamosgold.com.
Technical Information
Chris Bostwick, FAusIMM, Alamos Gold’s Vice President, Technical Services, has reviewed and approved the scientific and technical information contained in this presentation. Chris Bostwick is a Qualified Person within the meaning of Canadian Securities
Administrator’s National Instrument 43-101 (“NI 43-101”). The Qualified Persons for the National Instrument 43-101 compliant mineral reserve and resource estimates are detailed in the tables in the appendix of this presentation. Information pertaining to the
geological and exploration content has been reviewed and approved by Aoife McGrath, Alamos' Vice President, Exploration, a Qualified Person.
All figures in US$ unless otherwise indicated.
3
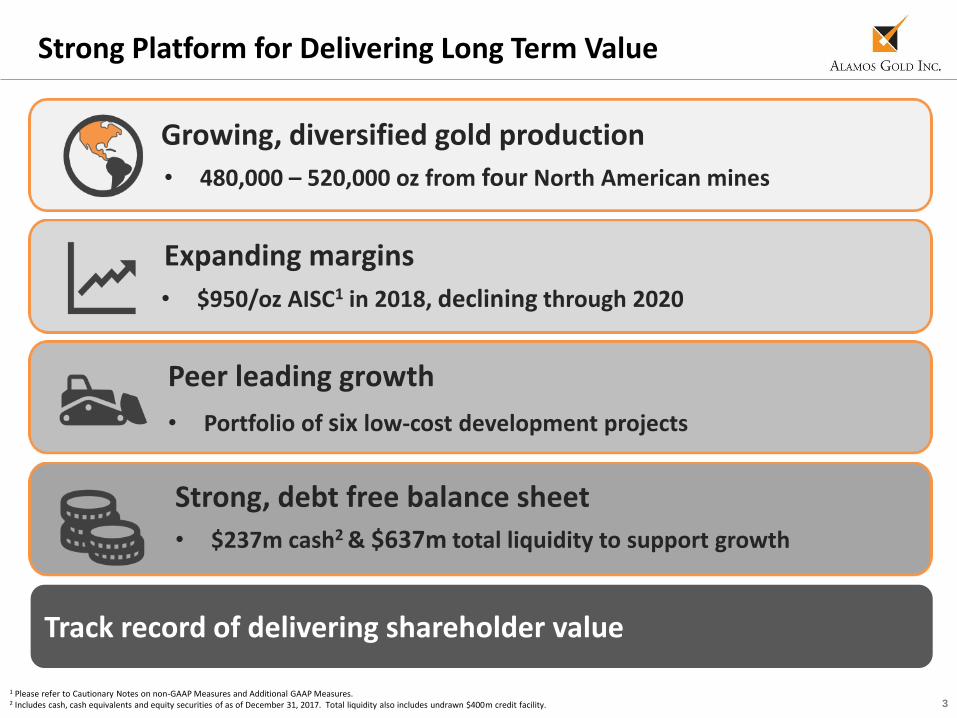
1 Please refer to Cautionary Notes on non-GAAP Measures and Additional GAAP Measures.2 Includes cash, cash equivalents and equity securities of as of December 31, 2017. Total liquidity also includes undrawn $400m credit facility.
Strong Platform for Delivering Long Term Value
Growing, diversified gold production
Expanding margins
Peer leading growth
Strong, debt free balance sheet
Track record of delivering shareholder value
• 480,000 – 520,000 oz from four North American mines
• $950/oz AISC1 in 2018, declining through 2020
• Portfolio of six low-cost development projects
• $237m cash2 & $637m total liquidity to support growth
4
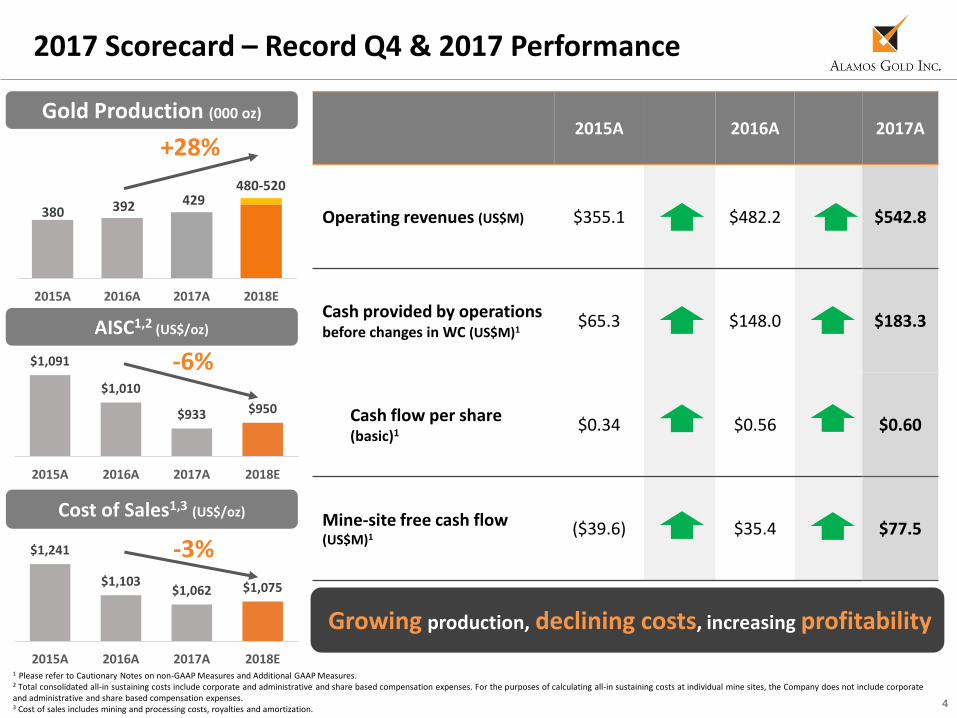
$1,241
$1,103$1,062 $1,075
2015A 2016A 2017A 2018E
2015A 2016A 2017A 2018E
2017 Scorecard – Record Q4 & 2017 Performance
2015A 2016A 2017A
Operating revenues (US$M) $355.1 $482.2 $542.8
Cash provided by operations before changes in WC (US$M)1
$65.3 $148.0 $183.3
Cash flow per share (basic)1
$0.34 $0.56 $0.60
Mine-site free cash flow (US$M)1
($39.6) $35.4 $77.5
Growing production, declining costs, increasing profitability
429
$1,091
$1,010
$933 $950
2015A 2016A 2017A 2018E
Gold Production (000 oz)
AISC1,2 (US$/oz)
-6%
Cost of Sales1,3 (US$/oz)
-3%
+28%
392
480-520
380
1 Please refer to Cautionary Notes on non-GAAP Measures and Additional GAAP Measures. 2 Total consolidated all-in sustaining costs include corporate and administrative and share based compensation expenses. For the purposes of calculating all-in sustaining costs at individual mine sites, the Company does not include corporate and administrative and share based compensation expenses.3 Cost of sales includes mining and processing costs, royalties and amortization.
5
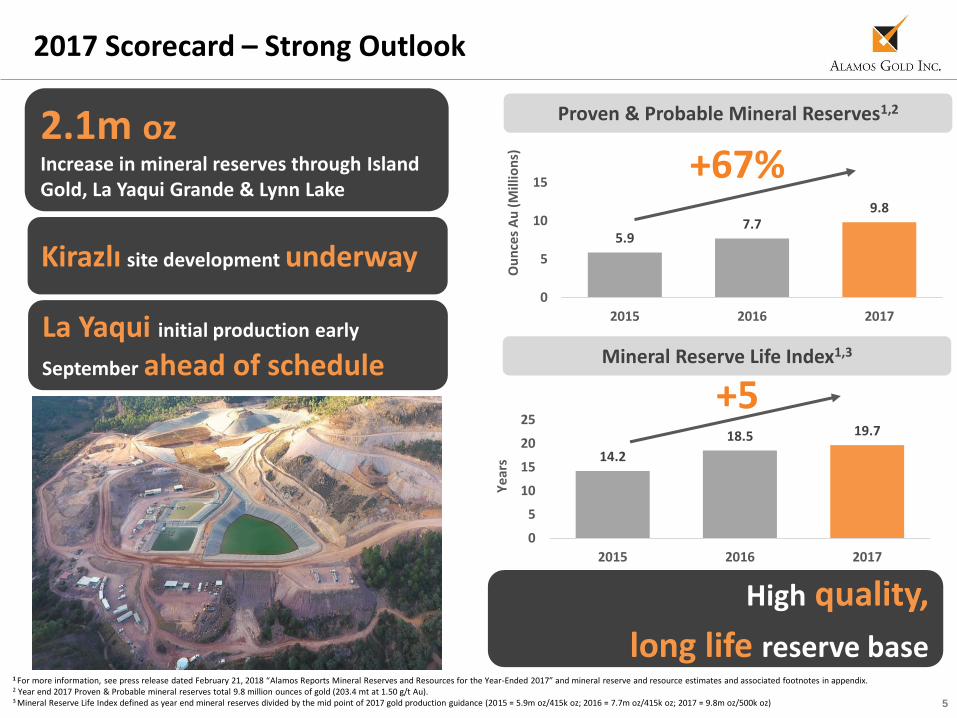
2017 Scorecard – Strong Outlook
Proven & Probable Mineral Reserves1,2
5.97.7
9.8
0
5
10
15
2015 2016 2017
14.2
18.5 19.7
0
5
10
15
20
25
2015 2016 2017
Ou
nce
s A
u (
Mill
ion
s)Y
ear
s
1 For more information, see press release dated February 21, 2018 “Alamos Reports Mineral Reserves and Resources for the Year-Ended 2017” and mineral reserve and resource estimates and associated footnotes in appendix.2 Year end 2017 Proven & Probable mineral reserves total 9.8 million ounces of gold (203.4 mt at 1.50 g/t Au).3 Mineral Reserve Life Index defined as year end mineral reserves divided by the mid point of 2017 gold production guidance (2015 = 5.9m oz/415k oz; 2016 = 7.7m oz/415k oz; 2017 = 9.8m oz/500k oz)
Mineral Reserve Life Index1,3
+67%
+5
2.1m ozIncrease in mineral reserves through Island Gold, La Yaqui Grande & Lynn Lake
La Yaqui initial production early
September ahead of schedule
Kirazlı site development underway
High quality,
long life reserve base
6
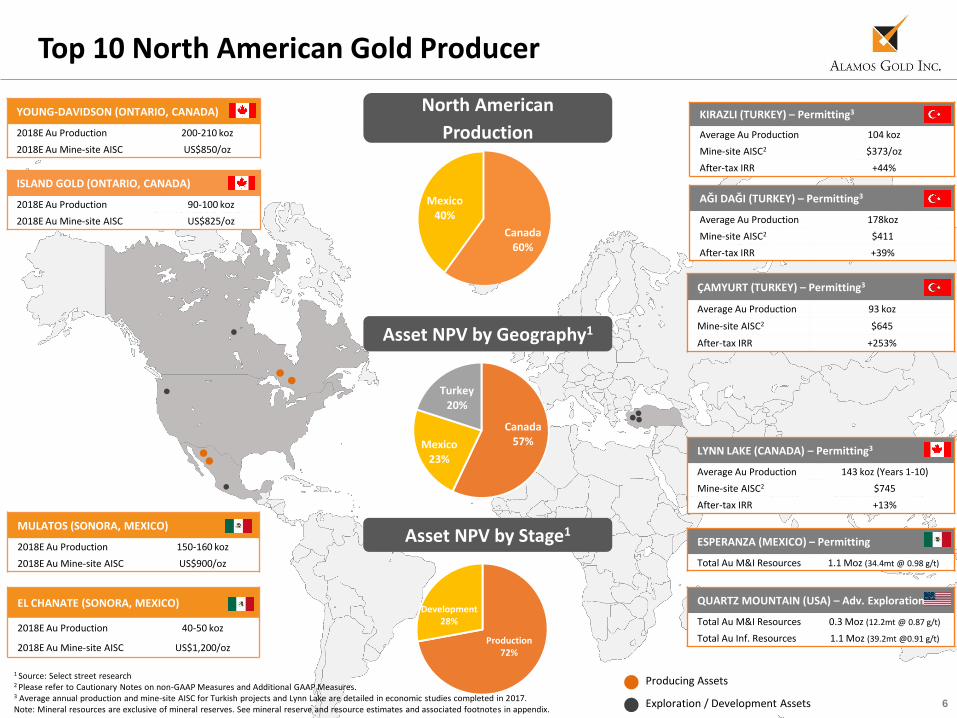
Canada57%Mexico
23%
Turkey20%
AĞI DAĞI (TURKEY) – Permitting3
Average Au Production 178koz
Mine-site AISC2 $411
After-tax IRR +39%
KIRAZLI (TURKEY) – Permitting3
Average Au Production 104 koz
Mine-site AISC2 $373/oz
After-tax IRR +44%
ÇAMYURT (TURKEY) – Permitting3
Average Au Production 93 koz
Mine-site AISC2 $645
After-tax IRR +253%
Top 10 North American Gold Producer
MULATOS (SONORA, MEXICO)
2018E Au Production 150-160 koz
2018E Au Mine-site AISC US$900/oz
EL CHANATE (SONORA, MEXICO)
2018E Au Production 40-50 koz
2018E Au Mine-site AISC US$1,200/oz
YOUNG-DAVIDSON (ONTARIO, CANADA)
2018E Au Production 200-210 koz
2018E Au Mine-site AISC US$850/oz
Producing Assets
Exploration / Development Assets
1 Source: Select street research2 Please refer to Cautionary Notes on non-GAAP Measures and Additional GAAP Measures.3 Average annual production and mine-site AISC for Turkish projects and Lynn Lake are detailed in economic studies completed in 2017.Note: Mineral resources are exclusive of mineral reserves. See mineral reserve and resource estimates and associated footnotes in appendix.
ISLAND GOLD (ONTARIO, CANADA)
2018E Au Production 90-100 koz
2018E Au Mine-site AISC US$825/oz
QUARTZ MOUNTAIN (USA) – Adv. Exploration
Total Au M&I Resources 0.3 Moz (12.2mt @ 0.87 g/t)
Total Au Inf. Resources 1.1 Moz (39.2mt @0.91 g/t)
ESPERANZA (MEXICO) – Permitting
Total Au M&I Resources 1.1 Moz (34.4mt @ 0.98 g/t)
LYNN LAKE (CANADA) – Permitting3
Average Au Production 143 koz (Years 1-10)
Mine-site AISC2 $745
After-tax IRR +13%
Asset NPV by Geography1
Asset NPV by Stage1
Production72%
Development28%
Canada60%
Mexico40%
North American
Production
7
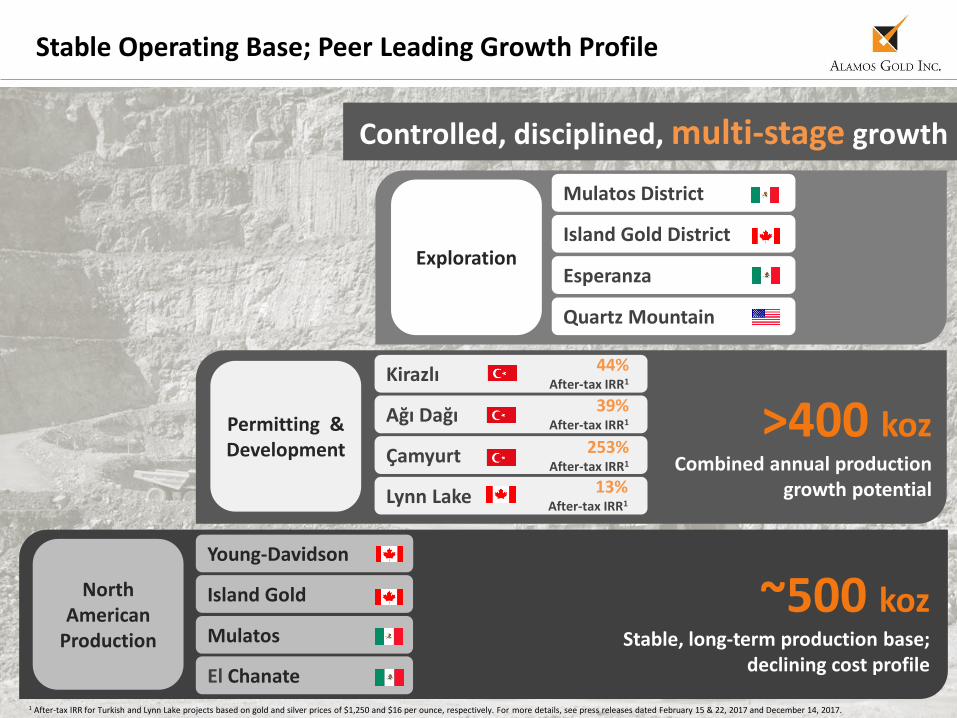
Kirazlı
Ağı Dağı
Çamyurt
Lynn Lake
Permitting & Development
Young-Davidson
Stable Operating Base; Peer Leading Growth Profile
Island Gold
Mulatos
El Chanate
Mulatos District
Island Gold District
Esperanza
Quartz Mountain
>400 kozCombined annual production
growth potential
North American
Production
Exploration
Controlled, disciplined, multi-stage growth
44% After-tax IRR1
39% After-tax IRR1
253% After-tax IRR1
13% After-tax IRR1
~500 koz Stable, long-term production base;
declining cost profile
1 After-tax IRR for Turkish and Lynn Lake projects based on gold and silver prices of $1,250 and $16 per ounce, respectively. For more details, see press releases dated February 15 & 22, 2017 and December 14, 2017.
8
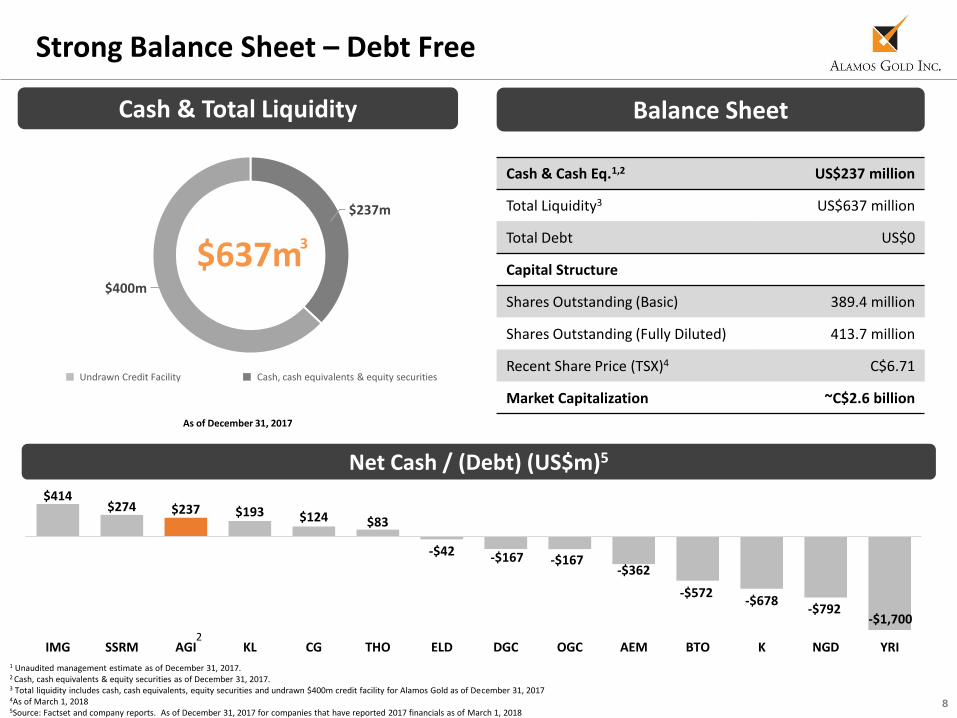
$237m
$400m
Strong Balance Sheet – Debt Free
1 Unaudited management estimate as of December 31, 2017.2 Cash, cash equivalents & equity securities as of December 31, 2017.3 Total liquidity includes cash, cash equivalents, equity securities and undrawn $400m credit facility for Alamos Gold as of December 31, 20174As of March 1, 20185Source: Factset and company reports. As of December 31, 2017 for companies that have reported 2017 financials as of March 1, 2018
$637m
As of December 31, 2017
Cash & Total Liquidity
Cash, cash equivalents & equity securitiesUndrawn Credit Facility
3
Net Cash / (Debt) (US$m)5
Cash & Cash Eq.1,2 US$237 million
Total Liquidity3 US$637 million
Total Debt US$0
Capital Structure
Shares Outstanding (Basic) 389.4 million
Shares Outstanding (Fully Diluted) 413.7 million
Recent Share Price (TSX)4 C$6.71
Market Capitalization ~C$2.6 billion
Balance Sheet
2
$414$274 $237 $193 $124 $83
-$42 -$167 -$167-$362
-$572-$678
-$792-$1,700
IMG SSRM AGI KL CG THO ELD DGC OGC AEM BTO K NGD YRI
9
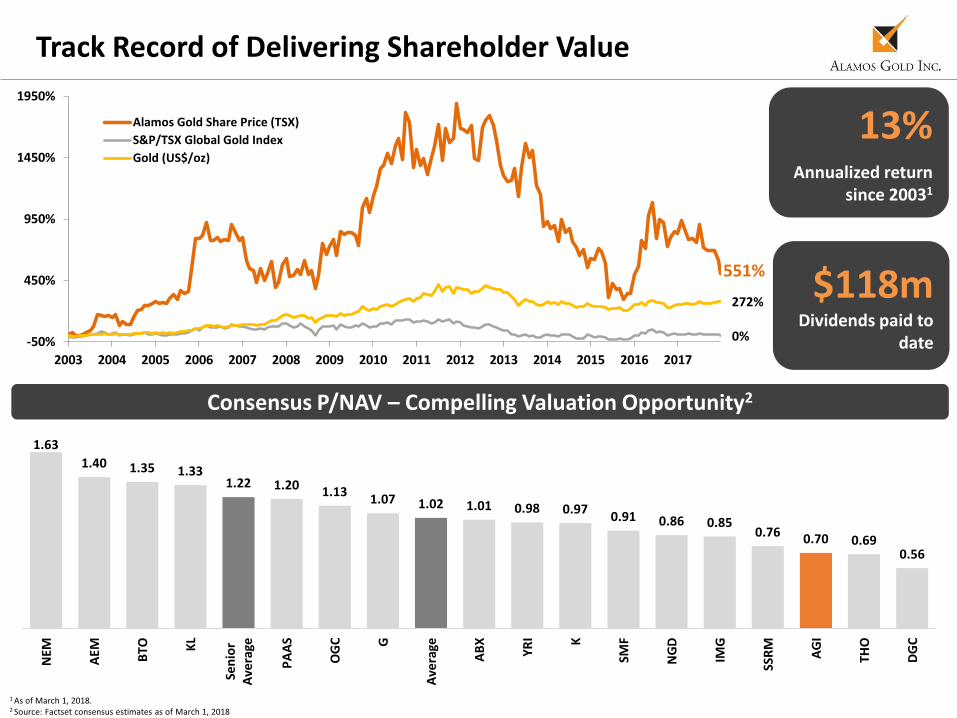
551%
0%
272%
-50%
450%
950%
1450%
1950%
2003 2004 2005 2006 2007 2008 2009 2010 2011 2012 2013 2014 2015 2016 2017
Alamos Gold Share Price (TSX)
S&P/TSX Global Gold Index
Gold (US$/oz)
Track Record of Delivering Shareholder Value
13%Annualized return
since 20031
$118m Dividends paid to
date
Consensus P/NAV – Compelling Valuation Opportunity2
1 As of March 1, 2018.2 Source: Factset consensus estimates as of March 1, 2018
1.63
1.40 1.35 1.331.22 1.20 1.13
1.07 1.02 1.01 0.98 0.970.91 0.86 0.85
0.76 0.70 0.690.56
NEM
AEM BTO K
L
Sen
ior
Ave
rage
PA
AS
OG
C G
Ave
rage
AB
X
YR
I K
SMF
NG
D
IMG
SSR
M
AG
I
THO
DG
C
10
Operations – Diversified North American Production
Long life reserve base
Declining costs & capital
Growing free cash flow
Growing production
11
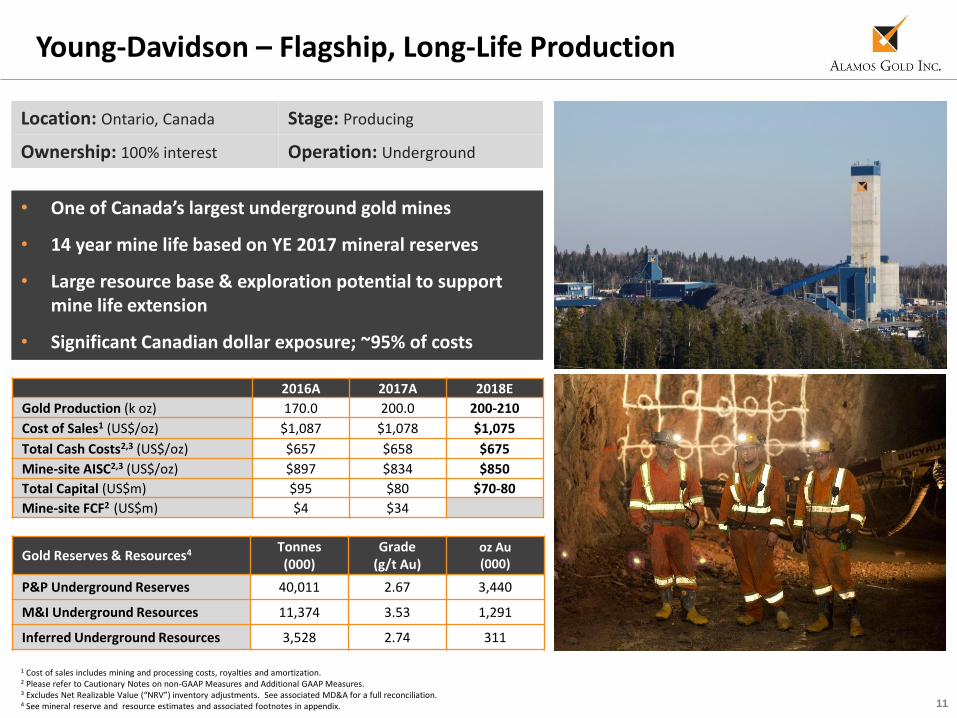
Young-Davidson – Flagship, Long-Life Production
2016A 2017A 2018E
Gold Production (k oz) 170.0 200.0 200-210
Cost of Sales1 (US$/oz) $1,087 $1,078 $1,075
Total Cash Costs2,3 (US$/oz) $657 $658 $675
Mine-site AISC2,3 (US$/oz) $897 $834 $850
Total Capital (US$m) $95 $80 $70-80
Mine-site FCF2 (US$m) $4 $34
Location: Ontario, Canada Stage: Producing
Ownership: 100% interest Operation: Underground
Gold Reserves & Resources4 Tonnes (000)
Grade (g/t Au)
oz Au (000)
P&P Underground Reserves 40,011 2.67 3,440
M&I Underground Resources 11,374 3.53 1,291
Inferred Underground Resources 3,528 2.74 311
1 Cost of sales includes mining and processing costs, royalties and amortization.2 Please refer to Cautionary Notes on non-GAAP Measures and Additional GAAP Measures.3 Excludes Net Realizable Value (“NRV”) inventory adjustments. See associated MD&A for a full reconciliation.4 See mineral reserve and resource estimates and associated footnotes in appendix.
• One of Canada’s largest underground gold mines
• 14 year mine life based on YE 2017 mineral reserves
• Large resource base & exploration potential to support mine life extension
• Significant Canadian dollar exposure; ~95% of costs
12
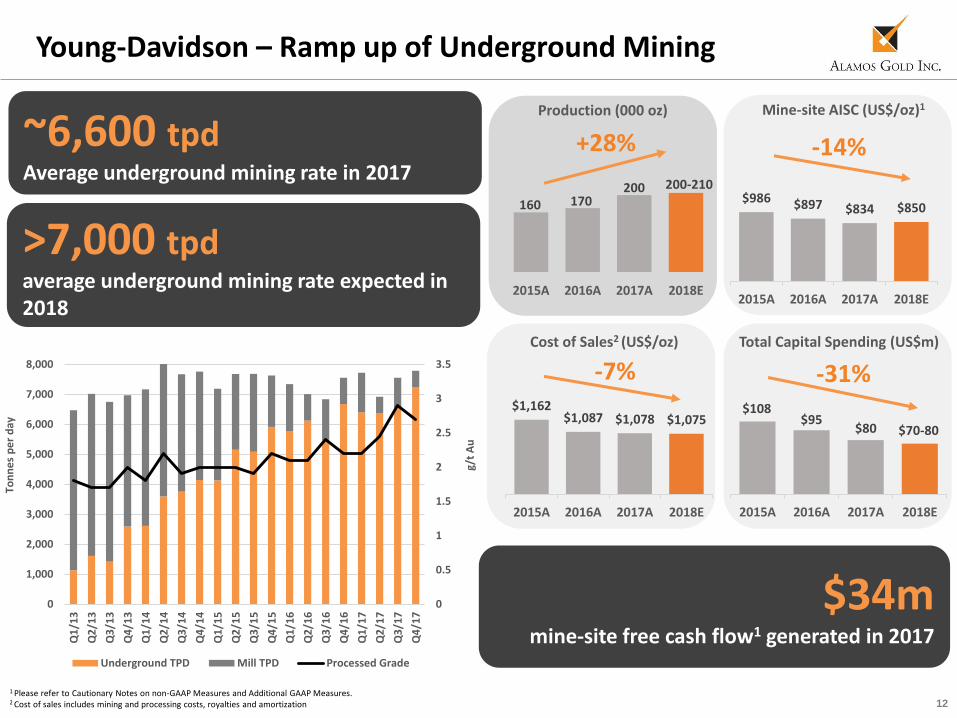
$1,162$1,087 $1,078 $1,075
2015A 2016A 2017A 2018E
$986 $897 $834 $850
2015A 2016A 2017A 2018E2015A 2016A 2017A 2018E
-31%
$34m mine-site free cash flow1 generated in 2017
Young-Davidson – Ramp up of Underground Mining
-14%+28%~6,600 tpdAverage underground mining rate in 2017
-7%
>7,000 tpdaverage underground mining rate expected in 2018
1 Please refer to Cautionary Notes on non-GAAP Measures and Additional GAAP Measures.2 Cost of sales includes mining and processing costs, royalties and amortization
Total Capital Spending (US$m)
Ton
ne
s p
er
day
g/t
Au
Mine-site AISC (US$/oz)1Production (000 oz)
Cost of Sales2 (US$/oz)
160 170200 200-210
2015A 2016A 2017A 2018E
$108$95
$80 $70-80
0
0.5
1
1.5
2
2.5
3
3.5
0
1,000
2,000
3,000
4,000
5,000
6,000
7,000
8,000
Q1
/13
Q2
/13
Q3
/13
Q4
/13
Q1
/14
Q2
/14
Q3
/14
Q4
/14
Q1
/15
Q2
/15
Q3
/15
Q4
/15
Q1
/16
Q2
/16
Q3
/16
Q4
/16
Q1
/17
Q2
/17
Q3
/17
Q4
/17
Underground TPD Mill TPD Processed Grade
13
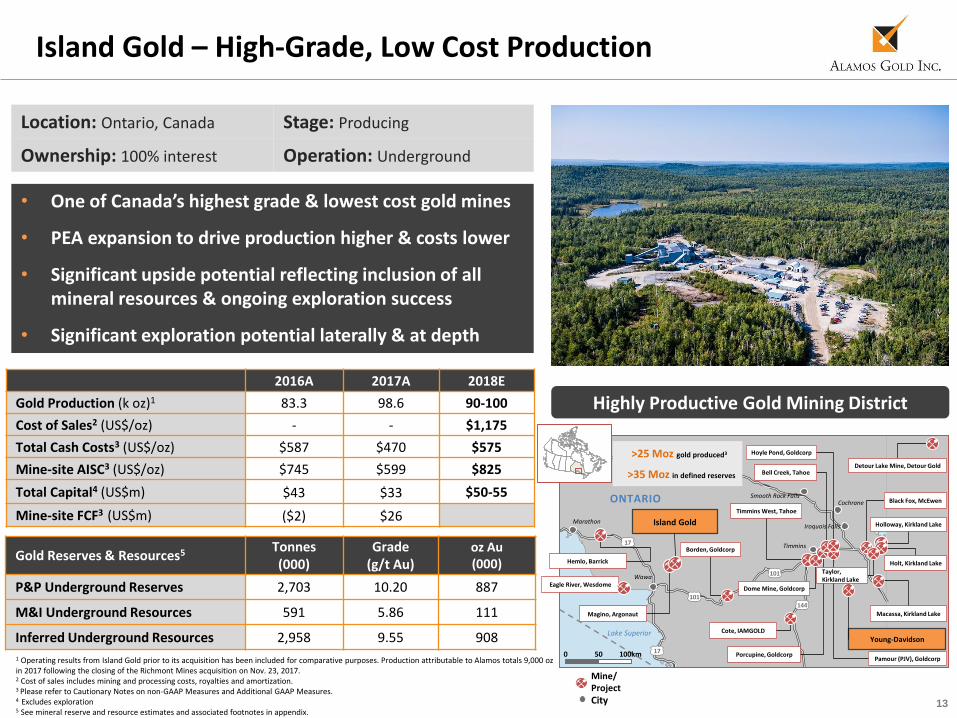
Island Gold – High-Grade, Low Cost Production
Location: Ontario, Canada Stage: Producing
Ownership: 100% interest Operation: Underground
Gold Reserves & Resources5 Tonnes (000)
Grade (g/t Au)
oz Au (000)
P&P Underground Reserves 2,703 10.20 887
M&I Underground Resources 591 5.86 111
Inferred Underground Resources 2,958 9.55 908
Highly Productive Gold Mining District2016A 2017A 2018E
Gold Production (k oz)1 83.3 98.6 90-100
Cost of Sales2 (US$/oz) - - $1,175
Total Cash Costs3 (US$/oz) $587 $470 $575
Mine-site AISC3 (US$/oz) $745 $599 $825
Total Capital4 (US$m) $43 $33 $50-55
Mine-site FCF3 (US$m) ($2) $26
1 Operating results from Island Gold prior to its acquisition has been included for comparative purposes. Production attributable to Alamos totals 9,000 oz in 2017 following the closing of the Richmont Mines acquisition on Nov. 23, 2017. 2 Cost of sales includes mining and processing costs, royalties and amortization.3 Please refer to Cautionary Notes on non-GAAP Measures and Additional GAAP Measures.4 Excludes exploration5 See mineral reserve and resource estimates and associated footnotes in appendix.
0 50 100km
Marathon
Wawa
Hearst
Timmins
Iroquois Falls
Smooth Rock Falls
Eagle River, Wesdome
Borden, Goldcorp
Island Gold
Magino, Argonaut
Cote, IAMGOLD
Black Fox, McEwen
Timmins West, Tahoe
Holloway, Kirkland Lake
Porcupine, Goldcorp
Bell Creek, Tahoe
Young-Davidson
Macassa, Kirkland Lake
Holt, Kirkland Lake
Lake Superior
ONTARIO
Hemlo, Barrick
144
101
17
17
11
101
Mine/ProjectCity
Dome Mine, Goldcorp
Hoyle Pond, Goldcorp
Cochrane
Pamour (PJV), Goldcorp
Taylor, Kirkland Lake
Detour Lake Mine, Detour Gold
>25 Moz gold produced3
>35 Moz in defined reserves
• One of Canada’s highest grade & lowest cost gold mines
• PEA expansion to drive production higher & costs lower
• Significant upside potential reflecting inclusion of all mineral resources & ongoing exploration success
• Significant exploration potential laterally & at depth
14
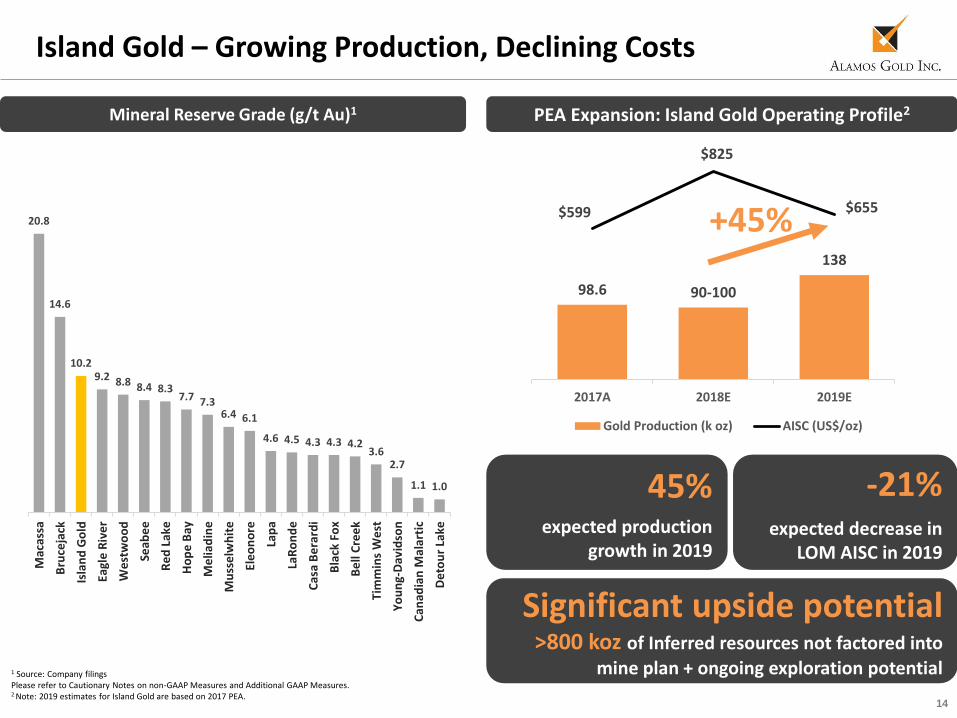
Island Gold – Growing Production, Declining Costs
Mineral Reserve Grade (g/t Au)1
1 Source: Company filingsPlease refer to Cautionary Notes on non-GAAP Measures and Additional GAAP Measures.2 Note: 2019 estimates for Island Gold are based on 2017 PEA.
20.8
14.6
10.29.2 8.8 8.4 8.3
7.7 7.36.4 6.1
4.6 4.5 4.3 4.3 4.23.6
2.7
1.1 1.0
Mac
assa
Bru
ceja
ck
Isla
nd
Go
ld
Eagl
e R
ive
r
We
stw
oo
d
Seab
ee
Re
d L
ake
Ho
pe
Bay
Me
liad
ine
Mu
sse
lwh
ite
Ele
on
ore
Lap
a
LaR
on
de
Cas
a B
era
rdi
Bla
ck F
ox
Be
ll C
ree
k
Tim
min
s W
est
Yo
un
g-D
avid
son
Can
adia
n M
alar
tic
De
tou
r La
ke
98.6 90-100
138
$599
$825
$655
$0
$100
$200
$300
$400
$500
$600
$700
$800
$900
0
50
100
150
200
250
300
2017A 2018E 2019E
Gold Production (k oz) AISC (US$/oz)
+45%
PEA Expansion: Island Gold Operating Profile2
45%expected production
growth in 2019
Significant upside potential >800 koz of Inferred resources not factored into
mine plan + ongoing exploration potential
-21%expected decrease in
LOM AISC in 2019
15
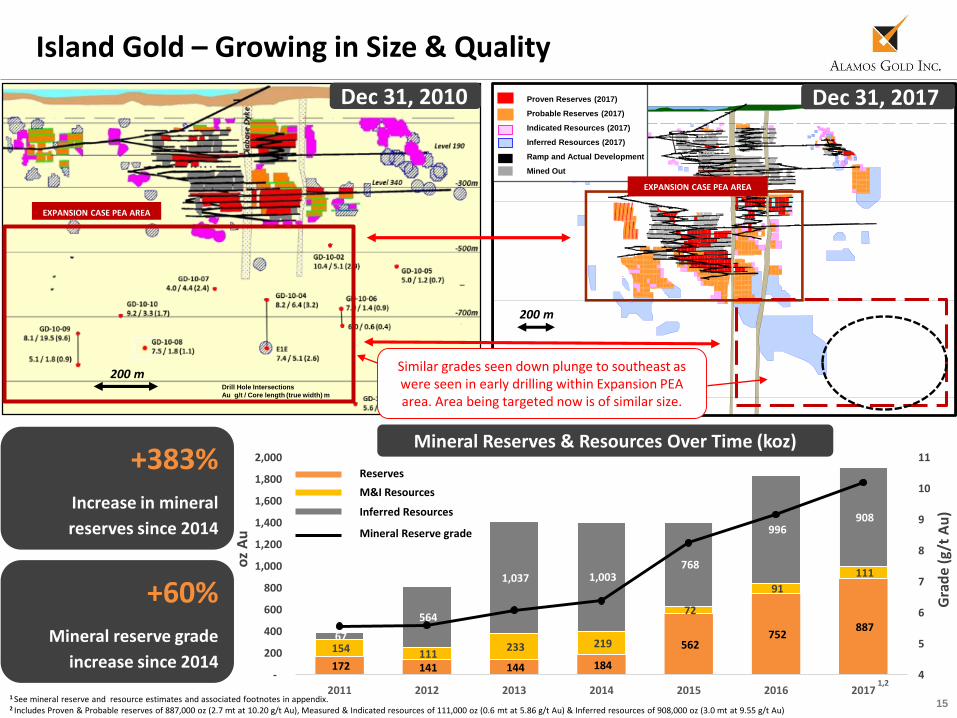
Island Gold – Growing in Size & Quality
EXPANSION CASE PEA AREA
EXPANSION CASE PEA AREA
Proven Reserves (2017)
Probable Reserves (2017)
Indicated Resources (2017)
Inferred Resources (2017)
Ramp and Actual Development
Mined Out
Similar grades seen down plunge to southeast as were seen in early drilling within Expansion PEA area. Area being targeted now is of similar size.
Dec 31, 2010 Dec 31, 2017
172 141 144 184
562 752
887
154 111 233 219
72
91
111
67
564
1,037 1,003 768
996 908
4
5
6
7
8
9
10
11
-
200
400
600
800
1,000
1,200
1,400
1,600
1,800
2,000
2011 2012 2013 2014 2015 2016 2017
+383%Increase in mineral
reserves since 2014
+60%Mineral reserve grade
increase since 2014
oz
Au
Gra
de
(g/t
Au
)
Mineral Reserves & Resources Over Time (koz)
1 See mineral reserve and resource estimates and associated footnotes in appendix.2 Includes Proven & Probable reserves of 887,000 oz (2.7 mt at 10.20 g/t Au), Measured & Indicated resources of 111,000 oz (0.6 mt at 5.86 g/t Au) & Inferred resources of 908,000 oz (3.0 mt at 9.55 g/t Au)
200 m
200 m
Drill Hole Intersections
Au g/t / Core length (true width) m
Mineral Reserve grade
Reserves
M&I Resources
Inferred Resources
1,2
16
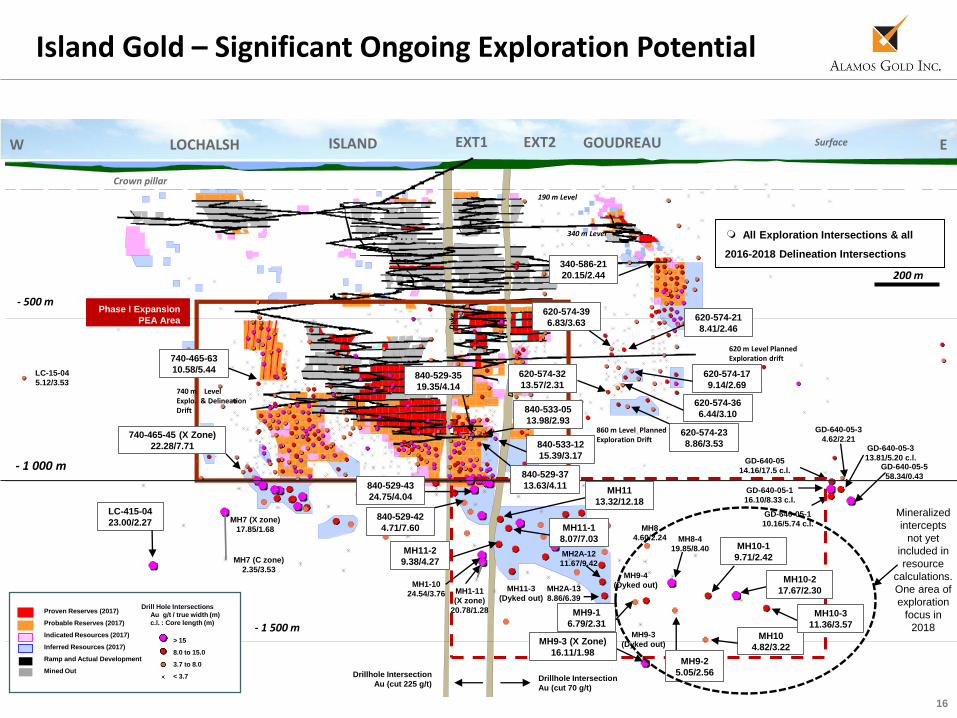
Island Gold – Significant Ongoing Exploration Potential
- 1 000 m
- 500 m
620 m Level PlannedExploration drift
190 m Level
340 m Level
Drillhole Intersection
Au (cut 225 g/t)Drillhole Intersection
Au (cut 70 g/t)
860 m Level PlannedExploration Drift
Dyk
e
740 m LevelExplo. & DelineationDrift
W GOUDREAULOCHALSH ISLAND EXT1 EXT2
Crown pillar
ESurface
200 m
- 1 500 m
LC-415-04
23.00/2.27
MH10-1
9.71/2.42
MH9-1
6.79/2.31
MH10
4.82/3.22
MH11-3
(Dyked out)
MH11
13.32/12.18
MH11-2
9.38/4.27
MH11-1
8.07/7.03
620-574-23
8.86/3.53
620-574-32
13.57/2.31
620-574-39
6.83/3.63620-574-21
8.41/2.46
620-574-17
9.14/2.69
340-586-21
20.15/2.44
MH9-3
(Dyked out)
MH1-11
(X zone)
20.78/1.28
MH1-10
24.54/3.76
MH7 (C zone)
2.35/3.53
MH7 (X zone)
17.85/1.68
MH2A-13
8.86/6.39
MH2A-12
11.67/9.42
MH8
4.60/2.24 MH8-4
19.85/8.40
GD-640-05
14.16/17.5 c.l.
GD-640-05-1
10.16/5.74 c.l.
GD-640-05-1
16.10/8.33 c.l.
GD-640-05-3
4.62/2.21
GD-640-05-5
58.34/0.43
GD-640-05-3
13.81/5.20 c.l.
740-465-63
10.58/5.44
840-533-12
15.39/3.17
840-533-05
13.98/2.93
840-529-42
4.71/7.60
840-529-35
19.35/4.14
740-465-45 (X Zone)
22.28/7.71
MH9-4
(Dyked out)
LC-15-04
5.12/3.53
620-574-36
6.44/3.10
Proven Reserves (2017)
Probable Reserves (2017)
Indicated Resources (2017)
Inferred Resources (2017)
Ramp and Actual Development
Mined Out
> 15
8.0 to 15.0
3.7 to 8.0
< 3.7
Drill Hole Intersections
Au g/t / true width (m)
c.l. : Core length (m)
All Exploration Intersections & all
2016-2018 Delineation Intersections
MH9-2
5.05/2.56
MH10-3
11.36/3.57
MH10-2
17.67/2.30
840-529-37
13.63/4.11840-529-43
24.75/4.04
MH9-3 (X Zone)
16.11/1.98
Mineralized
intercepts
not yet
included in
resource
calculations.
One area of
exploration
focus in
2018
Phase I Expansion
PEA Area
17
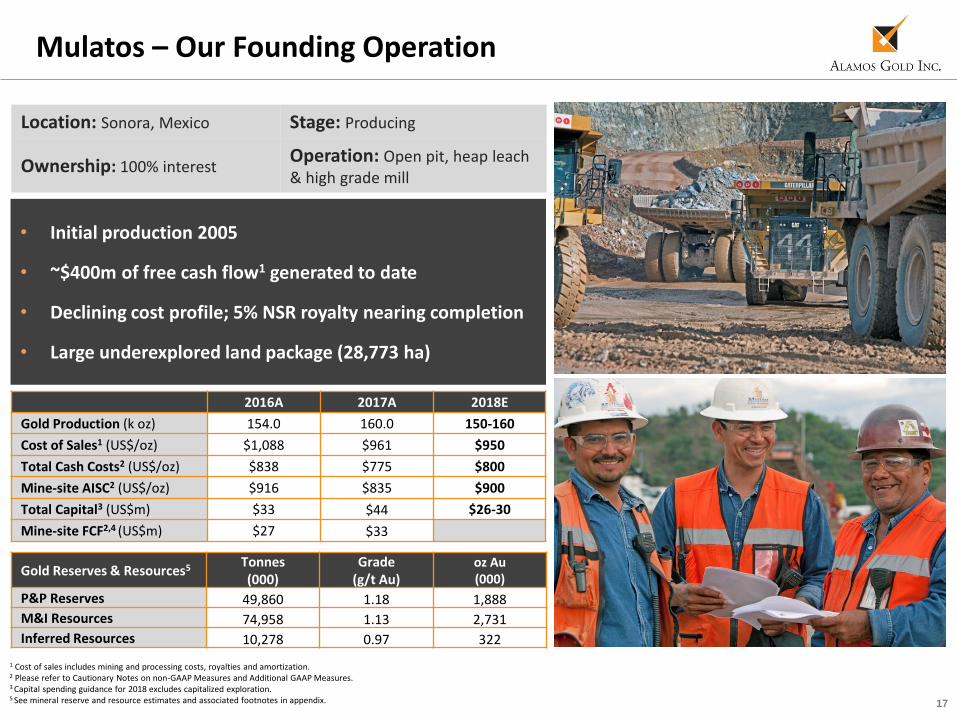
Mulatos – Our Founding Operation
Location: Sonora, Mexico Stage: Producing
Ownership: 100% interestOperation: Open pit, heap leach & high grade mill
2016A 2017A 2018E
Gold Production (k oz) 154.0 160.0 150-160
Cost of Sales1 (US$/oz) $1,088 $961 $950
Total Cash Costs2 (US$/oz) $838 $775 $800
Mine-site AISC2 (US$/oz) $916 $835 $900
Total Capital3 (US$m) $33 $44 $26-30
Mine-site FCF2,4 (US$m) $27 $33
Gold Reserves & Resources5 Tonnes (000)
Grade (g/t Au)
oz Au(000)
P&P Reserves 49,860 1.18 1,888
M&I Resources 74,958 1.13 2,731
Inferred Resources 10,278 0.97 322
1 Cost of sales includes mining and processing costs, royalties and amortization.2 Please refer to Cautionary Notes on non-GAAP Measures and Additional GAAP Measures.3 Capital spending guidance for 2018 excludes capitalized exploration. 5 See mineral reserve and resource estimates and associated footnotes in appendix.
• Initial production 2005
• ~$400m of free cash flow1 generated to date
• Declining cost profile; 5% NSR royalty nearing completion
• Large underexplored land package (28,773 ha)
18
220 259
778 879
47
115
156
236
-
200
400
600
800
1,000
1,200
2014 2015 2016 2017
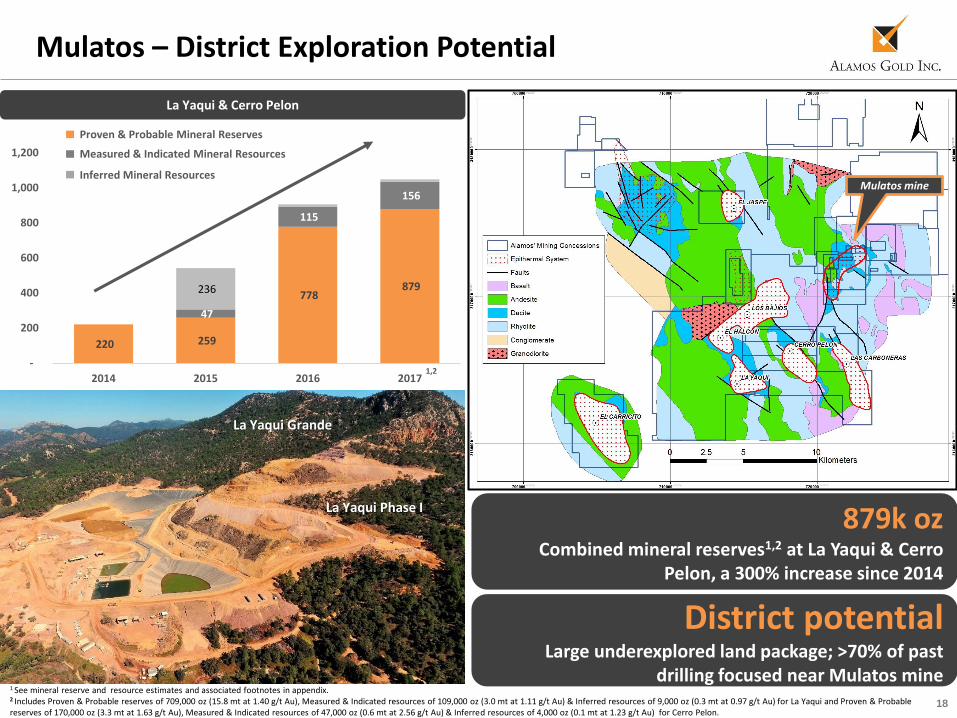
La Yaqui & Cerro Pelon
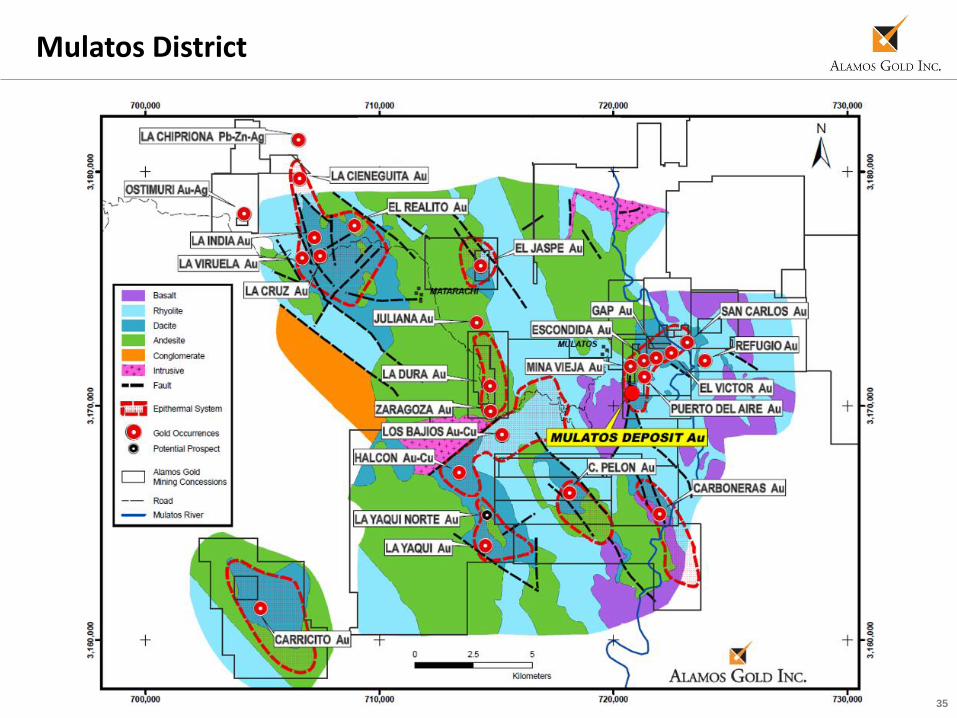
Mulatos – District Exploration Potential
1 See mineral reserve and resource estimates and associated footnotes in appendix.2 Includes Proven & Probable reserves of 709,000 oz (15.8 mt at 1.40 g/t Au), Measured & Indicated resources of 109,000 oz (3.0 mt at 1.11 g/t Au) & Inferred resources of 9,000 oz (0.3 mt at 0.97 g/t Au) for La Yaqui and Proven & Probable reserves of 170,000 oz (3.3 mt at 1.63 g/t Au), Measured & Indicated resources of 47,000 oz (0.6 mt at 2.56 g/t Au) & Inferred resources of 4,000 oz (0.1 mt at 1.23 g/t Au) for Cerro Pelon.
District potentialLarge underexplored land package; >70% of past
drilling focused near Mulatos mine
Mulatos District
Mulatos mine
Proven & Probable Mineral Reserves
Inferred Mineral Resources
Measured & Indicated Mineral Resources
1,2
La Yaqui Phase I
La Yaqui Grande
879k ozCombined mineral reserves1,2 at La Yaqui & Cerro
Pelon, a 300% increase since 2014
19
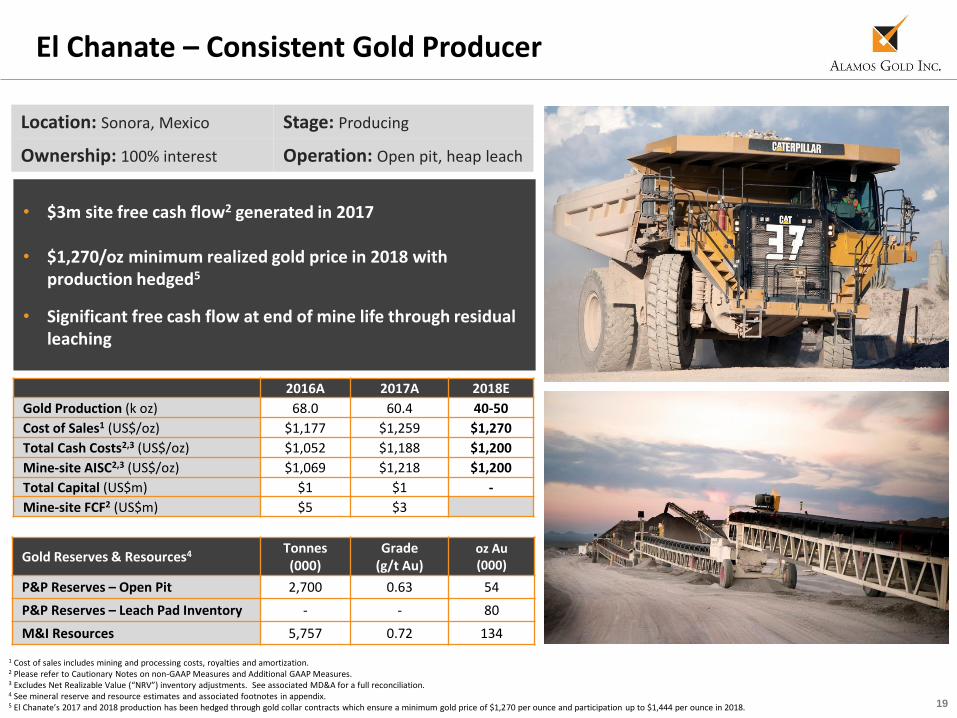
El Chanate – Consistent Gold Producer
Location: Sonora, Mexico Stage: Producing
Ownership: 100% interest Operation: Open pit, heap leach
Gold Reserves & Resources4 Tonnes (000)
Grade (g/t Au)
oz Au(000)
P&P Reserves – Open Pit 2,700 0.63 54
P&P Reserves – Leach Pad Inventory - - 80
M&I Resources 5,757 0.72 134
2016A 2017A 2018E
Gold Production (k oz) 68.0 60.4 40-50
Cost of Sales1 (US$/oz) $1,177 $1,259 $1,270
Total Cash Costs2,3 (US$/oz) $1,052 $1,188 $1,200
Mine-site AISC2,3 (US$/oz) $1,069 $1,218 $1,200
Total Capital (US$m) $1 $1 -
Mine-site FCF2 (US$m) $5 $3
1 Cost of sales includes mining and processing costs, royalties and amortization.2 Please refer to Cautionary Notes on non-GAAP Measures and Additional GAAP Measures.3 Excludes Net Realizable Value (“NRV”) inventory adjustments. See associated MD&A for a full reconciliation.4 See mineral reserve and resource estimates and associated footnotes in appendix.5 El Chanate’s 2017 and 2018 production has been hedged through gold collar contracts which ensure a minimum gold price of $1,270 per ounce and participation up to $1,444 per ounce in 2018.
• $3m site free cash flow2 generated in 2017
• $1,270/oz minimum realized gold price in 2018 with production hedged5
• Significant free cash flow at end of mine life through residual leaching
20
Development – Peer Leading Growth Profile
Low cost, low capital intensity growth
Capacity to doublecurrent rate of production
6 development projects
21
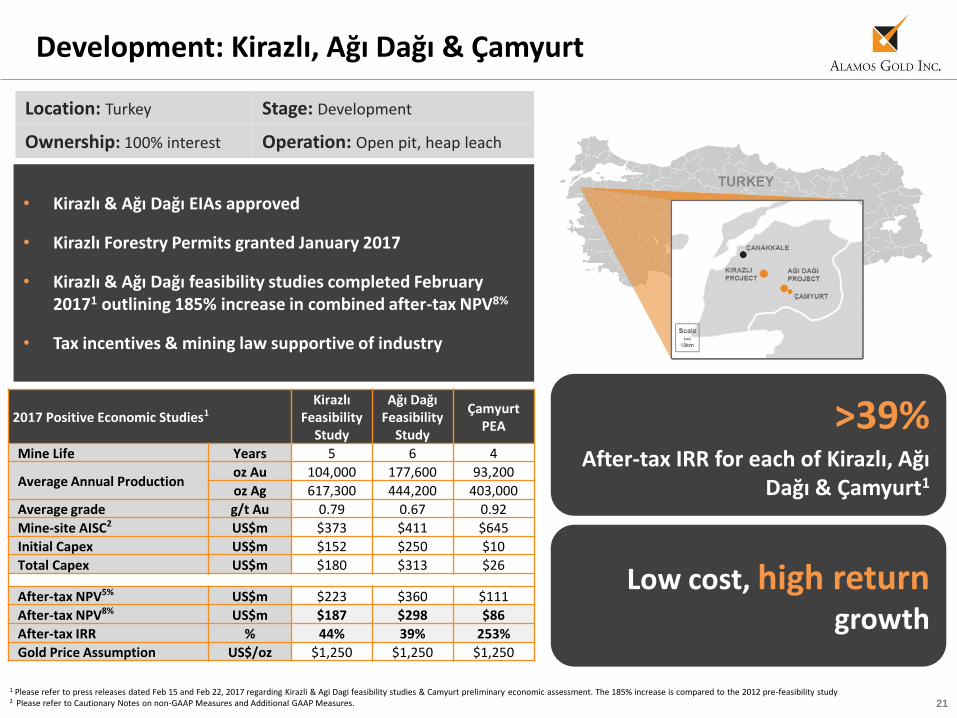
Development: Kirazlı, Ağı Dağı & Çamyurt
Location: Turkey Stage: Development
Ownership: 100% interest Operation: Open pit, heap leach
• Kirazlı & Ağı Dağı EIAs approved
• Kirazlı Forestry Permits granted January 2017
• Kirazlı & Ağı Dağı feasibility studies completed February 20171 outlining 185% increase in combined after-tax NPV8%
• Tax incentives & mining law supportive of industry
1 Please refer to press releases dated Feb 15 and Feb 22, 2017 regarding Kirazli & Agi Dagi feasibility studies & Camyurt preliminary economic assessment. The 185% increase is compared to the 2012 pre-feasibility study2 Please refer to Cautionary Notes on non-GAAP Measures and Additional GAAP Measures.
>39%After-tax IRR for each of Kirazlı, Ağı
Dağı & Çamyurt1
Low cost, high returngrowth
2017 Positive Economic Studies1Kirazlı
Feasibility Study
Ağı Dağı Feasibility
Study
ÇamyurtPEA
Mine Life Years 5 6 4
Average Annual Productionoz Au 104,000 177,600 93,200
oz Ag 617,300 444,200 403,000
Average grade g/t Au 0.79 0.67 0.92
Mine-site AISC2 US$m $373 $411 $645
Initial Capex US$m $152 $250 $10
Total Capex US$m $180 $313 $26
After-tax NPV5% US$m $223 $360 $111
After-tax NPV8% US$m $187 $298 $86
After-tax IRR % 44% 39% 253%
Gold Price Assumption US$/oz $1,250 $1,250 $1,250
22
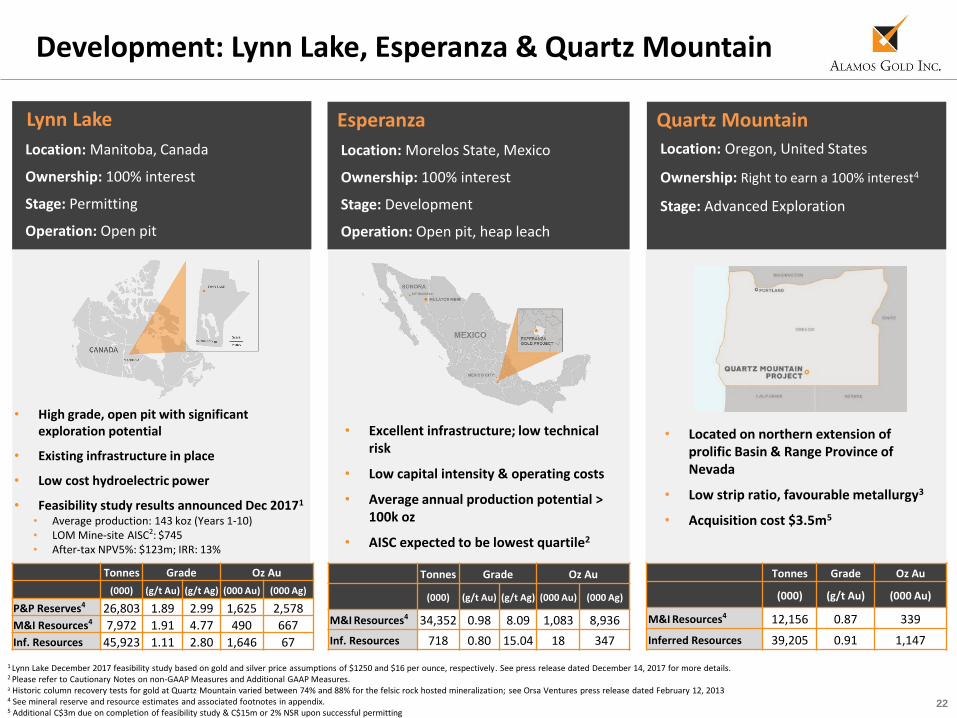
Quartz Mountain
Location: Oregon, United States
Ownership: Right to earn a 100% interest4
Stage: Advanced Exploration
Esperanza
Location: Morelos State, Mexico
Ownership: 100% interest
Stage: Development
Operation: Open pit, heap leach
Development: Lynn Lake, Esperanza & Quartz Mountain
1 Lynn Lake December 2017 feasibility study based on gold and silver price assumptions of $1250 and $16 per ounce, respectively. See press release dated December 14, 2017 for more details.2 Please refer to Cautionary Notes on non-GAAP Measures and Additional GAAP Measures.3 Historic column recovery tests for gold at Quartz Mountain varied between 74% and 88% for the felsic rock hosted mineralization; see Orsa Ventures press release dated February 12, 20134 See mineral reserve and resource estimates and associated footnotes in appendix.5 Additional C$3m due on completion of feasibility study & C$15m or 2% NSR upon successful permitting
Lynn Lake
Location: Manitoba, Canada
Ownership: 100% interest
Stage: Permitting
Operation: Open pit
Tonnes Grade Oz Au
(000) (g/t Au) (g/t Ag) (000 Au) (000 Ag)
M&I Resources4 34,352 0.98 8.09 1,083 8,936
Inf. Resources 718 0.80 15.04 18 347
Tonnes Grade Oz Au
(000) (g/t Au) (000 Au)
M&I Resources4 12,156 0.87 339
Inferred Resources 39,205 0.91 1,147
• Excellent infrastructure; low technical risk
• Low capital intensity & operating costs
• Average annual production potential > 100k oz
• AISC expected to be lowest quartile2
• Located on northern extension of prolific Basin & Range Province of Nevada
• Low strip ratio, favourable metallurgy3
• Acquisition cost $3.5m5
• High grade, open pit with significant exploration potential
• Existing infrastructure in place
• Low cost hydroelectric power
• Feasibility study results announced Dec 20171
• Average production: 143 koz (Years 1-10)• LOM Mine-site AISC2: $745• After-tax NPV5%: $123m; IRR: 13%
Tonnes Grade Oz Au
(000) (g/t Au) (g/t Ag) (000 Au) (000 Ag)
P&P Reserves4 26,803 1.89 2.99 1,625 2,578
M&I Resources4 7,972 1.91 4.77 490 667
Inf. Resources 45,923 1.11 2.80 1,646 67
23
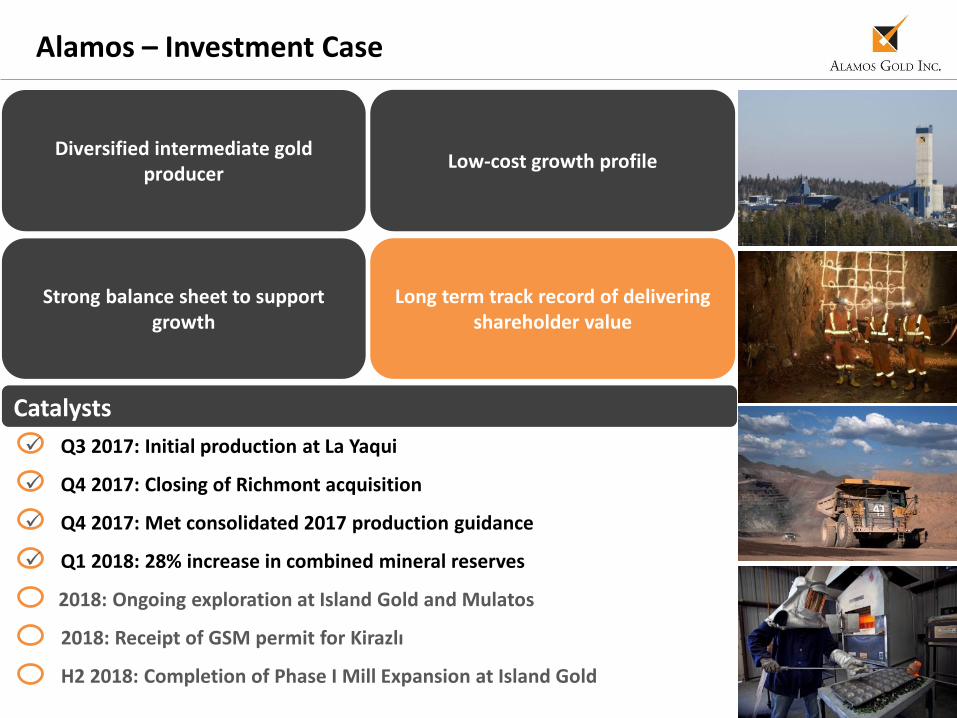
Alamos – Investment Case
Catalysts
Diversified intermediate gold producer
Low-cost growth profile
Strong balance sheet to support growth
Long term track record of delivering shareholder value
Q3 2017: Initial production at La Yaqui
Q4 2017: Closing of Richmont acquisition
Q4 2017: Met consolidated 2017 production guidance
Q1 2018: 28% increase in combined mineral reserves
2018: Ongoing exploration at Island Gold and Mulatos
2018: Receipt of GSM permit for Kirazlı
H2 2018: Completion of Phase I Mill Expansion at Island Gold
24
Appendices

25
Board of Directors and Executive and Management Team
Board of Directors
Executive and Management Team
Paul J. Murphy John A.
McCluskey Mark J. Daniel
Patrick D. Downey
David Fleck David GowerClaire M. C.
KennedyRonald E. Smith Kenneth Stowe
Chairman Director Director Director Director Director Director Director Director
John A. McCluskey Jamie Porter Peter MacPhail Christine Barwell Chris Bostwick Luis Chavez
President and CEO Chief Financial Officer Chief Operating Officer VP, Human Resources VP, Technical Services Senior VP, Mexico
Andrew Cormier Nils Engelstad Greg Fisher Aoife McGrath Scott Parsons Colin Webster
VP, Development & Construction VP, General Counsel VP, Finance VP, Exploration VP, Investor Relations VP Sustainability & External Affairs
26
Sustainability
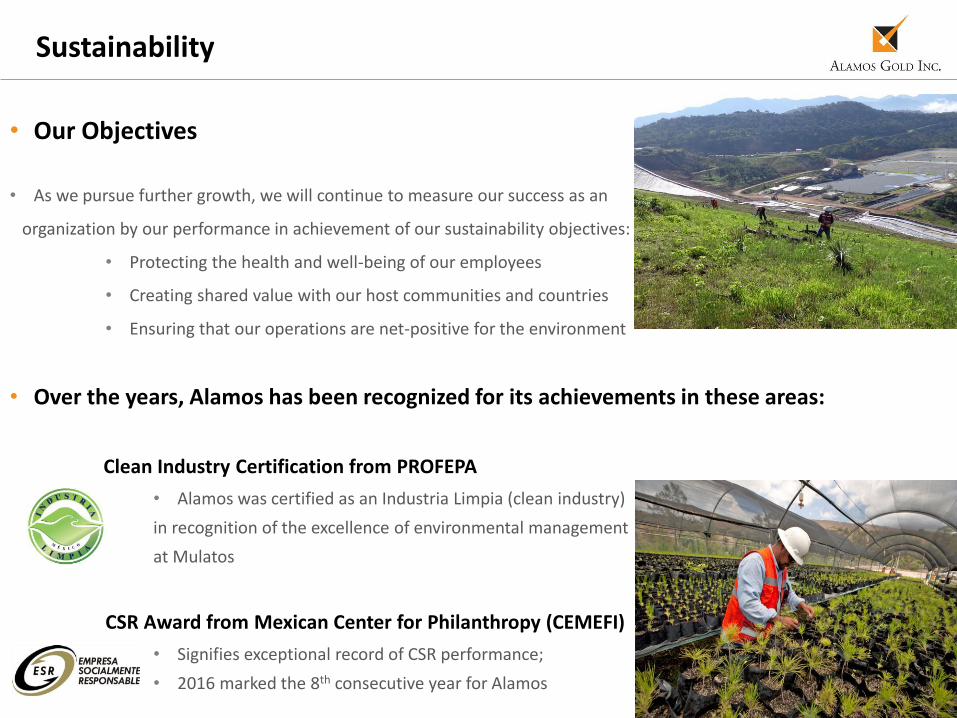
• Our Objectives
• As we pursue further growth, we will continue to measure our success as an
organization by our performance in achievement of our sustainability objectives:
• Protecting the health and well-being of our employees
• Creating shared value with our host communities and countries
• Ensuring that our operations are net-positive for the environment
• Over the years, Alamos has been recognized for its achievements in these areas:
Clean Industry Certification from PROFEPA
• Alamos was certified as an Industria Limpia (clean industry)
in recognition of the excellence of environmental management
at Mulatos
CSR Award from Mexican Center for Philanthropy (CEMEFI)
• Signifies exceptional record of CSR performance;
• 2016 marked the 8th consecutive year for Alamos
27
2018 Guidance – Alamos
2018 Guidance 2017 GuidanceYoung-
DavidsonIsland Gold Mulatos El Chanate Total Total
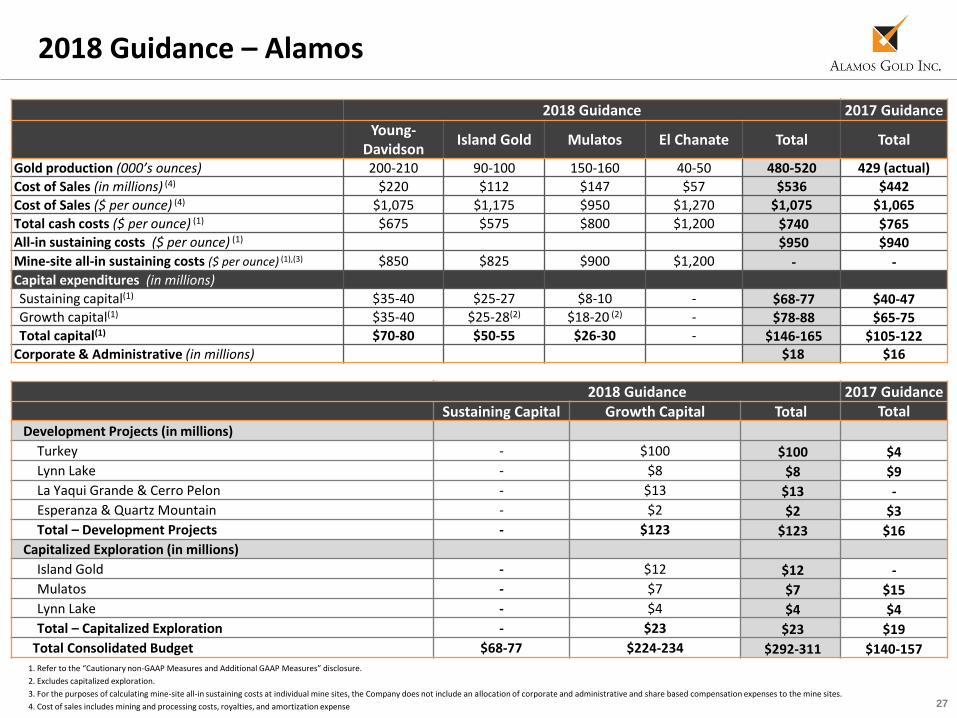
Gold production (000’s ounces) 200-210 90-100 150-160 40-50 480-520 429 (actual)
Cost of Sales (in millions) (4) $220 $112 $147 $57 $536 $442
Cost of Sales ($ per ounce) (4) $1,075 $1,175 $950 $1,270 $1,075 $1,065
Total cash costs ($ per ounce) (1) $675 $575 $800 $1,200 $740 $765All-in sustaining costs ($ per ounce) (1) $950 $940
Mine-site all-in sustaining costs ($ per ounce) (1),(3) $850 $825 $900 $1,200 - -Capital expenditures (in millions)
Sustaining capital(1) $35-40 $25-27 $8-10 - $68-77 $40-47Growth capital(1) $35-40 $25-28(2) $18-20 (2) - $78-88 $65-75Total capital(1) $70-80 $50-55 $26-30 - $146-165 $105-122
Corporate & Administrative (in millions) $18 $16
1. Refer to the “Cautionary non-GAAP Measures and Additional GAAP Measures” disclosure.
2. Excludes capitalized exploration.
3. For the purposes of calculating mine-site all-in sustaining costs at individual mine sites, the Company does not include an allocation of corporate and administrative and share based compensation expenses to the mine sites.
4. Cost of sales includes mining and processing costs, royalties, and amortization expense
2018 Guidance 2017 GuidanceSustaining Capital Growth Capital Total Total
Development Projects (in millions)
Turkey - $100 $100 $4
Lynn Lake - $8 $8 $9
La Yaqui Grande & Cerro Pelon - $13 $13 -
Esperanza & Quartz Mountain - $2 $2 $3
Total – Development Projects - $123 $123 $16
Capitalized Exploration (in millions)
Island Gold - $12 $12 -
Mulatos - $7 $7 $15
Lynn Lake - $4 $4 $4
Total – Capitalized Exploration - $23 $23 $19
Total Consolidated Budget $68-77 $224-234 $292-311 $140-157
28
Young-Davidson – Increasing Grade & Productivity
1 Cost of sales includes mining and processing costs, royalties and amortization.2 Please refer to Cautionary Notes on non-GAAP Measures and Additional GAAP Measures.3 Excludes Net Realizable Value (“NRV”) inventory adjustments. See associated MD&A for a full reconciliation.4 Excludes hydro rebate not attributable to Q4/15
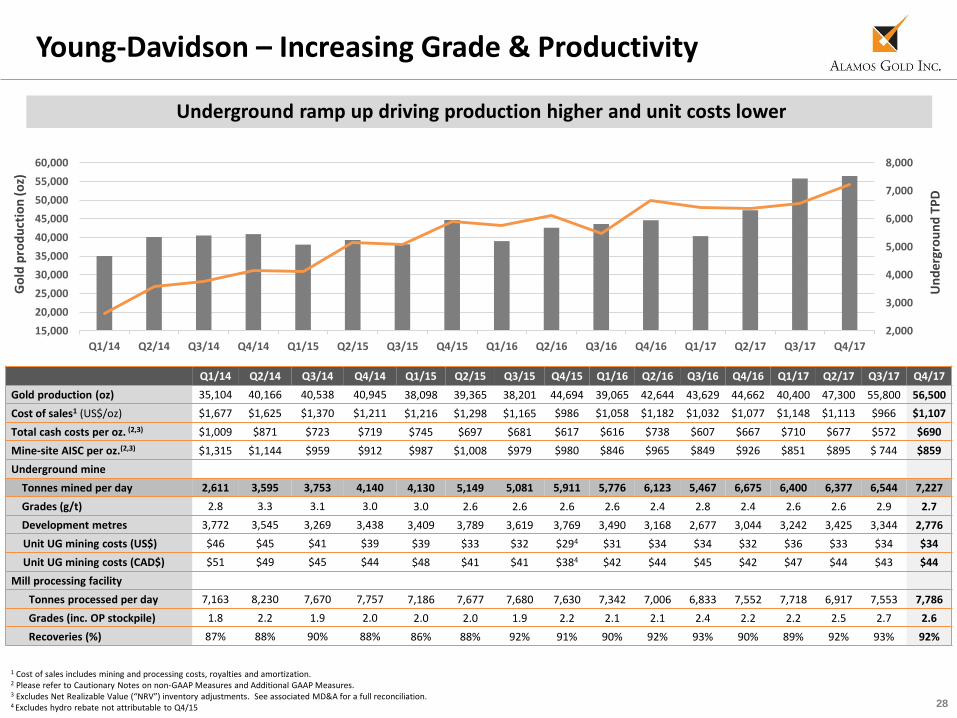
Underground ramp up driving production higher and unit costs lower
Q1/14 Q2/14 Q3/14 Q4/14 Q1/15 Q2/15 Q3/15 Q4/15 Q1/16 Q2/16 Q3/16 Q4/16 Q1/17 Q2/17 Q3/17 Q4/17
Gold production (oz) 35,104 40,166 40,538 40,945 38,098 39,365 38,201 44,694 39,065 42,644 43,629 44,662 40,400 47,300 55,800 56,500
Cost of sales1 (US$/oz) $1,677 $1,625 $1,370 $1,211 $1,216 $1,298 $1,165 $986 $1,058 $1,182 $1,032 $1,077 $1,148 $1,113 $966 $1,107
Total cash costs per oz. (2,3) $1,009 $871 $723 $719 $745 $697 $681 $617 $616 $738 $607 $667 $710 $677 $572 $690
Mine-site AISC per oz.(2,3) $1,315 $1,144 $959 $912 $987 $1,008 $979 $980 $846 $965 $849 $926 $851 $895 $ 744 $859
Underground mine
Tonnes mined per day 2,611 3,595 3,753 4,140 4,130 5,149 5,081 5,911 5,776 6,123 5,467 6,675 6,400 6,377 6,544 7,227
Grades (g/t) 2.8 3.3 3.1 3.0 3.0 2.6 2.6 2.6 2.6 2.4 2.8 2.4 2.6 2.6 2.9 2.7
Development metres 3,772 3,545 3,269 3,438 3,409 3,789 3,619 3,769 3,490 3,168 2,677 3,044 3,242 3,425 3,344 2,776
Unit UG mining costs (US$) $46 $45 $41 $39 $39 $33 $32 $294 $31 $34 $34 $32 $36 $33 $34 $34
Unit UG mining costs (CAD$) $51 $49 $45 $44 $48 $41 $41 $384 $42 $44 $45 $42 $47 $44 $43 $44
Mill processing facility
Tonnes processed per day 7,163 8,230 7,670 7,757 7,186 7,677 7,680 7,630 7,342 7,006 6,833 7,552 7,718 6,917 7,553 7,786
Grades (inc. OP stockpile) 1.8 2.2 1.9 2.0 2.0 2.0 1.9 2.2 2.1 2.1 2.4 2.2 2.2 2.5 2.7 2.6
Recoveries (%) 87% 88% 90% 88% 86% 88% 92% 91% 90% 92% 93% 90% 89% 92% 93% 92%
Un
der
gro
un
d T
PD
Go
ld p
rod
uct
ion
(o
z)
2,000
3,000
4,000
5,000
6,000
7,000
8,000
15,000
20,000
25,000
30,000
35,000
40,000
45,000
50,000
55,000
60,000
Q1/14 Q2/14 Q3/14 Q4/14 Q1/15 Q2/15 Q3/15 Q4/15 Q1/16 Q2/16 Q3/16 Q4/16 Q1/17 Q2/17 Q3/17 Q4/17
29
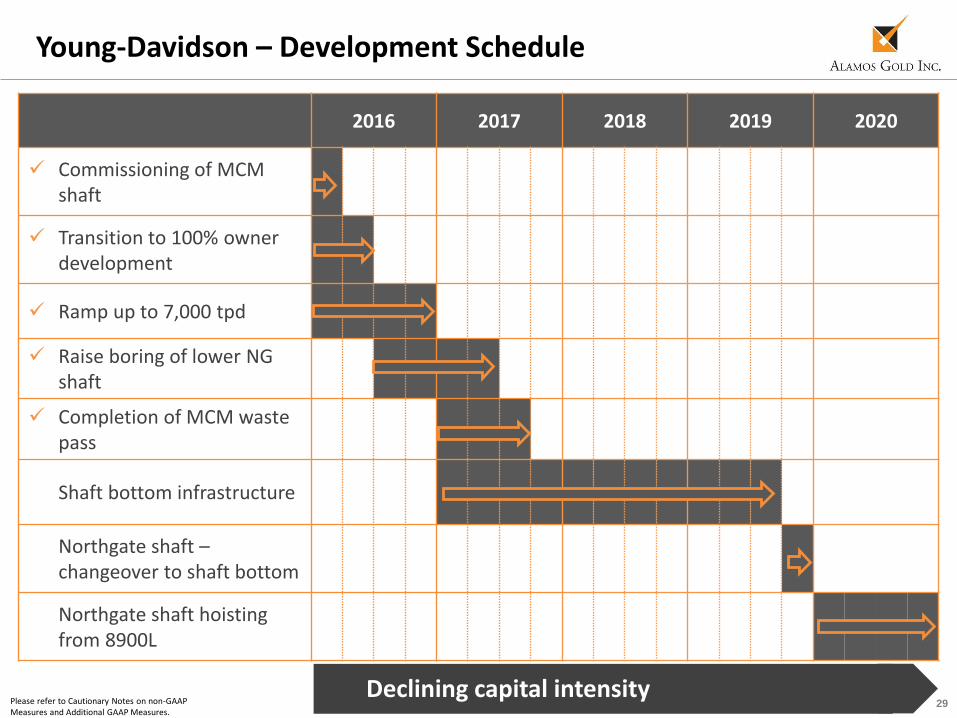
2016 2017 2018 2019 2020
Commissioning of MCM shaft
Transition to 100% owner development
Ramp up to 7,000 tpd
Raise boring of lower NG shaft
Completion of MCM waste pass
• Shaft bottom infrastructure
• Northgate shaft –changeover to shaft bottom
• Northgate shaft hoisting from 8900L
Young-Davidson – Development Schedule
Please refer to Cautionary Notes on non-GAAP Measures and Additional GAAP Measures.
Declining capital intensity
30
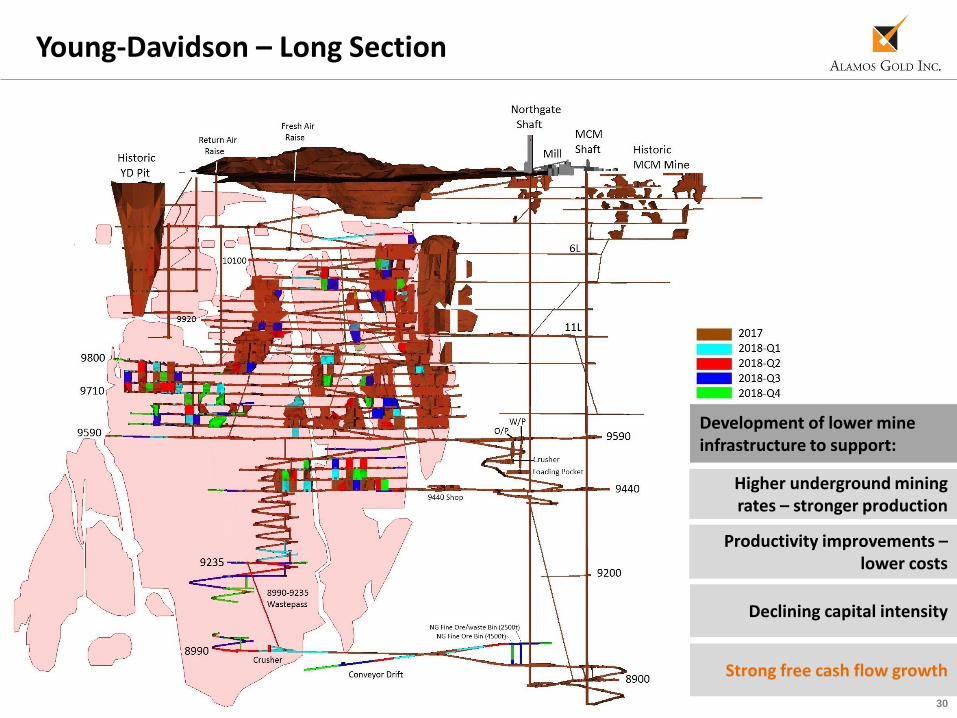
Young-Davidson – Long Section
Declining capital intensity
Higher underground mining rates – stronger production
Strong free cash flow growth
Development of lower mine infrastructure to support:
Productivity improvements –lower costs
31
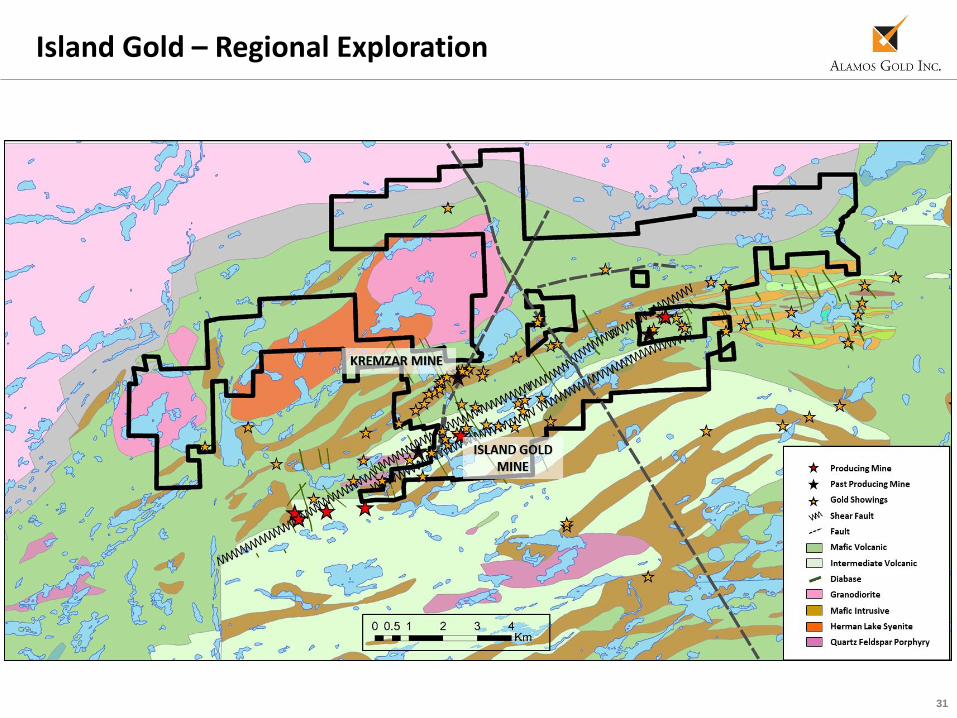
Island Gold – Regional Exploration
32
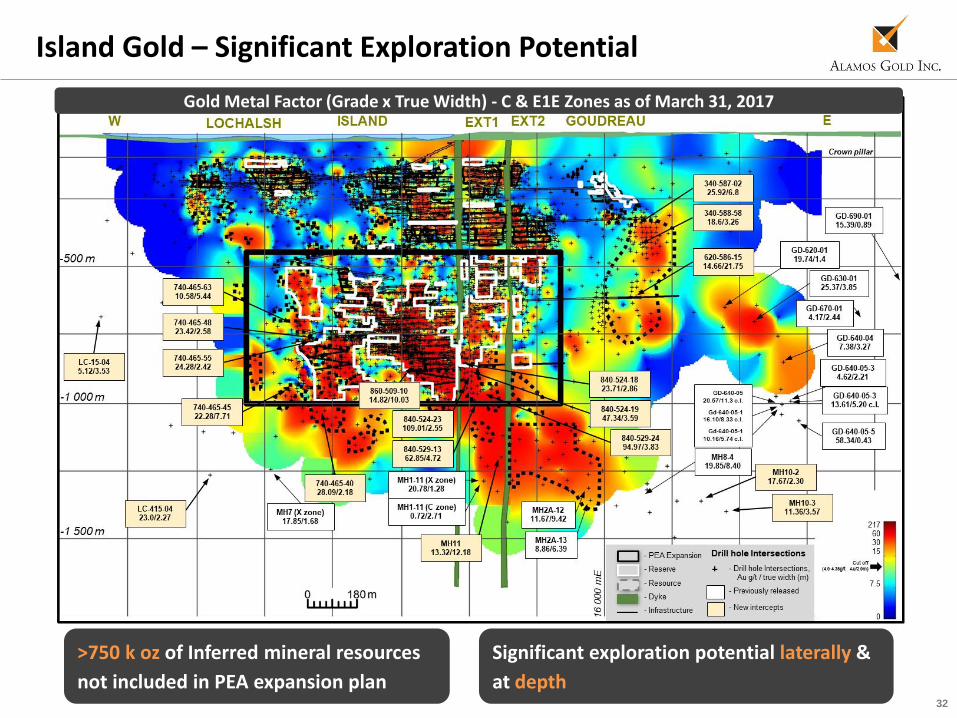
Island Gold – Significant Exploration Potential
Gold Metal Factor (Grade x True Width) - C & E1E Zones as of March 31, 2017
Significant exploration potential laterally &
at depth
>750 k oz of Inferred mineral resources
not included in PEA expansion plan
33
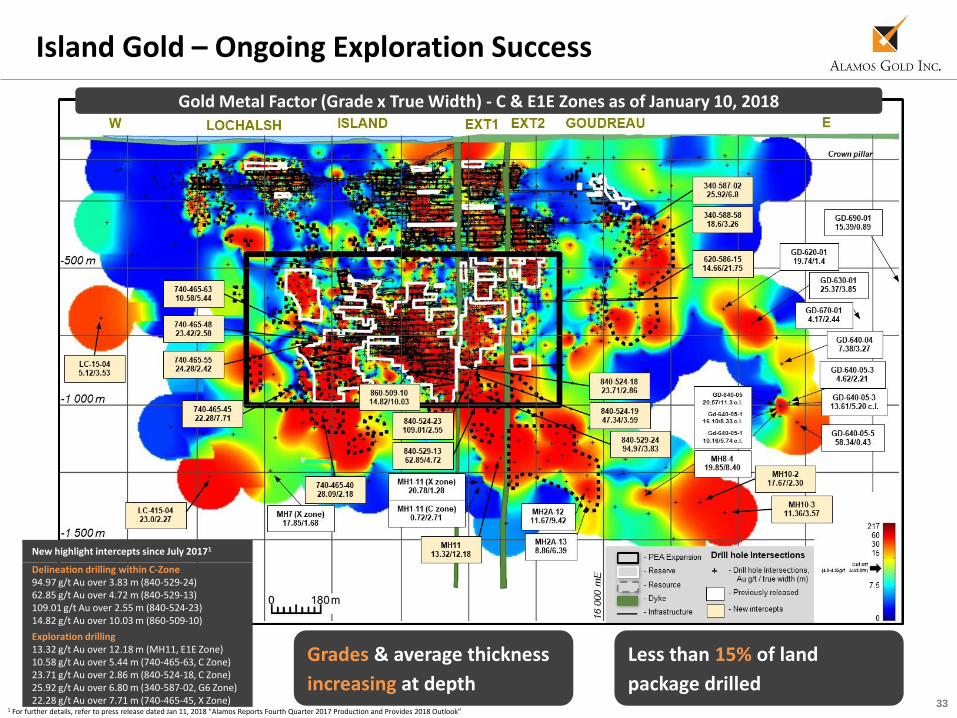
Island Gold – Ongoing Exploration Success
Gold Metal Factor (Grade x True Width) - C & E1E Zones as of January 10, 2018
Delineation drilling within C-Zone94.97 g/t Au over 3.83 m (840-529-24)62.85 g/t Au over 4.72 m (840-529-13)109.01 g/t Au over 2.55 m (840-524-23)14.82 g/t Au over 10.03 m (860-509-10)
Exploration drilling13.32 g/t Au over 12.18 m (MH11, E1E Zone)10.58 g/t Au over 5.44 m (740-465-63, C Zone)23.71 g/t Au over 2.86 m (840-524-18, C Zone)25.92 g/t Au over 6.80 m (340-587-02, G6 Zone)22.28 g/t Au over 7.71 m (740-465-45, X Zone)
Grades & average thickness
increasing at depth
Less than 15% of land
package drilled1 For further details, refer to press release dated Jan 11, 2018 “Alamos Reports Fourth Quarter 2017 Production and Provides 2018 Outlook”
New highlight intercepts since July 20171
34
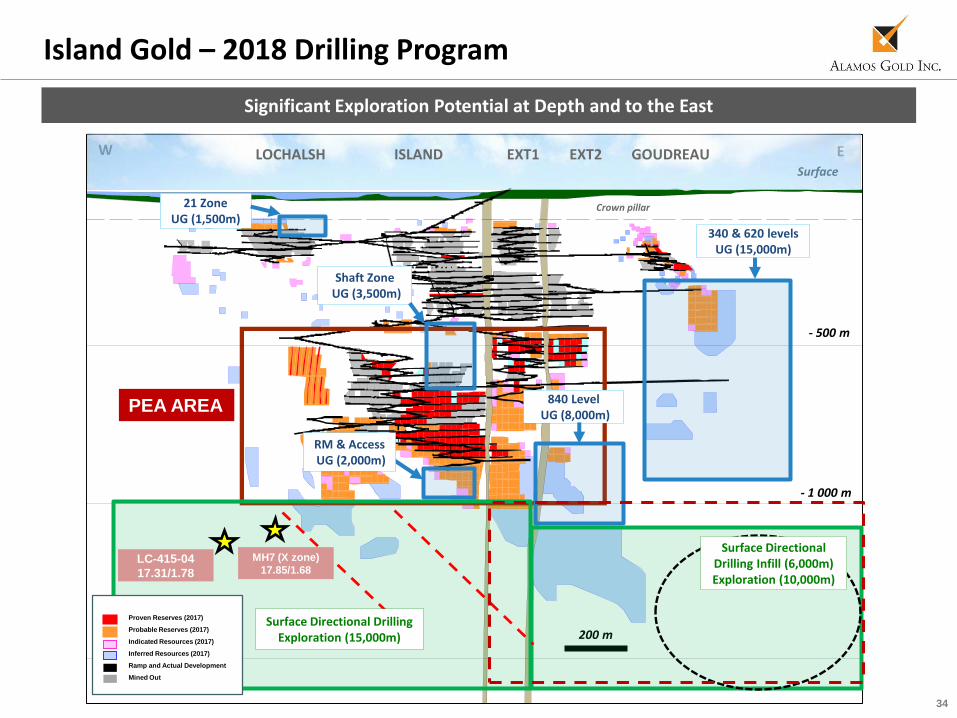
Island Gold – 2018 Drilling Program
Significant Exploration Potential at Depth and to the East
W E
200 m
PEA AREA
- 1 000 m
Surface
Surface Directional Drilling Exploration (15,000m)
MH7 (X zone)
17.85/1.68
- 500 m
LC-415-04
17.31/1.78
GOUDREAULOCHALSH ISLAND EXT1 EXT2
Crown pillar21 Zone UG (1,500m)
Shaft ZoneUG (3,500m)
340 & 620 levelsUG (15,000m)
840 LevelUG (8,000m)
RM & Access UG (2,000m)
Proven Reserves (2017)
Probable Reserves (2017)
Indicated Resources (2017)
Inferred Resources (2017)
Ramp and Actual Development
Mined Out
Surface Directional Drilling Infill (6,000m)Exploration (10,000m)
35
Mulatos District
36
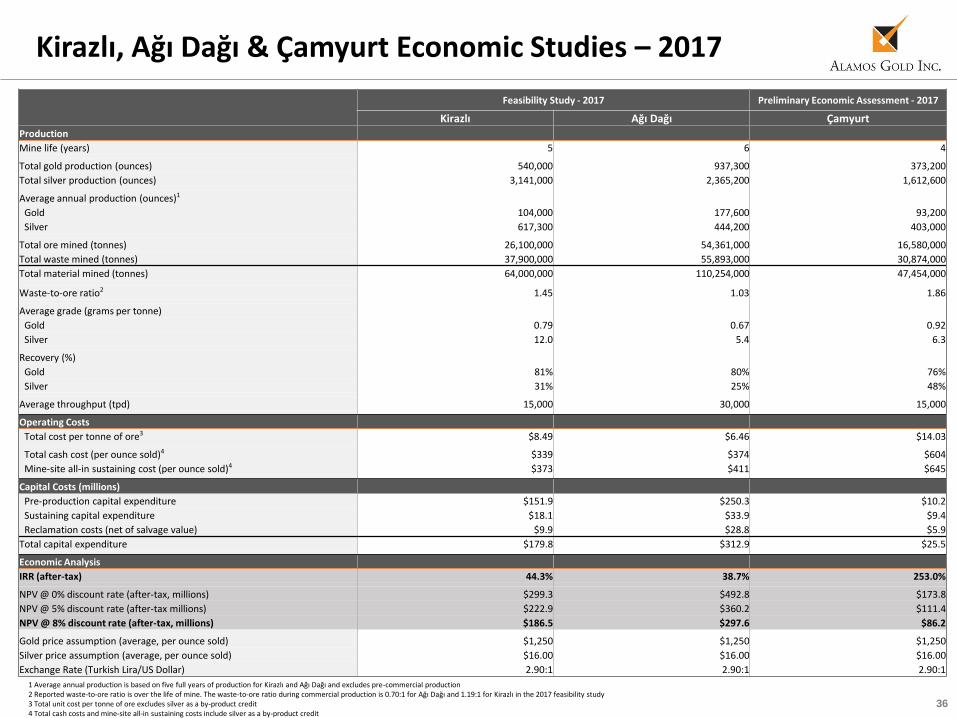
Kirazlı, Ağı Dağı & Çamyurt Economic Studies – 2017
Feasibility Study - 2017 Preliminary Economic Assessment - 2017
Kirazlı Ağı Dağı ÇamyurtProduction
Mine life (years) 5 6 4
Total gold production (ounces) 540,000 937,300 373,200
Total silver production (ounces) 3,141,000 2,365,200 1,612,600
Average annual production (ounces)1
Gold 104,000 177,600 93,200
Silver 617,300 444,200 403,000
Total ore mined (tonnes) 26,100,000 54,361,000 16,580,000
Total waste mined (tonnes) 37,900,000 55,893,000 30,874,000
Total material mined (tonnes) 64,000,000 110,254,000 47,454,000
Waste-to-ore ratio2 1.45 1.03 1.86
Average grade (grams per tonne)
Gold 0.79 0.67 0.92
Silver 12.0 5.4 6.3
Recovery (%)
Gold 81% 80% 76%
Silver 31% 25% 48%
Average throughput (tpd) 15,000 30,000 15,000
Operating Costs
Total cost per tonne of ore3 $8.49 $6.46 $14.03
Total cash cost (per ounce sold)4 $339 $374 $604
Mine-site all-in sustaining cost (per ounce sold)4 $373 $411 $645
Capital Costs (millions)
Pre-production capital expenditure $151.9 $250.3 $10.2
Sustaining capital expenditure $18.1 $33.9 $9.4
Reclamation costs (net of salvage value) $9.9 $28.8 $5.9
Total capital expenditure $179.8 $312.9 $25.5
Economic Analysis
IRR (after-tax) 44.3% 38.7% 253.0%
NPV @ 0% discount rate (after-tax, millions) $299.3 $492.8 $173.8
NPV @ 5% discount rate (after-tax millions) $222.9 $360.2 $111.4
NPV @ 8% discount rate (after-tax, millions) $186.5 $297.6 $86.2
Gold price assumption (average, per ounce sold) $1,250 $1,250 $1,250
Silver price assumption (average, per ounce sold) $16.00 $16.00 $16.00
Exchange Rate (Turkish Lira/US Dollar) 2.90:1 2.90:1 2.90:1
1 Average annual production is based on five full years of production for Kirazlı and Ağı Dağı and excludes pre-commercial production2 Reported waste-to-ore ratio is over the life of mine. The waste-to-ore ratio during commercial production is 0.70:1 for Ağı Dağı and 1.19:1 for Kirazlı in the 2017 feasibility study3 Total unit cost per tonne of ore excludes silver as a by-product credit 4 Total cash costs and mine-site all-in sustaining costs include silver as a by-product credit
37
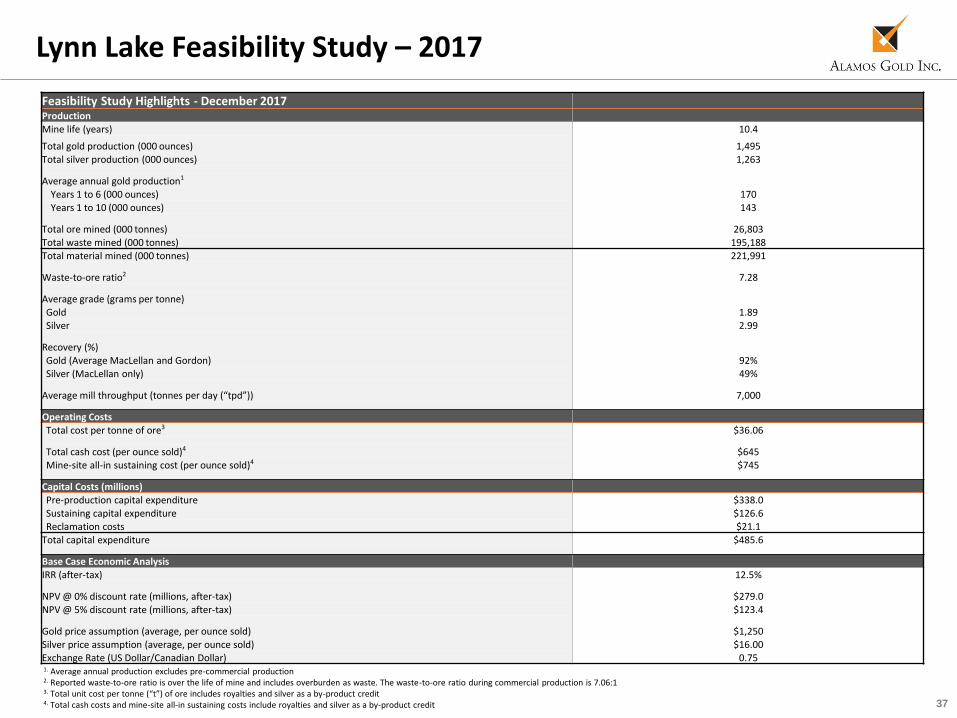
Lynn Lake Feasibility Study – 2017
Feasibility Study Highlights - December 2017Production Mine life (years) 10.4
Total gold production (000 ounces) 1,495Total silver production (000 ounces) 1,263
Average annual gold production1
Years 1 to 6 (000 ounces) 170Years 1 to 10 (000 ounces) 143
Total ore mined (000 tonnes) 26,803Total waste mined (000 tonnes) 195,188Total material mined (000 tonnes) 221,991
Waste-to-ore ratio2 7.28
Average grade (grams per tonne)Gold 1.89Silver 2.99
Recovery (%)Gold (Average MacLellan and Gordon) 92%Silver (MacLellan only) 49%
Average mill throughput (tonnes per day (“tpd”)) 7,000
Operating CostsTotal cost per tonne of ore3 $36.06
Total cash cost (per ounce sold)4 $645 Mine-site all-in sustaining cost (per ounce sold)4 $745
Capital Costs (millions)Pre-production capital expenditure $338.0Sustaining capital expenditure $126.6Reclamation costs $21.1
Total capital expenditure $485.6
Base Case Economic Analysis IRR (after-tax) 12.5%
NPV @ 0% discount rate (millions, after-tax) $279.0 NPV @ 5% discount rate (millions, after-tax) $123.4
Gold price assumption (average, per ounce sold) $1,250Silver price assumption (average, per ounce sold) $16.00Exchange Rate (US Dollar/Canadian Dollar) 0.751. Average annual production excludes pre-commercial production2. Reported waste-to-ore ratio is over the life of mine and includes overburden as waste. The waste-to-ore ratio during commercial production is 7.06:1 3. Total unit cost per tonne (“t”) of ore includes royalties and silver as a by-product credit4. Total cash costs and mine-site all-in sustaining costs include royalties and silver as a by-product credit
38
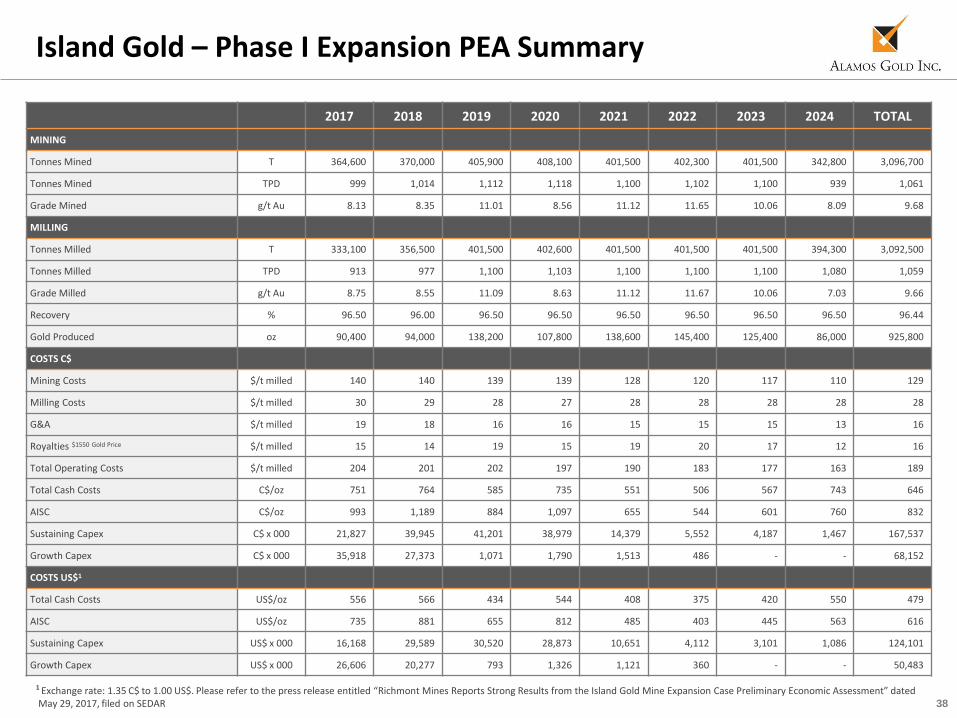
Island Gold – Phase I Expansion PEA Summary
2017 2018 2019 2020 2021 2022 2023 2024 TOTAL
MINING
Tonnes Mined T 364,600 370,000 405,900 408,100 401,500 402,300 401,500 342,800 3,096,700
Tonnes Mined TPD 999 1,014 1,112 1,118 1,100 1,102 1,100 939 1,061
Grade Mined g/t Au 8.13 8.35 11.01 8.56 11.12 11.65 10.06 8.09 9.68
MILLING
Tonnes Milled T 333,100 356,500 401,500 402,600 401,500 401,500 401,500 394,300 3,092,500
Tonnes Milled TPD 913 977 1,100 1,103 1,100 1,100 1,100 1,080 1,059
Grade Milled g/t Au 8.75 8.55 11.09 8.63 11.12 11.67 10.06 7.03 9.66
Recovery % 96.50 96.00 96.50 96.50 96.50 96.50 96.50 96.50 96.44
Gold Produced oz 90,400 94,000 138,200 107,800 138,600 145,400 125,400 86,000 925,800
COSTS C$
Mining Costs $/t milled 140 140 139 139 128 120 117 110 129
Milling Costs $/t milled 30 29 28 27 28 28 28 28 28
G&A $/t milled 19 18 16 16 15 15 15 13 16
Royalties $1550 Gold Price $/t milled 15 14 19 15 19 20 17 12 16
Total Operating Costs $/t milled 204 201 202 197 190 183 177 163 189
Total Cash Costs C$/oz 751 764 585 735 551 506 567 743 646
AISC C$/oz 993 1,189 884 1,097 655 544 601 760 832
Sustaining Capex C$ x 000 21,827 39,945 41,201 38,979 14,379 5,552 4,187 1,467 167,537
Growth Capex C$ x 000 35,918 27,373 1,071 1,790 1,513 486 - - 68,152
COSTS US$1
Total Cash Costs US$/oz 556 566 434 544 408 375 420 550 479
AISC US$/oz 735 881 655 812 485 403 445 563 616
Sustaining Capex US$ x 000 16,168 29,589 30,520 28,873 10,651 4,112 3,101 1,086 124,101
Growth Capex US$ x 000 26,606 20,277 793 1,326 1,121 360 - - 50,483
1 Exchange rate: 1.35 C$ to 1.00 US$. Please refer to the press release entitled “Richmont Mines Reports Strong Results from the Island Gold Mine Expansion Case Preliminary Economic Assessment” datedMay 29, 2017, filed on SEDAR
39
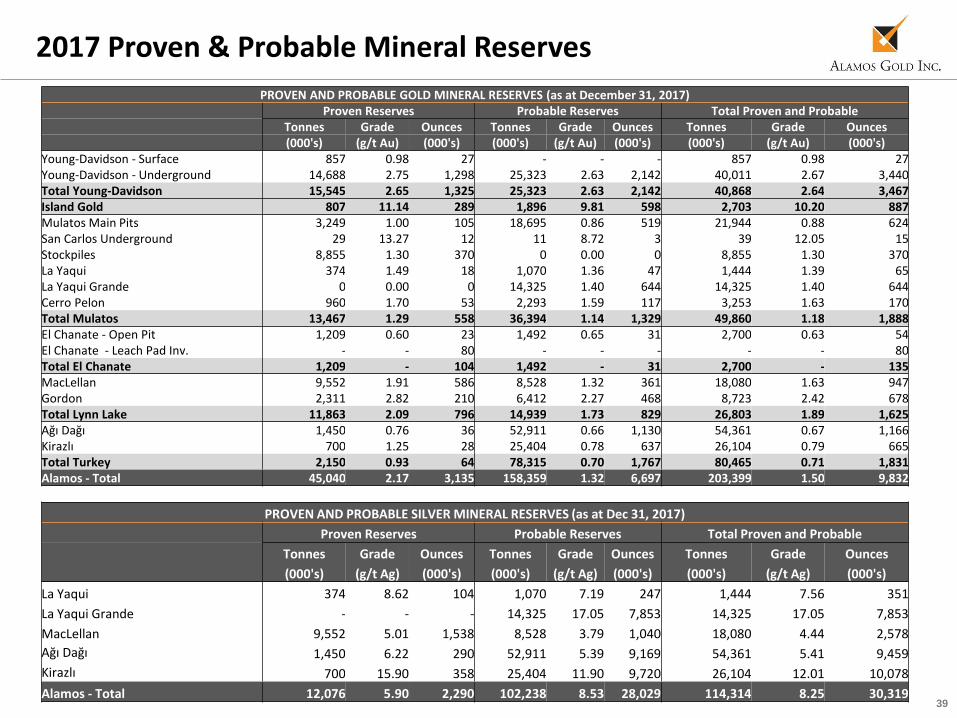
2017 Proven & Probable Mineral Reserves
PROVEN AND PROBABLE GOLD MINERAL RESERVES (as at December 31, 2017)Proven Reserves Probable Reserves Total Proven and Probable
Tonnes Grade Ounces Tonnes Grade Ounces Tonnes Grade Ounces(000's) (g/t Au) (000's) (000's) (g/t Au) (000's) (000's) (g/t Au) (000's)
Young-Davidson - Surface 857 0.98 27 - - - 857 0.98 27Young-Davidson - Underground 14,688 2.75 1,298 25,323 2.63 2,142 40,011 2.67 3,440Total Young-Davidson 15,545 2.65 1,325 25,323 2.63 2,142 40,868 2.64 3,467Island Gold 807 11.14 289 1,896 9.81 598 2,703 10.20 887Mulatos Main Pits 3,249 1.00 105 18,695 0.86 519 21,944 0.88 624San Carlos Underground 29 13.27 12 11 8.72 3 39 12.05 15Stockpiles 8,855 1.30 370 0 0.00 0 8,855 1.30 370La Yaqui 374 1.49 18 1,070 1.36 47 1,444 1.39 65La Yaqui Grande 0 0.00 0 14,325 1.40 644 14,325 1.40 644Cerro Pelon 960 1.70 53 2,293 1.59 117 3,253 1.63 170Total Mulatos 13,467 1.29 558 36,394 1.14 1,329 49,860 1.18 1,888El Chanate - Open Pit 1,209 0.60 23 1,492 0.65 31 2,700 0.63 54El Chanate - Leach Pad Inv. - - 80 - - - - - 80Total El Chanate 1,209 - 104 1,492 - 31 2,700 - 135MacLellan 9,552 1.91 586 8,528 1.32 361 18,080 1.63 947Gordon 2,311 2.82 210 6,412 2.27 468 8,723 2.42 678Total Lynn Lake 11,863 2.09 796 14,939 1.73 829 26,803 1.89 1,625Ağı Dağı 1,450 0.76 36 52,911 0.66 1,130 54,361 0.67 1,166Kirazlı 700 1.25 28 25,404 0.78 637 26,104 0.79 665Total Turkey 2,150 0.93 64 78,315 0.70 1,767 80,465 0.71 1,831Alamos - Total 45,040 2.17 3,135 158,359 1.32 6,697 203,399 1.50 9,832
PROVEN AND PROBABLE SILVER MINERAL RESERVES (as at Dec 31, 2017)
Proven Reserves Probable Reserves Total Proven and Probable
Tonnes Grade Ounces Tonnes Grade Ounces Tonnes Grade Ounces
(000's) (g/t Ag) (000's) (000's) (g/t Ag) (000's) (000's) (g/t Ag) (000's)
La Yaqui 374 8.62 104 1,070 7.19 247 1,444 7.56 351
La Yaqui Grande - - - 14,325 17.05 7,853 14,325 17.05 7,853
MacLellan 9,552 5.01 1,538 8,528 3.79 1,040 18,080 4.44 2,578
Ağı Dağı 1,450 6.22 290 52,911 5.39 9,169 54,361 5.41 9,459
Kirazlı 700 15.90 358 25,404 11.90 9,720 26,104 12.01 10,078
Alamos - Total 12,076 5.90 2,290 102,238 8.53 28,029 114,314 8.25 30,319
40
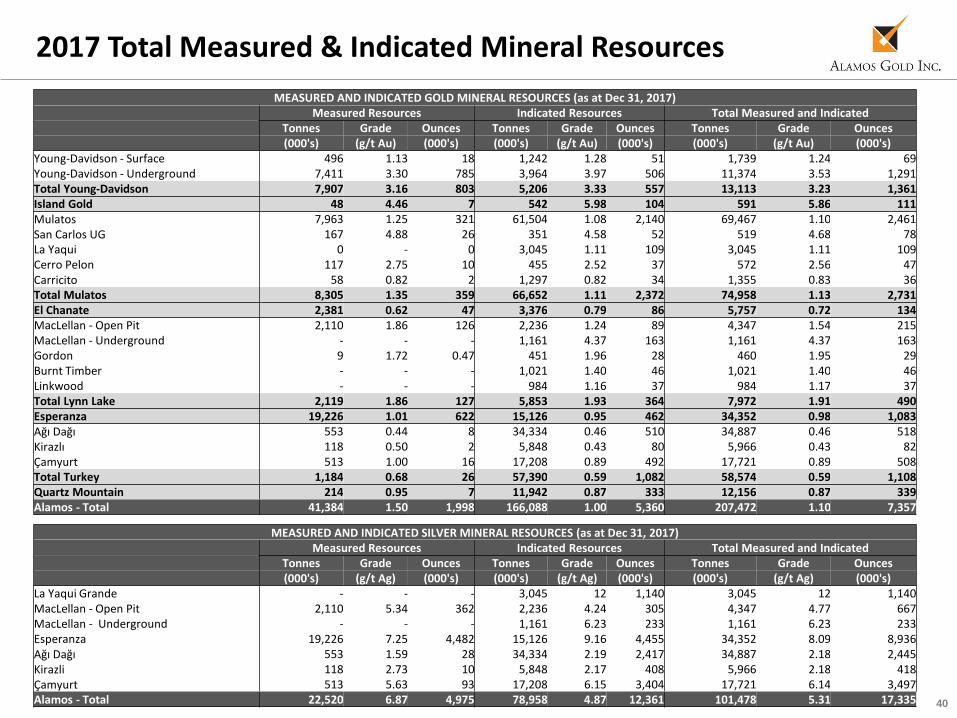
2017 Total Measured & Indicated Mineral Resources
MEASURED AND INDICATED GOLD MINERAL RESOURCES (as at Dec 31, 2017)Measured Resources Indicated Resources Total Measured and Indicated
Tonnes Grade Ounces Tonnes Grade Ounces Tonnes Grade Ounces(000's) (g/t Au) (000's) (000's) (g/t Au) (000's) (000's) (g/t Au) (000's)
Young-Davidson - Surface 496 1.13 18 1,242 1.28 51 1,739 1.24 69Young-Davidson - Underground 7,411 3.30 785 3,964 3.97 506 11,374 3.53 1,291Total Young-Davidson 7,907 3.16 803 5,206 3.33 557 13,113 3.23 1,361Island Gold 48 4.46 7 542 5.98 104 591 5.86 111Mulatos 7,963 1.25 321 61,504 1.08 2,140 69,467 1.10 2,461San Carlos UG 167 4.88 26 351 4.58 52 519 4.68 78La Yaqui 0 - 0 3,045 1.11 109 3,045 1.11 109Cerro Pelon 117 2.75 10 455 2.52 37 572 2.56 47Carricito 58 0.82 2 1,297 0.82 34 1,355 0.83 36Total Mulatos 8,305 1.35 359 66,652 1.11 2,372 74,958 1.13 2,731El Chanate 2,381 0.62 47 3,376 0.79 86 5,757 0.72 134MacLellan - Open Pit 2,110 1.86 126 2,236 1.24 89 4,347 1.54 215MacLellan - Underground - - - 1,161 4.37 163 1,161 4.37 163Gordon 9 1.72 0.47 451 1.96 28 460 1.95 29Burnt Timber - - - 1,021 1.40 46 1,021 1.40 46Linkwood - - - 984 1.16 37 984 1.17 37Total Lynn Lake 2,119 1.86 127 5,853 1.93 364 7,972 1.91 490Esperanza 19,226 1.01 622 15,126 0.95 462 34,352 0.98 1,083Ağı Dağı 553 0.44 8 34,334 0.46 510 34,887 0.46 518Kirazlı 118 0.50 2 5,848 0.43 80 5,966 0.43 82Çamyurt 513 1.00 16 17,208 0.89 492 17,721 0.89 508Total Turkey 1,184 0.68 26 57,390 0.59 1,082 58,574 0.59 1,108Quartz Mountain 214 0.95 7 11,942 0.87 333 12,156 0.87 339Alamos - Total 41,384 1.50 1,998 166,088 1.00 5,360 207,472 1.10 7,357
MEASURED AND INDICATED SILVER MINERAL RESOURCES (as at Dec 31, 2017)Measured Resources Indicated Resources Total Measured and Indicated
Tonnes Grade Ounces Tonnes Grade Ounces Tonnes Grade Ounces(000's) (g/t Ag) (000's) (000's) (g/t Ag) (000's) (000's) (g/t Ag) (000's)
La Yaqui Grande - - - 3,045 12 1,140 3,045 12 1,140MacLellan - Open Pit 2,110 5.34 362 2,236 4.24 305 4,347 4.77 667MacLellan - Underground - - - 1,161 6.23 233 1,161 6.23 233Esperanza 19,226 7.25 4,482 15,126 9.16 4,455 34,352 8.09 8,936Ağı Dağı 553 1.59 28 34,334 2.19 2,417 34,887 2.18 2,445Kirazli 118 2.73 10 5,848 2.17 408 5,966 2.18 418Çamyurt 513 5.63 93 17,208 6.15 3,404 17,721 6.14 3,497Alamos - Total 22,520 6.87 4,975 78,958 4.87 12,361 101,478 5.31 17,335
41
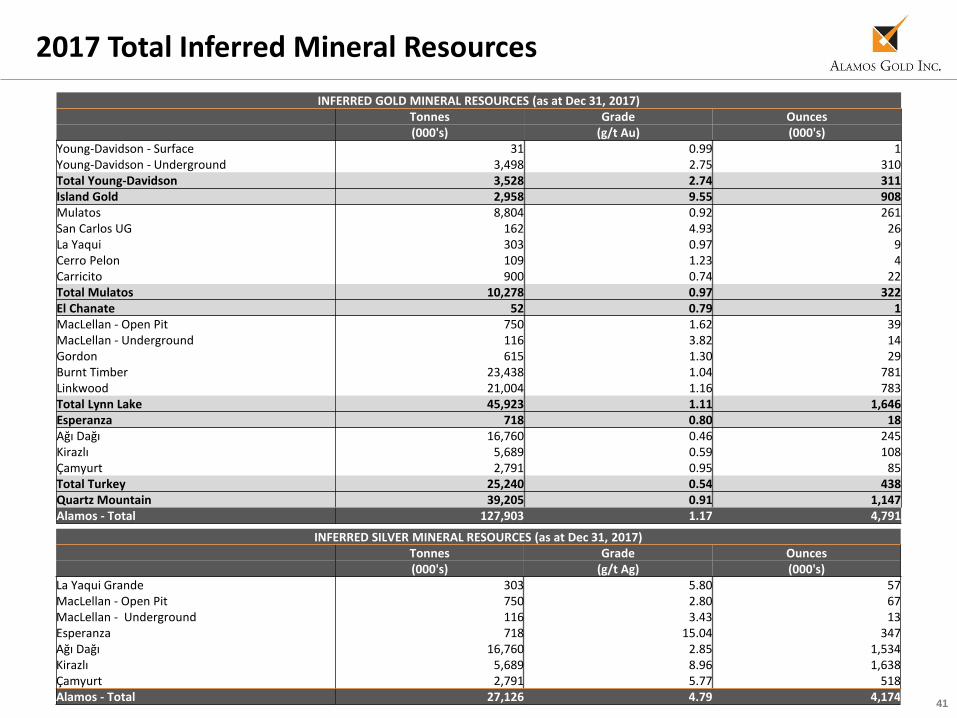
2017 Total Inferred Mineral Resources
INFERRED GOLD MINERAL RESOURCES (as at Dec 31, 2017)Tonnes Grade Ounces(000's) (g/t Au) (000's)
Young-Davidson - Surface 31 0.99 1Young-Davidson - Underground 3,498 2.75 310Total Young-Davidson 3,528 2.74 311Island Gold 2,958 9.55 908Mulatos 8,804 0.92 261San Carlos UG 162 4.93 26La Yaqui 303 0.97 9Cerro Pelon 109 1.23 4Carricito 900 0.74 22Total Mulatos 10,278 0.97 322El Chanate 52 0.79 1MacLellan - Open Pit 750 1.62 39MacLellan - Underground 116 3.82 14Gordon 615 1.30 29Burnt Timber 23,438 1.04 781Linkwood 21,004 1.16 783Total Lynn Lake 45,923 1.11 1,646Esperanza 718 0.80 18Ağı Dağı 16,760 0.46 245Kirazlı 5,689 0.59 108Çamyurt 2,791 0.95 85Total Turkey 25,240 0.54 438Quartz Mountain 39,205 0.91 1,147Alamos - Total 127,903 1.17 4,791
INFERRED SILVER MINERAL RESOURCES (as at Dec 31, 2017)Tonnes Grade Ounces(000's) (g/t Ag) (000's)
La Yaqui Grande 303 5.80 57MacLellan - Open Pit 750 2.80 67MacLellan - Underground 116 3.43 13Esperanza 718 15.04 347Ağı Dağı 16,760 2.85 1,534Kirazlı 5,689 8.96 1,638Çamyurt 2,791 5.77 518Alamos - Total 27,126 4.79 4,174
42
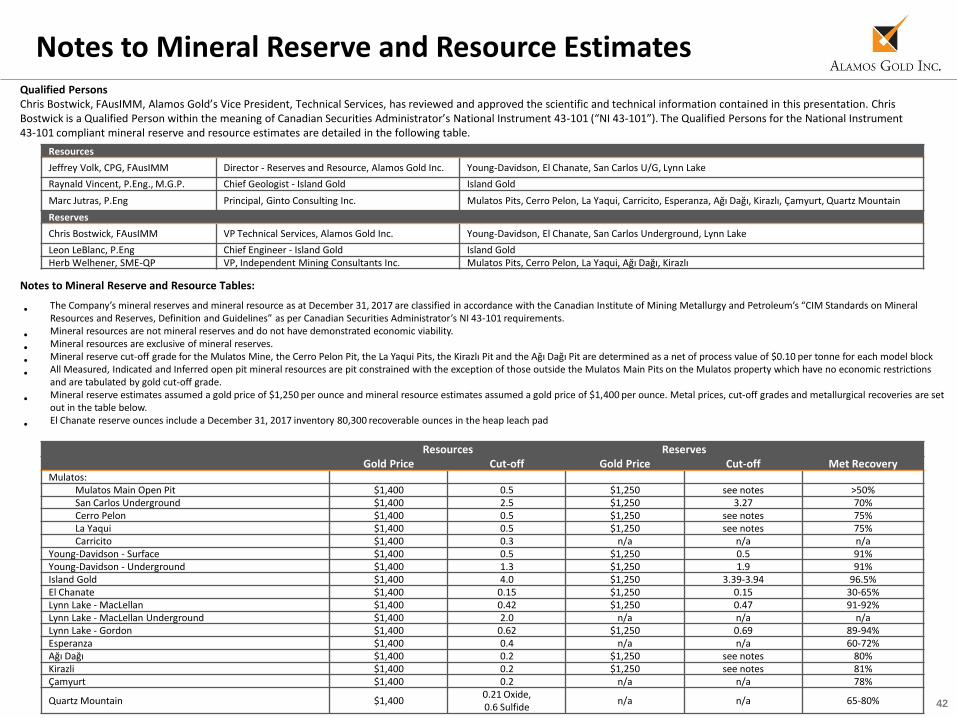
Notes to Mineral Reserve and Resource Estimates
Notes to Mineral Reserve and Resource Tables:
• The Company’s mineral reserves and mineral resource as at December 31, 2017 are classified in accordance with the Canadian Institute of Mining Metallurgy and Petroleum’s “CIM Standards on Mineral Resources and Reserves, Definition and Guidelines” as per Canadian Securities Administrator’s NI 43-101 requirements.
• Mineral resources are not mineral reserves and do not have demonstrated economic viability.
• Mineral resources are exclusive of mineral reserves.
• Mineral reserve cut-off grade for the Mulatos Mine, the Cerro Pelon Pit, the La Yaqui Pits, the Kirazlı Pit and the Ağı Dağı Pit are determined as a net of process value of $0.10 per tonne for each model block
• All Measured, Indicated and Inferred open pit mineral resources are pit constrained with the exception of those outside the Mulatos Main Pits on the Mulatos property which have no economic restrictions and are tabulated by gold cut-off grade.
• Mineral reserve estimates assumed a gold price of $1,250 per ounce and mineral resource estimates assumed a gold price of $1,400 per ounce. Metal prices, cut-off grades and metallurgical recoveries are set out in the table below.
• El Chanate reserve ounces include a December 31, 2017 inventory 80,300 recoverable ounces in the heap leach pad
Resources ReservesGold Price Cut-off Gold Price Cut-off Met Recovery
Mulatos:Mulatos Main Open Pit $1,400 0.5 $1,250 see notes >50%San Carlos Underground $1,400 2.5 $1,250 3.27 70%Cerro Pelon $1,400 0.5 $1,250 see notes 75%La Yaqui $1,400 0.5 $1,250 see notes 75%Carricito $1,400 0.3 n/a n/a n/a
Young-Davidson - Surface $1,400 0.5 $1,250 0.5 91%Young-Davidson - Underground $1,400 1.3 $1,250 1.9 91%Island Gold $1,400 4.0 $1,250 3.39-3.94 96.5%El Chanate $1,400 0.15 $1,250 0.15 30-65%Lynn Lake - MacLellan $1,400 0.42 $1,250 0.47 91-92%Lynn Lake - MacLellan Underground $1,400 2.0 n/a n/a n/aLynn Lake - Gordon $1,400 0.62 $1,250 0.69 89-94%Esperanza $1,400 0.4 n/a n/a 60-72%Ağı Dağı $1,400 0.2 $1,250 see notes 80%Kirazli $1,400 0.2 $1,250 see notes 81%Çamyurt $1,400 0.2 n/a n/a 78%
Quartz Mountain $1,400 0.21 Oxide,0.6 Sulfide
n/a n/a 65-80%
Resources
Jeffrey Volk, CPG, FAusIMM Director - Reserves and Resource, Alamos Gold Inc. Young-Davidson, El Chanate, San Carlos U/G, Lynn Lake
Raynald Vincent, P.Eng., M.G.P. Chief Geologist - Island Gold Island Gold
Marc Jutras, P.Eng Principal, Ginto Consulting Inc. Mulatos Pits, Cerro Pelon, La Yaqui, Carricito, Esperanza, Ağı Dağı, Kirazlı, Çamyurt, Quartz Mountain
Reserves
Chris Bostwick, FAusIMM VP Technical Services, Alamos Gold Inc. Young-Davidson, El Chanate, San Carlos Underground, Lynn Lake
Leon LeBlanc, P.Eng Chief Engineer - Island Gold Island GoldHerb Welhener, SME-QP VP, Independent Mining Consultants Inc. Mulatos Pits, Cerro Pelon, La Yaqui, Ağı Dağı, Kirazlı
Qualified PersonsChris Bostwick, FAusIMM, Alamos Gold’s Vice President, Technical Services, has reviewed and approved the scientific and technical information contained in this presentation. Chris Bostwick is a Qualified Person within the meaning of Canadian Securities Administrator’s National Instrument 43-101 (“NI 43-101”). The Qualified Persons for the National Instrument 43-101 compliant mineral reserve and resource estimates are detailed in the following table.