MANAGEMENT’S DISCUSSION AND...
27
ALAMOS GOLD INC. MANAGEMENT’S DISCUSSION AND ANALYSIS (All amounts are expressed in United States dollars, unless otherwise stated) This management’s discussion and analysis (“MD&A”) of the operating results and financial position of Alamos Gold Inc. and its subsidiaries (the “Company") is for the three-month and six- periods ended June 30, 2013 compared to the three month and six-month periods ended June 30, 2012. Together with the condensed interim consolidated financial statements and related notes, the MD&A provides a detailed account and analysis of the Company’s financial and operating performance for the period. The Company’s functional and presentation currency is the United States dollar. This MD&A is current to July 23, 2013 and should be read in conjunction with the Company’s Annual Information Form and other public filings available at www.sedar.com (“SEDAR”) and on EDGAR at www.sec.gov. Management is responsible for the condensed interim consolidated financial statements referred to in this MD&A, and provides officers disclosure certifications filed with the SEC and Canadian provincial securities commissions. The Audit Committee reviews the condensed interim consolidated financial statements and MD&A, and recommends approval to the Company’s Board of Directors. The MD&A should be read in conjunction with the condensed interim consolidated financial statements of the Company and related notes, which have been prepared in accordance with International Financial Reporting Standards (“IFRS”). Refer to Note 3 of the December 31, 2012 consolidated financial statements for disclosure of the Company’s significant accounting policies. This discussion addresses matters we consider important for an understanding of our financial condition and results of operations as at and for the three and six-month periods ended June 30, 2013. Note to U.S. Investors All references to mineral reserves and resources contained in this MD&A are determined in accordance with National Instrument 43-101, Standards of Disclosure for Mineral Projects (“NI 43-101”) of the Canadian Securities Administrators (“CSA”) and Canadian Institute of Mining, Metallurgy and Petroleum (“CIM”) standards. While the terms “mineral resource,” “measured mineral resource,” “indicated mineral resource,” and “inferred mineral resource” are recognized and required by Canadian regulations, they are not defined terms under the Securities and Exchange Commission (“SEC”) standards in the United States (“U.S.”). As such, information contained in this MD&A concerning descriptions of mineralization and resources under Canadian standards may not be comparable to similar information made public by U.S. companies subject to the reporting and disclosure requirements of the SEC. “Indicated mineral resource” and “inferred mineral resource” have a great amount of uncertainty as to their existence and economic and legal feasibility. It cannot be assumed that all or any part of an “indicated mineral resource” or “inferred mineral resource” will ever be upgraded to a higher category of resource. Investors are cautioned not to assume that all or any part of the mineral deposits in these categories will ever be converted into proven and probable reserves.
Transcript of MANAGEMENT’S DISCUSSION AND...

ALAMOS GOLD INC.
MANAGEMENT’S DISCUSSION AND ANALYSIS (All amounts are expressed in United States dollars, unless otherwise stated)
This management’s discussion and analysis (“MD&A”) of the operating results and financial position of Alamos Gold Inc. and its subsidiaries (the “Company") is for the three-month and six-periods ended June 30, 2013 compared to the three month and six-month periods ended June 30, 2012. Together with the condensed interim consolidated financial statements and related notes, the MD&A provides a detailed account and analysis of the Company’s financial and operating performance for the period. The Company’s functional and presentation currency is the United States dollar. This MD&A is current to July 23, 2013 and should be read in conjunction with the Company’s Annual Information Form and other public filings available at www.sedar.com (“SEDAR”) and on EDGAR at www.sec.gov. Management is responsible for the condensed interim consolidated financial statements referred to in this MD&A, and provides officers disclosure certifications filed with the SEC and Canadian provincial securities commissions. The Audit Committee reviews the condensed interim consolidated financial statements and MD&A, and recommends approval to the Company’s Board of Directors.
The MD&A should be read in conjunction with the condensed interim consolidated financial statements of the Company and related notes, which have been prepared in accordance with International Financial Reporting Standards (“IFRS”). Refer to Note 3 of the December 31, 2012 consolidated financial statements for disclosure of the Company’s significant accounting policies. This discussion addresses matters we consider important for an understanding of our financial condition and results of operations as at and for the three and six-month periods ended June 30, 2013.
Note to U.S. Investors
All references to mineral reserves and resources contained in this MD&A are determined in accordance with National Instrument 43-101, Standards of Disclosure for Mineral Projects (“NI 43-101”) of the Canadian Securities Administrators (“CSA”) and Canadian Institute of Mining, Metallurgy and Petroleum (“CIM”) standards. While the terms “mineral resource,” “measured mineral resource,” “indicated mineral resource,” and “inferred mineral resource” are recognized and required by Canadian regulations, they are not defined terms under the Securities and Exchange Commission (“SEC”) standards in the United States (“U.S.”). As such, information contained in this MD&A concerning descriptions of mineralization and resources under Canadian standards may not be comparable to similar information made public by U.S. companies subject to the reporting and disclosure requirements of the SEC. “Indicated mineral resource” and “inferred mineral resource” have a great amount of uncertainty as to their existence and economic and legal feasibility. It cannot be assumed that all or any part of an “indicated mineral resource” or “inferred mineral resource” will ever be upgraded to a higher category of resource. Investors are cautioned not to assume that all or any part of the mineral deposits in these categories will ever be converted into proven and probable reserves.

Q 2 2 0 1 3 R E S U L T S
2
Overview
Alamos Gold Inc. is a publicly-traded company on the Toronto Stock Exchange (TSX: AGI) and New York Stock Exchange (NYSE: AGI). The Company owns and operates the Mulatos mine (“Mulatos” or the “Mine”) within the Salamandra group of concessions located in the State of Sonora in northwest Mexico. In addition, the Company owns the Ağı Dağı, Kirazlı and Çamyurt gold development projects, located in the Biga Peninsula of northwestern Turkey.
Mexico
The Salamandra group of concessions comprises 30,536 hectares, and contains the producing Mulatos mine as well as several advanced and grassroots exploration projects. The Mine achieved commercial production in 2006 and produces gold in dore form for shipment to a refinery. Exploration potential includes both mineralized extensions and satellite deposits in close proximity to the existing mining operations. Proven and probable reserves as at December 31, 2012 were 68.8 million tonnes grading 1.07 grams of gold per tonne of ore (“g/t Au”) for 2.4 million contained ounces of gold, providing for a remaining mine life of approximately nine years at current production levels.
Turkey
In early 2010, the Company acquired the 8,317 hectare Ağı Dağı and Kirazlı gold development projects in Turkey, which contain established mineral resources and several highly prospective exploration targets. In June 2012, the Company published a positive preliminary feasibility study for the Ağı Dağı and Kirazlı projects, showing total life of mine production of 1.5 million ounces of gold and 4.9 million ounces of silver. In addition, the Company owns the Çamyurt exploration project located approximately three kilometres (“km”) southeast of Ağı Dağı. In June 2012, the Company released an initial inferred mineral resource estimate for the Çamyurt project of 24.6 million tonnes grading 0.81 g/t Au and 4.77 g/t Ag for 640,000 ounces of gold and 3.8 million ounces of silver.
Measured and indicated mineral resources at Ağı Dağı and Kirazlı (reported at a 0.2 g/t Au cut-off) at December 31, 2012 total 126.3 million tonnes grading 0.60 g/t Au and 4.86 g/t silver (“Ag”) for approximately 2.4 million ounces of gold and 19.7 million ounces of silver. Inferred mineral resources total 25.6 million tonnes grading 0.46 g/t Au and 4.02 g/t Ag, for approximately 0.4 million contained ounces of gold and 3.3 million contained ounces of silver.
Second Quarter 2013 Highlights
During the second quarter of 2013, the Company;
Financial Performance
Sold 55,000 ounces of gold at an average realized price of $1,423 per ounce for quarterly revenues of $78.3 million
Realized proceeds of over $111.1 million on the disposition of the Company’s investment in the common shares of Aurizon Mines Limited (“Aurizon”)
Recognized quarterly earnings of $8.8 million ($0.07 per basic share). Earnings were adversely impacted by a number of adjustments, including a $6.8 million ($0.05 per basic share) accounting loss on the disposition of the Aurizon investment and total foreign exchange related losses of $4.9 million ($0.04 per basic share)

M A N A G E M E N T ’ S D I S C U S S I O N & A N A L Y S I S (All amounts are expressed in United States dollars, unless otherwise stated)
3
Generated cash from operating activities before changes in non-cash working capital of $33.8 million ($0.26 per basic share); after changes in non-cash working capital of $13.2 million ($0.10 per basic share)
Increased cash and cash equivalents to $466.4 million, and working capital to $505.5 million at June 30, 2013
Repurchased 211,300 shares under its normal course issuer bid at cost of $2.6 million
Operational Performance
Produced 53,000 ounces of gold, a 10% increase from the second quarter of 2012 Achieved average crusher throughput of 17,600 tonnes per day (“tpd”), above the
Company’s annual guidance of 17,500 tpd for the third consecutive quarter Reported lower than budgeted costs in all categories, including cash operating costs
(exclusive of the 5% royalty) of $378 per ounce of gold sold, total cash costs (including royalties) of $448 per ounce of gold sold, all-in sustaining costs of $682 per ounce of gold sold, and all-in costs of $861 per ounce of gold sold (refer to the “Cautionary non-GAAP Measures and Additional GAAP Measures” note at the end of this MD&A for a description of, and reconciliation of these amounts to those reported in the Company’s financial statements)
Subsequent to quarter-end:
Announced the friendly acquisition of Esperanza Resources Corporation (“Esperanza”) and its wholly-owned Esperanza gold project (formerly referred to as the Cerro Jumil gold project) in Morelos State, Mexico for cash consideration of approximately CAD$69.4 million, in addition to the issuance of approximately seven million warrants of Alamos (exercise price of CAD$29.48)
The approval of the environmental impact assessment (“EIA”) report for the Kirazlı project remains outstanding. As a result, the Company now expects first production from the Kirazlı project to be deferred until the first half of 2015 (previously end of 2014). The Company is in regular contact with the Turkish Ministry of the Environment and expects that the Kirazlı EIA will be approved in 2013
Results of Operations
While the gold price decreased significantly in the second quarter of 2013, the Company continues to realize strong operating margins as it benefits from its industry leading low cost structure. Gold production of 53,000 ounces in the second quarter of 2013 increased 10% compared to 48,200 ounces in the second quarter of 2012. On a year to date basis, gold production increased 22% to 108,000 ounces. In the table below, the tonnes of crushed ore stacked on the leach pad exclude mill tailings, which are included within the number of tonnes of crushed ore milled.

Q 2 2 0 1 3 R E S U L T S
4
The table below outlines key production indicators for the second quarter and year-to-date in 2013 and 2012:
Production summary Q2 2013 Q2 2012 YTD 2013 YTD 2012 Ounces produced (1) 53,000 48,200 108,000 88,700 Crushed ore stacked on leach pad (tonnes) (2)
1,552,000 1,486,000 3,124,000 2,711,000
Grade (g/t Au) 1.10 1.15 1.18 1.16 Contained ounces stacked 54,800 54,900 117,900 101,000 Crushed ore milled (tonnes) 46,000 44,500 91,600 69,600 Grade (g/t Au) 10.94 10.78 8.78 10.56 Contained ounces milled 16,200 15,400 25,800 23,600 Recovery ratio (ratio of total ounces produced to contained ounces stacked and milled)
75% 68% 75% 71%
Total ore mined (tonnes) 1,900,000 1,498,000 3,410,000 2,765,000 Waste mined (tonnes) 907,000 1,013,000 1,609,000 1,788,000 Total mined (tonnes) 2,807,000 2,511,000 5,019,000 4,553,000 Waste-to-ore ratio 0.48 0.68 0.47 0.65 Ore crushed per day (tonnes) – combined 17,600 16,800 17,700 15,300
(1) Reported gold production for Q2 2012 and YTD 2012 has been adjusted to reflect final refinery settlement. Reported gold production for Q2 2013 and YTD 2013 is subject to final refinery settlement and may be adjusted.
(2) Excludes mill tailings stacked on the heap leach pad during the period.
Gold Production
Higher gold production in the second quarter of 2013 relative to the second quarter of 2012 was attributable to both a higher recovery ratio and improved crusher throughput.
The recovery ratio in the second quarter and year to date in 2013 of 75% is consistent with the Company’s budget and higher than in the corresponding periods of 2012. Crusher throughput in the second quarter of 2013 averaged 17,600 tpd, 5% higher than 16,800 tpd in the same period of last year and slightly above the annual average budgeted rate of 17,500 tpd. This was the third consecutive quarter in which crusher throughput exceeded 17,500 tpd. During the second quarter of 2013, mill throughput met budgeted levels of 500 tpd.
The grade of the crushed ore stacked on the leach pad in the second quarter of 2013 of 1.10 g/t Au was higher than the full year budgeted grade of 0.98 g/t Au, but lower than the grade in the second quarter of 2012 of 1.15 g/t Au.
The grade of the Escondida high-grade zone mined and milled in the second quarter of 2013 was 10.94 g/t Au, in line with the Company’s full year budgeted average grade of 11 g/t Au, and a significant improvement from the grade milled in the first quarter of 2013 of 6.59 g/t Au. The Company expects to have sufficient Escondida high-grade zone reserves to continue processing until the first quarter of 2014, at which point the Escondida Deep zone is expected to provide additional feed to continue mill production to the end of the second quarter of 2014. Subsequently, the Company intends to transition to processing high grade from the San Carlos zone once the Escondida Deep zone is depleted.

M A N A G E M E N T ’ S D I S C U S S I O N & A N A L Y S I S (All amounts are expressed in United States dollars, unless otherwise stated)
5
The reconciliation of mined blocks to the block model for the Global Mulatos Pit, including Escondida, for the quarter ended June 30, 2013 was -2%, +5% and +3% for tonnes, grade and ounces respectively. During the second quarter of 2013, and consistent with the first quarter, the Company encountered higher than expected grades in the low-grade portion of the pit.
Since the start of mining activities in 2005, the Mulatos project-to-date reconciliation is +3%, +6%, and +9% for tonnes, grade and ounces, respectively. Positive variances indicate that the Company is mining more gold than was indicated in the reserve model.
Operating Costs
The following table compares costs per tonne for the three and six-month periods ended 2013 and 2012:
Costs per tonne summary(2) Q2
2013 Q2
2012 YTD 2013
YTD 2012
Mining cost per tonne of material (ore and waste)
$2.30 $2.51 $2.49 $2.56
Waste-to-ore ratio 0.48 0.68 0.47 0.65
Mining cost per tonne of ore $3.40 $4.21 $3.67 $4.21
Crushing/conveying cost per tonne of ore $2.54 $2.08 $2.37 $2.23
Processing cost per tonne of ore $4.53 $3.02 $4.28 $2.88
Mine administration cost per tonne of ore $2.39 $1.81 $2.22 $1.94
Total cost per tonne of ore (1) $12.86 $11.12 $12.54 $11.26
(1) Q2 2013 and YTD 2013 cost per tonne reflects total costs related to crushed ore stacked on the leach pad and crushed ore milled on a blended basis
(2) Refer to “Cautionary non-GAAP Measures and Additional GAAP Measures” disclosure at the end of this MD&A for a description and calculation of certain measures presented in this table.
Total cost per tonne of ore in the second quarter of 2013 of $12.86 increased 16% compared to the same period of 2012. The higher total cost per tonne of ore in 2013 is primarily attributable to higher processing costs resulting from increases in input costs (including higher salaries and rising cyanide and diesel costs), as well as lower byproduct credits. Cost inflationary pressures were partially offset by a lower waste-to-ore ratio which reduced the mining cost per tonne of ore.
Mining cost per tonne of material was $2.30 in the second quarter of 2013, 8% lower than $2.51 in the second quarter of 2012, as a result of a higher throughput which had the effect of lowering fixed costs, such as salaries, on a per tonne basis. Mining cost per tonne of ore was $3.40 in the second quarter of 2013, 19% lower than $4.21 per tonne in 2012, as a result of a lower waste-to-ore ratio.
Crushing and conveying cost per tonne of ore was $2.54 in the second quarter of 2013, 22% higher than 2012. Crushing and conveying costs increased on a per-tonne basis mainly due to increased diesel costs.
Processing costs per tonne of ore in the second quarter of 2013 were $4.53 compared to $3.02 in 2012, a 50% increase. Higher processing costs in the second quarter of 2013 relative to the same period of 2012 were the result of cyanide, lime and diesel costs increasing on a per-tonne basis and silver by-product credits decreasing significantly as a result of lower silver prices.

Q 2 2 0 1 3 R E S U L T S
6
Mine administration costs per tonne of ore in the second quarter of 2013 were $2.39, a 32% increase compared to the same period of 2012, as labour, training and other administrative costs increased compared to the prior year.
Cash operating costs (exclusive of the 5% royalty) of $378 per ounce of gold sold in the second quarter of 2013 were significantly below the Company’s guidance of $415 to $435 per ounce for the second consecutive quarter. Cash operating costs were 19% higher compared with costs reported in the second quarter of 2012 as a result of higher input costs, including labour, cyanide and diesel, as well as slightly lower grades of ore mined, offset by an improved recovery ratio.
Cash operating costs include total costs incurred in the period, in addition to inventory adjustments that recognize the allocation of costs to and from the Company’s in-process leach pad gold inventory in the period. The Company utilizes a gold process flow inventory model that allocates total costs incurred to mill processing or to the recoverable ounces stacked on the leach pad in that period, and charges each ounce of gold produced on an average cost basis. Accordingly, cash operating costs reflect not only the cash spent in a period, but also an adjustment to reflect the increase or decrease in the leach pad inventory.
A reconciliation of total cost per tonne of ore to cash operating costs is presented below:
Cash operating cost reconciliation (1) Q2 2013 Q2 2012 Total cost per tonne of ore $12.86 $11.12 Ore stacked/milled (tonnes) 1,598,000 1,530,500 Total cost $20,550,000 $17,019,000 Inventory adjustments to reflect ounces allocated to stockpile
inventory ($511,000) - Inventory adjustments to reflect additional ounces produced
from (allocated to) leach pad inventory and other period costs $765,000 ($869,000) Mining and processing costs allocated to ounces sold as reported on income statement
$20,804,000 $16,150,000
Ounces sold 55,000 50,000 Cash operating cost per ounce sold $378 $323
(1) Refer to “Cautionary non-GAAP Measures and Additional GAAP Measures” disclosure at the end of this MD&A for a description and calculation of certain measures presented in this table.
In the second quarter of 2013, the Company decreased the number of ounces on the leach pad inventory, as the number of ounces produced was higher than the number of recoverable ounces stacked. Leach pad inventory, which incorporates both cash operating costs and amortization, decreased to $12.0 million at June 30, 2013 from $14.8 million at December 31, 2012.
In June 2013, the World Gold Council (“WGC”) published a guidance note on Non-GAAP metrics available to gold mining industry participants to use to report their costs in an effort to encourage improved understanding of the total costs associated with mining an ounce of gold. The Company adopted the reporting of “All-in sustaining costs” or “AISC” in the first quarter of 2013 and has begun reporting “All-in costs” or “AIC” in the second quarter. A reconciliation of all-in sustaining costs is presented below:

M A N A G E M E N T ’ S D I S C U S S I O N & A N A L Y S I S (All amounts are expressed in United States dollars, unless otherwise stated)
7
All-in sustaining cost (1) Q2 2013 Q2 2012 Mining and processing costs ($000) 20,804 16,150 Royalties ($000) 3,841 4,230 Corporate and administrative ($000) (2) 4,574 2,886 Share-based compensation ($000) 1,205 1,361 Exploration costs ($000) (2) 2,399 2,017 Reclamation cost accretion ($000) 226 129 Sustaining capital expenditures ($000) 4,468 4,897 All-in sustaining costs allocated to ounces sold (000) $37,517 $31,670 Ounces sold 55,000 50,000 All-in sustaining cost per ounce sold $682 $633
(1) Refer to “Cautionary non-GAAP Measures and Additional GAAP Measures” disclosure at the end of this MD&A for a description and calculation of certain measures presented in this table.
(2) Excludes corporate and administration and exploration costs incurred at the Company’s development projects.
All-in sustaining costs, which include cash costs, exploration, corporate and administrative, share based compensation and sustaining capital costs, were $682 per ounce of gold sold in the second quarter of 2013, higher than the comparative period of 2012, but below the Company’s guidance of $785 to $825. All-in sustaining cost per ounce increased compared to 2012 due to higher cash operating costs and higher corporate and administrative costs in Toronto and Mexico.
Q 2 2 0 1 3 R E S U L T S
8
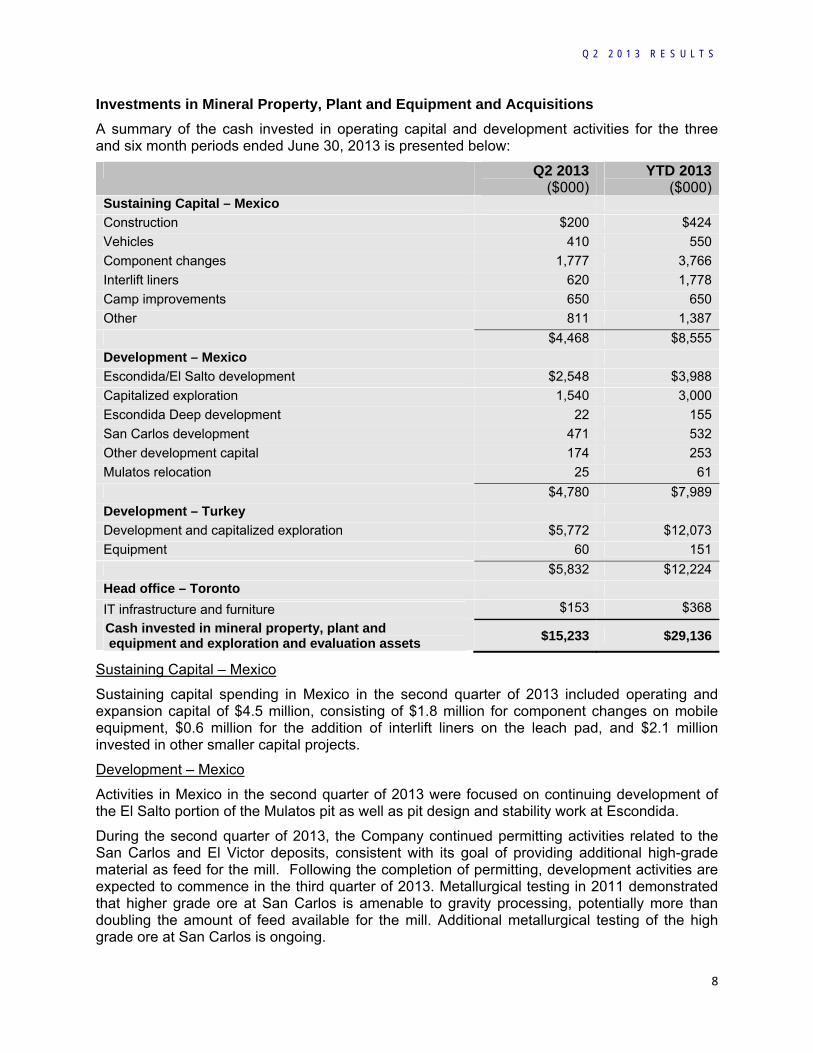
Investments in Mineral Property, Plant and Equipment and Acquisitions
A summary of the cash invested in operating capital and development activities for the three and six month periods ended June 30, 2013 is presented below:
Q2 2013 ($000)
YTD 2013($000)
Sustaining Capital – Mexico
Construction $200 $424
Vehicles 410 550
Component changes 1,777 3,766
Interlift liners 620 1,778
Camp improvements 650 650
Other 811 1,387
$4,468 $8,555
Development – Mexico
Escondida/El Salto development $2,548 $3,988
Capitalized exploration 1,540 3,000
Escondida Deep development 22 155
San Carlos development 471 532
Other development capital 174 253
Mulatos relocation 25 61
$4,780 $7,989
Development – Turkey
Development and capitalized exploration $5,772 $12,073
Equipment 60 151
$5,832 $12,224
Head office – Toronto
IT infrastructure and furniture $153 $368
Cash invested in mineral property, plant and equipment and exploration and evaluation assets
$15,233 $29,136
Sustaining Capital – Mexico
Sustaining capital spending in Mexico in the second quarter of 2013 included operating and expansion capital of $4.5 million, consisting of $1.8 million for component changes on mobile equipment, $0.6 million for the addition of interlift liners on the leach pad, and $2.1 million invested in other smaller capital projects.
Development – Mexico
Activities in Mexico in the second quarter of 2013 were focused on continuing development of the El Salto portion of the Mulatos pit as well as pit design and stability work at Escondida.
During the second quarter of 2013, the Company continued permitting activities related to the San Carlos and El Victor deposits, consistent with its goal of providing additional high-grade material as feed for the mill. Following the completion of permitting, development activities are expected to commence in the third quarter of 2013. Metallurgical testing in 2011 demonstrated that higher grade ore at San Carlos is amenable to gravity processing, potentially more than doubling the amount of feed available for the mill. Additional metallurgical testing of the high grade ore at San Carlos is ongoing.

M A N A G E M E N T ’ S D I S C U S S I O N & A N A L Y S I S (All amounts are expressed in United States dollars, unless otherwise stated)
9
During the second quarter, the Company continued development activities at the Escondida Deep portal, which is expected to provide high-grade mill feed starting in 2014. The Escondida Deep portal has been collared with about 50 meters of drift completed and installation of the support equipment is underway. Based on the reserve and resource update calculated as at December 31, 2012, the Escondida Deep deposit contains approximately 45,000 tonnes grading 8.08 g/t Au for 11,700 ounces of reserves, which are expected to be mined at the conclusion of the Escondida high grade zone.
Development – Turkey
The Ağı Dağı and Kirazlı gold projects are located on the Biga Peninsula of northwestern Turkey. Ağı Dağı is located approximately 50 km southeast of Çanakkale and Kirazlı is located approximately 25 km northwest of Ağı Dağı. Çanakkale is the largest centre on the Biga Peninsula with a population of approximately 97,000. Infrastructure in close proximity to the project is excellent and well-serviced with paved roads, transmission lines, and electricity generating facilities.
In June 2012, the Company published a preliminary feasibility study summary of the Ağı Dağı and Kirazlı projects. The highlights are summarized below:
- Total life of mine production of 1.5 million ounces of gold and 4.9 million ounces of silver. - Annual combined gold production is expected to peak in 2017 at 237,000 ounces, and will
average 166,000 ounces per year over the nine year combined mine life. - First gold production from the Kirazlı project in 2014, followed by gold production from Ağı
Daği in 2016. - Mine life of seven years for Ağı Dağı and five years for Kirazlı. - Pre-production capital expenditures of $424.4 million. - Average life of mine cash operating costs of $544 per ounce sold, and total cash costs per
ounce sold of $579. - At a $1,239 per ounce gold price assumption, after-tax net present value (“NPV”) at a 5%
discount rate of $275.6 million and after-tax internal rate of return (“IRR”) of 22.3%. - At a gold price of $1,575 per ounce, after-tax NPV at a 5% discount rate increases to $604.6
million and after-tax IRR of 36.5%.
In conjunction with the preliminary feasibility study, the Company reported an initial inferred mineral resource estimate at Çamyurt of 640,000 ounces. Inclusion of the Çamyurt resource in a development scenario represents a major opportunity to further enhance the economic potential of the Company’s Turkish projects. The preliminary feasibility study for Ağı Dağı and Kirazlı incorporates significant capital spending on infrastructure that is expected to benefit the economics of the Çamyurt project. The average grade of the resources at Çamyurt is substantially higher than at the Ağı Dağı and Kirazlı projects. As a result, once Çamyurt is factored into the Company’s development plan, it is expected to reduce cash costs per ounce on a combined project basis, as well as enhance combined project economics.
Subsequent to year-end, the Company reported an updated mineral resource estimate for the Ağı Dağı and Kirazlı projects in April 2013, which reflected a 10% increase in measured and indicated resources. Since acquiring these projects in early 2010, measured and indicated resources have more than doubled at Ağı Dağı and Kirazlı to in excess of 2.4 million ounces.
In December 2012, as part of the permitting process, the Company submitted an Environmental Impact Assessment (”EIA”) Report on the Kirazlı Project. The EIA report is currently in the final stage of the approval process. While the approval will not be finalized until certain additional signatures are received from Turkish officials, the substantive aspects of the EIA review process have been successfully completed. The Ministry of the Environment, which is the government agency responsible for EIA approval, appointed representatives of government agencies and

Q 2 2 0 1 3 R E S U L T S
10
local authorities to a 17-person EIA Commission that reviewed the Kirazlı EIA submission. In late January 2013, a meeting was held by the EIA Commission, which concluded in its minutes: “The [Kirazlı] project has been reviewed and evaluated by the Commission and the review and evaluation process has been finalized. The EIA Report has been found sufficient by the Commission and it has been accepted as final.” The Company has been informed that a subsequent mandatory 10-day public notice period produced no opposition or comments of any kind.
The Company is awaiting approval of the Kirazlı EIA and based on the delays experienced to-date, has extended its forecast for first production from the Kirazlı project to the first half of 2015 (from late 2014). The Company is optimistic that approval is forthcoming and expects to receive the EIA approval by the end of 2013.
In the second quarter, the Company submitted its EIA for the Ağı Dağı project, and anticipates that a decision from the Turkish Government will be received in a similar time frame to the Kirazlı process.
In the second quarter of 2013, total expenditures in Turkey were $6.5 million, of which $6.0 million was capitalized. Investments were focused on exploration, engineering and permitting work.
Exploration Summary
Total exploration expenditures in the second quarter of 2013 were $3.6 million. In Mexico, total exploration spending was $2.5 million. This included $1.8 million of drilling costs at East Estrella, Mina Vieja, El Salto, and San Carlos, which were capitalized and $0.7 million of early-stage exploration and administration costs, which were expensed. Total exploration spending in Turkey was $1.1 million, of which $0.7 million related to development work at Çamyurt, Ağı Dağı and Kirazlı was capitalized and $0.4 million related to drilling at earlier-stage targets was expensed.
Exploration – Mexico
Exploration expenditures in Mexico in the second quarter of 2013 totalled $2.5 million. The Company has completed 13,109 metres (“m”) of reverse circulation and core drilling in 62 holes in the second quarter for a total of 25,366 m completed in 129 drill holes during first half of 2013. The primary focus in the second quarter was on completing infill and step-out drilling programs at East Estrella, and continued deep directional drilling at San Carlos; however, targets were also assessed at Mina Vieja and El Salto adjacent to the open pit. Five drill rigs were active during the second quarter, with multiple rigs allocated to drilling at San Carlos for both exploration and the collection of metallurgical samples.
East Estrella
Exploration drilling directly east of the Mulatos pit southeast wall continued through the quarter. Condemnation drilling completed to investigate a proposed waste dump site east of the Estrella Pit by previous operators encountered a number of near-surface gold intercepts along with localized high-grade silver mineralization. Drilling in 2012 confirmed widespread gold-silver-copper mineralization in the area, and the program expanded significantly to develop measured and indicated mineral resources. Mineralization in the northern part of the project area is gold-dominant, near-surface, and stratiform, whereas to the south, it is structurally controlled with higher contents of silver and copper and is refractory.
A new target in the East Estrella area was recently identified by work in the hanging wall of the fault that bounds the mineral resource. This new target is an area of shallow gold mineralization

M A N A G E M E N T ’ S D I S C U S S I O N & A N A L Y S I S (All amounts are expressed in United States dollars, unless otherwise stated)
11
directly to the northeast of the mineral resource. It is characterized by pervasive advanced argillic alteration, as well as a previously unrecognized style of crustiform banded quartz veins.
San Carlos
Drilling at San Carlos has completed until the end of the rainy season. Work in the second quarter targeted the deep high-grade gold mineralization extending to the east of both the open pit and underground mineral resource and reserve areas. High-grade intercepts have been encountered up to 500 m from the existing open pit boundary. This extension of San Carlos provides excellent potential for adding high-grade underground ounces in close proximity to planned infrastructure. Drill progress has been relatively slow at San Carlos due to the complexity associated with directional drilling deep, deviating holes that have to be steered to the target.
Exploration – Turkey
Exploration expenditures in Turkey totalled $1.1 million in the second quarter of 2013. Two drill rigs were active throughout the second quarter, drilling a total of 4,963 m in 40 drill holes for a total of 8,307 m completed in 59 drill holes in the first half of 2013.
Çamyurt
The Çamyurt deposit is located approximately three km southeast of the Company’s development-stage Ağı Dağı project. Drilling at Çamyurt has defined a mineralized zone that is continuous for at least 1,200 m along strike, with additional potential to extend mineralization to the northeast and at depth. The Company published an initial pit-constrained Inferred mineral resource estimate for Çamyurt on June 28, 2012 of 24.6 million tonnes grading 0.81 g/t Au and 4.7 g/t Ag for 640,000 ounces of gold and 3.8 million ounces of silver (applying a 0.2 g/t Au cut-off).
Gold mineralization is hosted within a tabular, steeply-dipping oxidized zone starting at surface and with a cross-strike width up to 150 m with an average drill spacing of approximately 55 m along strike. The June 2012 Inferred mineral resource estimate for Çamyurt represents a significant addition to the Company’s mineral resource base in Turkey. In addition, the average grade of the mineral resource is substantially higher than at the Ağı Dağı and Kirazlı deposits.
Ağı Dağı
The Ağı Dağı project is comprised of the two principle mineral resource areas at Baba and Deli that are connected by the Firetower zone of advanced argillic and silic alteration. The precious metal mineralization of the Baba-Firetower-Deli zone extends at least 4.3 km along a northeast-southwest trend. A portion of the Firetower mineral resource area was included in the Company’s 2011 year-end mineral reserve and resource statement within Inferred mineral resources. However, these were not incorporated into the June 2012 preliminary feasibility study, as it included only measured and indicated mineral resources. Upgrading these mineral resources to the measured and indicated categories is expected to improve the economics of the Ağı Dağı project.
Two parallel trends of advanced argillic and silicic alteration occur to the northwest of the Baba-Deli trend. The Ayi Tepe-Firetower North zone is approximately two km long, defined by relatively wide spaced drilling. Similar alteration occurs along the discontinuous Tavasan-Ihlamur zone, approximately 4.5 km long. Both zones have not been fully defined by drilling. The Ayi Tepe-Firetower North and Tavasan-Ihlamur zones occur approximately 300 m and one km northwest of the Baba-Deli trend, respectively.

Q 2 2 0 1 3 R E S U L T S
12
Kirazli
Most of the work in the Kirazlı deposit area during the second quarter focused on exploration targets such as Kale and Iri. These targets require additional drilling.
Financial Highlights
A summary of the Company’s financial results for the three and six-month periods ended June 30, 2013 and 2012 is presented below:
Q2 2013
Q2 2012
YTD 2013
YTD2012
Cash provided by operating activities before changes in non-cash working capital (000)(1)
(2) $33,773 $41,861 $74,179 $86,789
Changes in non-cash working capital ($20,616) $2,202 ($28,065) ($6,644)
Cash provided by operating activities (000) $13,157 $44,063 $46,114 $80,145
Earnings before income taxes (000) $19,069 $38,703 $57,867 $78,165Earnings (000) $8,828 $24,684 $34,817 $54,154Earnings per share - basic - diluted
$0.07 $0.07
$0.21$0.20
$0.27$0.27
$0.45$0.45
Comprehensive income (000) $11,496 $24,276 $35,881 $53,574Weighted average number of common shares outstanding - basic - diluted
127,518,000 127,634,000
119,636,000120,676,000
127,099,000127,247,000
119,288,000120,507,000
Assets (000) (3) $872,652 $753,856
(1) A non-GAAP measure calculated as cash provided by operating activities as presented on the consolidated statements of cash flows and adding back changes in non-cash working capital.
(2) Refer to “Cautionary non-GAAP Measures and Additional GAAP Measures” disclosure at the end of this MD&A for a description and calculation of this measure.
(3) Assets are shown as at June 30, 2013 and December 31, 2012.
The Company continued to generate strong operating margins in the second quarter of 2013 as a result of continued low cash costs. Despite a substantial drop in the price of gold, the Company generated strong cash from operating activities in the second quarter of 2013. Cash from operating activities before changes in non-cash working capital in the second quarter of 2013 of $33.8 million ($0.26 per share) decreased 19% relative to the same period of 2012 as a result of lower gold price. After changes in non-cash working capital, cash provided by operating activities dropped significantly to $13.2 million from $44.1 million in the second quarter of the prior year. Cash flow from operations were negatively impacted by lower realized gold prices, as well as a $12.3 million payment of withholding taxes which will be recovered throughout the remainder of 2013.
Earnings before income taxes in the second quarter of 2013 were $19.1 million or $0.15 per basic share, compared to $38.7 million or $0.32 per basic share in the second quarter of 2012. On an after-tax basis, earnings in the second quarter of 2013 of $8.8 million, or $0.07 per basic share, decreased 64% over the comparable period of 2012 as a result of lower realized gold prices, accounting losses on the disposition of the Company’s investment in Aurizon, foreign exchange losses, increased amortization costs and a higher effective tax rate.

M A N A G E M E N T ’ S D I S C U S S I O N & A N A L Y S I S (All amounts are expressed in United States dollars, unless otherwise stated)
13
On a year-to-date basis, both cash flows from operations and earnings have been substantially reduced compared to the prior year as a result of lower gold prices, increased amortization, foreign exchange and other losses and a higher effective tax rate.
Gold Sales
Details of gold sales are presented below:
Q22013
Q22012
YTD 2013
YTD2012
Gold sales (ounces) 55,000 50,000 108,000 91,745 Operating revenues (000) $78,273 $80,889 $164,545 151,145 Realized gold price per ounce $1,423 $1,618 $1,524 $1,647 Average gold price for period (London PM Fix) $1,415 $1,610 $1,523 $1,651
Operating revenues in the second quarter of 2013 of $78.3 million decreased 3% compared to $80.9 million in the second quarter of 2012. This decrease is attributable to a lower realized gold price per ounce, partially offset by a higher number of ounces sold.
The Company generally enters into short-term forward sales contracts in order to match sales contracts with the next expected delivery date. The Company’s objective is to realize a gold sales price consistent with the average London PM Fix spot gold price. For the second quarter of 2013, the Company achieved a realized gold price of $1423 per ounce, $8 above the average London PM Fix gold price for the quarter. As at June 30, 2013, the Company did not have any significant derivative activity outstanding, and was therefore fully leveraged to future changes in the price of gold.
Assessment of Gold Market
The market price of gold continues to exhibit significant volatility. In recent weeks, the gold price has dropped markedly. While this decrease has a significant impact on the Company’s revenues, the Company’s low cost structure permits it to continue to benefit from excellent operating margins even at gold prices substantially lower than current levels. The spot market gold price was approximately $1,285 per ounce on July 23, 2013. At this gold price, the Company realizes a mine operating cash margin (before taxes and corporate and administrative costs) in excess of $750 per ounce.

Q 2 2 0 1 3 R E S U L T S
14
Operating Expenses and Operating Margins
Mine operating costs allocated to ounces sold are summarized in the following table for the periods indicated:
Q2 2013
Q2 2012
YTD 2013
YTD 2012
Gold production (ounces) (1) 53,000 48,200 108,000 88,700 Gold sales (ounces) 55,000 50,000 108,000 91,745
Cash operating costs (000)(2) $20,804 $16,150 $39,763 $31,169 - Per ounce sold $378 $323 $368 $340
Royalties (000)(3) $3,841 $4,230 $8,663 $7,661 Total cash costs (000)(2) $24,645 $20,380 $48,426 $38,830 - Per ounce sold $448 $408 $448 $423
Amortization (000) $16,462 $12,679 $29,397 $20,457 Total production costs (000)(4) $41,107 $33,059 $77,823 $59,287 - Per ounce sold $747 $661 $721 $646
- Realized gold price per ounce $1,423 $1,618 $1,524 $1,647 - Operating cash margin per ounce (5) $975 $1,210 $1,076 $1,223
(1) Reported gold production is subject to final refinery settlement. (2) “Cash operating costs” and “Total cash costs” are non-GAAP measures. Refer to “Cautionary non-GAAP
Measures and Additional GAAP Measures” disclosure at the end of this MD&A for a description and calculation of these measures.
(3) Royalties are included as of April 1, 2006 at 5% of net precious metals revenues (as determined in accordance with the royalty agreement).
(4) “Total production costs” is a non-GAAP measure that includes all “total cash costs” and amortization. “Total production costs” is equivalent to mining and processing costs, royalties and amortization as reported in the Company’s financial statements.
(5) “Operating cash margin per ounce” is a non-GAAP measure that is calculated as the difference between the Company’s gold sales and mining and processing and royalty expenses (“total cash costs”) as reported in the Company’s financial statements.
Cash operating costs (exclusive of the 5% royalty) in the second quarter of 2013 were $378 per ounce of gold sold, substantially below the Company’s full year guidance range of $415 to 435 per ounce for the second straight quarter. Cash operating costs per ounce in the second quarter of 2013 were higher than costs reported in the second quarter of 2012, as higher input costs, including labour, cyanide and diesel, were partially offset by a higher recovery ratio. Amortization was $299 per ounce of gold sold in the second quarter of 2013, 18% higher than $253 per ounce in the same period of 2012. Amortization per ounce is higher in 2013 due to higher production from the Escondida high-grade zone for the second quarter of 2013, which contributes a higher amortization per ounce of production than low-grade ounces produced.
Royalty
Production from certain mining concessions within the Salamandra District is subject to a sliding scale production royalty. The royalty is calculated at a rate of 5% of the value of gold and silver production, less certain deductible refining and transportation costs. The royalty is calculated based on the daily average London PM Fix gold market prices, not actual prices realized by the Company. Production to a maximum of two million ounces of gold is subject to royalty. As at June 30, 2013, the royalty was paid or accrued on approximately 1,120,000 ounces of applicable gold production. Royalty expense in the second quarter of 2013 of $3.8 million decreased 10% from royalty expense of $4.2 million in 2012, attributable to lower gold prices.
M A N A G E M E N T ’ S D I S C U S S I O N & A N A L Y S I S (All amounts are expressed in United States dollars, unless otherwise stated)
15
Exploration
The Company’s accounting policy for exploration costs requires that exploration expenditures that do not meet the criteria for mine development be expensed as incurred, while costs incurred to expand operating capacity, develop new ore bodies or develop mine areas in advance of current production are capitalized. Total exploration spending in the second quarter of 2013 was $3.6 million, of which $1.4 million was expensed.
Corporate and Administrative
Corporate and administrative expenses of $5.0 million in the second quarter of 2013 were 58% higher than $3.2 million in the second quarter of 2012. Higher corporate and administrative costs were the result of higher salary costs related to new employees in the Toronto head office, higher travel costs, as well as legal and regulatory costs associated with corporate development initiatives and the Company’s listing on the New York Stock Exchange (“NYSE”).
Share-based Compensation
Share-based compensation expense, related to stock options, cash-settled stock appreciation rights (“SARs”), restricted share units (“RSUs”) and deferred share units (“DSUs”) was $1.2 million in the second quarter of 2013 compared to a $1.4 million in the comparable period of 2012. The value of share-based compensation expense related to stock options is added to the contributed surplus account within shareholders’ equity, resulting in no net effect on total shareholders’ equity. In 2013, the Company’s Board approved a cash-settled RSU plan available to officers, employees and consultants, and a DSU plan available to its directors. SARs, RSUs, and DSU’s are cash-settled liabilities, which are remeasured at each reporting date and at the settlement date. Any changes in the fair value of the liability are recognized as an expense to share-based compensation in the Statements of Comprehensive Income.
All outstanding stock options, SARs and RSU grants are subject to vesting provisions. The vesting provisions result in the calculated market value of stock option grants being charged to expense in accordance with the vesting terms of the option. DSUs are not subject to vesting terms, therefore the expense is recorded immediately.
Share-based compensation expense in the second quarter of 2013 is comprised of $1.0 million expense related to the Company’s stock option plan, and $0.2 million related to SARs, RSUs and DSUs. The Company’s outstanding SARs liability decreased from $3.8 million at December 31, 2012 to $1.7 million at June 30, 2013 as a result of the decrease in the Company’s share price during this period.
Finance Income
Finance income in the second quarter of 2013 was $0.6 million compared to $0.9 million in the second quarter of 2012. Interest rates on deposit accounts and short-term investments remain near historically low levels.
Financing Expense
Financing expense includes accretion of the Company’s decommissioning liability and property acquisition obligations. The expense for the current quarter was comparable to the prior period.
Foreign Exchange Loss
The Company recognized a $3.6 million foreign exchange loss in the second quarter of 2013, compared to a $2.6 million foreign exchange loss in the same period of 2012. Throughout the second quarter of 2013, the Mexican peso (“MXN”), Canadian dollar (“CAD”) and Turkish Lira (“TL”) all weakened relative to the USD.

Q 2 2 0 1 3 R E S U L T S
16
Significant foreign exchange movements in the second quarter of 2013 included a $0.6 million foreign exchange loss on the Company’s Canadian dollar-denominated net assets, a $0.8 million foreign exchange loss on revaluation of the Company’s net MXN-denominated assets, and a $0.5 million foreign exchange loss on the Company’s TL-denominated net assets. In addition, foreign exchange losses of $0.9 million were incurred on the disposition of the Company’s investment in Aurizon, and a $0.8 million loss on mark-to-market adjustments related to a foreign exchange forward contract and dual currency note. The Company classifies the foreign exchange gain or loss on revaluation of its Mexican and Turkish deferred tax liabilities within deferred tax expense rather than within foreign exchange gain or loss.
Income Taxes
Tax expense in the second quarter of 2013 was $10.2 million compared to $14.0 million in 2012. The Single Rate Tax Law (minimum tax) that came into effect in Mexico at the start of 2008 did not contribute to a higher tax expense in 2012, but may in future periods. The Company is cash taxable in Mexico and must calculate and provide for tax instalments on a monthly basis. The Company satisfies its tax liability through periodic instalment payments, as well as by offsetting refundable value-added tax owed from the Mexican government against its tax payable liability.
The statutory income tax rate in Mexico for 2013 is 30%. In Canada, the combined federal and provincial statutory income tax rate is 26.5% in 2013. The effective tax rate for the second quarter of 2013 (calculated as a percentage of earnings before income tax) was 54%, significantly above the statutory rate in Mexico and Canada. The effective tax rate results from a number of factors, many of which are difficult to forecast. In the second quarter of 2013, a net $1.3 million non-cash deferred tax loss was realized to recognize the impact of foreign exchange movements, comprising a $2.0 million loss on revaluation of temporary tax differences associated with foreign currency denominated non-monetary assets and liabilities, offset by a $3.3 million loss on revaluation of the Company’s Mexican peso denominated deferred tax balance. In addition, the effective tax rate was negatively impacted by higher corporate and administrative costs in Canada, and the loss on the Company’s investment in Aurizon, which are not tax effected. The Company expects the effective tax rate to continue to fluctuate in periods of significant change to Mexican peso and/or Turkish lira foreign exchange rates.
The Mexican government is currently in the process of reviewing a proposal to introduce a mining contribution tax (“MC tax”). Under the current proposal, the MC tax is calculated at 5% of pre-tax earnings, excluding certain deductions which are permitted for income tax calculation purposes. The MC tax is expected to be deductible for purposes of calculating Mexican income tax. The Company expects the net effect of this proposed tax could be an increase in the effective tax rate in Mexico from 30% to between 33 and 34%, depending on further definition of the allowable deductions.
Acquisition of Esperanza
On July 12, 2013, the Company and Esperanza jointly announced that they have entered into a definitive agreement (the “Esperanza Agreement”) pursuant to which Alamos has agreed to acquire all of the issued and outstanding common shares of Esperanza by way of a court-approved plan of arrangement.
Esperanza is a precious metals exploration and development company focused on advancing its principal property, the wholly-owned Esperanza gold project (formerly referred to as the Cerro Jumil gold project) in Morelos State, Mexico.
Pursuant to the terms of the Esperanza Agreement, Esperanza shareholders will receive C$0.85 in cash for each common share of Esperanza held, representing a premium of

M A N A G E M E N T ’ S D I S C U S S I O N & A N A L Y S I S (All amounts are expressed in United States dollars, unless otherwise stated)
17
approximately 38% to Esperanza’s 30-day volume-weighted average price (“VWAP”) for the period ending July 11, 2013. The transaction values Esperanza’s equity at approximately C$69.4 million on a fully diluted in-the-money basis. In addition, Alamos will issue approximately five million Alamos warrants, in the aggregate, to Esperanza shareholders and approximately two million Alamos warrants, in the aggregate, to holders of Esperanza warrants. The Alamos warrants will be listed on the Toronto Stock Exchange.
Highlights of the Transaction:
Esperanza gold project is an attractive, open pit, heap leach project with all-in sustaining costs expected to be below $900 per ounce, high margins and potential for further growth;
Adds measured and indicated resources of 1.5 million ounces of gold and 16 million ounces of silver in Mexico, further growing Alamos' presence in Mexico, a geopolitically stable mining jurisdiction;
Esperanza shareholders receive a premium of approximately 38% to Esperanza’s 30-day volume weighted average price;
Enhances Alamos’ project pipeline by adding an asset with annual average production potential of over 100,000 ounces, with both total cash costs and all-in sustaining costs in the lowest quartile;
Ability to utilize Alamos’ mine permitting and development teams, which include significant open pit, heap leach expertise, to advance the Esperanza gold project to production;
Ability to fund development and construction of the Esperanza gold project through Alamos’ existing cash resources;
Considerable exploration potential on all assets; and
Accretive to Alamos’ net asset value, earnings and cash flow with virtually no dilution to Alamos shareholders.
On closing, Alamos will assume ownership of Esperanza’s 100%-owned Esperanza gold project as well as other various interests of Esperanza in Mexico and Peru. The Esperanza gold project is an advanced stage gold project in Morelos, Mexico, with a resource of 1.5 million ounces of gold and 16 million ounces of silver. In September 2011, Esperanza completed a Preliminary Economic Assessment (“PEA”) on the Esperanza gold project outlining an initial six-year mine life with expected production of a total of 0.6 million ounces of gold at an average rate of 103,000 ounces per year and average cash costs of US$499 per ounce (net of by-product credits). Applying a conservative gold price assumption of US$1,150 per ounce, the September 2011 PEA base case shows that the Esperanza gold project has an after-tax internal rate of return of 26% and an after-tax 5% net present value of in excess of C$122 million. Upon successful acquisition, the Company intends to work on revising the EIA for the Esperanza gold project for resubmission.
Acquisition of Orsa Ventures
On July 23, 2013, the Company and Orsa entered into a definitive agreement (the “Orsa Agreement”) pursuant to which Alamos has agreed to acquire all of the issued and outstanding common shares of Orsa by way of a court-approved plan of arrangement.
Orsa is a junior exploration company focused on advancing its precious metal properties located

Q 2 2 0 1 3 R E S U L T S
18
in the Western United States. Upon closing, Alamos will assume ownership of Orsa’s right to earn a 100% interest in the Quartz Mountain Property in Oregon as well as other assets in Oregon and Nevada.
Pursuant to the terms of the Orsa Agreement, Orsa shareholders will receive C$0.10 in cash for each common share of Orsa held. The transaction values Orsa’s equity at approximately C$3.5 million on a fully diluted in-the-money basis.
Summary of Quarterly Results
The following table summarizes quarterly results for the past eight quarters. Quarterly gold production has been adjusted to reflect final settlements, where applicable.
Q3 2011
Q42011
Q12012
Q22012
Q32012
Q4 2012
Q1 2013
Q22013
Gold production (ounces) 33,000 46,500 40,500 48,200 43,500 67,800 55,000 53,000 Gold sales (ounces)
28,790 45,224 41,745 50,000 43,255 62,516 53,000 55,000
Operating revenues ($000)
44,991 71,133 70,256 80,889 71,281 106,946 86,272 78,273
Earnings from operations
($000) 20,038 35,723 37,047 40,447 33,306 53,016 41,717 29,532
Earnings ($000) 5,436 21,294 29,470 24,684 25,895 37,906 25,989 8,828 Earnings ($ per share)
basic/diluted 0.05 0.18
0.25/ 0.24
0.21/ 0.20
0.22/ 0.21
0.31 0.21/ 0.20
0.07
Operating revenues generally trended higher over the past eight quarters as the Company has benefited from rising gold prices, however a declining gold price in the second quarter of 2013 negatively impacted earnings. Gold production in the first and fourth quarters is generally higher than in the second and third quarters of the year, which can be adversely affected by weather-related production issues. The third quarter rainy season in northwestern Mexico adversely impacted gold production, sales and operating results in 2012 and 2011. Seasonal conditions could continue to impact production and financial results in future periods, particularly if rainfall is significantly above or below seasonal averages.
Financial and Other Instruments
The Company’s financial assets and liabilities consist of cash and cash equivalents, short-term investments, amounts receivable, available-for-sale and held-for-trading securities, accounts payable and accrued liabilities and deferred tax liabilities, some of which are denominated in CAD, MXN and TL. The Company is exposed to financial gains or losses as a result of foreign currency movements against the USD.
The Company’s cash and cash equivalents may be invested in short-term liquid deposits or investments that provide a revised rate of interest upon maturity. At June 30, 2013, the majority of the Company’s reported cash and cash equivalents were held in bank deposit accounts or 60-day to 90-day term deposits. The Company’s short-term investments are generally term deposits with an initial term-to-maturity on acquisition of greater than 90 days.
The majority of the Company’s cash balances are held in USD; however, the Company does maintain cash and cash equivalents denominated in CAD, MXN and TL. The Company may enter into derivative contracts in order to manage its exposures to fluctuations in foreign currency exchange rates to the CAD, MXN, or TL. As at June 30, 2013, the Company had outstanding contracts to deliver $5 million CAD in exchange for a fixed amount of USD at future dates up to June of 2013, with CAD:USD rates ranging from 1.02:1. The mark-to-market gain

M A N A G E M E N T ’ S D I S C U S S I O N & A N A L Y S I S (All amounts are expressed in United States dollars, unless otherwise stated)
19
associated with these contracts as at June 30, 2013 was $0.2 million. In addition, the Company recognized a $1.0 million mark-to-market loss on a $15 million dual currency deposit (USD deposit with an embedded MXN call option).
The Company is exposed to monetary assets and liabilities denominated in CAD. The Company maintains CAD equities, cash and investment balances, which are not fully offset by CAD-denominated liabilities. This resulted in a loss of $0.6 million for the period, given the weakening of the CAD.
The Company also has exposure to monetary assets and liabilities denominated in MXN. Significant cash balances, outstanding amounts receivable, accounts payable or tax liabilities denominated in MXN expose the Company to foreign exchange gains or losses. The Company maintains cash balances in MXN in order to mitigate its balance sheet exposure to changes in the MXN/USD exchange rate resulting from its MXN-denominated taxes payable and deferred tax liability balances. For the period ended June 30, 2013, the Company’s net MXN-denominated liability position resulted in a foreign exchange gain of approximately $1.2 million, of which a $0.8 million loss was classified within foreign exchange loss and a $2.0 million gain was recorded in deferred tax expense.
At June 30, 2013, the Company’s TL-denominated net monetary assets mainly consisted of TL-denominated cash and short-term investments, in addition to value-added tax (“VAT“) receivables. This exposure contributed to a $0.5 million foreign exchange loss given weakening of the TL compared to the USD during the period.
Liquidity and Capital Resources
At June 30, 2013, the Company had $466.4 million in cash and cash equivalents and short-term investments compared to $353.7 million at December 31, 2012. Cash and cash equivalents and short-term investments increased $93.1 million in the second quarter of 2013, reflecting positive cash flows from operations and proceeds resulting from the disposition of the Company’s investment in Aurizon, offset primarily by capital spending in Mexico and Turkey and the payment of the Company’s semi-annual dividend and other working capital investments.
The Company’s most significant cash inflow in the second quarter was with respect to its disposition of its investment in the common shares of Aurizon. In January 2013, the Company made an unsolicited offer to acquire Aurizon. Prior to announcement of the offer, the Company had acquired 3 million common shares of Aurizon in the public market at an average cost of CAD$3.78 per share. In addition, the Company had swapped approximately 6.6 million Alamos shares in exchange for 23.5 million Aurizon shares at an average cost of CAD$4.65 per share. As a result, the Company’s average cost for its 26.5 million share investment in Aurizon was approximately CAD$120.6 million or CAD$4.55 per share. In March 2013, the Company rescinded its offer for Aurizon and in June 2013, as part of Hecla Mining Company’s acquisition of Aurizon, received CAD$90 million and approximately 7.5 million common shares of Hecla. In June 2013, the Company disposed of the 7.5 million common shares of Hecla for approximately $23 million. In total, the Company realized proceeds of $111.1 million from the disposition of its 26.5 million shares of Aurizon ($4.20 per share). Despite the accounting loss recognized in conjunction with this transaction, the net impact of was that the Company recovered its average cost on the Aurizon shares purchased in the public market, and generated proceeds of $100.0 million through the issuance of approximately 6.5 million Alamos common shares, implying that the Company effectively raised $100.0 million at approximately CAD$16 per share (at current foreign exchange rates).
Cash inflows in the second quarter of 2013 included $111.2 million cash proceeds on disposition of Aurizon, $13.2 million cash generated by operating activities, and $0.8 million

Q 2 2 0 1 3 R E S U L T S
20
cash proceeds on the exercise of stock options. Significant cash outflows in the second quarter of 2013 included $15.2 million of capital and exploration expenditures in Mexico and Turkey, $12.7 million in dividend payments, and $2.6 million in Alamos share repurchases under the Company’s share buyback program. The Company’s working capital surplus increased to $505.5 million at June 30, 2013 from $377.7 million at December 31, 2012.
The Company has ongoing budgeted capital and exploration expenditures in Mexico and significant budgeted exploration and development costs in Turkey for 2013. The Company expects to invest in development and construction activities at its projects in Turkey over the next several years and expects to be able to finance these from a combination of existing cash balances and operating cash flows. The Company expects that at current gold prices, its balance sheet strength is sufficient to fund the development of its assets in Turkey as well as the development of the Esperanza gold project.
The Company paid a semi-annual dividend of $0.10 per share in the second quarter of 2013, and will continue to evaluate its dividend policy in accordance with its financial performance and strategic objectives.
In April 2013, the Board of Directors of the Company authorized a normal course issuer bid or share buyback program through the TSX. The purchase of Alamos shares may represent an appropriate use of Alamos’s available cash resources when, in the opinion of management, the market price of such shares is below their value. During the period ended June 30, 2013, the Company repurchased and cancelled 211,300 Shares at a total cost of $2.6 million, including transaction costs. The Company continually reviews its capital allocation program with the objective of creating shareholder value.
Internal Control over Financial Reporting
Management is responsible for the design and operating effectiveness of internal controls over financial reporting to provide reasonable assurance regarding the reliability of financial reporting and the preparation of the financial statements in accordance with accounting principles generally accepted in Canada. Based on a review of its internal control procedures at the end of the period covered by this MD&A, management believes its internal controls and procedures are appropriately designed as at June 30, 2013.
Changes in Internal Control over Financial Reporting
There were no significant changes in the Company’s internal control over financial reporting that occurred during the three months ended June 30, 2013 that have materially affected, or are reasonably likely to materially affect, the Company’s internal control over financial reporting.
Disclosure Controls
Management is also responsible for the design and effectiveness of disclosure controls and procedures to provide reasonable assurance that material information related to the Company, including its consolidated subsidiaries, is made known to Alamos management, including the Company’s certifying officers, as appropriate to allow timely decisions regarding required disclosure. The Company’s Chief Executive Officer and Chief Financial Officer have each evaluated the design of the Company’s disclosure controls and procedures as at June 30, 2013 and have concluded that it is appropriate.

M A N A G E M E N T ’ S D I S C U S S I O N & A N A L Y S I S (All amounts are expressed in United States dollars, unless otherwise stated)
21
Limitations of Controls and Procedures
The Company’s management, including the Chief Executive Officer and Chief Financial Officer, believe that internal controls over financial reporting and disclosure controls and procedures, no matter how well designed and operated, have inherent limitations. Therefore, even those systems determined to be properly designed and effective can provide only reasonable assurance that the objectives of the control system are met.
Off-Balance Sheet Arrangements
The Company does not have any off-balance sheet arrangements.
Outstanding Share Data
The table below describes the terms associated with the Company’s outstanding and diluted share capital:
July 23, 2013Common shares - Common shares outstanding 127,348,988
Stock options - Average exercise price CAD $14.57; approximately 68% exercisable 5,064,200
Total 132,413,188
Outlook
Having produced 108,000 ounces at a total cash cost of $448 per ounce of gold sold in the first half of 2013, the Company is on track to meet or exceed its full year 2013 production guidance of between 180,000 and 200,000 ounces of gold at an average total cash cost of between $500 and $520 per ounce of gold sold. Factoring in exploration spending, corporate and administrative costs, share based compensation and sustaining capital costs, the Company expects to report all-in sustaining costs of between $785 and $825 per ounce of gold sold for 2013. In the second quarter of 2013, the gold price experienced significant volatility and decreased from over $1,600 per ounce to $1,200 per ounce. Alamos’ disciplined approach to growth and continuous improvement initiatives consistently result in industry-leading operating costs, positioning the Company to generate strong operating margins even in a lower gold price environment. As a result, the current downturn in the gold price has a limited impact on the Company’s current operating and development plans. In Mexico, the Company is focused on maintaining crusher throughput at current levels in order to achieve budgeted 2013 production levels. The Escondida high-grade deposit is expected to continue to provide high grade mill feed until early 2014, at which point the Escondida Deep zone will be accessed to provide mill feed for an additional quarter. The Company is expecting to receive the permit to begin development of the El Victor and San Carlos deposit areas in the third quarter of 2013, following which development activities will commence in anticipation of processing high grade from San Carlos in mid-2014. The current focus of exploration at Mulatos

Q 2 2 0 1 3 R E S U L T S
22
is on continuing to delineate high-grade mineral reserves to continue to provide mill feed beyond the life of the Escondida high-grade deposit.
With the recently announced acquisition of Esperanza, the Company has grown its development pipeline substantially. The Esperanza gold project has the potential to grow production in Mexico by more than 50%, or nearly 30% on a consolidated basis. The transaction is expected to close by early September, following which we will work on revising the EIA report for planned resubmission with a construction decision to follow in 2015.
In Turkey, the EIA report on the Kirazli Project is in the final stage of the approval process. While the substantive aspects of the EIA review process have been successfully completed, the Company is awaiting formal approval of the EIA from the Ministry of the Environment. Given the delays experienced to date, the Company now expects production from the Kirazlı project to commence in the first half of 2015, rather than the end of 2014. The Company is in regular contact with the Ministry of the Environment in Turkey and expects that the EIA for the Kirazlı project will be approved in 2013.
In the second quarter, the Company submitted its EIA for Ağı Dağı, the Company’s second late-stage development project in Turkey. The Company anticipates that a decision from the Turkish Government will be received in a similar time frame to the Kirazlı process.
The Company continues to strengthen its financial position despite the recent drop in the gold price. The Company ended the quarter with approximately $466 million in cash and short-term investments, over $505.5 million in working capital and no debt. The Company pays a substantial dividend and has been active with its share buyback program. Alamos’ financial strength and flexibility and low cost operating structure provide it with the ability to aggressively pursue its capital allocation plans, including future organic growth and acquisitions.
Accounting Policies in effect January 1, 2013 (i) IFRS 12 Disclosure of Interests in Other Entities was released in May 2011 and is effective for annual periods beginning on or after January 1, 2013, with early adoption permitted.. IFRS 12 contains the disclosure requirements for entities that have interests in subsidiaries, joint arrangements (i.e. joint operations or joint ventures), associates and/or unconsolidated structured entities. Interests are widely defined as contractual and non-contractual involvement that exposes an entity to variability of returns from the performance of the other entity. The required disclosures aim to provide information in order to enable users to evaluate the nature of, and the risks associated with, an entity’s interest in other entities, and the effects of those interests on the entity’s financial position, financial performance and cash flows. Given the nature of the Company’s interests in other entities, the amendments did not have an impact on the Company’s financial position or performance. (ii) IFRS 13 Fair Value Measurement was issued in May 2011 and is effective prospectively for annual periods beginning on or after January 1, 2013. The disclosure requirements of IFRS 13 need not be applied in comparative information for periods before initial application. IFRS 13 replaces the fair value measurement guidance contained in individual IFRSs with a single source of fair value measurement guidance. It defines fair value as the price that would be received to sell an asset or paid to transfer a liability in an orderly transaction between market participants at the measurement date. The standard also establishes a framework for measuring fair value and sets out disclosure requirements for fair value measurements to provide information that enables financial statement users to assess the methods and inputs used to develop fair value measurements and, for recurring fair value measurements that use significant unobservable inputs (Level 3), the effect of the measurements on earnings or other

M A N A G E M E N T ’ S D I S C U S S I O N & A N A L Y S I S (All amounts are expressed in United States dollars, unless otherwise stated)
23
comprehensive income. IFRS 13 establishes ‘how’ to measure fair value when it is required or permitted by other IFRSs. IFRS 13 does not introduce new requirements to measure assets or liabilities at fair value, nor does it eliminate the practicability exceptions to fair value measurements that currently exist in certain standards. The amendments did not have an impact on the Company’s financial position or disclosures. (iii) Amendments to IAS 1 Presentation of Financial Statements was issued in June 2011 and is effective for annual periods beginning on or after July 1, 2012. . The amendments require that an entity present separately the items of OCI that may be reclassified to earnings in the future from those that would never be reclassified to earnings. Consequently an entity that presents items of OCI before related tax effects will also have to allocate the aggregated tax amount between these categories. The existing option to present the earnings and other comprehensive income in two statements has remained unchanged. The amendments did not have an impact on the Company’s financial position or presentation. (iv) IFRS 10 Consolidated Financial Statements is effective for annual periods beginning on or after January 1, 2013, with early adoption permitted. IFRS 10 replaces the guidance in IAS 27 Consolidated and Separate Financial Statements and SIC-12 Consolidation – Special Purpose Entities (“SPE’s”). IFRS 10 provides a single model to be applied in the control analysis for all investees, including entities that currently are SPEs in the scope of SIC-12. In addition, the consolidation procedures are carried forward substantially unmodified from IAS 27. Given the nature of the Company’s organizational structure, the amendments did not have a material impact on the Company’s financial position or presentation. Future accounting policy changes not yet in effect
The following are new pronouncements approved by the IASB. The standards and interpretations are not yet effective and have not been applied in preparing these financial statements; however, they may impact future periods.
(i) IFRS 9 Financial Instruments (Revised) was issued by the IASB in October 2010. It incorporates revised requirements for the classification and measurement of financial liabilities and carrying over the existing derecognition requirements from IAS 39 Financial Instruments: Recognition and Measurement. The revised financial liability provisions maintain the existing amortized cost measurement basis for most liabilities. New requirements apply where an entity chooses to measure a liability at fair value through profit or loss – in these cases, the portion of the change in fair value related to changes in the entity's own credit risk is presented in other comprehensive income rather than within profit or loss. IFRS 9 (2010) is effective for annual periods beginning on or after January 1, 2015. The impact of IFRS 9 on the Company’s financial instruments has not yet been determined.
Forward-Looking Statements
This MD&A contains “forward-looking information”, as such term is defined in applicable Canadian securities legislation and “forward-looking statements” within the meaning of the United States Private Securities Litigation Reform Act of 1995, concerning Alamos's future financial or operating performance and other statements that express management's expectations or estimates of future developments, circumstances or results. Generally, forward-looking information can be identified by the use of forward-looking terminology such as “expects”, “believes”, “anticipates”, “budget”, “scheduled”, “estimates”, “forecasts”, “intends”, “plans” and variations of such words and phrases, or by statements that certain actions, events or results “may”, “will”, “could”, “would” or “might”, “be taken”, “occur” or “be

Q 2 2 0 1 3 R E S U L T S
24
achieved”. Forward-looking information is based on a number of assumptions and estimates that, while considered reasonable by management based on the business and markets in which Alamos operates, are inherently subject to significant operational, economic and competitive uncertainties and contingencies. Alamos cautions that forward-looking information involves known and unknown risks, uncertainties and other factors that may cause Alamos's actual results, performance or achievements to be materially different from those expressed or implied by such information, including, but not limited to, gold and silver price volatility; fluctuations in foreign exchange rates and interest rates; the impact of any hedging activities; discrepancies between actual and estimated production, between actual and estimated reserves and resources or between actual and estimated metallurgical recoveries; costs of production; capital expenditure requirements; the costs and timing of construction and development of new deposits; and the success of exploration and permitting activities. In addition, the factors described or referred to in the section entitled “Risk Factors” in the Company's Annual Information Form for the year ended December 31, 2012 which is available on the SEDAR website at www.sedar.com, should be reviewed in conjunction with the information found in this MD&A. Although Alamos has attempted to identify important factors that could cause actual results, performance or achievements to differ materially from those contained in forward-looking information, there can be other factors that cause results, performance or achievements not to be as anticipated, estimated or intended. There can be no assurance that such information will prove to be accurate or that management's expectations or estimates of future developments, circumstances or results will materialize. Accordingly, readers should not place undue reliance on forward-looking information. The forward-looking information in this MD&A is made as of the date of this interim report, and Alamos disclaims any intention or obligation to update or revise such information, except as required by applicable law.
Cautionary non-GAAP Measures and Additional GAAP Measures
Note that for purposes of this section, GAAP refers to IFRS. The Company believes that investors use certain non-GAAP and additional GAAP measures as indicators to assess gold mining companies. They are intended to provide additional information and should not be considered in isolation or as a substitute for measures of performance prepared with GAAP. Non-GAAP and additional GAAP measures do not have a standardized meaning prescribed under IFRS and therefore may not be comparable to similar measures presented by other companies.
(i) Cash flow from operating activities before changes in non-cash working capital
“Cash flow from operating activities before changes in non-cash working capital” is a non-GAAP performance measure that could provide an indication of the Company’s ability to generate cash flows from operations, and is calculated by adding back the change in non-cash working capital to “Cash provided by (used in) operating activities” as presented on the Company’s consolidated statements of cash flows.

M A N A G E M E N T ’ S D I S C U S S I O N & A N A L Y S I S (All amounts are expressed in United States dollars, unless otherwise stated)
25
The following table reconciles the non-GAAP measure to the consolidated statements of cash flows.
Q2 2013 Q2 2012 YTD 2013 YTD 2012 Cash flow from operating activities – IFRS (000)
$13,157 $44,063 $46,114 $80,145
Changes in non-cash working capital (000) (20,616) 2,202 (28,065) (6,644)Cash flow from operating activities before changes in non-cash working capital (000)
$33,773 $41,861 $74,179 $86,789
(ii) Mining cost per tonne of ore
“Mining cost per tonne of ore” and “Cost per tonne of ore” are non-GAAP performance measures that could provide an indication of the mining and processing efficiency and effectiveness of the mine. These measures are calculated by dividing the relevant mining and processing costs and total costs by the tonnes of ore processed in the period. “Cost per tonne of ore” is usually affected by operating efficiencies and waste-to-ore ratios in the period. The following table reconciles the non-GAAP measure to the consolidated statements of comprehensive income
Q2 2013 Q2 2012 YTD 2013 YTD 2012 Mining and processing costs – IFRS (000) $20,804 $16,150 $39,763 $31,169Inventory adjustments and period costs (000)
(254) 869 515 145
Total cost (000) $20,550 $17,019 $40,278 $31,314Tonnes Ore stacked / milled (000) 1,598 1,531 3,212 2,781Total cost per tonne of ore $12.86 $11.12 $12.54 $11.26
(iii) Cash operating costs per ounce and total cash costs per ounce
“Cash operating costs per ounce” and “total cash costs per ounce” as used in this analysis are non-GAAP terms typically used by gold mining companies to assess the level of gross margin available to the Company by subtracting these costs from the unit price realized during the period. These non-GAAP terms are also used to assess the ability of a mining company to generate cash flow from operations. There may be some variation in the method of computation of “cash operating costs per ounce” as determined by the Company compared with other mining companies. In this context, “cash operating costs per ounce” reflects the cash operating costs allocated from in-process and dore inventory associated with ounces of gold sold in the period. “Cash operating costs per ounce” may vary from one period to another due to operating efficiencies, waste-to-ore ratios, grade of ore processed and gold recovery rates in the period. “Total cash costs per ounce” includes “cash operating costs per ounce” plus applicable royalties. Cash operating costs per ounce and total cash costs per ounce are exclusive of exploration costs.

Q 2 2 0 1 3 R E S U L T S
26
The following table reconciles these non-GAAP measure to the consolidated statements of comprehensive income.
Q2 2013 Q2 2013 YTD 2013 YTD 2012
Mining and processing costs – IFRS (000) $20,804 $16,150 $39,763 $31,169Divided by: Gold ounces sold 55,000 50,000 108,000 91,745
Total Cash operating costs per ounce $378 $323 $368 $340
Mining and processing costs – IFRS (000) $20,804 $16,150 $39,763 $31,169Royalties – IFRS (000) 3,841 4,230 8,663 7,661Total Cash costs (000) $24,645 $20,380 $48,426 $38,830Divided by: Gold ounces sold 55,000 50,000 108,000 91,745
Total Cash costs per ounce $448 $408 $448 $423
(iv) All-in sustaining cost per ounce
Effective 2013, in conjunction with a non-GAAP initiative being undertaken by the gold mining industry, the Company is adopting an “all-in sustaining cost per ounce” non-GAAP performance measure. The Company believes the measure more fully defines the total costs associated with producing gold; however, this performance measure has no standardized meaning. Accordingly, there may be some variation in the method of computation of “all-in sustaining cost per ounce” as determined by the Company compared with other mining companies. In this context, “all-in sustaining cost per ounce” reflects total mining and processing costs, corporate and administrative costs, exploration costs, sustaining capital, and other operating costs. Sustaining capital expenditures are expenditures that do not increase annual gold ounce production at a mine site and excludes all expenditures at the Company’s development projects as well as certain expenditures at the Company’s operating sites that are deemed expansionary in nature.
The following table reconciles these non-GAAP measure to the consolidated statements of comprehensive income.
Q2 2013 Q2 2012 YTD 2013 YTD 2012
Mining and processing costs (000) $20,804 $16,150 $39,763 $31,169
Royalties (000) 3,841 4,230 8,663 7,661
Corporate and administration (000) (1) 4,574 2,886 11,831 5,550
Share-based compensation (000) 1,205 1,361 420 3,928
Exploration costs (000) (2) 2,399 2,017 4,471 4,300
Reclamation cost accretion (000) 226 129 452 256
Sustaining capital expenditures (000) 4,468 4,897 8,555 7,851
$37,517 $31,670 $74,155 $ 60,715Divided by: Gold ounces sold 55,000 50,000 108,000 91,745
All-in sustaining cost per ounce $682 $633 $687 $662
(1) Excludes corporate and administration costs incurred at the Company’s development projects (2) Excludes exploration associated with the Company’s development projects

M A N A G E M E N T ’ S D I S C U S S I O N & A N A L Y S I S (All amounts are expressed in United States dollars, unless otherwise stated)
27
(v) All-in cost
Effective 2013, in conjunction with a non-GAAP initiative being undertaken by the gold mining industry, the Company is adopting an “all-in cost per ounce” non-GAAP performance measure; however, this performance measure has no standardized meaning. Accordingly, there may be some variation in the method of computation of “all-in cost per ounce” as determined by the Company compared with other mining companies. In this context, “all-in cost per ounce” reflects total all-in sustaining cash costs, plus capital, operating, and exploration costs associated with the Company’s development projects.
Q2 2013 Q2 2012 YTD 2013 YTD 2012 All-in sustaining cost (above) $37,517 $31,670 $74,155 $60,715 Add: Development and expansion capital (000)
8,183 4,079 15,715 14,827
Add: Turkey / other exploration (000) 1,201 2,143 2,204 3,731 Add: Turkey G&A (000) 470 310 1,049 575
47,371 38,202 93,123 79,848
Divided by: Gold ounces sold 55,000 50,000 108,000 91,745
All-in cost per ounce $861 $764 $862 $870
(vi) Other additional GAAP measures
Additional GAAP measures that are presented on the face of the Company’s consolidated statements of comprehensive income and are not meant to be a substitute for other subtotals or totals presented in accordance with IFRS, but rather should be evaluated in conjunction with such IFRS measures. The following additional GAAP measures are used and are intended to provide an indication of the Company’s mine and operating performance:
Mine operating costs – represents the total of mining and processing, royalties, and amortization expense
Earnings from mine operations – represents the amount of revenues in excess of mining and processing, royalties, and amortization expense.
Earnings from operations – represents the amount of earnings before net finance income/expense, foreign exchange gain/loss, other income/loss, and income tax expense.