CORPORATE PRESENTASI JAN 2017 · 2019-05-24 · 1919 2 Mar 1981 1990 23 Dec 2002 During the Dutch...
26
PT.Bukit Asam (Persero), Tbk. Reuters: PTBA.JK Bloomberg: PTBA IJ Exchange: JKT Ticker: PTBA CORPORATE PRESENTATION JAN 2017 www.ptba.co.id Excellent Competitive Advantages
Transcript of CORPORATE PRESENTASI JAN 2017 · 2019-05-24 · 1919 2 Mar 1981 1990 23 Dec 2002 During the Dutch...

PT.Bukit Asam (Persero), Tbk.
Reuters: PTBA.JK Bloomberg: PTBA IJ Exchange: JKT Ticker: PTBA
CORPORATE PRESENTATION JAN 2017
www.ptba.co.id
Excellent Competitive Advantages


1919 2 Mar 1981
1990
23 Dec 2002
During the Dutch colonial period, the first open-pit
at Airlaya mine, in Tanjung Enim, South
Sumatera started operating.
PN TABA was converted into a limited corporation and its name changed to
PT Tambang Batubara Bukit Asam (PTBA). This
date is officially considered as the base of
the commemoration of the company’s
anniversary.
The company changed into an Indonesian state
owned company which was called “PN Tambang
Arang Bukit Asam” (TABA). PN is
abbreviation of Perusahaan Negara,
means “State Company”.
PTBA was publicly listed on the Jakarta Stock
Exchange with 35% of shares held by the public.
It traded with the initial stock price of IDR575 under the code PTBA.
Another state owned coal company, “Perusahaan
Umum Tambang batubara” merged with PT Bukit Asam (PTBA).
Since then, PTBA become the only state owned coal
mining in Indonesia.
1950Coal Mine in Ombilin,
West Sumatera, started in operation.
1876
During the period 1991-1995, on the behalf of the Indonesian government, PTBA acted as the
domestic coal regulator for Coal Contract of Works (CCoW).
Indonesia’s Oldest and Most Experienced Coal Producer
Coal Business Coal Trading Power
Generation Logistic CBM GasSubsidiaries: Investment
2015

2.01
3.08 2.90
1.80 2.02 2.04
2010 2011 2012 2013 2014 2015
Net Profit (IDR Trillion)
9.07.9
10.611.6 11.2
13.1 13.7
2009 2010 2011 2012 2013 2014 2015
Revenue (IDR Trillion)
FY15(A)a
FY16(E)b
9M15(A)c
9M16(A)d
YoY %d/c
SALES VOLUME (MT) 19.10 23.08 14.35 15.14 +5.5% PRODUCTION (MT) 19.28 19.95 14.08 12.98 -7.8% TRADING/PURCHASE (MT) 1.46 1.85 1.17 1.04 -11.1% RAILWAY CAPACITY (MT) 15.80 19.12 11.94 12.68 +6.2% REVENUES (IDR TN) 13.73 xx.x 10.50 10.04 -4.4% NET PROFIT (IDR TN) 2.04 x.xx 1.50 1.05 -29.9% STRIP RATIO 4.5 4.5 4,6 5.4 +17.4%
10.80 11.50 11.90 12.80
14.80 15.80
2010 2011 2012 2013 2014 2015
Railway Capacity (mn ton)

Padang
Palembang
Samarinda
Pekan Baru
Tanjung EnimLampung
Jakarta
Total Resources 8.27 billion tons
Total Mineable Reserves 3.33 billion tons
Tarahan
KertapatiOmbilin
Teluk Bayur
Mining Business License (IUP)
Tanjung Enim Mine 66,414 Ha
Ombilin Mine 2,950 Ha
Peranap Mine 18,230 Ha
IPC Mine 3,238 Ha
Tabalong 3,145 Ha
Total 93,977 Ha
Peranap
PTBA core operations
TARAHAN PORTStockpile : 560,000 tonsThroughput : 25 M tpaVessel : 210,000 DWT
KERTAPATI PORTStockpile : 50.000 tonsThroughput : 3.7 M tpaBarging : 8,000 DWT
TELUK BAYUR PORTStockpile : 90,000 tonsThroughput : 2.5 M tpaVessel : 40,000 DWT
IPC MINEResources : 0.024 billion tonsMineable : 0.004 billion tons
OMBILIN MINEResources : 0.10 billion tonsMineable : 0.02 billion tons
TANJUNG ENIM MINEResources : 4,71billion tonsMineable : 2,90 billion tons
PERANAP MINERecources : 0.67billion tonsMineable : 0.29 billion tons
Tambang Tabalong IPC (JORC sta.2013Resources : 0.29 billion tonsMineable : 0.11 billion tons
LAHAT MINEResources : 2,48 billion tons

Parameter BITUMINOUS SUB BITUMINOUS LIGNITE
TM (% ar) < 18 18 ‐30 > 35
CV (KCal/Kg adb) > 6,400 4,900 – 6,400 < 4,900
(KCal/Kg ar) 5,800 – 7,950 4,400 – 5,800 < 4,400
48.2%
49.1%
2.7%
Lignite Sub‐bituminous Bituminous
34.2%
62.8%
3.0%
Lignite Sub‐bituminous Bituminous

Source: JP Morgan

Indonesian Domestic Demand Vs Exports (Mt)
Coal Demand (PLN + IPP)
Source : PLN, 2014
Source: Agency For The Assessment And Application Of Technology, Dec 2014
Fuel Mix 2005‐2021 : For Power Generation
Source : PLN, 2015
Source: Wood Mackenzie Coal Market Service, 2015
Primary Energy Mix (%)
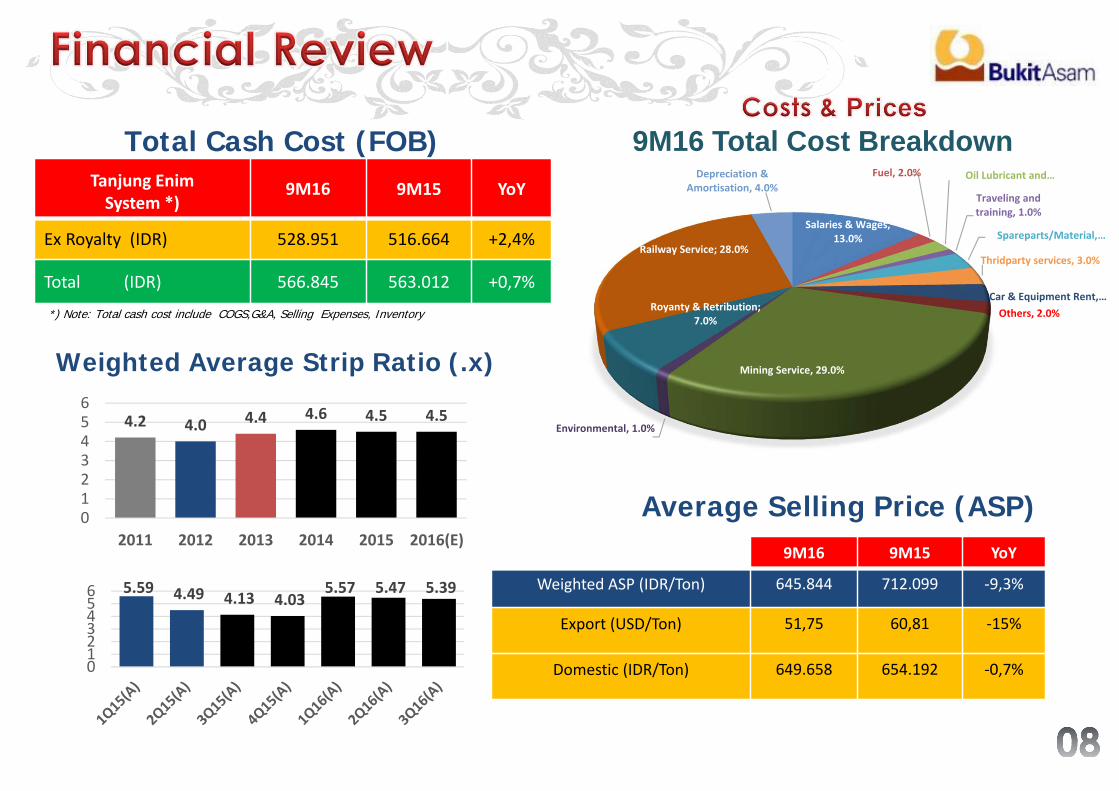
*) Note: Total cash cost include COGS,G&A, Selling Expenses, Inventory
Tanjung EnimSystem *)
9M16 9M15 YoY
Ex Royalty (IDR) 528.951 516.664 +2,4%
Total (IDR) 566.845 563.012 +0,7%
9M16 9M15 YoY
Weighted ASP (IDR/Ton) 645.844 712.099 ‐9,3%
Export (USD/Ton) 51,75 60,81 ‐15%
Domestic (IDR/Ton) 649.658 654.192 ‐0,7%
5.59 4.49 4.13 4.03 5.57 5.47 5.39
0123456
4.2 4.0 4.4 4.6 4.5 4.5
0123456
2011 2012 2013 2014 2015 2016(E)
Average Selling Price (ASP)
Weighted Average Strip Ratio (.x)
Total Cash Cost (FOB)
Salaries & Wages, 13.0%
Fuel, 2.0% Oil Lubricant and …
Traveling and training, 1.0%
Spareparts/Material, …
Thridparty services, 3.0%
Car & Equipment Rent, …Others, 2.0%
Mining Service, 29.0%
Environmental, 1.0%
Royanty & Retribution; 7.0%
Railway Service; 28.0%
Depreciation & Amortisation, 4.0%
9M16 Total Cost Breakdown

9M16 Sales Breakdown by Quality
Coal Type by Quality
Coal BrandCV TM IM Ash VM FC TS max Ash Fusion Temperatures (oC)
HGIKcal/Kg, adb Kcal/Kg,ar %,ar %,adb %,ar %,ar %,ar %,adb Deforma‐
tion Spherical Hemi‐sphere Flow
IPC 53 5,300 ‐ 34 15 8 39 40 0.5 ‐ ‐ ‐ ‐ ‐
BUKITASAM – 45 5,464 4,500 30 15 6 35 29 1.0 1216 1246 1384 1413 52
BUKITASAM – 50 6,111 5,000 28 12 6 35 31 1.0 1323 1379 1381 1398 55
BUKITASAM – 55 6,513 5,500 24 10 6 34 36 1.0 1308 1374 1388 1409 54
BUKITASAM – 64 7,070 6,400 14 5 6 34 46 1.2 1466 1488 1491 1493 60
9M16 Sales Breakdown by Country*HGI : Hardgrove Grindability Index
Domestic 60,6%
Taiwan, 17.8%
Malaysia, 8.2%
Japan, 6.8%
Srilanka, 4.6% India, 1.2%France, 0.8%

4650
44
31 30 30
2010 2011 2012 2013 2014 2015
2529
25
16 14 15
2010 2011 2012 2013 2014 2015
29
3531
1916 18
2010 2011 2012 2013 2014 2015
1712,3
9M15 9M16
24,3
9M15 9M16
2814
10,5
9M15 9M16
Gross Profit Margin Operating Profit Margin Net Profit Margin

Source: Bloomberg, Desember 1st, 2016
24.22
18.4819.90
6.22
17.58
2.66YZC ACIIQ BYAN BTU SCC COAL IN 1088 HK ITMG HRUM ADRO GLEN LN RIO AU BHP AU BUMI PTBA
GPM OPM NPM
YZC :Yanzhou Coal Mining GLEN LN: Glencore PLC.(London)ACI : Arch Coal Inc. – USA (NYSE) SCC PM: Semirara Mining and Power co – PHPCOAL IN : Coal India Ltd –INR 1080 HK: China Shenhua Energy – CO‐HADRO : PT Adaro Energi – IDX HRUM : PT Harum Energi – IDX BRAU : PT Berau coal – IDX ITMG : PT Indo Tambangraya Megah – IDXBTU : Peabody Energy Corp. – USA (NYSE) PTBA : PT Bukit Asam – IDX BYAN : PT Bayan Resources – IDX RIO AU : Rio Tinto LTD. ( Australia)BHP AU : Billiton LTD (Australia)

Assessment to PTBA with RATING “A” for performance and going concern on perspective of ENVIRONMENTAL, SOCIAL AND GOVERNANCE by Morgan Stanley Capital International (MSCI)
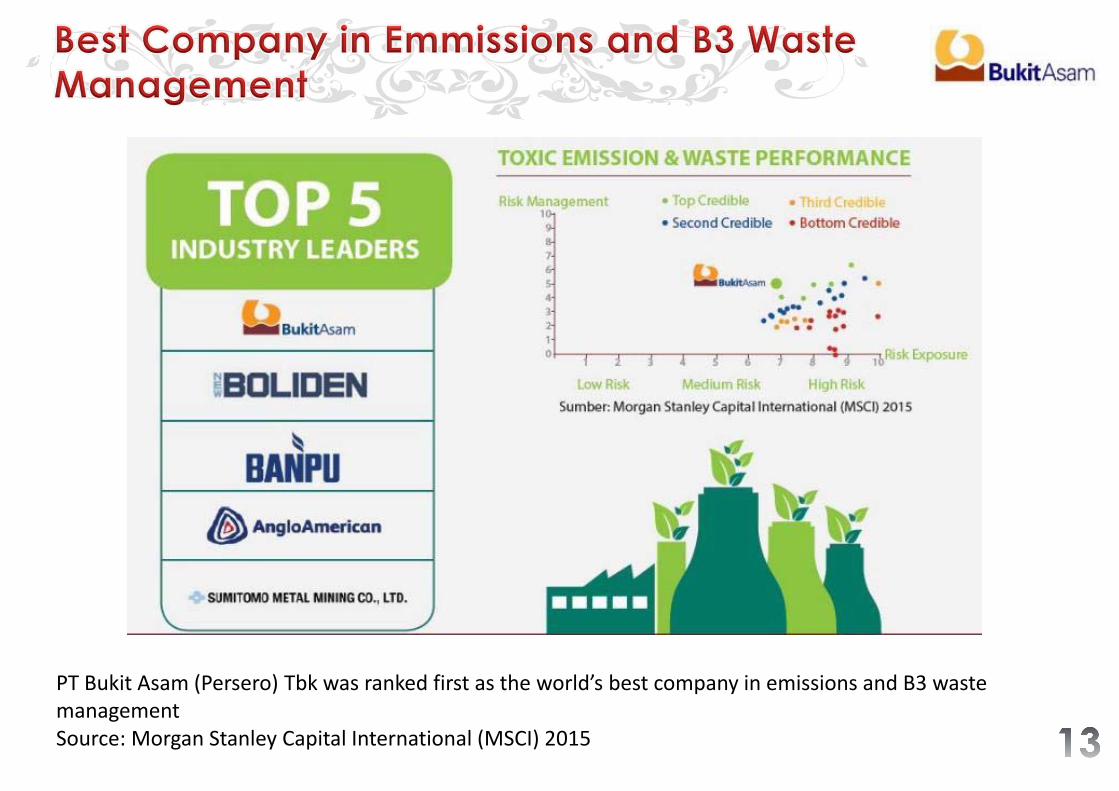
PT Bukit Asam (Persero) Tbk was ranked first as the world’s best company in emissions and B3 waste managementSource: Morgan Stanley Capital International (MSCI) 2015

Prabumulih
Muara Enim
Baturaja
Lahat
Railway (Upgraded)- Capacity : up to 22.7 M tpa- TE – Kertapati : 160.9 Km- TE – Tarahan : 409.5 Km- Expect. COD : 2015
Railway Project (New) - BATR- Capacity : 25.0 M tpa- Distance : 280 Km- Expect. COD : 2019
Double Tracks
Single Track with Crossing Sections
Tarahan Port is the largestCoal Terminal on Sumatera since it can accomodate “Capesize” bulkcarrier vessels of upto 210,000DWT. It is fully owned and operated by PTBA
Tanjung Enim Mine with the installed production capacity of 25 Mtpa
(The proposed railway)
(The proposed port)
Tanjung Enim
Tarahan Coal Terminal
KertapatiBarging Port

2x620MW Power Plant - Location : Central Banko- Coal Cons. : 5.4 M tpa- COD : 2019
3x10MW Power Plant - Usage : Internal Mine Sites- Coal Cons. : 0.15 M tpa- In Operation since Oct 2012
2x8MW Power Plant - Usage : Internal Port Sites- Coal Cons. : 0.10 M tpa- In Operation since Dec 2013
2x110MW Power Plant - Location : Banjarsari- Coal Cons. : 1.4 M tpa- COD : 2Q 2015
3x600MW Sumsel 9&10 PP- Location : Muara Enim- Coal Cons. : 8.4 M tpa- COD : 2019
600-1200MW Power Plant - Location : Peranap Riau- Coal Cons. : 8.4 M tpa- COD : 2020
Palembang
Tanjung Enim
Peranap Riau
Projects in Operation
Tender/Cooperation Process
Tarahan
2x350 MW Power Plant - Location : Kuala Tanjung- Coal Cons. : 4,5 M tpa- COD : 2020
2x40 MW Power Plant - Location : Halmahera timur- Coal Cons. : 0,35 tpa- COD : 2020
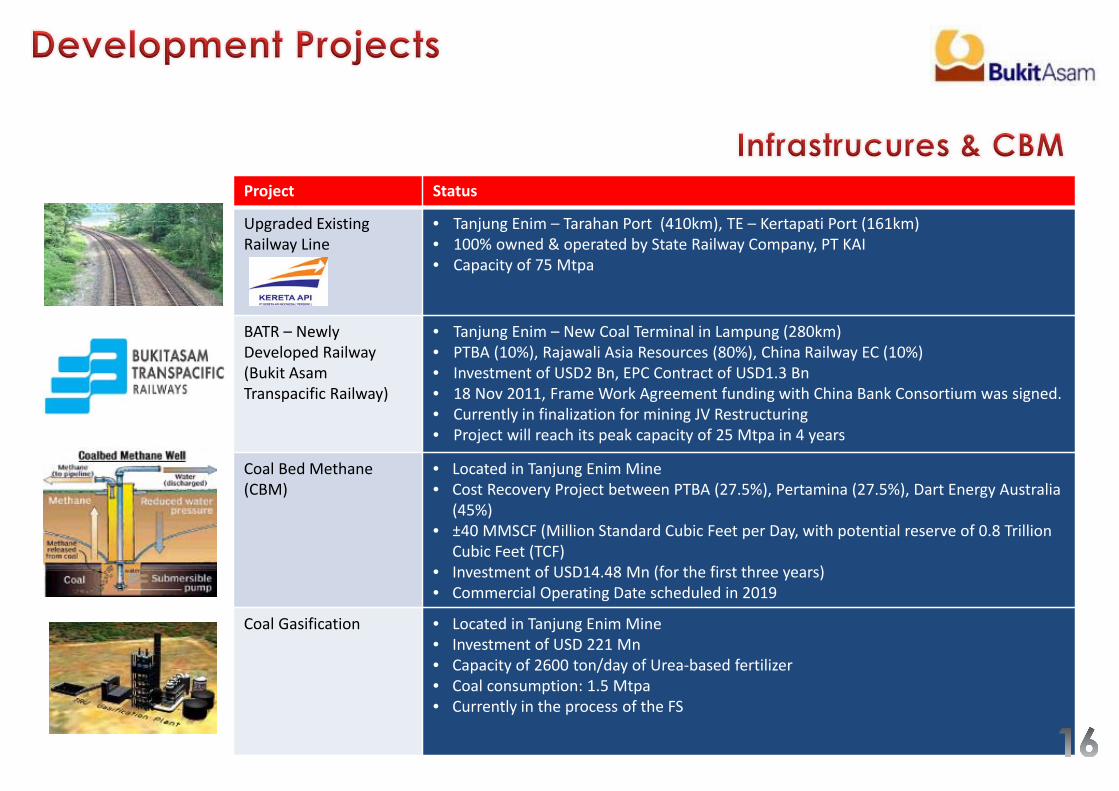
P Project Status
Upgraded ExistingRailway Line
• Tanjung Enim – Tarahan Port (410km), TE – Kertapati Port (161km)• 100% owned & operated by State Railway Company, PT KAI• Capacity of 75 Mtpa
BATR – Newly Developed Railway (Bukit Asam Transpacific Railway)
• Tanjung Enim – New Coal Terminal in Lampung (280km)• PTBA (10%), Rajawali Asia Resources (80%), China Railway EC (10%)• Investment of USD2 Bn, EPC Contract of USD1.3 Bn• 18 Nov 2011, Frame Work Agreement funding with China Bank Consortium was signed.• Currently in finalization for mining JV Restructuring• Project will reach its peak capacity of 25 Mtpa in 4 years
Coal Bed Methane (CBM)
• Located in Tanjung Enim Mine• Cost Recovery Project between PTBA (27.5%), Pertamina (27.5%), Dart Energy Australia
(45%)• ±40 MMSCF (Million Standard Cubic Feet per Day, with potential reserve of 0.8 Trillion
Cubic Feet (TCF)• Investment of USD14.48 Mn (for the first three years)• Commercial Operating Date scheduled in 2019
Coal Gasification • Located in Tanjung Enim Mine• Investment of USD 221 Mn• Capacity of 2600 ton/day of Urea‐based fertilizer• Coal consumption: 1.5 Mtpa• Currently in the process of the FS
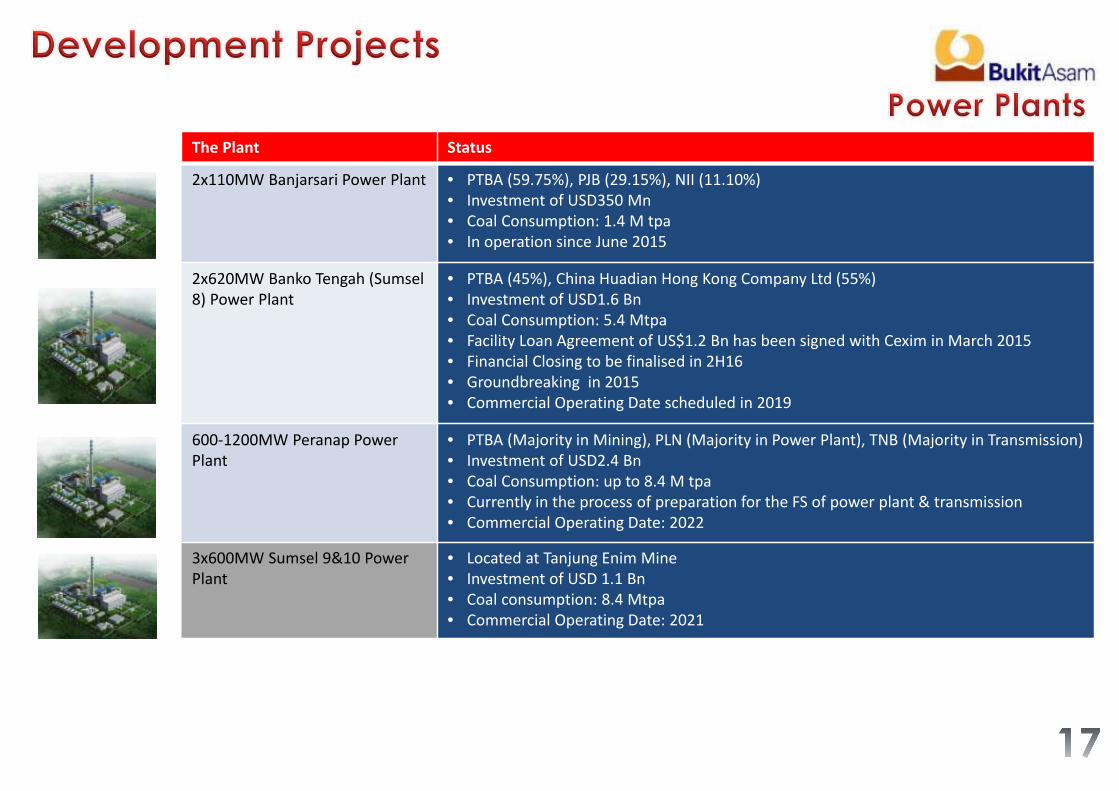
The Plant Status
2x110MW Banjarsari Power Plant • PTBA (59.75%), PJB (29.15%), NII (11.10%)• Investment of USD350 Mn• Coal Consumption: 1.4 M tpa• In operation since June 2015
2x620MW Banko Tengah (Sumsel 8) Power Plant
• PTBA (45%), China Huadian Hong Kong Company Ltd (55%)• Investment of USD1.6 Bn• Coal Consumption: 5.4 Mtpa• Facility Loan Agreement of US$1.2 Bn has been signed with Cexim in March 2015• Financial Closing to be finalised in 2H16• Groundbreaking in 2015• Commercial Operating Date scheduled in 2019
600‐1200MW Peranap Power Plant
• PTBA (Majority in Mining), PLN (Majority in Power Plant), TNB (Majority in Transmission)• Investment of USD2.4 Bn• Coal Consumption: up to 8.4 M tpa• Currently in the process of preparation for the FS of power plant & transmission• Commercial Operating Date: 2022
3x600MW Sumsel 9&10 Power Plant
• Located at Tanjung Enim Mine• Investment of USD 1.1 Bn• Coal consumption: 8.4 Mtpa• Commercial Operating Date: 2021

Having A Total Long Term Coal Supply with: Committed Volumeo National Power Company\PLN (2010 – 2030) : 262 Mto Indonesia Power (2013 – 2022) : 52 Mto Huadian Bukit Asam Power\Power Plant (25 Years) : 150 Mto Bukit Pembangkit Innovative\Power Plant (30 Years) : 36 Mto Indonesia Fertilizer (30 Years) : 69 Mto Cilacap Power Plant (4 Years) : 5 Mt
Total : 574 Mt
Supporting Power Plants Projects Development for: Coal Consumptiono 3x10MW Power Plant, Muara Enim (In Operation) : 0.15 Mtpao 2x8MW Power Plant, Lampung (In Operation) : 0.10 Mtpao 2x110MW Banjarsari Power Plant (In Operation) : 1.40 Mtpao 2x610MW Banko Tengah Power Plant (In Progress) : 5.40 Mtpao 800 – 1200MW Peranap (In Process) : 8.40 Mtpao 1800MW Sumsel 9-10 Power Plants (In Bidding Process) : 8.10 Mtpa
Supporting National Energy Policy

• Coverage: 43 Ha• Throughput: 25 Mtpa• Capacity of Berths: Shiploader#2 210,000DWT Shiploader#1 80,000DWT Bargeloader 10,000DWT
• Supporting Facilities: Total Stockpiles: 0.9 Million ton 2x8MW Coal Fired Power Plant Train Unloading System with 4 (Four) RCDs (Rotary Car Dumper) 10,000DWT Barge Unloading
• Certified by ISPS Code

PTBA
• Bukit Kendi (75%), coal mining, South Sumatera
• International Prima Coal (51%), East Kalimantan
• Bukit Asam Banko(65%), South Sumatera
• Bukit Asam Prima (99.99%)
• Bukit PembangkitInnovative (59.75%)
• Huadian Bukit AsamPower (45%)
• Bukit AsamTranspacific Railway (10%)
• Bukit Asam MetanaEnim (99.99%)
• Bukit Asam MetanaOmbilin (99.99%)
• Bukit Asam MetanaPeranap (99.99%)
The Indonesian Government owns 65% of Total Shares
The Subsidiaries:
PTBA operates a fully integrated large coal mining in Tanjung Enim( South Sumatera), Ombilin (West
Sumatera), Peranap (Riau), and East Kalimantan with Total
Resources & Reserves are 8.27 billion tons and 3.33 billion tons
respectively
• Bukit Multi Investama (99,86%)
• Bukit EnergiInvestama(99,28%)
Bukit Prima Bahari
Pelabuhan Bukit Prima
Anthrakas
Bumi Sawindo Permai
Satria Bahana Sarana
Bukit Asam Medika
Internasional Prima Cemerlang
Tabalong Prima Resources
Mitra Hasrat Bersama Bukit Energi Service Terpadu
Panajam Internasional Terminal

Treasury Stock, 8.51%
Government, 65.02%
Domestic, 15.96%
Foreign, 10.51%
50%45%
60% 60%55% 55%
35%
30%371.05
533.4
523.12
803.56
720.75
461.97324.57
289.73
0
200
400
600
800
1000
0%
10%
20%
30%
40%
50%
60%
70%
2008 2009 2010 2011 2012 2013 2014 2015
Dividend Payout Ratio
Dividend per share (IDR)
The Top Forty Shareholders as of Oct 31st, 2016
NO. URUT NAMA INVESTOR JUMLAH PERCENTAGE
1 TAMBANG BATU BARA BUKIT ASAM (PERSERO), Tbk PT 196,056,700.00 8.51
2 BPJS Ketenagakerjaan‐JHT 53,376,000.00 2.32
3 PT Taspen (Persero) ‐ THT 35,516,000.00 1.54
4 PT. PRUDENTIAL LIFE ASSURANCE ‐ REF 22,953,900.00 1
5 BBH BOSTON S/A VANGRD EMG MKTS STK INFD 14,277,925.00 0.62
6 BPJS KETENAGAKERJAAN ‐ JKK 10,888,000.00 0.47
7 PAMAPERSADA NUSANTARA, PT 9,000,000.00 0.39
8 JPMCB‐VANGUARD TOTAL INTERNTNL STOCK INDEX FUND ‐2157804327 8,898,069.00 0.39
9 BPJS KETENAGAKERJAAN ‐ BPJS 8,529,900.00 0.37
10 BNP PARIBAS ARBITRAGE SNC 8,389,721.00 0.36
11 PT. PRUDENTIAL LIFE ASSURANCE ‐ SEF 8,382,100.00 0.36
12 PT AIA FINL ‐ UL EQUITY 8,298,000.00 0.36
13CITIBANK NEW YORK S/A EMERGING MARKETS CORE EQUITY PORTFOLIO OF DFA INV DIMENSIONS GRP INC. 7,321,400.00 0.32
14 PT. Lhasa Capital Management 6,365,000.00 0.28
15 REKSA DANA SAM INDONESIAN EQUITY FUND ‐ 846654000 6,172,000.00 0.27
16CITIBANK NEW YORK S/A THE EMERGING MARKETS SMALL CAP SERIES OF THE DFA INVESTMENT TRUST COMPANY 5,646,500.00 0.25
17 ASURANSI JIWA MANULIFE INDONESIA, PT‐49454000 5,439,200.00 0.24
18 PT. PRUDENTIAL LIFE ASSURANCE ‐ REP 5,072,600.00 0.22
19 REKSA DANA ASHMORE DANA PROGRESIF NUSANTARA 4,821,000.00 0.21
20 PT AIA FINL ‐ SYARIAH EQ 4,248,100.00 0.18
21 PT AXA MANDIRI FINANCIAL SERVICES S/A MANDIRI DINAMIC MONEY Rp 4,155,200.00 0.18
22 Reksadana Dana Ekuitas Andalan 4,063,600.00 0.18
23 RBC IST AC RBC EMERGING MARKETS DIVIDEND FUND 3,965,595.00 0.17
24 CITIBANK LONDON S/A STICHTING PGGM DEPOSITARY 3,779,700.00 0.16
25 BNYMSANV RE BNYM RE MKT VCTRS COAL XCHNG‐TRADEDFD‐2039844230 3,771,000.00 0.16
26 REKSA DANA BNP PARIBAS INFRASTRUKTUR PLUS 3,627,200.00 0.16
27 SSB 0BGF S/A ISHARES MSCI INDONESIA ETF‐2144610463 3,563,850.00 0.15
28 RD BNP PARIBAS EKUITAS ‐ 897634000 3,550,400.00 0.15
29 DEUTSCHE BK AG LONDON‐2018304002 3,511,034.00 0.15
30 RD PREMIER ETF INDO STATE‐ OWNED COMPANIES‐889064000 3,447,200.00 0.15
31 CITIBANK NEW YORK S/A DIMENSIONAL EMERGING MARKETS VALUE FUND 3,440,700.00 0.15
32 REKSA DANA MANDIRI SAHAM ATRAKTIF 3,432,500.00 0.15
33 UBS AG LONDON‐2140724000 3,401,247.00 0.15
34 BPJS KETENAGAKERJAAN ‐ JK 3,372,100.00 0.15
35 SSB C021 ACF COLLEGE RETIREMENT EQUITIES FUND ‐2144607801 3,052,780.00 0.13
36 REKSA DANA DANAREKSA MAWAR KONSUMER 10 3,028,800.00 0.13
37 SSB 2Q27 S/A ISHARES CORE MSCI EMERGING MARKETS ETF‐2144613424 2,936,600.00 0.13
38 AVRIST ‐ LINK AGGRESSIVE (EQ) IDR FUND 2,924,200.00 0.13
39 MORGAN STANLEY & CO INTL PLC ‐ IPB CLIENT ACCOUNT 2,698,600.00 0.12
40 SSB WTAU S/A WISDOMTREE EMERGING MRKTS SC DIV FUND‐2144614648 2,577,000.00 0.11
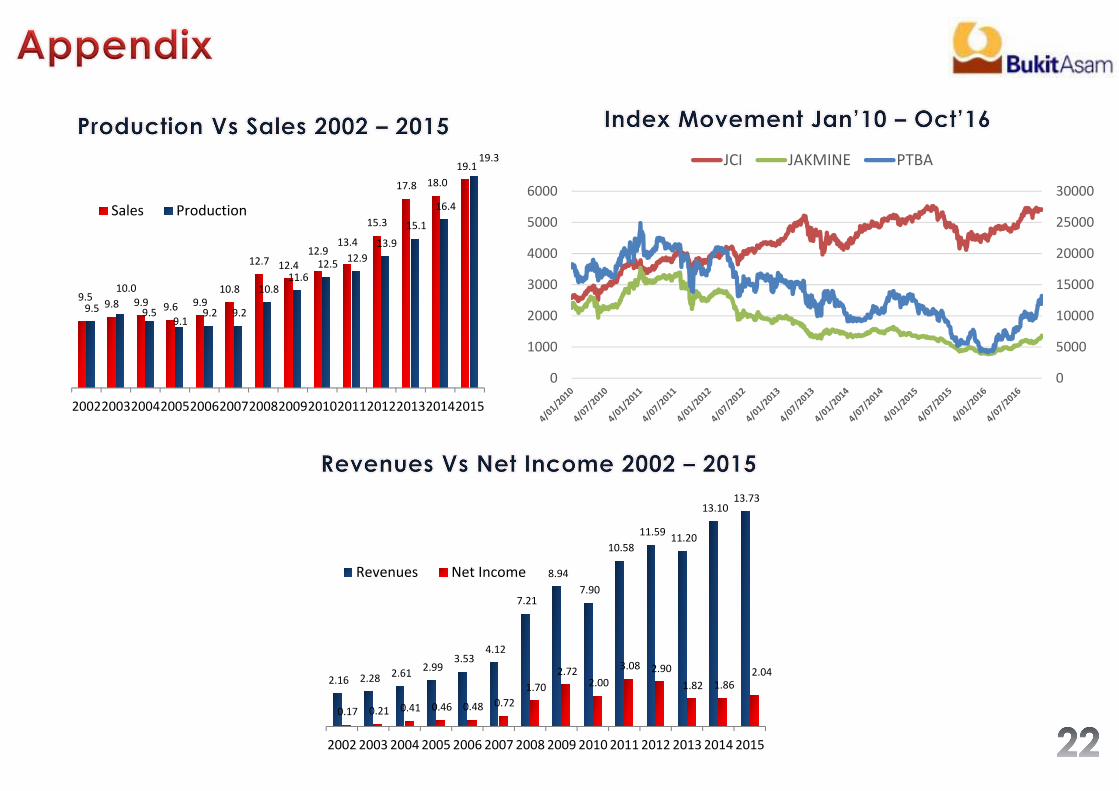
9.5 9.8 9.9 9.6 9.910.8
12.7 12.412.9
13.4
15.3
17.8 18.0 19.1
9.5
10.0
9.5 9.1
9.2 9.2
10.8 11.6
12.5 12.9 13.9
15.1
16.4
19.3
20022003200420052006200720082009201020112012201320142015
Sales Production
2.16 2.28 2.61 2.99 3.53
4.12
7.21
8.94 7.90
10.58 11.59 11.20
13.10 13.73
0.17 0.21 0.41 0.46 0.48 0.72 1.70
2.72 2.00
3.08 2.90 1.82 1.86
2.04
2002 2003 2004 2005 2006 2007 2008 2009 2010 2011 2012 2013 2014 2015
Revenues Net Income
0
5000
10000
15000
20000
25000
30000
0
1000
2000
3000
4000
5000
6000
JCI JAKMINE PTBA

In Million Ton
0
20
40
60
80
100
120
2016 2017 2018 2019 2020 2021 2022 2023 2024
Anak Perusahaan
Tambang Akuisisi
Konsumsi PLTU LN
Peranap
Banteng B
Banteng A
UPTE Eksisting
0
20
40
60
80
100
120
2016 2017 2018 2019 2020 2021 2022 2023 2024
PT IPC
PT BAP
CAT HTR / IER
Gasifikasi PUSRI
PLTU LN
PLTU Pertalian
PLTU Sumsel 9/10
PLTU Sumsel 8
PLTU Banjarsari II
PLTU Banjarsari I
PLTU Bukit Asam & SemenBaturaja
KAI Eksisting
KAI TE‐Prajen
BATR
Akuisisi Tambang

In Million Ton
0
20
40
60
80
100
120
140
160
7‐Jan‐11
2‐Feb‐11
4‐Mar‐11
1‐Ap
r‐11
29‐Apr‐11
27‐M
ei‐11
24‐Ju
ni 11
22‐Ju
l‐11
19‐Aug
‐11
16‐Sep
‐11
14‐Oct‐11
11‐Nov‐11
9‐De
c‐11
13‐Ja
n‐12
10‐Feb
‐12
09‐M
ar‐12
5‐Ap
r‐12
04‐M
ay‐12
01‐Ju
n‐12
29‐Ju
n‐12
27‐Ju
l‐12
24‐Aug
‐12
21‐Sep
‐12
19‐Oct‐12
16‐Nov‐12
14‐Dec‐12
11‐Ja
n‐13
8‐Feb‐13
8‐Mar‐13
5‐Ap
r‐13
3‐May‐13
31‐M
ay‐13
28‐Ju
n‐13
26‐Ju
l‐13
23‐Aug
‐13
20‐Sep
‐13
18‐Oct‐13
15‐Nov‐13
13‐Dec‐13
10‐Ja
n‐14
7‐Feb‐14
7‐Mar‐14
4‐Ap
r‐14
2‐May‐14
30‐M
ay‐14
27‐Ju
n‐14
25‐Ju
l‐14
22‐Aug
‐14
19‐Sep
‐14
17‐Oct‐14
14‐Nov‐14
12‐Dec‐14
2‐Jan‐15
30‐Ja
n‐15
27‐Feb
‐15
27‐M
ar‐15
24‐Apr‐15
22‐M
ay‐15
19‐Ju
n‐15
16‐Ju
l‐15
14‐Aug
‐15
11‐Sep
‐15
9‐Oct‐15
6‐Nov‐15
4‐De
c‐15
30‐Dec‐15
29‐Ja
n‐16
26‐Feb
‐16
24‐M
ar‐16
22‐Apr‐16
20‐M
ay‐16
17‐Ju
n‐16
15‐Ju
l‐16
12‐Aug
‐16
9‐Sep‐16
7‐Oct‐16
Rising of Global Index Oct 2015- Oct 2016 = 115%
Global Index on 30 Oct 2016 = USD 117.15ICI 6.500 GAR on 30 Oct 2016 = USD 96.37ICI 5.800 GAR on 30 Oct 2016 = USD 84.34ICI 5.000 GAR on 30 Oct 2016 = USD 67.55ICI 4.200 GAR on 30 Oct 2016 = USD 43.82
Global Index on 30 Oct 2015 = USD 54.52 ICI 6.500 GAR on 30 Oct 2015 = USD 59.5 ICI 5.800 GAR on 30 Oct 2015 = USD 48.55 ICI 5.000 GAR on 30 Oct 2015 = USD 38.37 ICI 4.200 GAR on 30 Oct 2015 = USD 26.53
Global Index on 30 August 2014 = USD 76.89ICI 6.500 GAR on 30 August 2014 = USD 73.31ICI 5.800 GAR on 30 August 2014 = USD 63.42ICI 5.000 GAR on 30 August 2014 = USD 50.79ICI 4.200 GAR on 30 August 2014 = USD 37.02
Global Index on 30 August 2013 = USD 76.60ICI 6.500 GAR on 30 August 2013 = USD 79.02ICI 5.800 GAR on 30 August 2013 = USD 69.72ICI 5.000 GAR on 30 August 2013 = USD 58.03ICI 4.200 GAR on 30 August 2013 = USD 41.82
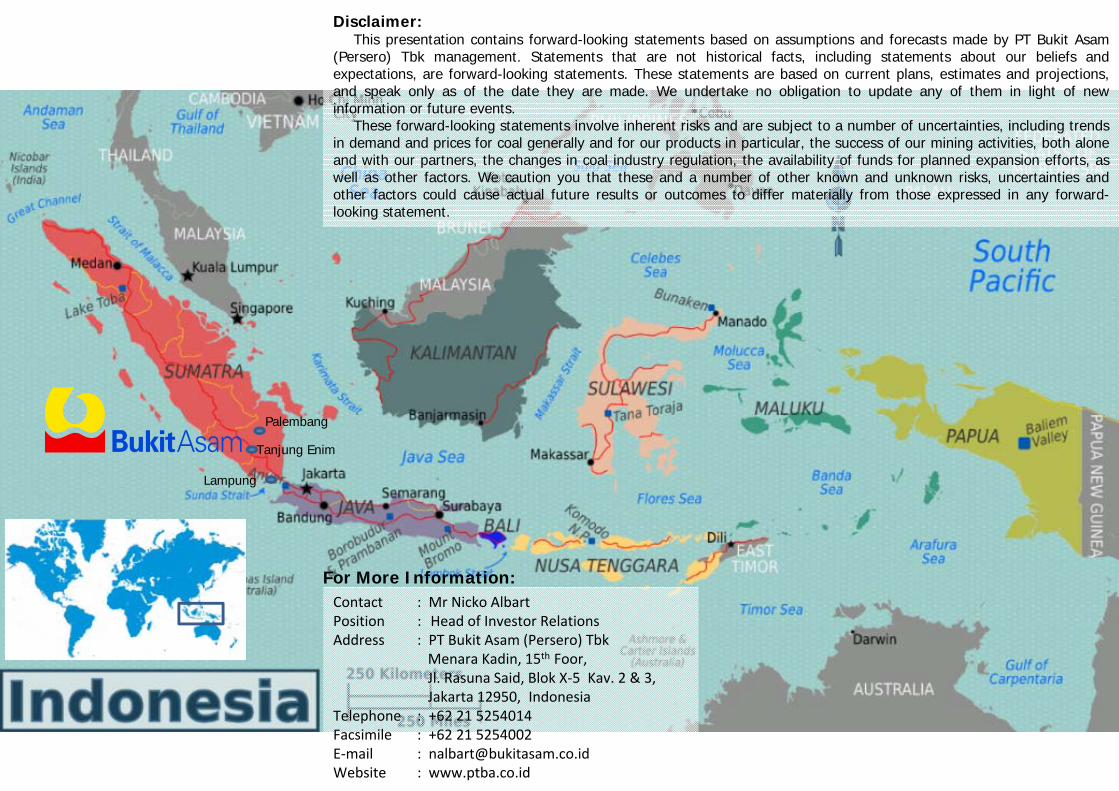
Palembang
Tanjung Enim
Lampung
Contact : Mr Nicko AlbartPosition : Head of Investor RelationsAddress : PT Bukit Asam (Persero) Tbk
Menara Kadin, 15th Foor, Jl. Rasuna Said, Blok X‐5 Kav. 2 & 3, Jakarta 12950, Indonesia
Telephone : +62 21 5254014Facsimile : +62 21 5254002E‐mail : [email protected] : www.ptba.co.id
Disclaimer:This presentation contains forward-looking statements based on assumptions and forecasts made by PT Bukit Asam
(Persero) Tbk management. Statements that are not historical facts, including statements about our beliefs andexpectations, are forward-looking statements. These statements are based on current plans, estimates and projections,and speak only as of the date they are made. We undertake no obligation to update any of them in light of newinformation or future events.
These forward-looking statements involve inherent risks and are subject to a number of uncertainties, including trendsin demand and prices for coal generally and for our products in particular, the success of our mining activities, both aloneand with our partners, the changes in coal industry regulation, the availability of funds for planned expansion efforts, aswell as other factors. We caution you that these and a number of other known and unknown risks, uncertainties andother factors could cause actual future results or outcomes to differ materially from those expressed in any forward-looking statement.
For More Information: