Corporate Plan Consultation - Home - Derbyshire … Derbyshire Dales District Council Corporate Plan...
42
DERBYSHIRE DALES DISTRICT COUNCIL M·E·L RESEARCH Corporate Plan Consultation Derbyshire Dales District Council Final Report September 2015
Transcript of Corporate Plan Consultation - Home - Derbyshire … Derbyshire Dales District Council Corporate Plan...
DERBYSHIRE DALES DISTRICT COUNCIL M·E·L RESEARCH
Corporate Plan Consultation
Derbyshire Dales District Council
Final Report
September 2015
DERBYSHIRE DALES DISTRICT COUNCIL M·E·L RESEARCH
MEASUREMENT EVALUATION LEARNING: USING EVIDENCE TO SHAPE BETTER SERVICES
1. Project details
Name of company M·E·L Research Ltd
M·E·L Research
8 Holt Court
Aston Science Park
Birmingham B7 4AX
Tel: 0121 604 4664
Fax: 0121 604 6776
Email: [email protected]
Web: www.m-e-l.co.uk
Title Derbyshire Dales District Council Corporate Plan
Consultation Final Report September 2015
Client Derbyshire Dales District Council
Project number 15114
Client contact
Author Grace Blackham
Contract Manager Clare Rapkins

DERBYSHIRE DALES DISTRICT COUNCIL M·E·L RESEARCH
MEASUREMENT EVALUATION LEARNING: USING EVIDENCE TO SHAPE BETTER SERVICES Page 2
2. Executive summary
This report provides the findings from a survey of 1,225 residents in the Derbyshire Dales that responded
to a questionnaire on their views on what Derbyshire District Council’s priorities should be over the next
four years.
Future spending priorities
Current services in the Derbyshire Dales
With an overall Customer Service Index (CSI) score of 66.3, respondents are generally satisfied with the
services currently provided by Derbyshire Dales District Council.
Respondents rate the service ‘Keeping streets and public areas clean and attractive’ as the most
important service to them in making the Derbyshire Dales a good place to live (mean importance score =
8.9).
Respondent comments on future spending priorities
Comments given to help Derbyshire District Council decide its future spending priorities mainly relate to
car parking issues (13% of comments), the need for more affordable housing (7% of comments) and the
need to improve traffic control (5% of comments).
The Derbyshire Dales in four years
The top three words respondents use to describe how they would want the Derbyshire Dales to be in
four years are: Clean / Cleaner / Cleanliness; Safe / Safer; and Thriving.
Opinions about your local area
Your local area as a place to live
The majority of respondents are fairly or very satisfied (85%) with their local area as a place to live. Just
8% of respondents are fairly or very dissatisfied.
Overall satisfaction
The majority of respondents are fairly or very satisfied (65%) overall with the way Derbyshire Dales
District Council runs things. Just 12% of respondents are fairly or very dissatisfied.
Value for money
Just over half of respondents tend to or strongly agree (53%) that Derbyshire Dales District Council
provides value for money. A further 29% of respondents neither agree nor disagree and 18% tend to or
strongly disagree.

DERBYSHIRE DALES DISTRICT COUNCIL M·E·L RESEARCH
MEASUREMENT EVALUATION LEARNING: USING EVIDENCE TO SHAPE BETTER SERVICES Page 3
Influencing decisions that affect the local area
The majority of respondents tend to or definitely disagree (52%) that they can influence decisions
affecting their local area. Just under a quarter of respondents tend to or definitely agree (23%) that they
can influence decisions while a further a quarter neither agree nor disagree (25%).
DERBYSHIRE DALES DISTRICT COUNCIL M·E·L RESEARCH
MEASUREMENT EVALUATION LEARNING: USING EVIDENCE TO SHAPE BETTER SERVICES Page 4
3. Contents
1. Project details ............................................................................................................................................... 1
2. Executive summary ..................................................................................................................................... 2
Future spending priorities ...................................................................................................... 2
Opinions about your local area ............................................................................................. 2
3. Contents….. .................................................................................................................................................. 4
4. Introduction ................................................................................................................................................... 5
Method and Response Rate ................................................................................................... 5
Statistical reliability and reporting conventions ................................................................. 5
5. Future spending priorities .......................................................................................................................... 7
Current Services in the Derbyshire Dales ........................................................................... 7
Current Services by geographic area ................................................................................. 11
Respondent comments on future spending priorities .................................................... 18
The Derbyshire Dales in four years .................................................................................... 20
6. Opinions about your local area ............................................................................................................... 22
Your local area as a place to live ......................................................................................... 22
Overall satisfaction ................................................................................................................ 24
Value for money ..................................................................................................................... 26
Influencing decisions that affect the local area ................................................................ 28
7. Appendices ................................................................................................................................................. 30
Appendix 1 – Profile of respondents .................................................................................. 31
Appendix 2 – Question response counts .......................................................................... 32
Appendix 3 – Cover letter ..................................................................................................... 34
Appendix 4 - Questionnaire .................................................................................................. 35
DERBYSHIRE DALES DISTRICT COUNCIL M·E·L RESEARCH
MEASUREMENT EVALUATION LEARNING: USING EVIDENCE TO SHAPE BETTER SERVICES Page 5
4. Introduction
In June 2015, Derbyshire Dales District Council (District Council) commissioned M·E·L Research to
undertake their Corporate Plan Consultation. The consultation was carried out between June and July
2015 to ascertain residents’ views on what the District Council’s priorities should be over the next four
years. The findings will be used to shape the targets and spending priorities for Derbyshire Dales District
Council’s Corporate Plan 2015 – 2019.
Method and Response Rate
Fieldwork was undertaken throughout July 2015. A sample mailing to 4,500 randomly selected
Derbyshire Dales residents who are on the electoral role was sent out, which included a paper copy of the
questionnaire and a freepost envelope. This was followed by a postcard reminder mailing to non-
respondents two weeks later. Respondents were also given the option to complete the survey online (the
survey URL and a Quick Response (QR) code were included on the covering letter and questionnaire).
To ensure there were no duplicate responses, any resident who undertook the survey online had to enter
a unique M·E·L ID.
In addition, the District Council emailed a link to a separate public online version of the survey to 315
people from their communications database that had expressed an interest in consultation and issued a
reminder via Facebook and Twitter on 27th July. The District Council also emailed this link to 343 people
who are either members of the Citizen Panel or expressed interest in being consulted via a previous
budget consultation exercise. In addition, the on-line survey was publicised to residents at the three Area
Community Forum meetings that took place in July.
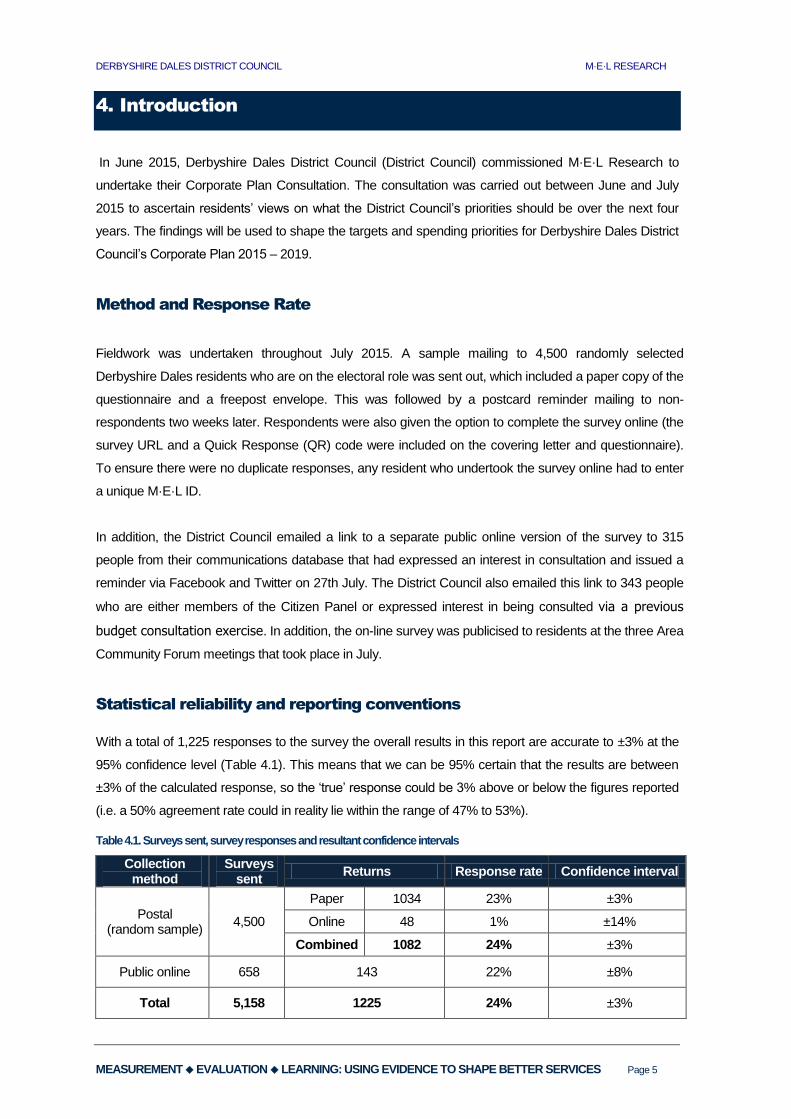
Statistical reliability and reporting conventions
With a total of 1,225 responses to the survey the overall results in this report are accurate to ±3% at the
95% confidence level (Table 4.1). This means that we can be 95% certain that the results are between
±3% of the calculated response, so the ‘true’ response could be 3% above or below the figures reported
(i.e. a 50% agreement rate could in reality lie within the range of 47% to 53%).
Table 4.1. Surveys sent, survey responses and resultant confidence intervals
Collection method
Surveys sent
Returns Response rate Confidence interval
Postal (random sample)
4,500
Paper 1034 23% ±3%
Online 48 1% ±14%
Combined 1082 24% ±3%
Public online 658 143 22% ±8%
Total 5,158 1225 24% ±3%

DERBYSHIRE DALES DISTRICT COUNCIL M·E·L RESEARCH
MEASUREMENT EVALUATION LEARNING: USING EVIDENCE TO SHAPE BETTER SERVICES Page 6
In some cases the actual base size being reported is smaller than the overall response rate due to some
respondents not answering specific questions; the confidence interval will be higher for these questions.
Analysis
This report represents the findings for all 1,225 responses. In order to ensure that the findings are as
representative to the Derbyshire Dales population as possible, weighting by age and gender has been
applied. To provide further insight into the results, analysis by demographic sub groups has been
undertaken and where statistically significant differences occur these have been drawn out in the report.
Rounding percentages issue
We report decimal places rounded to the nearest whole number. If specific response options are then
totalled, this can result in slight rounding differences in the figures reported. Owing to the rounding of
numbers, percentages displayed visually on graphs may not always add up to 100%; this may also apply
to some of the percentages reported for ‘total satisfaction’. For example, 51.4% plus 44.2% equals
95.6%. Rounded to the nearest whole number this total would be reported as 96%. But in the report this
would be shown as 51% plus 44% equalling 95%, giving the appearance that the reported total is
incorrect.

DERBYSHIRE DALES DISTRICT COUNCIL M·E·L RESEARCH
MEASUREMENT EVALUATION LEARNING: USING EVIDENCE TO SHAPE BETTER SERVICES Page 7
5. Future spending priorities
Current Services in the Derbyshire Dales
Respondents were asked to score how important a number of services are to them in making the
Derbyshire Dales a good place to live. Scores were based on a ten-point scale where 1 = extremely
unimportant and 10 = extremely important. Respondents were then asked to score how satisfied or
dissatisfied they are with the same services. Scores were based on a ten-point scale where 1 =
extremely dissatisfied and 10 = extremely satisfied. A Customer Satisfaction Index (CSI) was calculated
based on these scores for all respondents and for demographic sub groups.
The overall CSI score is 66.3 which shows that respondents are generally satisfied with the services
currently provided by Derbyshire Dales District Council (see Table 5.1 for details of CSI calculations).
With a mean importance score of 8.9 (out of a possible 10), respondents rate the service ‘Keeping
streets and public areas clean and attractive’ as the most important service in making the Derbyshire
Dales a good place to live. In comparison, the service ‘Employing staff to put on Matlock Bath
Illuminations and other special events in future’ has the lowest mean score (5.9) and therefore is the
least important service for respondents.
All of the services listed, excluding ‘Providing high quality regulatory services that keep food safe,
premises licenced and building of a good standard’ have a standard deviation of 2 or more for the
satisfaction mean score. This suggests a wide variety of opinion in the levels of satisfaction between
respondents for the majority of services.
All services (excluding ‘Employing staff to put on Matlock Bath Illuminations and other special events in
future’) have negative priority for improvement (PFI) values. This means that for the majority of services
there is a gap between how important the service is to respondents and the satisfaction they have with
the service. Therefore, levels of satisfaction could be improved for the vast majority services. The
services that are the highest priority for improvement are: ‘Helping our town centres to thrive’ (PFI score
of -2.4); ‘Providing off-street car parks for residents and visitors’ (PFI score of -2.3); ‘Keeping streets and
public areas clean and attractive’ (PFI score of -2.1); and ‘Tackling crime and anti-social behaviour e.g.
providing secure car parks, working in partnership to tackle anti-social behaviour’ (PFI score of -2.0). A
visual representation of the gaps between importance and satisfaction for each service can be seen in
Figure 5.1.

DERBYSHIRE DALES DISTRICT COUNCIL M·E·L RESEARCH
MEASUREMENT EVALUATION LEARNING: USING EVIDENCE TO SHAPE BETTER SERVICES Page 8
Table 5.1. Current Services in the Derbyshire Dales - Customer Satisfaction Index (CSI) - 2015 (base: 1225)
Service (A) Importance
Score (B)
Weighting Factor (%)
( C )
Standard Deviation - Importance
(D)
Satisfaction Score
(E)
Weighted Score
(F)
Standard Deviation - Satisfaction
(G)
PFI (H)
Keeping streets and public areas clean and attractive 8.9 0.07 1.66 6.8 0.46 2.24 -2.07
Tackling crime and anti-social behaviour e.g. providing secure car parks, working in partnership to tackle anti-social behaviour
8.6 0.06 1.96 6.6 0.43 2.20 -2.00
Helping our town centres to thrive 8.4 0.06 1.96 6.0 0.38 2.25 -2.44
Maintaining parks and recreation grounds 8.4 0.06 1.82 7.5 0.48 2.08 -0.85
Providing off-street car parks for residents and visitors 8.0 0.06 2.17 5.8 0.35 2.58 -2.28
Providing facilities / activities for young people e.g. sports lessons, skate parks and other physical recreational facilities
8.0 0.06 2.23 6.5 0.39 2.33 -1.51
Providing Sports and Leisure Facilities & Activities 7.9 0.06 2.08 7.1 0.43 2.05 -0.84
Providing high quality regulatory services that keep food safe, premises licenced and building of a good standard
7.9 0.06 2.09 7.4 0.45 1.78 -0.52
Encouraging visitors to the Derbyshire Dales to spend more money at local businesses
7.9 0.06 2.23 6.5 0.39 2.17 -1.38
Creating and sustaining local employment and business opportunities e.g. ensuring sufficient land and premises for businesses
7.9 0.06 2.18 6.2 0.37 2.06 -1.62
Improving recycling and composting for household waste 7.8 0.06 2.25 7.7 0.45 2.07 -0.10
Providing public toilets for visitors to our towns and villages 7.7 0.06 2.40 6.1 0.36 2.49 -1.57
Continuing to support local markets including Farmers' Markets 7.4 0.06 2.39 7.1 0.40 2.13 -0.27
Improving the supply of affordable, decent housing 7.2 0.05 2.76 5.9 0.32 2.40 -1.28
Supporting community / voluntary groups e.g. providing grants to local groups, providing meeting venues
7.1 0.05 2.35 6.3 0.34 2.06 -0.73
Ensuring you know what Council services are available to you 7.0 0.05 2.51 6.4 0.34 2.23 -0.57
Employing staff to put on Matlock Bath Illuminations and other special events in future 5.9 0.04 2.70 6.7 0.30 2.28 0.83
Total 131.88 CSI (%) 66.33
(A) Services listed in order of importance - most important at the top (E) The average satisfaction score (mean) for each service
(B) The average importance score (mean) for each service (F) The satisfaction score multiplied by the weighting, which is then totalled and multiplied by 10 to express as a %
(C) Individual importance score expressed as a % of the total importance score (G) Standard deviation shows the 'average distance from the mean score' (satisfaction) - less than 2, similar scores
(D) Standard deviation shows the 'average distance from the mean score' (importance) - less than 2, similar scores
(H) Priority for Improvement (PFI) - the difference between E and B (negative scores denote possible areas for improvement)
: a standard deviation of 2 or more, indicting a greater range of rating scores

DERBYSHIRE DALES DISTRICT COUNCIL M·E·L RESEARCH
MEASUREMENT EVALUATION LEARNING: USING EVIDENCE TO SHAPE BETTER SERVICES Page 9
Figure 5.1 .Current services in the Derbyshire Dales - Comparison between importance mean and satisfaction mean
NB. Services with a higher importance mean than satisfaction mean have a negative Priority for Improvement (PFI) value.
8.9
8.6
8.4
8.4
8.0
8.0
7.9
7.9
7.9
7.9
7.8
7.7
7.4
7.2
7.1
7.0
5.9
6.8
6.6
6.0
7.5
5.8
6.5
7.1
7.4
6.5
6.2
7.7
6.1
7.1
5.9
6.3
6.4
6.7
Keeping streets and publicareas clean and attractive
Tackling crime andanti-social behaviour
Helping our town centres to thrive
Maintaining parksand recreation grounds
Providing off-street car parksfor residents and visitors
Providing facilities / activitiesfor young people
Providing Sports and LeisureFacilities & Activities
Providing high quality regulatory servicesthat keep food safe, premises licenced and
building of a good standard
Encouraging visitors to the Derbyshire Dalesto spend more money at local businesses
Creating and sustaining localemployment and business opportunities
Improving recycling andcomposting for household waste
Providing public toilets for visitorsto our towns and villages
Continuing to support local marketsincluding Farmers' Markets
Improving the supply ofaffordable, decent housing
Supporting community / voluntary groups
Ensuring you know whatCouncil services are available to you
Employing staff to put on Matlock BathIlluminations and other special events in future
Importance Satisfaction
DERBYSHIRE DALES DISTRICT COUNCIL M·E·L RESEARCH
MEASUREMENT EVALUATION LEARNING: USING EVIDENCE TO SHAPE BETTER SERVICES Page 10
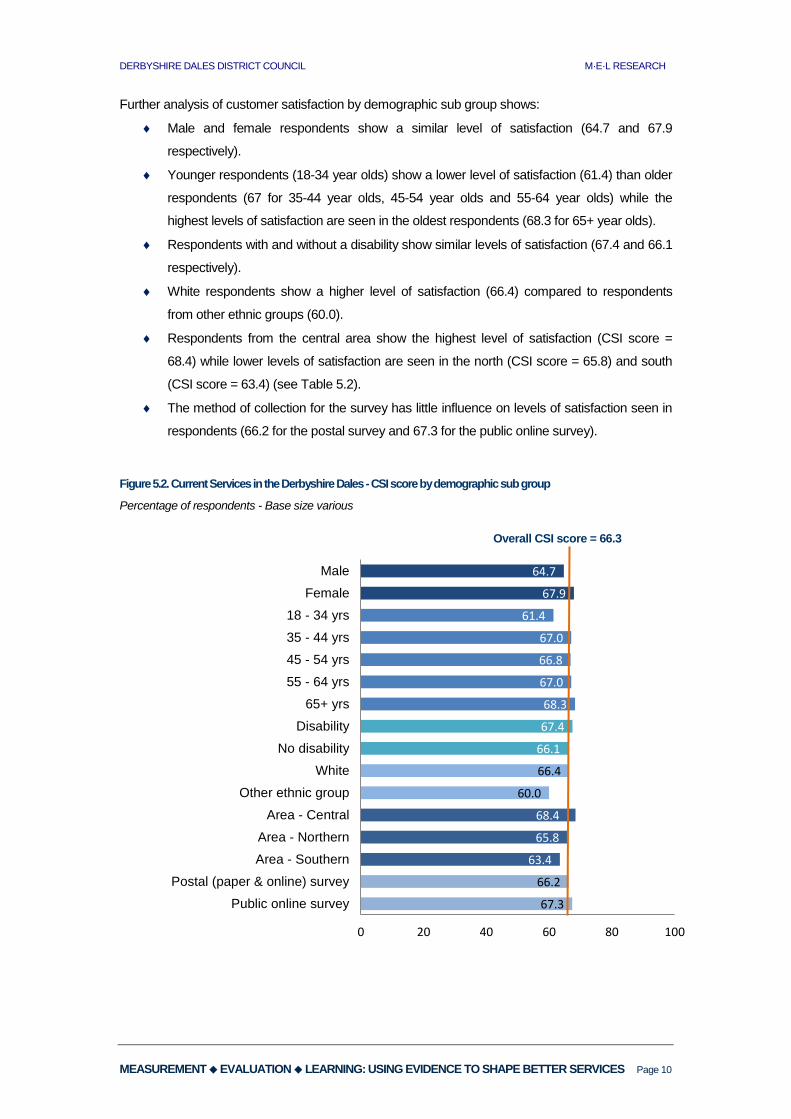
Further analysis of customer satisfaction by demographic sub group shows:
Male and female respondents show a similar level of satisfaction (64.7 and 67.9
respectively).
Younger respondents (18-34 year olds) show a lower level of satisfaction (61.4) than older
respondents (67 for 35-44 year olds, 45-54 year olds and 55-64 year olds) while the
highest levels of satisfaction are seen in the oldest respondents (68.3 for 65+ year olds).
Respondents with and without a disability show similar levels of satisfaction (67.4 and 66.1
respectively).
White respondents show a higher level of satisfaction (66.4) compared to respondents
from other ethnic groups (60.0).
Respondents from the central area show the highest level of satisfaction (CSI score =
68.4) while lower levels of satisfaction are seen in the north (CSI score = 65.8) and south
(CSI score = 63.4) (see Table 5.2).
The method of collection for the survey has little influence on levels of satisfaction seen in
respondents (66.2 for the postal survey and 67.3 for the public online survey).
Figure 5.2. Current Services in the Derbyshire Dales - CSI score by demographic sub group
Percentage of respondents - Base size various
67.3
66.2
63.4
65.8
68.4
60.0
66.4
66.1
67.4
68.3
67.0
66.8
67.0
61.4
67.9
64.7
0 20 40 60 80 100
Public online survey
Postal (paper & online) survey
Area - Southern
Area - Northern
Area - Central
Other ethnic group
White
No disability
Disability
65+ yrs
55 - 64 yrs
45 - 54 yrs
35 - 44 yrs
18 - 34 yrs
Female
Male
Overall CSI score = 66.3

DERBYSHIRE DALES DISTRICT COUNCIL M·E·L RESEARCH
MEASUREMENT EVALUATION LEARNING: USING EVIDENCE TO SHAPE BETTER SERVICES Page 11
Current Services by geographic area
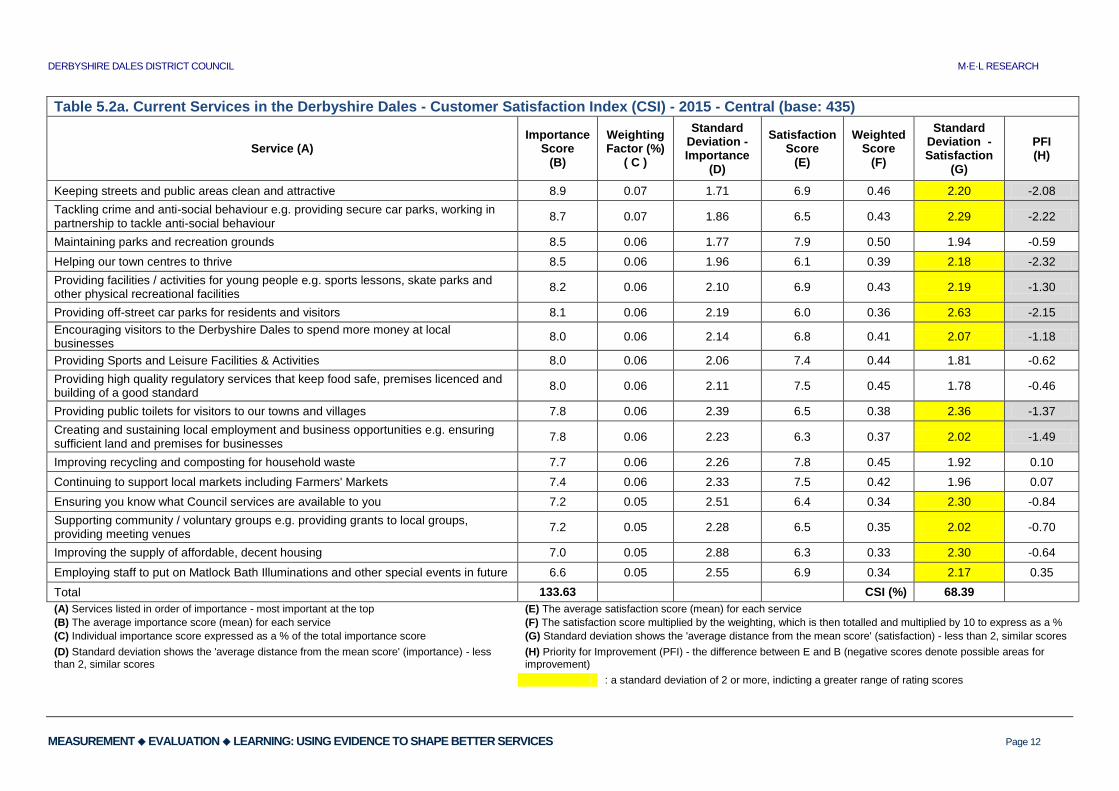
As mentioned previously, respondents from the central area show the highest level of satisfaction
(CSI score = 68.4) while lower levels of satisfaction are seen in the north (CSI score = 65.8) and
south (CSI score = 63.4) (see Table 5.2).
Analysis of the importance means for services finds that ‘Keeping streets and public areas clean
and attractive’ ranks as the most important service for all three areas (north =9.0, central and south
both = 8.9). Indeed, the same services are rated as important across the three areas, for example
‘Tackling crime and anti-social behaviour’ ranks second for the central and north areas, and third for
the south area. Similarly, ‘Maintaining parks and recreation grounds’ ranks third for central and
north areas and fourth for the south area.
For the central area, the services ‘Improving recycling and composting for household waste,’
‘Continuing to support local markets including Farmers' Markets,’ and ‘Employing staff to put on
Matlock Bath Illuminations and other special events in future’ all have positive PFI values. All other
services have negative PFI values and therefore show a negative gap between how important the
service is to respondents and the satisfaction they have with the service. For the north and south
areas, all services (excluding ‘Employing staff to put on Matlock Bath Illuminations and other
special events in future’) have negative PFI values. The large number of services with negative PFI
values means that levels of satisfaction could be improved for the vast majority services in all
geographic areas. A visual representation of the gaps between importance and satisfaction for
each service in each area can be seen in Figure 5.3.
DERBYSHIRE DALES DISTRICT COUNCIL M·E·L RESEARCH
MEASUREMENT EVALUATION LEARNING: USING EVIDENCE TO SHAPE BETTER SERVICES Page 12
Table 5.2a. Current Services in the Derbyshire Dales - Customer Satisfaction Index (CSI) - 2015 - Central (base: 435)
Service (A) Importance
Score (B)
Weighting Factor (%)
( C )
Standard Deviation - Importance
(D)
Satisfaction Score
(E)
Weighted Score
(F)
Standard Deviation - Satisfaction
(G)
PFI (H)
Keeping streets and public areas clean and attractive 8.9 0.07 1.71 6.9 0.46 2.20 -2.08
Tackling crime and anti-social behaviour e.g. providing secure car parks, working in partnership to tackle anti-social behaviour
8.7 0.07 1.86 6.5 0.43 2.29 -2.22
Maintaining parks and recreation grounds 8.5 0.06 1.77 7.9 0.50 1.94 -0.59
Helping our town centres to thrive 8.5 0.06 1.96 6.1 0.39 2.18 -2.32
Providing facilities / activities for young people e.g. sports lessons, skate parks and other physical recreational facilities
8.2 0.06 2.10 6.9 0.43 2.19 -1.30
Providing off-street car parks for residents and visitors 8.1 0.06 2.19 6.0 0.36 2.63 -2.15
Encouraging visitors to the Derbyshire Dales to spend more money at local businesses
8.0 0.06 2.14 6.8 0.41 2.07 -1.18
Providing Sports and Leisure Facilities & Activities 8.0 0.06 2.06 7.4 0.44 1.81 -0.62
Providing high quality regulatory services that keep food safe, premises licenced and building of a good standard
8.0 0.06 2.11 7.5 0.45 1.78 -0.46
Providing public toilets for visitors to our towns and villages 7.8 0.06 2.39 6.5 0.38 2.36 -1.37
Creating and sustaining local employment and business opportunities e.g. ensuring sufficient land and premises for businesses
7.8 0.06 2.23 6.3 0.37 2.02 -1.49
Improving recycling and composting for household waste 7.7 0.06 2.26 7.8 0.45 1.92 0.10
Continuing to support local markets including Farmers' Markets 7.4 0.06 2.33 7.5 0.42 1.96 0.07
Ensuring you know what Council services are available to you 7.2 0.05 2.51 6.4 0.34 2.30 -0.84
Supporting community / voluntary groups e.g. providing grants to local groups, providing meeting venues
7.2 0.05 2.28 6.5 0.35 2.02 -0.70
Improving the supply of affordable, decent housing 7.0 0.05 2.88 6.3 0.33 2.30 -0.64
Employing staff to put on Matlock Bath Illuminations and other special events in future 6.6 0.05 2.55 6.9 0.34 2.17 0.35
Total 133.63 CSI (%) 68.39
(A) Services listed in order of importance - most important at the top (E) The average satisfaction score (mean) for each service
(B) The average importance score (mean) for each service (F) The satisfaction score multiplied by the weighting, which is then totalled and multiplied by 10 to express as a %
(C) Individual importance score expressed as a % of the total importance score (G) Standard deviation shows the 'average distance from the mean score' (satisfaction) - less than 2, similar scores
(D) Standard deviation shows the 'average distance from the mean score' (importance) - less than 2, similar scores
(H) Priority for Improvement (PFI) - the difference between E and B (negative scores denote possible areas for improvement)
: a standard deviation of 2 or more, indicting a greater range of rating scores

DERBYSHIRE DALES DISTRICT COUNCIL M·E·L RESEARCH
MEASUREMENT EVALUATION LEARNING: USING EVIDENCE TO SHAPE BETTER SERVICES Page 13
Table 5.2b. Current Services in the Derbyshire Dales - Customer Satisfaction Index (CSI) - 2015 - North (base: 336)
Service (A) Importance
Score (B)
Weighting Factor (%)
( C )
Standard Deviation - Importance
(D)
Satisfaction Score
(E)
Weighted Score
(F)
Standard Deviation - Satisfaction
(G)
PFI (H)
Keeping streets and public areas clean and attractive 9.0 0.07 1.45 6.9 0.47 2.26 -2.12
Tackling crime and anti-social behaviour e.g. providing secure car parks, working in partnership to tackle anti-social behaviour
8.6 0.07 1.96 6.6 0.43 2.17 -1.97
Maintaining parks and recreation grounds 8.3 0.06 1.83 7.3 0.46 2.09 -0.99
Helping our town centres to thrive 8.3 0.06 2.00 6.2 0.39 2.11 -2.07
Creating and sustaining local employment and business opportunities e.g. ensuring sufficient land and premises for businesses
8.1 0.06 2.03 6.2 0.38 2.19 -1.89
Providing facilities / activities for young people e.g. sports lessons, skate parks and other physical recreational facilities
8.1 0.06 2.25 6.4 0.39 2.39 -1.70
Providing high quality regulatory services that keep food safe, premises licenced and building of a good standard
8.0 0.06 1.97 7.3 0.44 1.84 -0.64
Providing off-street car parks for residents and visitors 7.9 0.06 2.17 5.8 0.35 2.53 -2.08
Encouraging visitors to the Derbyshire Dales to spend more money at local businesses
7.9 0.06 2.10 6.8 0.41 2.06 -1.04
Improving recycling and composting for household waste 7.9 0.06 2.24 7.5 0.44 2.24 -0.40
Providing Sports and Leisure Facilities & Activities 7.9 0.06 2.02 6.7 0.40 2.31 -1.17
Improving the supply of affordable, decent housing 7.7 0.06 2.68 5.4 0.32 2.37 -2.22
Continuing to support local markets including Farmers' Markets 7.4 0.06 2.34 7.2 0.41 2.04 -0.19
Providing public toilets for visitors to our towns and villages 7.4 0.06 2.40 6.2 0.35 2.33 -1.17
Supporting community / voluntary groups e.g. providing grants to local groups, providing meeting venues
7.2 0.05 2.35 6.3 0.34 2.23 -0.89
Ensuring you know what Council services are available to you 6.9 0.05 2.48 6.3 0.33 2.20 -0.62
Employing staff to put on Matlock Bath Illuminations and other special events in future 5.5 0.04 2.82 6.5 0.27 2.33 1.04
Total 131.76 CSI (%) 65.77
(A) Services listed in order of importance - most important at the top (E) The average satisfaction score (mean) for each service
(B) The average importance score (mean) for each service (F) The satisfaction score multiplied by the weighting, which is then totalled and multiplied by 10 to express as a %
(C) Individual importance score expressed as a % of the total importance score (G) Standard deviation shows the 'average distance from the mean score' (satisfaction) - less than 2, similar scores
(D) Standard deviation shows the 'average distance from the mean score' (importance) - less than 2, similar scores
(H) Priority for Improvement (PFI) - the difference between E and B (negative scores denote possible areas for improvement)
: a standard deviation of 2 or more, indicting a greater range of rating scores

DERBYSHIRE DALES DISTRICT COUNCIL M·E·L RESEARCH
MEASUREMENT EVALUATION LEARNING: USING EVIDENCE TO SHAPE BETTER SERVICES Page 14
Table 5.2c. Current Services in the Derbyshire Dales - Customer Satisfaction Index (CSI) - 2015 - South (base: 311)
Service (A) Importance
Score (B)
Weighting Factor (%)
( C )
Standard Deviation - Importance
(D)
Satisfaction Score
(E)
Weighted Score
(F)
Standard Deviation - Satisfaction
(G)
PFI (H)
Keeping streets and public areas clean and attractive 8.9 0.07 1.90 6.8 0.46 2.33 -2.04
Helping our town centres to thrive 8.7 0.07 2.01 5.6 0.37 2.53 -3.13
Tackling crime and anti-social behaviour e.g. providing secure car parks, working in partnership to tackle anti-social behaviour
8.5 0.06 2.09 6.5 0.42 2.30 -1.99
Maintaining parks and recreation grounds 8.5 0.06 1.80 7.1 0.46 2.24 -1.39
Providing Sports and Leisure Facilities & Activities 8.2 0.06 2.10 7.0 0.43 2.02 -1.15
Providing off-street car parks for residents and visitors 8.2 0.06 2.21 5.4 0.33 2.60 -2.77
Encouraging visitors to the Derbyshire Dales to spend more money at local businesses
8.0 0.06 2.41 6.0 0.36 2.33 -1.99
Providing facilities / activities for young people e.g. sports lessons, skate parks and other physical recreational facilities
8.0 0.06 2.25 5.8 0.35 2.47 -2.14
Providing high quality regulatory services that keep food safe, premises licenced and building of a good standard
7.9 0.06 2.22 7.4 0.44 1.74 -0.47
Improving recycling and composting for household waste 7.8 0.06 2.40 7.6 0.45 2.13 -0.30
Providing public toilets for visitors to our towns and villages 7.8 0.06 2.60 5.4 0.32 2.78 -2.34
Creating and sustaining local employment and business opportunities e.g. ensuring sufficient land and premises for businesses
7.7 0.06 2.40 6.2 0.36 2.11 -1.50
Continuing to support local markets including Farmers' Markets 7.5 0.06 2.51 6.2 0.35 2.32 -1.36
Ensuring you know what Council services are available to you 7.1 0.05 2.42 6.3 0.34 2.27 -0.86
Supporting community / voluntary groups e.g. providing grants to local groups, providing meeting venues
7.0 0.05 2.53 6.2 0.33 2.09 -0.77
Improving the supply of affordable, decent housing 7.0 0.05 2.81 5.7 0.30 2.59 -1.32
Employing staff to put on Matlock Bath Illuminations and other special events in future 5.5 0.04 2.60 6.5 0.27 2.34 0.98
Total 132.24 CSI (%) 63.41
(A) Services listed in order of importance - most important at the top (E) The average satisfaction score (mean) for each service
(B) The average importance score (mean) for each service (F) The satisfaction score multiplied by the weighting, which is then totalled and multiplied by 10 to express as a %
(C) Individual importance score expressed as a % of the total importance score (G) Standard deviation shows the 'average distance from the mean score' (satisfaction) - less than 2, similar scores
(D) Standard deviation shows the 'average distance from the mean score' (importance) - less than 2, similar scores
(H) Priority for Improvement (PFI) - the difference between E and B (negative scores denote possible areas for improvement)
: a standard deviation of 2 or more, indicting a greater range of rating scores

DERBYSHIRE DALES DISTRICT COUNCIL M·E·L RESEARCH
MEASUREMENT EVALUATION LEARNING: USING EVIDENCE TO SHAPE BETTER SERVICES Page 15
Figure 5.3. Current services in the Derbyshire Dales - Comparison between importance mean and satisfaction mean
a) Central
NB. Services with a higher importance mean than satisfaction mean have a negative Priority for Improvement (PFI) value.
8.9
8.7
8.5
8.5
8.2
8.1
8.0
8.0
8.0
7.8
7.8
7.7
7.4
7.2
7.2
7.0
6.6
6.9
6.5
7.9
6.1
6.9
6.0
6.8
7.4
7.5
6.5
6.3
7.8
7.5
6.4
6.5
6.3
6.9
Keeping streets and publicareas clean and attractive
Tackling crime andanti-social behaviour
Maintaining parksand recreation grounds
Helping our town centresto thrive
Providing facilities / activitiesfor young people
Providing off-street car parksfor residents and visitors
Encouraging visitors to the DerbyshireDales to spend more money at local businesses
Providing Sports and Leisure Facilities & Activities
Providing high quality regulatory services that keepfood safe, premises licenced and building
of a good standard
Providing public toilets forvisitors to our towns and villages
Creating and sustaining localemployment and business opportunities
Improving recycling andcomposting for household waste
Continuing to support localmarkets including Farmers' Markets
Ensuring you know what Councilservices are available to you
Supporting community / voluntary groups
Improving the supply of affordable, decent housing
Employing staff to put on Matlock BathIlluminations and other special events in future
Importance Satisfaction

DERBYSHIRE DALES DISTRICT COUNCIL M·E·L RESEARCH
MEASUREMENT EVALUATION LEARNING: USING EVIDENCE TO SHAPE BETTER SERVICES Page 16
b) North
NB. Services with a higher importance mean than satisfaction mean have a negative Priority for Improvement (PFI) value.
9.0
8.6
8.3
8.3
8.1
8.1
8.0
7.9
7.9
7.9
7.9
7.7
7.4
7.4
7.2
6.9
5.5
6.9
6.6
7.3
6.2
6.2
6.4
7.3
5.8
6.8
7.5
6.7
5.4
7.2
6.2
6.3
6.3
6.5
Keeping streets and public areasclean and attractive
Tackling crime and anti-social behaviour
Maintaining parks and recreation grounds
Helping our town centres to thrive
Creating and sustaining localemployment and business opportunities
Providing facilities / activities for young people
Providing high quality regulatory servicesthat keep food safe, premises licenced
and building of a good standard
Providing off-street car parksfor residents and visitors
Encouraging visitors to the Derbyshire Dalesto spend more money at local businesses
Improving recycling and compostingfor household waste
Providing Sports and LeisureFacilities & Activities
Improving the supply of affordable,decent housing
Continuing to support local marketsincluding Farmers' Markets
Providing public toilets for visitorsto our towns and villages
Supporting community / voluntary groups
Ensuring you know what Councilservices are available to you
Employing staff to put on Matlock BathIlluminations and other special events in future
Importance Satisfaction

DERBYSHIRE DALES DISTRICT COUNCIL M·E·L RESEARCH
MEASUREMENT EVALUATION LEARNING: USING EVIDENCE TO SHAPE BETTER SERVICES Page 17
c) South
NB. Services with a higher importance mean than satisfaction mean have a negative Priority for Improvement (PFI) value.
8.9
8.7
8.5
8.5
8.2
8.2
8.0
8.0
7.9
7.8
7.8
7.7
7.5
7.1
7.0
7.0
5.5
6.8
5.6
6.5
7.1
7.0
5.4
6.0
5.8
7.4
7.6
5.4
6.2
6.2
6.3
6.2
5.7
6.5
Keeping streets and public areasclean and attractive
Helping our town centres to thrive
Tackling crime and anti-social behaviour
Maintaining parks and recreation grounds
Providing Sports and Leisure Facilities & Activities
Providing off-street car parksfor residents and visitors
Encouraging visitors to the Derbyshire Dalesto spend more money at local businesses
Providing facilities / activities for young people
Providing high quality regulatory servicesthat keep food safe, premises licenced
and building of a good standard
Improving recycling and compostingfor household waste
Providing public toilets for visitorsto our towns and villages
Creating and sustaining local employmentand business opportunities
Continuing to support local marketsincluding Farmers' Markets
Ensuring you know what Councilservices are available to you
Supporting community / voluntary groups
Improving the supply of affordable,decent housing
Employing staff to put on Matlock BathIlluminations and other special events in future
Importance Satisfaction

DERBYSHIRE DALES DISTRICT COUNCIL M·E·L RESEARCH
MEASUREMENT EVALUATION LEARNING: USING EVIDENCE TO SHAPE BETTER SERVICES Page 18
Respondent comments on future spending priorities
Respondents were asked if they had any other comments to make to help the District Council decide its
future spending priorities. 50% of respondents chose not to answer this question. Responses have been
coded and are ranked in Table 5.3 (where responses contained more than one theme each theme was
coded separately). Themes that account for less than 1% of responses have been grouped together as
‘other.’ A word cloud was constructed as a visual representation of resident responses. The size of each
word relates its frequency in responses, with larger words occurring more frequently than smaller words
(Figure 5.4).
The greatest number of responses (13%) relate to parking and include comments regarding: the need to
reduce car parking fees; parking costs are higher in Derbyshire Dales than other areas; car parks should
be free; the need for more parking spaces or car parks; parking restrictions need to be enforced. The
second greatest number of responses (7%) highlight the need for more affordable housing. In addition, a
large number of responses (5%) mention the need to improve traffic control and include comments
regarding: the need to reduce congestion; the need for more speed restriction measures; too many
lorries; need to restrict HGV access.
The large number of comments about parking, alongside the service of ‘Providing off-street car parks
for residents and visitors’ being the second highest priority for improvement based on CSI
calculations, suggests that this issue is very important to respondents in terms of future spending
priorities.
Figure 5.4. Word cloud of respondents comments on future spending priorities

DERBYSHIRE DALES DISTRICT COUNCIL M·E·L RESEARCH
MEASUREMENT EVALUATION LEARNING: USING EVIDENCE TO SHAPE BETTER SERVICES Page 19
Table 5.3. Respondent comments on future spending priorities
Comment Count (%)
Other 165 19%
Reduce car parking fees / Parking costs are higher in Derbyshire Dales than other areas / Car parks should be free / need more parking spaces or car parks / Need to enforce parking restrictions
116 13%
Need for more affordable housing 57 7%
Improve traffic control / Reduce congestion / Need more speed restriction measures / Too many lorries / Restrict HGV access
43 5%
Repair roads 31 4%
More public toilets / Cleaner public toilets / Improve public toilets / Open public toilets in winter / Longer opening hours for public toilets
30 3%
Keep streets clean 28 3%
Keep and improve public transport, especially to and from rural areas 25 3%
Support and attract local and smaller businesses 22 3%
Improve Planning Department / planning legislation 21 2%
Improve maintenance of verges, hedges and other vegetation 21 2%
Don't develop on greenfield sites 20 2%
More support / facilities / activities for young people 18 2%
Too much dog mess / Need more dog bins 18 2%
Sufficient gritting / snow clearing in bad weather 16 2%
Cut or freeze staff wages / Cut expenditure within council buildings / Reduce number of staff / Reorganise the council
14 2%
Fewer charity shops 14 2%
Focus on local residents 13 1%
Improve / Better park facilities and play areas for local children 13 1%
Too much litter / Too much fly-tipping / Need more litter bins 13 1%
Happy 12 1%
Improve and repair pavements and footpaths / pavements and footpaths in poor condition 12 1%
Need a bypass 11 1%
Keep libraries / Keep mobile library service 11 1%
Need to have / re-open local post office and/or local shop 10 1%
More housing for older people 9 1%
More shops / Better quality shops 9 1%
Attract and encourage more visitors 8 1%
More activities / facilities support for older people 8 1%
More police 8 1%
More support / facilities / activities / access for disabled people 8 1%
Don't waste money on surveys 7 1%
No inappropriate housing developments / No to low cost housing / No more housing estates / Less social housing
7 1%
Listen to public opinion / Ask for residents' views / Pay attention to more rural communities 6 1%
Merge with other councils 6 1%
Reduce business rates 6 1%
Advertise better / Promote local events 5 1%
Better / more / improve leisure facilities 5 1%
Develop town centres / Main Street / village centre 5 1%
Encourage more recycling / More recycling facilities / Improve recycling facilities 5 1%
Improve local facilities 5 1%
Fewer holiday and second homes / Increase council tax for holiday and second homes 5 1%
Refuse collection crew need to take more care / return bins to correct houses 5 1%
Responses 871 100%
Respondents 615
* Multi-coded answer

DERBYSHIRE DALES DISTRICT COUNCIL M·E·L RESEARCH
MEASUREMENT EVALUATION LEARNING: USING EVIDENCE TO SHAPE BETTER SERVICES Page 20
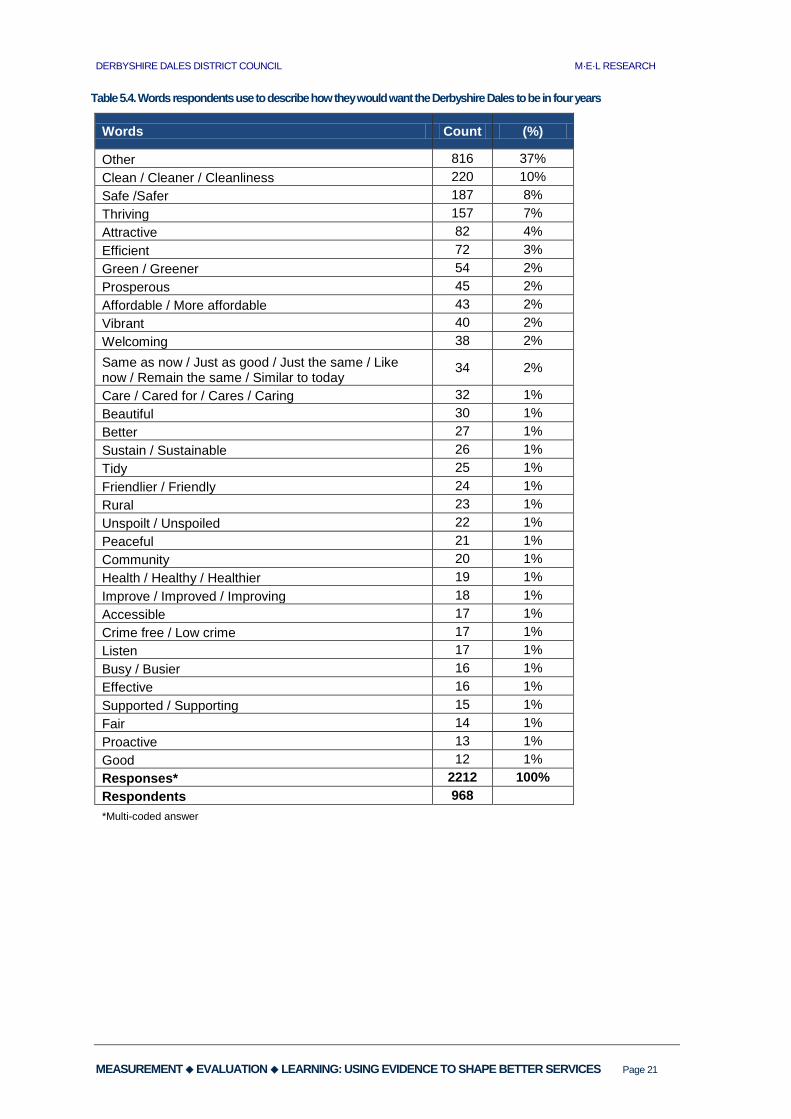
The Derbyshire Dales in four years
Respondents were asked what three words they would use to describe how they would want the
Derbyshire Dales to be in four years. 21% of respondents chose not to answer this question. Some
respondents chose to give between one and three separate words, while others gave a three-word
phrase. Single words and phrases were coded and ranked in Table 5.4. Words or phrases that account
for less than 1% of responses have been grouped together as ‘other.’ A word cloud was constructed as a
visual representation of resident responses. The size of each word relates its frequency in responses,
with larger words occurring more frequently than smaller words (Figure 5.5).
The top three words provided by respondents are:
Clean / Cleaner / Cleanliness
Safe / Safer
Thriving
Interestingly, these words match the three most important services to respondents in making the
Derbyshire Dales a good place to live based on the importance scores in the CSI calculations:
‘Keeping streets and public areas clean and attractive,’ ‘tackling crime and anti-social behaviour
e.g. providing secure car parks, working in partnership to tackle anti-social behaviour’ (thereby
making it safer) and ‘Helping our town centres to thrive.’ This confirms the importance of these
services to respondents in terms of future spending priorities.
Figure 5.5. Word cloud of responses to what three words would you use to describe how you would want the Derbyshire Dales to be in four years
DERBYSHIRE DALES DISTRICT COUNCIL M·E·L RESEARCH
MEASUREMENT EVALUATION LEARNING: USING EVIDENCE TO SHAPE BETTER SERVICES Page 21
Table 5.4. Words respondents use to describe how they would want the Derbyshire Dales to be in four years
Words Count (%)
Other 816 37%
Clean / Cleaner / Cleanliness 220 10%
Safe /Safer 187 8%
Thriving 157 7%
Attractive 82 4%
Efficient 72 3%
Green / Greener 54 2%
Prosperous 45 2%
Affordable / More affordable 43 2%
Vibrant 40 2%
Welcoming 38 2%
Same as now / Just as good / Just the same / Like now / Remain the same / Similar to today
34 2%
Care / Cared for / Cares / Caring 32 1%
Beautiful 30 1%
Better 27 1%
Sustain / Sustainable 26 1%
Tidy 25 1%
Friendlier / Friendly 24 1%
Rural 23 1%
Unspoilt / Unspoiled 22 1%
Peaceful 21 1%
Community 20 1%
Health / Healthy / Healthier 19 1%
Improve / Improved / Improving 18 1%
Accessible 17 1%
Crime free / Low crime 17 1%
Listen 17 1%
Busy / Busier 16 1%
Effective 16 1%
Supported / Supporting 15 1%
Fair 14 1%
Proactive 13 1%
Good 12 1%
Responses* 2212 100%
Respondents 968
*Multi-coded answer

DERBYSHIRE DALES DISTRICT COUNCIL M·E·L RESEARCH
MEASUREMENT EVALUATION LEARNING: USING EVIDENCE TO SHAPE BETTER SERVICES Page 22
6. Opinions about your local area
Respondents were asked a number of questions about their local area. For the purpose of the survey a
resident’s local area is classed as “the area within 15 – 20 minutes walking distance from your home.”
Your local area as a place to live
Respondents were asked how satisfied or dissatisfied they are with their local area as a place to live.
The majority of respondents are fairly or very satisfied (85%) and just 8% are fairly or very dissatisfied.
Figure 6.1. Levels of satisfaction with the local area as a place to live
Percentage of respondents – base size 1216 (‘Don’t know’ responses have been removed)
Further analysis by demographic sub group shows:
There is little difference in the percentage of male and female respondents who are fairly or
very satisfied (85% and 86% respectively).
There is no significant difference between levels of satisfaction across the age groups.
A significantly higher proportion of respondents with no disability are very or fairly satisfied
(87%) compared to those with a disability (72%).
100% of respondents from other ethnic groups are fairly or very satisfied. This drops to 85%
for White respondents, however the base size for other ethnic groups is too small to test
whether this difference is significant.
A significantly higher proportion of respondents from the northern area are fairly or very
satisfied (89%) compared to residents from the southern area (80%)
A higher proportion of respondents who answered the online public survey are very or fairly
satisfied (89%) compared to those who answered the postal (paper and online) survey
(85%), although this is not a significant difference.
41%
44%
6%
5%
3%
Very satisfied
Fairly satisfied
Neither satisfiednor dissatisfied
Fairly dissatisfied
Very dissatisified
85% Satisfaction

DERBYSHIRE DALES DISTRICT COUNCIL M·E·L RESEARCH
MEASUREMENT EVALUATION LEARNING: USING EVIDENCE TO SHAPE BETTER SERVICES Page 23
Figure 6.2. Satisfaction (fairly / very satisfied) with the local area as a place to live by demographic sub group
Percentage of respondents – base sizes in parentheses (‘Don’t know’ responses have been removed)
89%
85%
80%
89%
84%
100%
85%
87%
72%
85%
83%
86%
90%
83%
86%
85%
0% 20% 40% 60% 80% 100%
Public online survey (143)
Postal (paper & online) survey (1072)
Area - Southern (308)
Area - Northern (335)
Area - Central (429)
Other ethnic group (11)
White (1193)
No disability (1044)
Disability (145)
65+ yrs (334)
55 - 64 yrs (236)
45 - 54 yrs (241)
35 - 44 yrs (193)
18 - 34 yrs (212)
Female (623)
Male (592)
Overall satisfaction = 85%

DERBYSHIRE DALES DISTRICT COUNCIL M·E·L RESEARCH
MEASUREMENT EVALUATION LEARNING: USING EVIDENCE TO SHAPE BETTER SERVICES Page 24
Overall satisfaction
Respondents were asked how satisfied or dissatisfied they are overall with the way Derbyshire Dales
District Council runs things. The majority of respondents are fairly or very satisfied (65%) and just 12%
are fairly or very dissatisfied.
Figure 6.3. Levels of satisfaction with the way Derbyshire Dales District Council runs thing
Percentage of respondents – base size 1197 (‘Don’t know’ responses have been removed)
Further analysis by demographic sub group shows:
A significantly higher proportion of female respondents are fairly or very satisfied (69%)
compared to male respondents (61%).
A significantly lower percentage of 18-34 year olds are fairly or very satisfied (50%)
compared to all other age groups. Respondents in the 65+ year olds age group show the
highest levels of satisfaction (74%).
A higher proportion of respondents with no disability are very or fairly satisfied (66%)
compared to those with a disability (61%), however this difference is not significant.
A higher proportion of White respondents are fairly or very satisfied (66%) compared to
respondents from other ethnic groups (47%), however the base size for other ethnic groups
is too small to test whether this difference is significant.
Although respondents from the northern area show a higher level of satisfaction (69% fairly
or very satisfied) it is not significantly different from satisfaction levels in the central and
southern areas (both 62%).
A significantly higher proportion of respondents who answered the online public survey are
very or fairly satisfied (76%) compared to those who answered the postal (paper and online)
survey (64%).
10%
55%
22%
10%
2%
Very satisfied
Fairly satisfied
Neither satisfiednor dissatisfied
Fairly dissatisfied
Very dissatisified
65% Satisfaction

DERBYSHIRE DALES DISTRICT COUNCIL M·E·L RESEARCH
MEASUREMENT EVALUATION LEARNING: USING EVIDENCE TO SHAPE BETTER SERVICES Page 25
Figure 6.4. Satisfaction (fairly / very satisfied) with the way Derbyshire Dales District Council runs thing by demographic sub group
Percentage of respondents – base sizes in parentheses (‘Don’t know’ responses have been removed)
76%
64%
62%
69%
62%
47%
66%
66%
61%
74%
68%
63%
66%
50%
69%
61%
0% 20% 40% 60% 80% 100%
Public online survey (140)
Postal (paper & online) survey (1058)
Area - Southern (297)
Area - Northern (333)
Area - Central (427)
Other ethnic group (11)
White (1174)
No disability (1031)
Disability (140)
65+ yrs (330)
55 - 64 yrs (237)
45 - 54 yrs (233)
35 - 44 yrs (193)
18 - 34 yrs (204)
Female (616)
Male (582)
Overall satisfaction = 65%

DERBYSHIRE DALES DISTRICT COUNCIL M·E·L RESEARCH
MEASUREMENT EVALUATION LEARNING: USING EVIDENCE TO SHAPE BETTER SERVICES Page 26
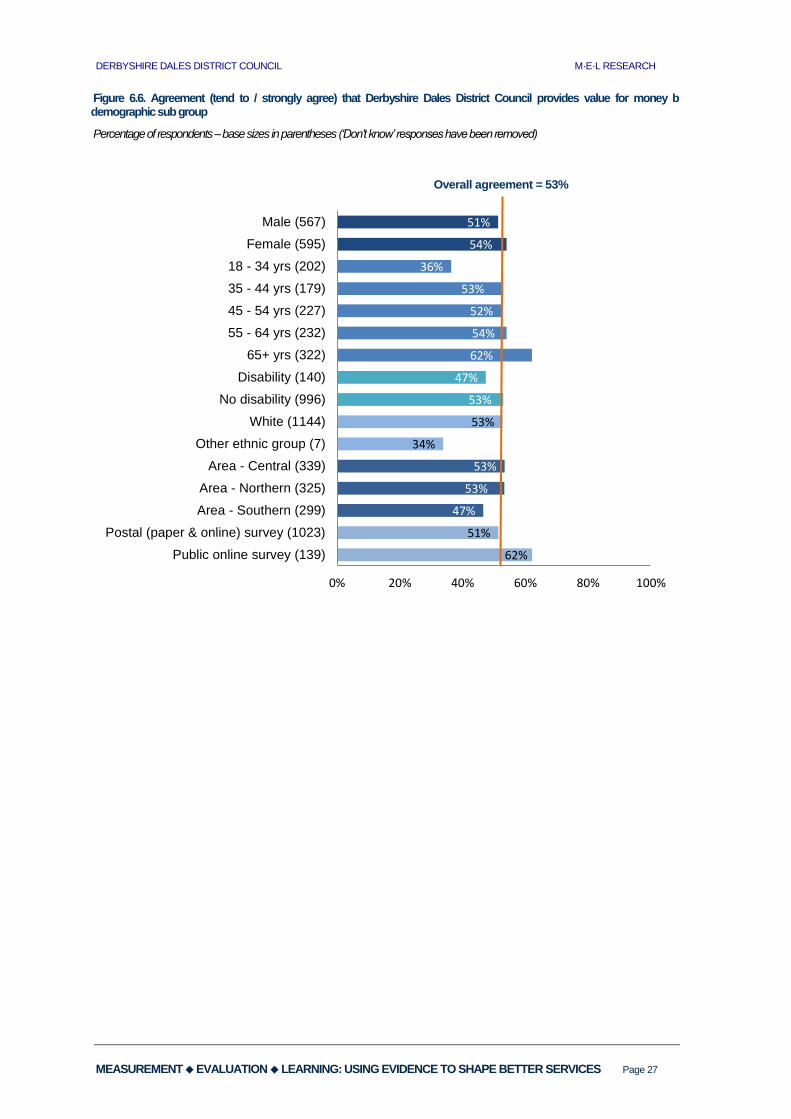
Value for money
Residents were asked to what extent they agree or disagree that Derbyshire Dales District Council
provides value for money. Just over half of respondents tend to or strongly agree (53%). A further 29%
neither agree nor disagree and 18% tend to or strongly disagree.
Figure 6.5. Levels of agreement that Derbyshire Dales District Council provides value for money
Percentage of respondents – base size 1162 (‘Don’t know’ responses have been removed)
Further analysis by demographic sub group shows:
There is little difference between the levels of agreement of male and female respondents (51%
and 54% respectively).
A significantly lower percentage of 18-34 year olds tend to or strongly agree (36%) compared to
all other age groups. Respondents in the 65+ year olds age group show the highest levels of
agreement (62%).
There no significant difference between the levels of agreement of respondents with a disability
(47%) and without a disability (53%).
While around half of White respondents tend to or strongly agree (53%) only around a third of
respondents from other ethnic groups (34%) think this, however the base size for other ethnic
groups is too small to test whether this difference is significant.
Significantly higher proportions of respondents from central and northern areas tend to or
strongly agree (both 53%) compared to respondents from the southern area (47%).
A significantly higher proportion of respondents who answered the online public survey tend to
or strongly agree (62%) compared to those who answered the postal (paper and online) survey
(51%).
7%
46%
29%
15%
3%
Strongly agree
Tend to agree
Neither agree nordisagree
Tend to disagree
Strongly disagree
53% Agreement
DERBYSHIRE DALES DISTRICT COUNCIL M·E·L RESEARCH
MEASUREMENT EVALUATION LEARNING: USING EVIDENCE TO SHAPE BETTER SERVICES Page 27
Figure 6.6. Agreement (tend to / strongly agree) that Derbyshire Dales District Council provides value for money b demographic sub group
Percentage of respondents – base sizes in parentheses (‘Don’t know’ responses have been removed)
62%
51%
47%
53%
53%
34%
53%
53%
47%
62%
54%
52%
53%
36%
54%
51%
0% 20% 40% 60% 80% 100%
Public online survey (139)
Postal (paper & online) survey (1023)
Area - Southern (299)
Area - Northern (325)
Area - Central (339)
Other ethnic group (7)
White (1144)
No disability (996)
Disability (140)
65+ yrs (322)
55 - 64 yrs (232)
45 - 54 yrs (227)
35 - 44 yrs (179)
18 - 34 yrs (202)
Female (595)
Male (567)
Overall agreement = 53%
DERBYSHIRE DALES DISTRICT COUNCIL M·E·L RESEARCH
MEASUREMENT EVALUATION LEARNING: USING EVIDENCE TO SHAPE BETTER SERVICES Page 28
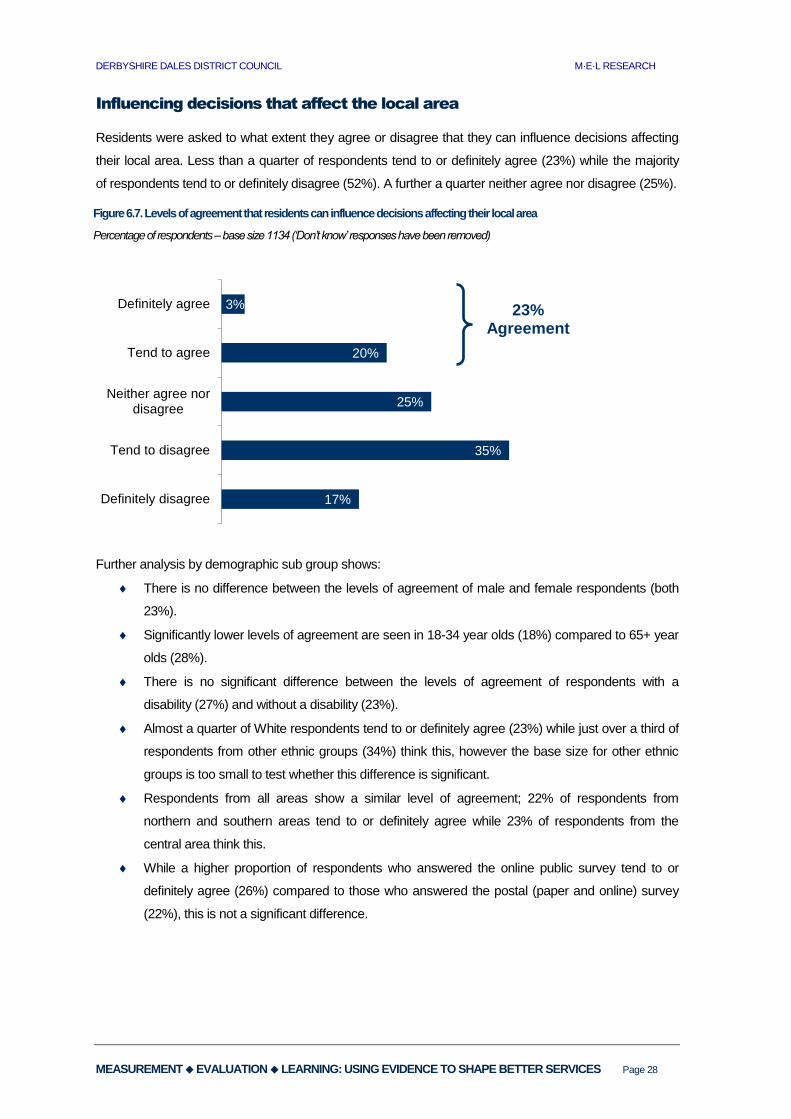
Influencing decisions that affect the local area
Residents were asked to what extent they agree or disagree that they can influence decisions affecting
their local area. Less than a quarter of respondents tend to or definitely agree (23%) while the majority
of respondents tend to or definitely disagree (52%). A further a quarter neither agree nor disagree (25%).
Figure 6.7. Levels of agreement that residents can influence decisions affecting their local area
Percentage of respondents – base size 1134 (‘Don’t know’ responses have been removed)
Further analysis by demographic sub group shows:
There is no difference between the levels of agreement of male and female respondents (both
23%).
Significantly lower levels of agreement are seen in 18-34 year olds (18%) compared to 65+ year
olds (28%).
There is no significant difference between the levels of agreement of respondents with a
disability (27%) and without a disability (23%).
Almost a quarter of White respondents tend to or definitely agree (23%) while just over a third of
respondents from other ethnic groups (34%) think this, however the base size for other ethnic
groups is too small to test whether this difference is significant.
Respondents from all areas show a similar level of agreement; 22% of respondents from
northern and southern areas tend to or definitely agree while 23% of respondents from the
central area think this.
While a higher proportion of respondents who answered the online public survey tend to or
definitely agree (26%) compared to those who answered the postal (paper and online) survey
(22%), this is not a significant difference.
3%
20%
25%
35%
17%
Definitely agree
Tend to agree
Neither agree nordisagree
Tend to disagree
Definitely disagree
23% Agreement

DERBYSHIRE DALES DISTRICT COUNCIL M·E·L RESEARCH
MEASUREMENT EVALUATION LEARNING: USING EVIDENCE TO SHAPE BETTER SERVICES Page 29
Figure 6.8. Agreement (tend to / definitely agree) that residents can influence decisions affecting their local area by demographic sub group
Percentage of respondents– base sizes in parentheses (‘Don’t know’ responses have been removed)
26%
22%
22%
22%
23%
34%
23%
23%
27%
28%
24%
21%
20%
18%
23%
23%
0% 20% 40% 60% 80% 100%
Public online survey (137)
Postal (paper & online) survey (997)
Area - Southern (298)
Area - Northern (303)
Area - Central (395)
Other ethnic group (7)
White (1116)
No disability (981)
Disability (128)
65+ yrs (309)
55 - 64 yrs (228)
45 - 54 yrs (228)
35 - 44 yrs (184)
18 - 34 yrs (185)
Female (586)
Male (548)
Overall agreement = 23%

DERBYSHIRE DALES DISTRICT COUNCIL M·E·L RESEARCH
MEASUREMENT EVALUATION LEARNING: USING EVIDENCE TO SHAPE BETTER SERVICES Page 30
7. Appendices
DERBYSHIRE DALES DISTRICT COUNCIL M·E·L RESEARCH
MEASUREMENT EVALUATION LEARNING: USING EVIDENCE TO SHAPE BETTER SERVICES Page 31
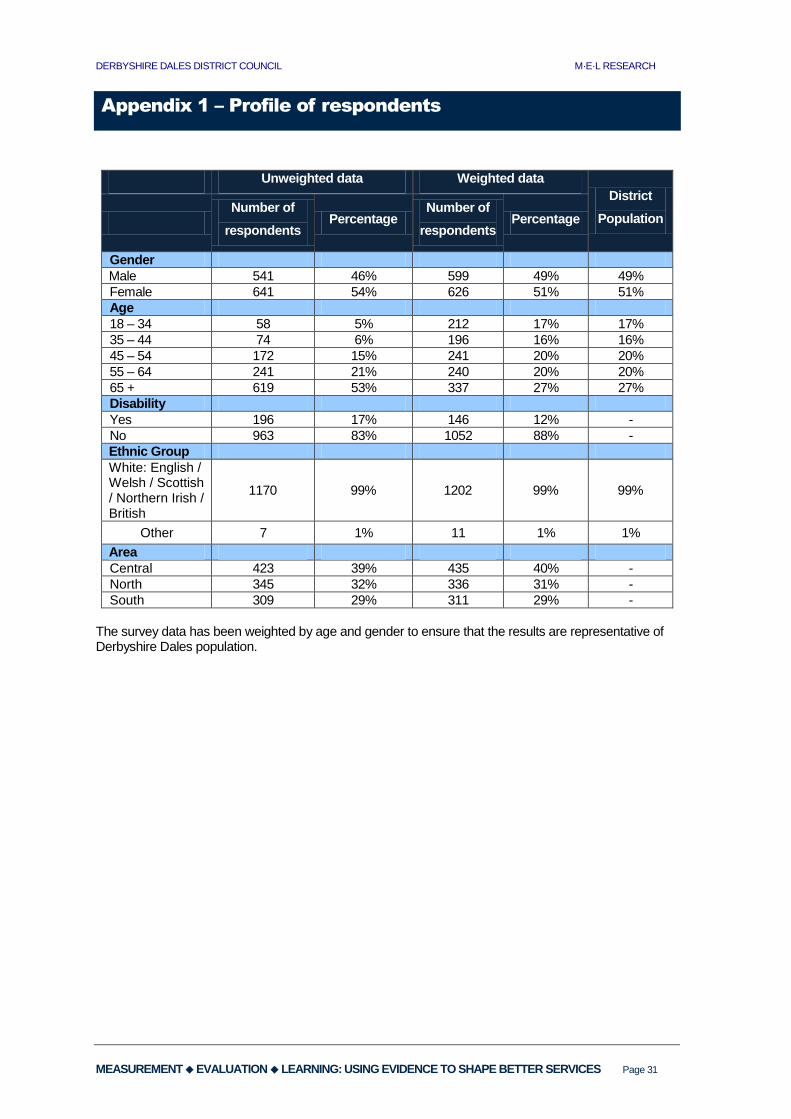
Appendix 1 – Profile of respondents
Unweighted data Weighted data
District
Population Number of
respondents Percentage
Number of
respondents Percentage
Gender
Male 541 46% 599 49% 49%
Female 641 54% 626 51% 51%
Age
18 – 34 58 5% 212 17% 17%
35 – 44 74 6% 196 16% 16%
45 – 54 172 15% 241 20% 20%
55 – 64 241 21% 240 20% 20%
65 + 619 53% 337 27% 27%
Disability
Yes 196 17% 146 12% -
No 963 83% 1052 88% -
Ethnic Group
White: English / Welsh / Scottish / Northern Irish / British
1170 99% 1202 99% 99%
Other 7 1% 11 1% 1%
Area
Central 423 39% 435 40% -
North 345 32% 336 31% -
South 309 29% 311 29% -
The survey data has been weighted by age and gender to ensure that the results are representative of Derbyshire Dales population.

DERBYSHIRE DALES DISTRICT COUNCIL M·E·L RESEARCH
MEASUREMENT EVALUATION LEARNING: USING EVIDENCE TO SHAPE BETTER SERVICES Page 32
Appendix 2 – Question response counts
Q1 & Q2: Services
Response Count *
Q1 (Importance)
Q2 (Satisfaction)
Providing high quality regulatory services that keep food safe, premises licenced and building of a good standard
1198 1021
Improving the supply of affordable, decent housing 1204 989
Providing public toilets for visitors to our towns and villages 1200 1135
Ensuring you know what Council services are available to you 1202 1103
Tackling crime and anti-social behaviour e.g. providing secure car parks, working in partnership to tackle anti-social behaviour
1189 1103
Creating and sustaining local employment and business opportunities e.g. ensuring sufficient land and premises for businesses
1192 962
Supporting community / voluntary groups e.g. providing grants to local groups, providing meeting venues
1196 930
Improving recycling and composting for household waste 1181 1144
Continuing to support local markets including Farmers' Markets 1187 1038
Providing facilities / activities for young people e.g. sports lessons, skate parks and other physical recreational facilities
1187 1064
Encouraging visitors to the Derbyshire Dales to spend more money at local businesses
1187 971
Keeping streets and public areas clean and attractive 1187 1173
Employing staff to put on Matlock Bath Illuminations and other special events in future
1178 793
Providing Sports and Leisure Facilities & Activities 1188 1106
Maintaining parks and recreation grounds 1187 1126
Providing off-street car parks for residents and visitors 1186 1099
Helping our town centres to thrive 1157 1012
None of these 5 23
* Response counts do not include ‘Don’t know’ responses.

DERBYSHIRE DALES DISTRICT COUNCIL M·E·L RESEARCH
MEASUREMENT EVALUATION LEARNING: USING EVIDENCE TO SHAPE BETTER SERVICES Page 33
Question Response
Count *
Q3. Are there any other comments you wish to make to help the District Council decide its future spending priorities?
615
Q4. What three words would you use to describe how you want the Derbyshire Dales to be in four years?
968
Q5. Overall, how satisfied or dissatisfied are you with your local area as a place to live?
1216
Q6. Overall, how satisfied or dissatisfied are you with the way Derbyshire Dales District Council runs things?
1197
Q7. To what extent do you agree or disagree that Derbyshire Dales District Council provides value for money?
1162
Q8. Do you agree or disagree that you can influence decisions affecting your local area?
1134
Q9. Are you interested in receiving up to 6 online questionnaire surveys a year from us, each taking a max of 10 minutes to complete?
1136
Q10. Gender 1225
Q11. Age 1225
Q12. Do you consider yourself to have a disability? 1198
Q13. What is your ethnic group? 1213
Q14. Postcode 1205
* Response counts do not include ‘Don’t know’ responses for Q5, Q6, Q7 and Q8. Response counts do not include ‘Prefer not to say’ responses for Q10 and Q12.

DERBYSHIRE DALES DISTRICT COUNCIL M·E·L RESEARCH
MEASUREMENT EVALUATION LEARNING: USING EVIDENCE TO SHAPE BETTER SERVICES Page 34
Appendix 3 – Cover letter
DERBYSHIRE DALES DISTRICT COUNCIL M·E·L RESEARCH
MEASUREMENT EVALUATION LEARNING: USING EVIDENCE TO SHAPE BETTER SERVICES Page 35
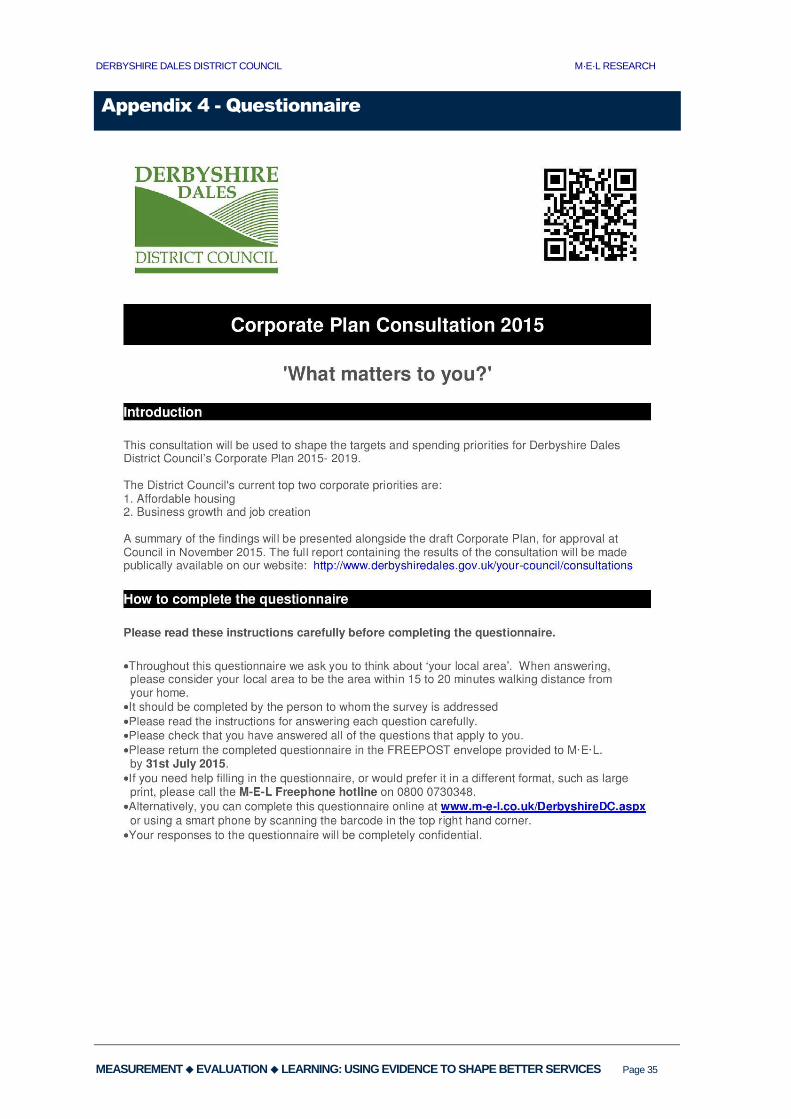
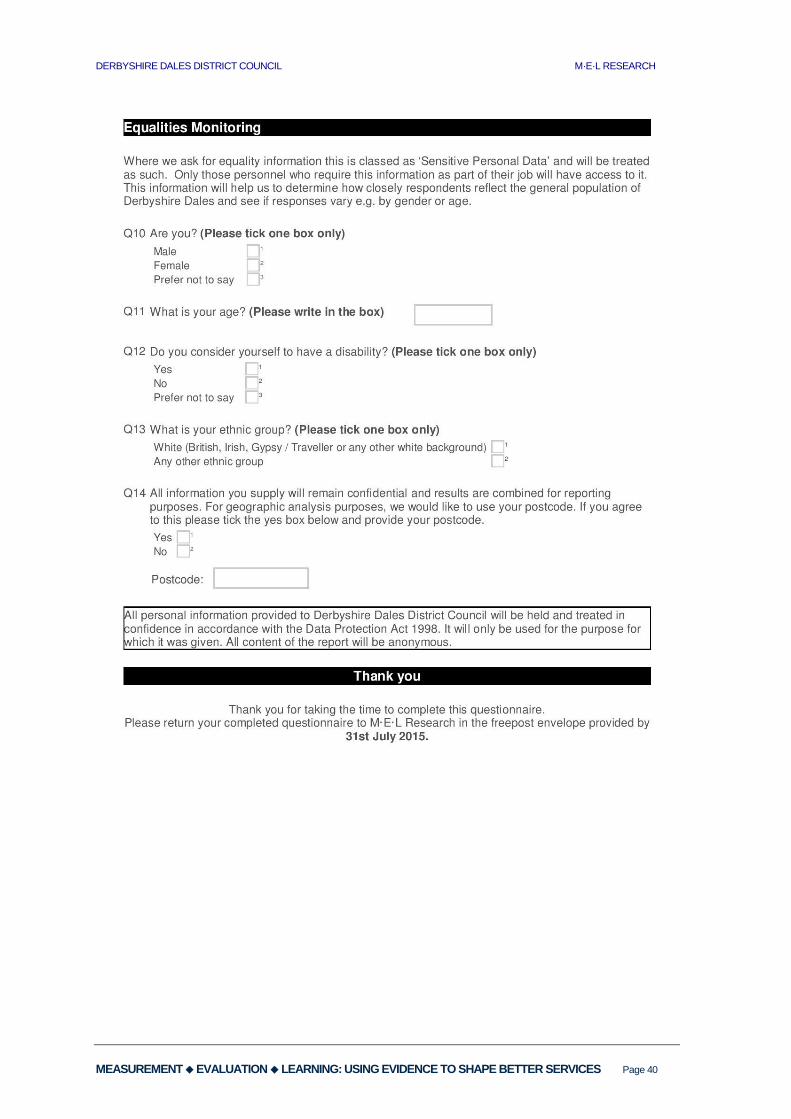
Appendix 4 - Questionnaire

DERBYSHIRE DALES DISTRICT COUNCIL M·E·L RESEARCH
MEASUREMENT EVALUATION LEARNING: USING EVIDENCE TO SHAPE BETTER SERVICES Page 36

DERBYSHIRE DALES DISTRICT COUNCIL M·E·L RESEARCH
MEASUREMENT EVALUATION LEARNING: USING EVIDENCE TO SHAPE BETTER SERVICES Page 37

DERBYSHIRE DALES DISTRICT COUNCIL M·E·L RESEARCH
MEASUREMENT EVALUATION LEARNING: USING EVIDENCE TO SHAPE BETTER SERVICES Page 38

DERBYSHIRE DALES DISTRICT COUNCIL M·E·L RESEARCH
MEASUREMENT EVALUATION LEARNING: USING EVIDENCE TO SHAPE BETTER SERVICES Page 39
DERBYSHIRE DALES DISTRICT COUNCIL M·E·L RESEARCH
MEASUREMENT EVALUATION LEARNING: USING EVIDENCE TO SHAPE BETTER SERVICES Page 40
DERBYSHIRE DALES DISTRICT COUNCIL M·E·L RESEARCH
MEASUREMENT EVALUATION LEARNING: USING EVIDENCE TO SHAPE BETTER SERVICES Page 9