Corporate information Financial overview - Sioen...
82
Corporate information Financial overview Strategy Growth Innovation People
Transcript of Corporate information Financial overview - Sioen...

Corporate informationFinancial overview
Strategy
Growth
Innovation
People

2 I SIOEN INDUSTRIES I Annual Report 2007
Contents
CORpORATE INfORmATION
I. Letter to the Shareholders 3II. Report of the Board of Directors 5III. Group Structure 9IV. Share Information 10V. Corporate Governance 12VI. General Information 16
fINANCIAL OVERVIEW
I. Comments on the consolidated financial statements 20II. financial statements 22II. 1. Consolidated Balance Sheet 22II. 2. Consolidated Income Statement 24II. 3. Cash flow Statement 26II. 4. Equity Statement 27
III. Notes to the consolidated financial statements 28III. 1. Key Accounting Rules 28III. 2. Segment Information 37III. 3. Exchange Rate 40III. 4. Detailed Income Statement 41III. 5. Detailed Balance Sheet 45IV. Other 69V. Statutory auditor’s report 73VI. Statutory annual accounts of Sioen Industries NV 75VII. proposal to the annual meeting 78Definitions 79Addresses 80
“Sioen is growing in every sense of the word. Reliability, comparability and relevance of our accounting figures are of utmost importance.
Geert Asselman, CfO

SIO
EN
IN
DU
ST
RIE
S
I A
nn
ua
l R
ep
ort
20
07
3
Letter to shareholders
Dear Shareholder,
If I were to summarize 2007 in a single word, it would
be ‘strong’. We performed on every front, and advanced
in every activity.
The figures speak for themselves:
• In 2007 our net sales amounted to EUR 380.3 million,
up 12.1% on the year before.
• Our net profit was EUR 19.2 million or an increase of
58%
• Cash flow amounted to EUR 43.5 million. This is an
increase of EUR 12 million compared to last year.
• EBITDA and EBIT increased with respectively 36% and
50% to EUR 61.2 million (16% of net sales) and EUR
38.8 million (10% of net sales).
• Sioen Industries is paying a dividend of EUR 0.45 per
share to its shareholders in respect of 2007 (+73%)
Of course we need to say more than this to do justice
to the past year. This annual report seeks to hold a
mirror to our group’s performance. You will find who we
are, our history, our products, what drives us and our
particular style of entrepreneurship.
“Strong growth, excellent results, new projects”
In 2007 the emphasis at Sioen was on strategy,
innovation, growth and people. Our action plan,
objectives and challenges are set out on pages 4 and 5
of this annual report.
2007 was in all aspects an exceptional year, in which the
old records came tumbling down one after another.
We achieved maximum returns in our spinning and
weaving mills, we passed for the first time the six million
square metre mark on our extrusion line, we operated
the direct coating lines at historically high speeds,
we restructured our Jakarta facility to give additional
cost and production efficiency, we produced record
numbers of truck curtain and roof sets, demand for
open structure fabrics was permanently high, and we
developed an unequalled number of new and improved
product formulations.
We also had to surmount a number of difficulties. The
whole year we had to cope with rising energy prices,

4 I SIOEN INDUSTRIES I Annual Report 2007
rising raw materials prices nor was it always easy to find
suitable personnel.
“Targeted entrepeneurship, stimulating a sense of belonging and sticking to our strategic course”
In every division we went forward with our improvement
programmes, improving production and cost efficiency
and fine-tuning our product formulations. We carefully
examined our stock situation and optimized at every
level. We successfully implemented SAp in the Industrial
Applications division, with the Coating and Chemicals
divisions set to follow in 2008.
“On the path to new records? In an Olympic year, can we do otherwise?”
We are keeping up the investment pace in 2008. This
includes:
• Belgium: · new buildings for storage
· new calendering line fully operational
· doubling our open structure fabric
capacity production
· additional pigment paste production
machinery
• France: · optimization of direct coating line
• Ukraine: · commissioning of production centre
(truck roofs)
• Worldwide: · continuous investments in R&D and
focus on technical products.
Sioen Industries’ performance in 2007 and in previous
years confirms our capacity to create long term value
and growth. And that is what you, our shareholders, and
we, entrepreneurs and all our employees, are looking
for.
michele Sioen
CEO Sioen Industries n.v.

SIO
EN
IN
DU
ST
RIE
S
I A
nn
ua
l R
ep
ort
20
07
5
Sioen Industries is the world market leader in technical
coated textiles, a market leader in industrial protective
clothing, a niche specialist in fine chemicals and a major
world player in processing technical textiles into semi-
finished goods and technical end products.
• The past year can be summarized in a few words:
consistent, high quality growth.
• SALES - In 2007 Sioen Industries posted group sales
of EUR 380.3 million (of which EUR 27.1 million from
newly acquired Siegwerk, Richard Colorants and fillink),
compared with EUR 339.4 million the year before
(+ 12.1% on an annual basis).
• GROSS mARGIN – With a combination of excellent
production efficiency, new products and product
compositions, new materials and price increases, the
group has been able to improve its profit margin.
• SERVICES AND OTHER GOODS – Costs of goods and
other services rose primarily under the influence of the
activities taken over by the chemicals division in 2006.
• pERSONNEL COSTS – The acquisitions in the chemicals
division and wage developments in poland are the main
reasons for higher personnel costs.
• OTHER OpERATING COSTS – Other operating costs
consist primarily of a number of non profit-related taxes
(property tax, taxe professionelle) which grow more
onerous by the year.
• EBITDA – Operating cash flow (EBITDA) rose from EUR 44.8
million in 2006 to EUR 61.2 million in 2007 (+ 36.4 %).
• fINANCIAL RESULT – At EUR -8.4 million, net financial
costs are EUR 1.8 million higher than in 2006. The
reasons lie in the net financial debt of EUR 146.0 million,
the continuing weakening of the pound sterling and the
constant revaluation of the polish currency.
• pROfIT – This brings the group to a pre-tax profit of EUR
30.4 million, 57.4 % higher than in 2006. Net profit
is EUR 19.2 million, compared with EUR 12.1 million in
2006 (+ 57.9 %).
• NET CASH fLOW – Net cash flow rose by EUR 12.0
million to EUR 43.5 million.
• DIVIDEND – In 2007 Sioen paid a dividend of EUR
0.26 gross per share in respect of 2006. The Board of
Directors will be proposing to the Annual meeting of
Shareholders that the company declare a dividend of
EUR 0.45 (gross) per share in respect of 2007.
Report of the Board of Directors

6 I SIOEN INDUSTRIES I Annual Report 2007
COATING DIVISION
The Coating Division specializes in the integrated
coating of technical textile, of which it masters the
entire production process from the extrusion of the
yarn (spinning), to weaving the technical fabric and to
coating with various polymers. The group is the only
player in the world with full proficiency in five different
coating techniques, each with its specific products and
applications:
• Direct coating
Booming activity in the transportation sector and the
related demand for trailers made 2007 a top year. for
the direct coating product line this gave attractive
growth figures in terms of both volume and sales, with
production facilities operating at near 100% capacity.
• Online coating
A strong 2006 was followed by another record year
in 2007. To meet demand for open structure fabrics
(reinforcement nets, windbreak nets, geotextiles) we
will be doubling our capacity in mid-2008 (building of
new production hall started at the end of 2007). With
the sharp rise in oil prices, our range of reinforcement
nets for pVC roof coverings are becoming a popular
alternative to bitumen.
• Transfer coating
Determined R&D efforts enabled us to bring new
technical products to market in 2007 (including car
parts, self-adhesive films, etc.)
• Extrusion coating
In 2007 we further improved our production process
and developed a number of new products and
compositions like oil dams, technical ventilation pipes,
soil decontamination fabric and pool covers.
• Calandering
In 2007 we began test production at our new plant
in moeskroen, where we can also produce pool liners
as well as our traditional products for the automobile
sector (films for dashboards and door panels, sun visors,
etc.). This line will be brought onstream as of 2008.
The coating division is fully vertically integrated, and the
spinning and weaving mills also ended 2007 with record
figures. The spinning mill processed 16,000 tonnes of
polyester chips into high tenacity yarns (around 1000
tonnes more than in 2006). At the weaving mills we
maximized profitability.
Despite historically high raw materials prices, the
Coating division was again able in 2007 to significantly
improve its operating cash flow and net result.
Additional R&D efforts, new products, continuous
production efficiency improvements and strong markets
are the main reasons for the excellent results.

SIO
EN
IN
DU
ST
RIE
S
I A
nn
ua
l R
ep
ort
20
07
7
AppAREL DIVISION
Thanks to its focus on more technically complex
products, the Apparel division has built up an
outstanding reputation. In 2007 the division again won
a number of major contracts for technical products:
• Our protective clothing niche product for people
working on and around water (mullion trade name)
undertook a number of major projects, including
survival suits for various customers.
• The highly technical market for bullet and knife-
resistance vests grew strongly.
• In its firefighting clothing product range Sioen
signed major contracts with a number of french
départements and with the Belgian firefighting service
(under the Vidal brand).
• With its range of specific protective clothing against
arc flames (Sioen Arc), we have concluded a number
of important contracts with energy suppliers.
Over the years, Sioen has acquired special technical
know-how in both design and production. On top of
this we have our own very high performance research
and development centre with the latest testing
equipment.
Our strategic focus on technical products, combined
with a very cost-efficient production apparatus, is
expressed in an operating cash flow of EUR 10.6 million
(+72.5 %), whilst our operating result has more than
doubled (+142.0 %).
CHEmICALS DIVISION
Given its size and importance, the chemicals activity has,
since 1 January 2007, formed a fourth division within
Sioen Industries.
During the past year the chemicals division
concentrated on integrating the companies taken over
at the end of 2006:
• We have reallocated our activities between our
production sites by core activity and competence.
In this way the solvent-based PVC and PU pastes are
now concentrated at the Bornem site (EmB), the
silicon pastes have been allocated to the Ath site
(Inducolor), whilst Richard Colorants (Lomme, france)
specializes in water-based pastes.
• In 2007 we decided to close the site in Lyon (Astra).
We put together a social plan for the employees and
transferred the products to other group facilities.
• The transfer of the customer base and production of
the former Siegwerk went ahead spotlessly.
• Under an exchange of facilities agreement, we are
taking over Clariant’s paste department in france,
while they are taking over our granulates department
and paying a balancing amount
• In 2008 we are introducing a new ERP package and
are completing the reorganization of logistic flows
within the business.

8 I SIOEN INDUSTRIES I Annual Report 2007
INDUSTRIAL AppLICATIONS DIVISION
OUTLOOK
The industrial applications division processes coated
fabrics and PVC film into a range of industrial items.
This division is organized by activity sector:
• Transport :
This sector produces trailer and container curtains and
tarpaulins and train tarpaulins. pressure in 2007 from
a number of internal and external factors (rising wage
costs in poland, revaluation of the polish złoty against
the euro, the introduction of a new ERp package and
price competition from small competitors) prevented full
benefit being taken of group synergy and the buoyant
market. The priority for 2008 is to improve production
and organizational efficiency.
• Non wovens :
In 2007 Sioen Nordifa developed new (unique) products
and brought a new production line into service. Goals
for 2008 are geographic expansion and extending the
product line.
• Manufacturing :
· Cutting of, among others, door panels, airbags, car
trunk covers (we have invested here in a new laser
cutting machine)
· CARAPAX (roof reinforcement for trailers) and
pROTECTOR (burglar alarm incorporated in tarpaulins)
were two innovative truck safety products we finished
developing in 2007.
· Welding of pool foils and dike foils
· Production of kadors (flexible tubes enclosed in coated
textile and used to attach fabrics to profiles).
Sioen is confident that it will continue to grow
consistently and in a quality manner in 2008.
SIO
EN
IN
DU
ST
RIE
S
I A
nn
ua
l R
ep
ort
20
07
9
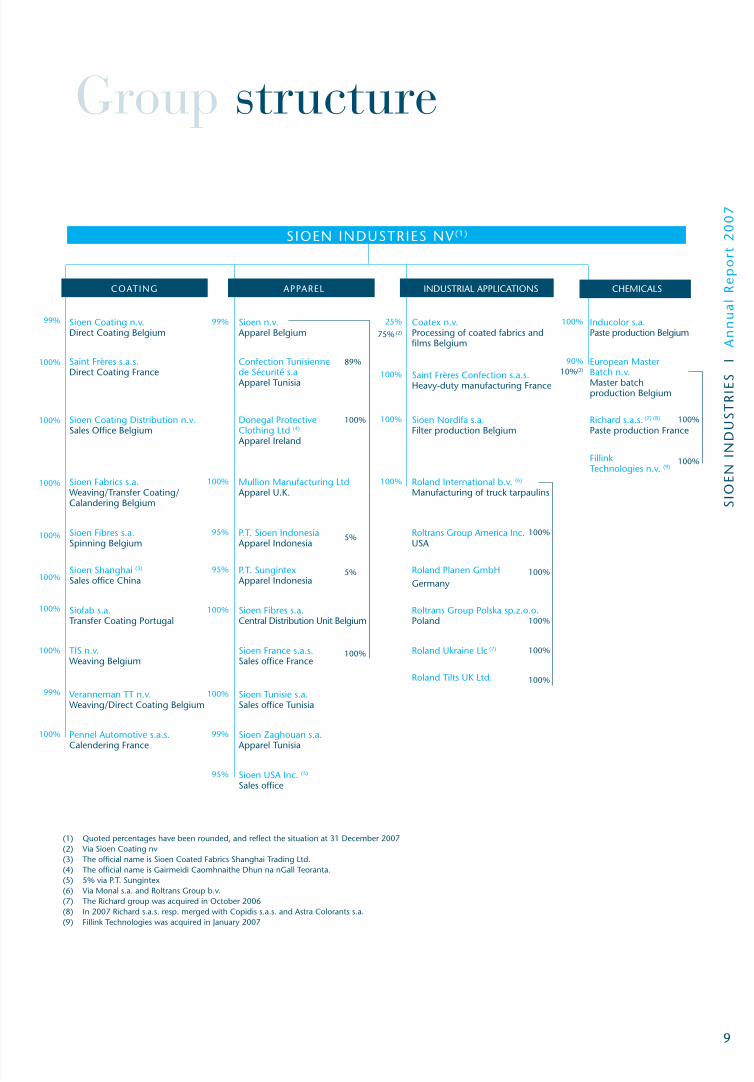
Group structure
(1) Quoted percentages have been rounded, and reflect the situation at 31 December 2007 (2) Via Sioen Coating nv(3) The official name is Sioen Coated Fabrics Shanghai Trading Ltd.(4) The official name is Gairmeidi Caomhnaithe Dhun na nGall Teoranta.(5) 5% via p.T. Sungintex (6) Via monal s.a. and Roltrans Group b.v. (7) The Richard group was acquired in October 2006 (8) In 2007 Richard s.a.s. resp. merged with Copidis s.a.s. and Astra Colorants s.a.(9) fillink Technologies was acquired in January 2007
S IOEN INDUSTRIES NV(1)
COATING AppAREL INDUSTRIAL AppLICATIONS CHEmICALS
Sioen Coating n.v.Direct Coating Belgium
99% Sioen n.v.Apparel Belgium
25% Coatex n.v. processing of coated fabrics andfilms Belgium
100% Inducolor s.a.paste production Belgium75% (2)
Saint frères s.a.s.Direct Coating france
Confection Tunisienne de Sécurité s.aApparel Tunisia
90%10%(2)
European master Batch n.v. master batch production Belgium
100% Saint frères Confection s.a.s.Heavy-duty manufacturing France
Sioen Coating Distribution n.v.Sales Office Belgium
Donegal protective Clothing Ltd (4) Apparel Ireland
100% Sioen Nordifa s.a.filter production Belgium
Richard s.a.s. (7) (8)
paste production france
fillink Technologies n.v. (9)
Sioen fabrics s.a. Weaving/Transfer Coating/Calandering Belgium
100% mullion manufacturing LtdApparel U.K.
100% Roland International b.v. (6)
manufacturing of truck tarpaulins
Sioen fibres s.a. Spinning Belgium
95% p.T. Sioen IndonesiaApparel Indonesia
Roltrans Group America Inc.USA
Sioen Shanghai (3)
Sales office China95% p.T. Sungintex
Apparel IndonesiaRoland planen GmbHGermany
Siofab s.a.Transfer Coating portugal
100% Sioen fibres s.a.Central Distribution Unit Belgium
Roltrans Group polska sp.z.o.o.poland
TIS n.v.Weaving Belgium
Sioen france s.a.s. Sales office France
Roland Ukraine Llc (7)
Roland Tilts UK Ltd.
Veranneman TT n.v.Weaving/Direct Coating Belgium
100% Sioen Tunisie s.a.Sales office Tunisia
pennel Automotive s.a.s.Calendering france
99% Sioen Zaghouan s.a.Apparel Tunisia
95% Sioen USA Inc. (5)
Sales office
99%
100%
100%
100%
100%
100%
100%
100%
99%
100%
89%
100%
5%
5%
100%
100%
100%
100%
100%
100%
100%
100%
10 I SIOEN INDUSTRIES I Annual Report 2007
Share information
Listing
In order to be able to continue following and ensuring
the company’s fast growth, and in the conviction that a
transparent policy would further strengthen the group’s
growth possibilities, the Sioen Industries share was
introduced on the cash market, double fixing, of the
Brussels Stock Exchange, on 18 October 1996.
A year later the share was listed on the semi-continuous
segment of the forward market and then, as of 11 march
1998, has been quoted on the continuous segment of
the Brussels forward market, which has since become
Euronext Brussels.
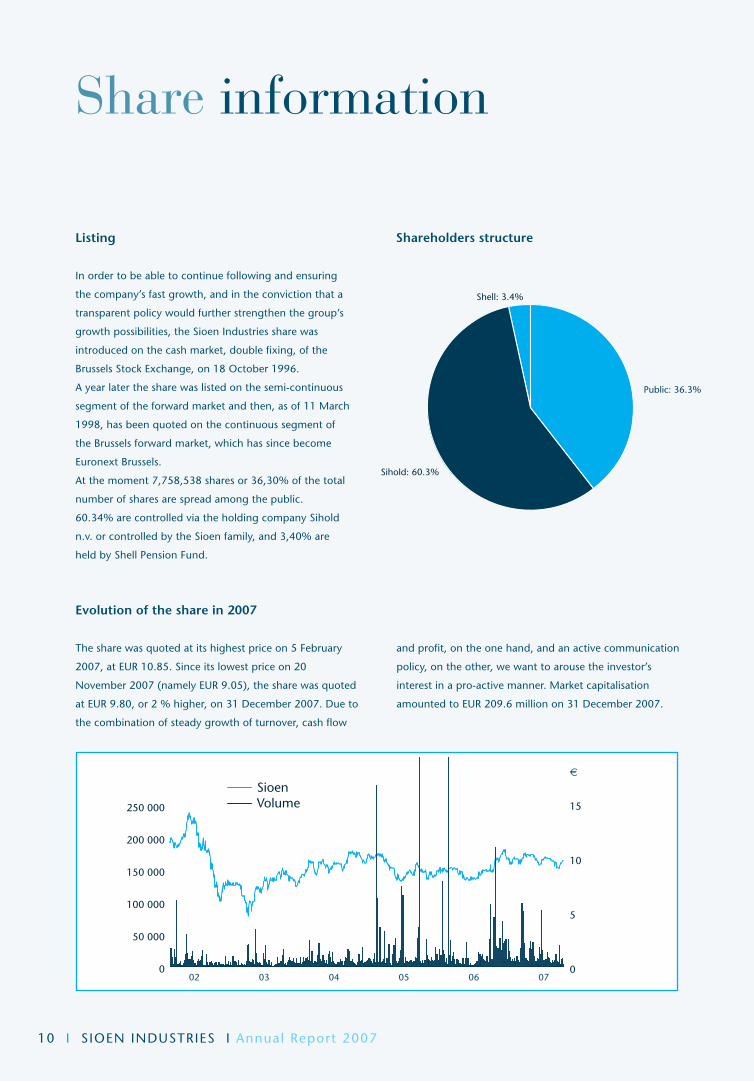
At the moment 7,758,538 shares or 36,30% of the total
number of shares are spread among the public.
60.34% are controlled via the holding company Sihold
n.v. or controlled by the Sioen family, and 3,40% are
held by Shell pension fund.
Evolution of the share in 2007
The share was quoted at its highest price on 5 february
2007, at EUR 10.85. Since its lowest price on 20
November 2007 (namely EUR 9.05), the share was quoted
at EUR 9.80, or 2 % higher, on 31 December 2007. Due to
the combination of steady growth of turnover, cash flow
and profit, on the one hand, and an active communication
policy, on the other, we want to arouse the investor’s
interest in a pro-active manner. Market capitalisation
amounted to EUR 209.6 million on 31 December 2007.
0
5
10
15
0
5
10
15
SioenEurostoxx50
SioenVolume
0
5
10
15
0
50 000
100 000
150 000
200 000
250 000
02 03 04 05 06 07
€
Public: 36.3%
Sihold: 60.3%
Shell: 3.4%
Shareholders structure

SIO
EN
IN
DU
ST
RIE
S
I A
nn
ua
l R
ep
ort
20
07
11
2007: financial communication policy
The Sioen Industries share was included on Euronext
Brussels in Compartment B (Mid-Caps).
Dividend policy
The Board of Directors wishes to continue striving for
a pay-out ratio of more than 15% and to have the
dividend increase year after year, in order thereby
to have the dividend closely linked to the cash flow
expectations on the one hand, and on the other hand to
reward the shareholders’ confidence in the company.
The pay out ratio for 2007 amounts to 50.2%, as
compared to 45.6% last year. At EUR 0.45 gross
(EUR 0.3375 net), the dividend is 73% higher than last
year. The dividend is made payable at the counters of
Dexia Bank, ING Bank, fortis Bank, Bank Degroof and
KBC Bank from 9 may 2008.
Share Codes and Classifiation
ISIN BE0003743573
Euronext code BE0003743573
Mnemo SIOE
Type Stock - Ordinary stock - Continuous
Market Euronext Brussels - Eurolist - Local shares
Compartment B (Mid-Caps)
ICB Sector classification :
3000, Consumer Goods
3700, Personal & Household Goods
3760, personal Goods
3763, Clothing & Accessories
Reuters : SIOE.BR
Bloomberg : SIO.BB
Datastream : B:SIO

12 I SIOEN INDUSTRIES I Annual Report 2007
Corporate Governance
The Sioen family has been supported by external,
independent directors since 1986. Their expertise
and experience contribute to the proper and effective
management of the company.
On 22 march 2005 the Board of Directors adopted a
Corporate Governance Charter, in accordance with the
Belgian Corporate Governance Code. The Corporate
Governance Charter has been in force since the 2005
General meeting, and can be consulted on the Sioen
Industries website (www.sioen.com).
Since the Corporate Governance Charter came into
effect, a number of minor amendments have been made
to it, reflecting changes to the environment, such as
the dematerialization of shares, or a small change in the
shareholder structure.
The board of directors
Composition (situation as at 31 December 2007)
The directors’ mandates expire at the 2008 general meeting.
CHAIRMAN Mr J.J. Sioen (1), chairman/director in various other companies
MANAGING DIRECTOR
M.J.S. Consulting b.v.b.a., represented by ms m. Sioen (1) director in various other companies
DIRECTORS Ms J.N. Sioen-Zoete (1), director in various other companies
D-Lance b.v.b.a., represented by Ms D. Parein-Sioen (2) director in various other companies
P. Company b.v.b.a., represented by ms p. Sioen (1) director in various other companies
Pol Bamelis n.v., represented by mr p. Bamelis (3) director in various other companies
Revam b.v.b.a., represented by mr W. Vandepoel (3)
managing director Lessius Corporate finance n.v.; director in various other companies
Louis Verbeke e.b.v.b.a., represented by Mr L.-H. Verbeke (3)
chairman of mitiska n.v.; director in various other companies
K.E.M.P. n.v. represented by mr Luc Sterckx (3)
CEO of SpE n.v.; director in various other companies
Vean n.v., Represented by mr L. Vansteenkiste (3)
managing director of Recticel n.v.; director in various other companies
SECRETARY Mr G. Asselman CfO Sioen Industries Group
STATUTORY AUDITOR (4)
Deloitte Bedrijfsrevisoren c.v.b.a. Represented by mr D. Van Vlaenderen and mr K. Dehoorne
(1) Executive director(2) Non-executive director(3) Independent director. In defining which directors are independent, the Company has opted for the criterion whereby a director may
not remain in his post for more than three four-year mandates, as from the general meeting of 2005. The consequence of this is that three current directors are considered as independent, although they have already held directorships for more than twelve years in the Sioen Group. This is to ensure the continuity of the Company and its management.
(4) The Statutory Auditor’s mandate expires at the general meeting of 2008.
SIO
EN
IN
DU
ST
RIE
S
I A
nn
ua
l R
ep
ort
20
07
13
The Board of Directors and how it works
In accordance with the Articles of Association, the
Board of Directors meets regularly as a function of the
company’s needs and interests. In 2007 it met five
times.
The number of meetings attended by the individual
directors in 2007 were as follows:
Mr Jean-Jacques Sioen 5
ms michèle Sioen 5
Ms Jacqueline Sioen-Zoete 3
ms Danielle Sioen 5
ms pascale Sioen 4
mr pol Bamelis 5
mr Wilfried Vandepoel 5
Mr Louis-Henri Verbeke 5
mr Luc Sterckx 5
mr Luc Vansteenkiste 5
The permanent agenda of every Board of Directors
meeting includes the discussion of and taking of
decisions with respect to the individual results of
companies in the group, division results, consolidated
results, current investments and projects, new projects
and proposals for investment opportunities. The board
also deals with specific points on the agenda as a
function of concrete matters in hand.
Working committees
The Sioen Industries Group has three working
committees:
a. Audit Committee:
In 2007 the Audit Committee consisted of three
independent directors, namely messrs Vandepoel
(Chairman), Verbeke and Sterckx.
The Audit Committee met four times in 2007. The
number of meetings individually attended by the
members of the Audit Committee in 2007 was as
follows:
mr Wilfried Vandepoel 4
Mr Louis-Henri Verbeke 4
mr Luc Sterckx 4
b) Remuneration Committee
In 2007 the Remuneration Committee was made up
of two independent directors, namely messrs Bamelis
(chairman) and Vansteenkiste.
The Remuneration Committee advises the Board
of Directors on pay policy in general and on the
compensation paid to the members of the Board of
Directors and the management Committee in particular.
The share option plans also fall under its remit.
The Remuneration Committee met twice in 2007.
All members of the committee were present at each
meeting.
c) Nomination Committee
On 22 march 2005 a Nomination Committee was set
up in accordance with Sioen Industries’ Corporate
Governance Charter. It is made up of two independent
directors (messrs Bamelis and Sterckx) and one
executive director (Mr Jean-Jacques Sioen). Given that
there was no need to make any appointments in 2007,
the Nomination Committee did not meet.

14 I SIOEN INDUSTRIES I Annual Report 2007
Management Committee
The members of the management Committee
(as of 31 December 2007) are:
- MJS Consulting b.v.b.a., represented by Ms M. Sioen
- P. Company b.v.b.a., represented by Ms P. Sioen
- Mr Geert Asselman
- Mr Erwin Van Uytvanck
- Mr Michel Devos
Secretary: mr Loebrecht Lievens
Remuneration of directors and the Executive Management
In 2007 the following remuneration was paid to the
members of the Board of Directors and the Executive
management:
Non-executive and independent directors, and to
members of the Executive management in their capacity
as directors:
Mr Jean-Jacques Sioen EUR 20,000
m.J.S. Consulting b.v.b.a EUR 20,000
Ms. Jacqueline Sioen-Zoete EUR 20,000
D-Lance b.v.b.a EUR 20,000
p. Company b.v.b.a EUR 20,000
pol Bamelis n.v EUR 22,250
Revam b.v.b.a. EUR 29,000
Louis Verbeke e.b.v.b.a. EUR 26,000
K.E.m.p. n.v. EUR 26,000
Vean n.v. EUR 21,500
ms michele Sioen received in 2007, in her capacity
of CEO and in addition to her director’s fees, fixed
remuneration of EUR 419,491. She received variable
remuneration of EUR 125,286.
The compensation paid to the other members of the
Executive management amounted in 2007 to an overall
fixed sum of EUR 2,011.567 and a variable amount of
EUR 208,658. All amounts given are gross amounts, and
thus represent the full cost to the company.
In 2007 no shares, share options or other rights to
acquire shares of Sioen Industries were granted to
the CEO and the other members of the Executive
Management. No specific recruitment agreements
or agreements for golden handshakes exist with the
members of the Executive management.

SIO
EN
IN
DU
ST
RIE
S
I A
nn
ua
l R
ep
ort
20
07
15
External audit
Within the Sioen Industries group, external audit is
chiefly carried out by Deloitte Bedrijfsrevisoren.
This involves the auditing of both the statutory financial
statements and the consolidated annual financial
statements of Sioen Industries n.v. and its subsidiaries.
To the extent that the audits of a number of subsidiaries
are carried out by other auditing companies, Deloitte
makes use of their work, as stated in the Statutory
Auditor’s report. During the past financial year the
Statutory Auditor received EUR 277,200 from Sioen
Industries in respect of its statutory auditor mandate.
Additionally the Statutory Auditor and its network
received EUR 41,250 for other auditing work, and
EUR 14,505 for other assignments outside its audit
mandate.
The mandate of Deloitte Bedrijfsrevisoren as Statutory
Auditor of Sioen Industries n.v. expires at the annual
meeting of 2008. Deloitte Bedrijfsrevisoren is
represented by mr D. Van Vlaenderen and
mr K. Dehoorne.
Protocol to prevent abuse of insider information
To prevent privileged information being used illegally
by directors, shareholders, and members of the
management and staff (i.e. “insiders”), or even to
prevent such an impression possibly being created, the
Board of Directors of Sioen Industries n.v. has produced
a protocol for the prevention of abuse of insider
information (“1997 protocol”).
further to Directive 2003/6/EU a new protocol was
approved by the Board of Directors on 1 may 2005.
The protocol is initially aimed at protecting the market
as such, ensuring observance of the statutory provisions
and maintaining the group’s reputation.
In addition to a number of prohibitions concerning the
trading of Sioen Industries n.v. financial instruments
when insiders have privileged information that is not
(yet) available to the public, it also contains a number of
preventive measures and directives designed to maintain
the confidential nature of privileged information.
All insiders eligible for this have signed this protocol.
A Compliance Officer has been appointed to monitor
observance of the protocol.

16 I SIOEN INDUSTRIES I Annual Report 2007
General Information
Registered office and name
The registered office of Sioen Industries, a public limited
liability company under Belgian law, is established at
Fabriekstraat 23, B-8850 Ardooie.
The company is listed in the Bruges register of legal
persons under enterprise number 0441.642.780.
Incorporation and publication
Sioen Industries was incorporated under the name
“Sihold” by deed executed before notary-public Ludovic
du faux in moeskroen on 3 September 1990, published
in the appendix to the Belgian Official Journal of
28 September 1990, under no. 900928-197.
Financial year
The financial year begins on 1 January and ends on
31 December of each year.
Term
The company is established for an indefinite period.
Object of the company
The company’s object, in Belgium and abroad, on its
own behalf and on behalf of third parties, is:
• The weaving of fibres of all kinds, the coating of
fabrics and all other material, the printing thereof, the
manufacture of plastic and plasticized material, the
manufacture, purchasing and sale, both in Belgium
and abroad, of material useful for or relating to
aforesaid products and raw materials, as well as the
manufacture of chemical products and pigments;
• The manufacture of pre-finished outer clothing in
woven fabric, the manufacture of all kinds of tailor-
made clothing and embroidery; the manufacture of
outer clothing in knitted fabrics, and of household
linen and interior decoration items; the manufacture
of wall cladding, the printing and finishing of all
fabrics; the manufacture of ready-to-wear items of
clothing and outfits for men and women; knitwear,
embroidery, household and table linen, children’s
clothing. The manufacture of safety and high visibility
articles. Wholesale and retail trading in all the above-
mentioned items;
• The investment in, subscription to, permanent
takeover, placing, purchase, selling, and trading of
shares, dividend certificates, bonds, certificates, claims,
currencies and other transferable securities, issued by
Belgian or foreign companies, whether or not in the
form of trading companies, administrative offices,
institutions and associations either with or without
(semi-) public status;
• The management of investments and shareholdings
in subsidiaries, the holding of directorships, the giving
of advice, management and other services to or in
accordance with the activities carried out by the
company itself. These services may be provided by
virtue of contractual or statutory appointment and in
the capacity of external consultant or representative
body of the customer.
All this insofar as the company complies with the
statutory requirements. The company may, in Belgium
and abroad, effect all industrial, trading, financial,
moveable property and real estate transactions that
may develop or promote its business either directly or
indirectly. It may, by any means, acquire all movable or
immovable goods even if these are not related directly
or indirectly to the company’s object.
It may, in any way, acquire participating interests in all
associations, businesses, enterprises or companies that
are striving for the same or a similar or related object or
that can promote its business or facilitate the sale of its
products or services, and it may collaborate or merge
therewith.
SIO
EN
IN
DU
ST
RIE
S
I A
nn
ua
l R
ep
ort
20
07
17
Consultation of documents
The statutory and consolidated annual accounts of the
company and the accompanying reports are filed with
the National Bank of Belgium.
The articles of association and the special reports
required by the Companies Code can be obtained from
the Clerk’s Office of the Commercial Court of Bruges.
These documents, as well as the annual and half-yearly
reports and all information published for the benefit of
the shareholders, can also be requested by shareholders
at the registered office of the company. The articles of
association, the annual and half-yearly reports can also
be downloaded from the website www.sioen.com.
Authorized capital
The board of directors is authorized, during a period
of five years counting from the date of publication in
the Annexes to the Belgian Official Journal of the deed
concerning the amendment of the articles of association
of 30 may 2003 (BOJ of 17 June 2003), to increase
the subscribed capital on one or more occasions, by
a maximum amount of forty-six million euros. This
renewable authority is valid for capital increases in cash,
in kind or by conversion of reserves. At the moment this
amount is still wholly available.
In the framework of the authorized capital, the board of
directors is authorized, in the interest of the company
and subject to observance of the conditions laid down
in Articles 535 and 592 to 599 of the Companies
Code, to cancel or restrict the preferential subscription
right that is granted to the shareholders by law. The
board of directors is authorized to restrict or cancel the
preferential subscription right in favour of one or more
particular persons, even if these are not members of staff
of the company or its subsidiaries.
In the event of an increase of the subscribed capital,
carried out within the limits of the authorized capital,
the board of directors is authorized to ask for an issue
premium. If the board of directors decides to do so, this
issue premium should be allocated to an unavailable
reserve account that can only be reduced or written
off by resolution of the general meeting passed in the
manner required for the amendment of the articles of
association.
In the absence of express authorization given by the
general meeting to the board of directors, the board of
directors’ authority to increase the subscribed capital
through a contribution in cash with cancellation or
restriction of the existing shareholders’ preferential
subscription rights, or through contribution in kind, is
suspended from the date of notification to the company
by the Banking, finance and Insurance Commission of
a public takeover bid for the company’s shares. This
authority will be reinstated immediately after the closing
of such a takeover bid. The general meeting of 25
may 2007 expressly authorized the board of directors
to increase the subscribed capital on one or more
occasions, from the date of notification by the Banking,
finance and Insurance Commission to the company of
a public takeover bid for the company’s shares, through
contributions in cash with cancellation or restriction of
the existing shareholders’ preferential subscription right,
or by contributions in kind, in accordance with Articles
557 and 607 of the Companies Code. This authority is
granted for a period of three years from 25 may 2007
and is renewable.

18 I SIOEN INDUSTRIES I Annual Report 2007
Acquisition by the company of shares in its own capital
The general meeting of 25 may 2007 expressly
authorized the board of directors, in accordance with
the provisions of the Companies Code, to acquire
or have disposal of its own shares or profit-sharing
certificates, if the acquisition thereof is necessary to
avoid the threat of serious detriment to the company.
This authorization is valid for a period of three years
from date of publication of the above-mentioned
resolution in the Annexes to the Belgian Official Journal
(BOJ of 15 June 2007).
The general meeting of 25 may 2007 authorized the
board of directors, in accordance with Articles 620 to
623 and 625 of the Companies Code, to obtain its own
shares through purchase or exchange in the maximum
number permitted by law, and at a price equal to the
market value of the shares. This authorization also
extends to the acquisition of shares of the company by
one or more of its direct subsidiaries within the meaning
of the law, and is valid for a period of eighteen months
counting from 25 may 2007 and is renewable.
Share based payment plans
Stock option plan I
Under a share option scheme originally introduced in
1996, a total of 6.500 options were issued in 2000 of
which 3.250 remain outstanding and exercisable at
the price of Eur 20.3355 per share until january 2008.
The Board of Directors remains authorized to grant up
to 158.000 options. No options have been granted to
directors under this scheme.
Overview of the 2000 share option plan
Date of Board decision 10/10/2000
Option price as % of market price 7.5%
Option price 1.5375
Option exercise price 20.3550
Allocation 6.500
Unused 3.250
Balance to be exercised January 2005-2008 (3.250)
Stock Option plan II
In order to make remuneration dependent on the
company’s performance, it was decided to introduce
a new option plan. This new option plan meets all
the requirements of the law of 26 march 1999. The
company has opted for an option plan based on a
basket of shares of European companies. The options
granted by Sioen Industries have as their underlying
asset the BEVEK ING ( L) Invest EmU Equity fund (cap)
with ISIN code LU0095527585 and are granted in the
form of a call option. These call options are offered
free of charge to those concerned. The exercise price
will correspond, at the offeror’s choice, to either the
closing price of the BEVEK’s shares on the day before
the offering date, or the average of the closing prices of
the BEVEK’s shares for the 30 calendar days preceding
the offering date. This amount will be mentioned in the
offer letter which will be sent to every beneficiary. The
company covers itself by buying, at the same time, an
identical number of options having the same features,
of the same fund and with the same exercise price.
The option premium that Sioen Industries paid for this
amounted to 52% of the closing price of the BEVEK on
the day before the offering.

SIO
EN
IN
DU
ST
RIE
S
I A
nn
ua
l R
ep
ort
20
07
19
The total number of outstanding options is as follows
2007
Options outstanding at 1 January 2007 0
Options granted during the reporting period 3,957
Options exercised during the reporting period 0
Options outstanding at 31 December 2007 3.957
Options exercise price 2007 140.11 Eur
Option premium paid 72.86 Eur
The options have a total term of 10 years from the date
of offering. After a blocking period, beneficiaries have
the possibility of either selling or exercising the options
granted to them until the end of the exercise period.
20 I SIOEN INDUSTRIES I Annual Report 2007
Sioen Industries Group
Sioen Industries is the leading world producer of coated
technical textiles, European market leader in industrial
protective clothing, a niche specialist in fine chemicals
and a major world player in processing technical textiles
into semi-finished products and technical end products.
Sales
• In 2007 Sioen achieved net group sales of
EUR 380.4 million, up 12.1% from EUR 339.4 million
the year before. On the one hand external sales
growth of EUR 27.1 million was achieved in the
chemicals division with the acquisition of the Richard
group and the purchase of the decorative inks activity
in the final quarter of 2006. On the other hand the
boom in the transport sector brought internal sales
growth in both the coating and industrial applications
divisions of 7.4% and 7.1% respectively. The strategic
focus on technical products combined with a very
cost-efficient production apparatus led to a 72.5%
increase in cash flow in the apparel division and a
more than doubling of its operating profit.
Gross margin-EBITDA-EBIT
• Despite historically high raw materials prices and
increased competition, the group was able to increase
its gross margin and EBITDA at group level by 1.0%
and 36.5% respectively. The strongest increase was
achieved in the coating division, where a strategy
of price increases for end products to compensate
constantly rising raw materials prices, a constant
striving for cost efficiency and effective R&D efforts
again bore fruit in 2007. Whilst sales rose by 7.4%,
operating cash flow in this division rose by 37.2%.
The apparel division too was able to improve its gross
margin despite very competitive conditions. This had
a positive impact on operating cash flow, which rose
from EUR 6.1 million in 2006 to EUR 10.6 million
in 2007. In this division too, technical excellence
is crucial, in particular with professional users that
set very high standards. During the past year the
chemicals division concentrated on integrating the
companies taken over at the end of 2006. These
acquisitions have positively affected the gross margin
and operating cash flow, which rose from
EUR 4.5 million in 2006 to EUR 7.3 million in
2007. Gross margin and EBITDA in the industrial
applications division fell slightly owing to a number of
temporary events like a major revaluation of the polish
currency against the euro, the implementation of a
new ERp system, and an election year in france, which
traditionally means fewer government orders.
• Services and other goods rose by EUR 5.1 million,
moving to 15.9% of net sales compared with 16.3%
in 2006. The biggest increases under this heading are
maintenance and repair costs, as well as transport costs,
which are explained mainly by the activities acquired at
the end of 2006 by the chemicals division.
• Personnel costs rose less strongly than net sales,
taking them to 19.1% of net sales, compared with
19.9% in 2006. The rise in these costs is explained by
the acquisitions made by the chemicals division and
increased activity in the industrial applications division.
• Other operating costs covers a number of generally
non profit-related taxes like property tax, taxe
professionelle in france and the like. Every year these
non profit-related taxes grow more onerous, to the
extent that they are now almost as large as corporation
tax.
• This gives the group an operating profit of EUR 38.8
million in 2007 compared with 25.9 million in 2006.
• Operating cash flow (EBITDA) rose by 36.4% to EUR
61.2 million.
• Financial result: at EUR -8.4 million, net financial costs
were EUR 1.8 million higher than in 2006. The reasons
for this lie in the net financial debt of EUR 146.0 million,
the continuing weakening of the pound sterling and the
constant revaluation of the polish currency.
• The effective tax rate was 36.9%, compared with
37.1% in 2006, due entirely to the non-recognized
losses incurred in certain subsidiaries
• This brings the final net profit for 2007 to EUR 19.2
million, compared with EUR 12.1 million in 2006.
I. Comments on the consolidated financial statements

SIO
EN
IN
DU
ST
RIE
S
I A
nn
ua
l R
ep
ort
20
07
21
• Net operating cash flow rose by EUR 12.0 million from
EUR 31.5 to 43.5 million.
Investments
• Total investment in tangible fixed assets amounted to
EUR 21.1 million. The largest items here are:
o Investment in a new Calandering plant:
EUR 5.7 million in 2007. This comes on top of
EUR 6.4 million of investment in this new plant in
2006.
o EUR 2.3 million: weaving looms and ovens for
online-coating
o EUR 0.5 million: direct coating
o EUR 0.7 million: laser cutting machine
o EUR 0.5 million: wide-format printer
o EUR 0.5 million: Weaving looms
o EUR 2.7 million: investment in a new ERp package
• In 2007 two customer portfolios were acquired,
resulting in a net investment of EUR 2.0 million for
chemicals.
Balance sheet
In nominal amounts working capital rose from
EUR 115.2 million at 31/12/2006 to EUR 126.2 million at
31/12/2007. Bearing in mind that sales have increased by
EUR 41.0 million, working capital need as a percentage of
sales reduced from 33.9% to 33.2%.
Net financial debt fell from EUR 147.8 million at
31/12/2006 to EUR 145.9 million at 31/12/2007.
Risks
Sioen Industries NV is a company listed on Euronext,
that does not itself exercise any industrial activity. Sioen
Industries holds participations in companies operating in
the following sectors:
• production and application of coatings on technical
textiles
• design, development and production of protective
clothing
• processing heavy technical textiles into finished
products
• producing pigment pastes, varnishes and inks for
industrial applications.
Sioen Industries is influenced, in particular in terms of its
income stream, by the economic performance of these
divisions.
These divisions are in turn dependent on general
economic trends and more specifically:
• the volatility of crude oil prices and the more or less
related volatility of prices of its principle raw materials
(pVC, polyester, plasticizer, etc.);
• with regard to the processing of heavy technical
textiles, the group’s evolution closely tracks the
economic cycles of the truck sector;
• the protective clothing division follows the current
trend in industrial activity in Western Europe. The
emphasis is here less on volume and more on the
technical specifications of the clothing.

22 I SIOEN INDUSTRIES I Annual Report 2007
II. Consolidated financial statements II.1. CONSOLIDATED BALANCE SHEET I IN THOUSANDS EURO
The consolidated financial statements for 2007 were approved by the Board of Directors for publication on 12 March 2008.
ASSETS Note 2006 2007
Non-Current assets
Intangible assets III.5.1. 17 716 18 834
Goodwill III.5.2. 17 935 17 585
property, plant and equipment III.5.4. 150 420 151 404
Long term trade receivables III.5.5. 22 14
Other long term assets III.5.5. 504 636
Deferred tax assets III.5.15. 6 199 5 445
TOTAL NON-CURRENT ASSETS 192 796 193 918
Current Assets
Inventories III.5.6. 84 472 90 450
Trade receivables III.5.7. 70 414 73 208
Other receivables III.5.8. 9 423 11 515
Other investments and deposits III.5.8. 532 288
Cash and cash equivalents III.5.8. 12 584 7 479
Deferred charges and accrued income III.5.8. 1 612 1 254
TOTAL CURRENT ASSETS 179 037 184 194
TOTAL ASSETS 371 833 378 112

SIO
EN
IN
DU
ST
RIE
S
I A
nn
ua
l R
ep
ort
20
07
23
EQUITY & LIABILITIES Note 2006 2007
Equity
Share capital 46 000 46 000
Retained earnings 88 338 101 761
Hedging and translation reserves 1 459 824
TOTAL EQUITY 135 797 148 585
Non-Current liabilities
Interest bearing loans - payable after one year III.5.11. 117 033 107 074
provisions III.5.10. 2 509 2 602
pension obligations III.5.9. 1 671 1 366
Deferred tax liabilities III.5.15. 18 360 18 863
Finance leasing - payable after one year III.5.12. 11 428 10 039
Other amounts - payable after one year III.5.11. 3 3
TOTAL NON CURRENT LIABILITIES 151 004 139 947
Current liabilities
Trade and other payables III.5.13. 31 744 34 191
Interest bearing loans - up to one year III.5.11. 31 162 35 400
Provisions - up to one year III.5.10. 1 293 2 029
Pension obligations - up to one year III.5.9. 42 91
Tax liabilities III.5.13. 7 364 440
Finance leasing - up to one year III.5.12. 1 270 1 199
Other amounts payable - up to one year III.5.13. 12 157 16 230
TOTAL CURRENT LIABILITIES 85 032 89 580
TOTAL EQUITY AND LIABILITIES 371 833 378 112
24 I SIOEN INDUSTRIES I Annual Report 2007
I I .2. CONSOLIDATED INCOmE STATEmENT
By fUNCTION I IN THOUSANDS Of EUROS
2006 % of 2007 % ofSales Sales
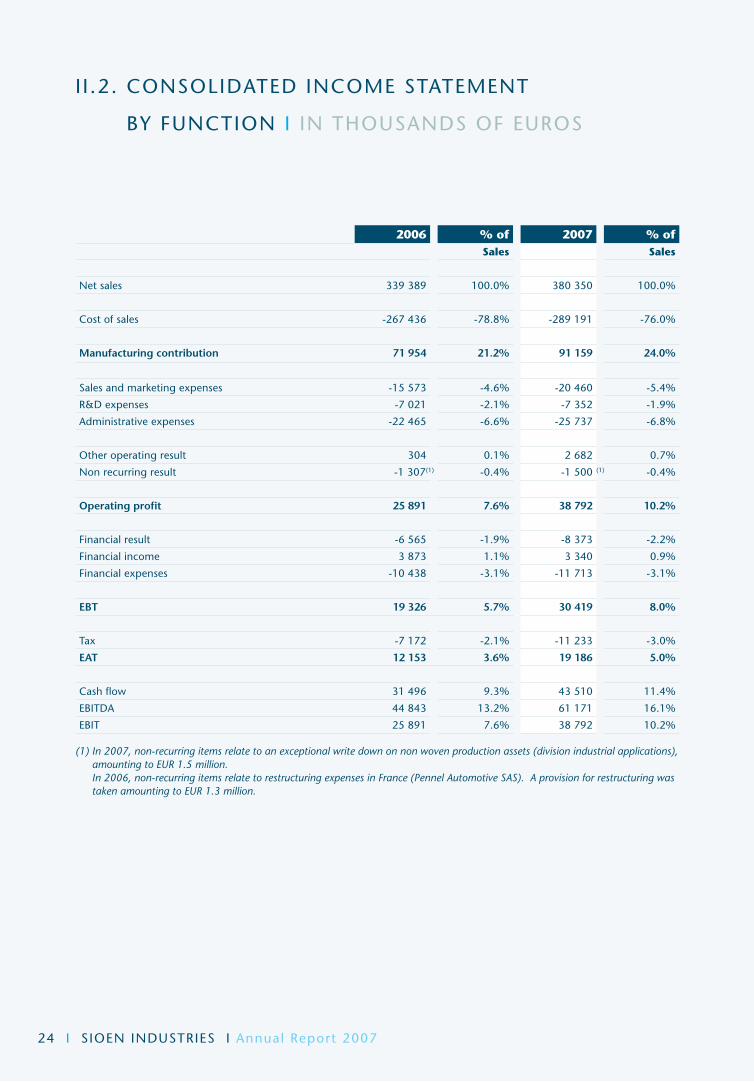
Net sales 339 389 100.0% 380 350 100.0%
Cost of sales -267 436 -78.8% -289 191 -76.0%
Manufacturing contribution 71 954 21.2% 91 159 24.0%
Sales and marketing expenses -15 573 -4.6% -20 460 -5.4%
R&D expenses -7 021 -2.1% -7 352 -1.9%
Administrative expenses -22 465 -6.6% -25 737 -6.8%
Other operating result 304 0.1% 2 682 0.7%
Non recurring result -1 307(1) -0.4% -1 500 (1) -0.4%
Operating profit 25 891 7.6% 38 792 10.2%
financial result -6 565 -1.9% -8 373 -2.2%
financial income 3 873 1.1% 3 340 0.9%
financial expenses -10 438 -3.1% -11 713 -3.1%
EBT 19 326 5.7% 30 419 8.0%
Tax -7 172 -2.1% -11 233 -3.0%
EAT 12 153 3.6% 19 186 5.0%
Cash flow 31 496 9.3% 43 510 11.4%
EBITDA 44 843 13.2% 61 171 16.1%
EBIT 25 891 7.6% 38 792 10.2%
(1) In 2007, non-recurring items relate to an exceptional write down on non woven production assets (division industrial applications), amounting to EUR 1.5 million. In 2006, non-recurring items relate to restructuring expenses in France (Pennel Automotive SAS). A provision for restructuring was taken amounting to EUR 1.3 million.

SIO
EN
IN
DU
ST
RIE
S
I A
nn
ua
l R
ep
ort
20
07
25
2006 % on 2007 % on sales sales
CONSOLIDATED PROFIT AND LOSS STATEMENT
Turnover 339 389 380 350
Changes in stocks and wip 4 620 1.36% 5 345 1.41%
Other operating income 3 339 0.98% 5 599 1.47%
Revenue 347 348 391 295
Raw materials and consumables used 171 856 50.64% 188 798 49.64%
Gross margin 50.72% 51,77%
Services and other goods -55 266 -16.28% -60 355 -15.87%
Remuneration, social security and pensions -67 640 -19.93% -72 586 -19.08%
Depreciations -17 919 -5.28% -20 330 -5.35%
Amounts written down on stocks and trade debts -230 -0.07% -2 265 -0.60%
Provision liabilities & charges -804 -0.24% 215 0.06%
Other operating expenses -6 435 -1.90% -6 884 -1.81%
Non recurring items -1 307 -0.39% -1 500 -0.39%
OPERATING RESULT 25 891 7.63% 38 792 10.20%
fINANCIAL RESULT -6 565 -1.93% -8 373 -2.20%
financial income 3 873 1,14% 3 340 0.88%
finance cost -10 438 -3,08% -11 713 -3.08%
PROFIT BEFORE TAX 19 326 5.69% 30 419 8.00%
TAXES -7 172 -2.11% -11 233 -2.95%
PROFIT AFTER TAX 12 153 3.58% 19 186 5.04%
mINORITy INTEREST 0 0.00% 0 0.00%
RESULT PART OF THE GROUP 12 153 3.58% 19 186 5.04%
EBIT 25 891 7.63% 38 792 10.20%
EBITDA 44 843 13.21% 61 171 16.08%
Cash Flow 31 496 9.28% 43 510 11.44%
I I .2. CONSOLIDATED INCOmE STATEmENT
By NATURE I IN THOUSANDS Of EUROS
26 I SIOEN INDUSTRIES I Annual Report 2007
I I .3. CASH fLOW STATEmENT
2006 2007
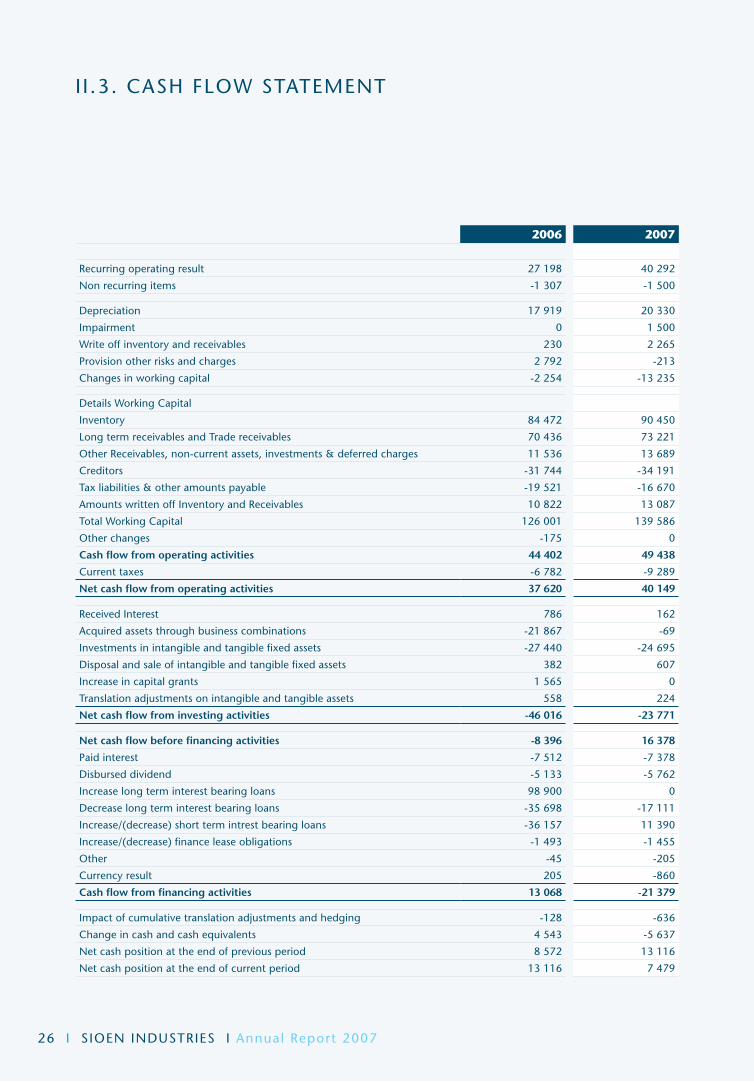
Recurring operating result 27 198 40 292
Non recurring items -1 307 -1 500
Depreciation 17 919 20 330
Impairment 0 1 500
Write off inventory and receivables 230 2 265
provision other risks and charges 2 792 -213
Changes in working capital -2 254 -13 235
Details Working Capital
Inventory 84 472 90 450
Long term receivables and Trade receivables 70 436 73 221
Other Receivables, non-current assets, investments & deferred charges 11 536 13 689
Creditors -31 744 -34 191
Tax liabilities & other amounts payable -19 521 -16 670
Amounts written off Inventory and Receivables 10 822 13 087
Total Working Capital 126 001 139 586
Other changes -175 0
Cash flow from operating activities 44 402 49 438
Current taxes -6 782 -9 289
Net cash flow from operating activities 37 620 40 149
Received Interest 786 162
Acquired assets through business combinations -21 867 -69
Investments in intangible and tangible fixed assets -27 440 -24 695
Disposal and sale of intangible and tangible fixed assets 382 607
Increase in capital grants 1 565 0
Translation adjustments on intangible and tangible assets 558 224
Net cash flow from investing activities -46 016 -23 771
Net cash flow before financing activities -8 396 16 378
paid interest -7 512 -7 378
Disbursed dividend -5 133 -5 762
Increase long term interest bearing loans 98 900 0
Decrease long term interest bearing loans -35 698 -17 111
Increase/(decrease) short term intrest bearing loans -36 157 11 390
Increase/(decrease) finance lease obligations -1 493 -1 455
Other -45 -205
Currency result 205 -860
Cash flow from financing activities 13 068 -21 379
Impact of cumulative translation adjustments and hedging -128 -636
Change in cash and cash equivalents 4 543 -5 637
Net cash position at the end of previous period 8 572 13 116
Net cash position at the end of current period 13 116 7 479

SIO
EN
IN
DU
ST
RIE
S
I A
nn
ua
l R
ep
ort
20
07
27
2007
Capital Reserves Translation differences
Hedging reserves
Minority
At the end of last financial year 46 000 88 337 700 759 0
Result 19 186
Dividends -5 762
Hedging
Deferred tax 111
Cumulative translation adjustments -634
Change in consolidation scope
Transfer to profit on cash flow hedges -112
At the end of current financial year 46 000 101 761 66 758 0
The company paid in 2007 5.7 mio Eur dividends over 2006.
proposed dividend over 2007 under condition of approval by the general shareholders meeting amounts to 9.6 mio EUR.
2006
Capital Reserves Translation differences
Hedging reserves
Minority
At the end of last financial year 46 000 81 318 2 466 -420 19
Result 12 153
Dividends -5 134
Hedging 1 938
Deferred tax -673
Cumulative translation adjustments -1 766
Change in consolidation scope -19
Transfer to profit on cash flow hedges -86
At the end of current financial year 46 000 88 337 700 759 0
I I .4. EQUITy STATEmENT
28 I SIOEN INDUSTRIES I Annual Report 2007
SUMMARY OF SIGNIFICANT ACCOUNTING POLICIES
The consolidated annual financial statements of Sioen
Industries NV (the ‘Company’) include the annual financial
statements of the Company, its subsidiaries and those
entities which are consolidated by the proportional method
(together referred to below as the ‘Group’).
The consolidated financial statements are drawn up in
conformity with the International financial Reporting
Standards (IfRS), as accepted within the European Union.
In the current year, the Group has adopted all of the
new and revised Standards and Interpretations issued by
the International Accounting Standards Board (the IASB)
and the International financial Reporting Interpretations
Committee (the IfRIC) of the IASB that are relevant to
its operations and effective for annual reporting periods
beginning on 1January 2006, all of which have been
endorsed by the European Union.
Became applicable for 2007
• IFRS 7 Financial Instruments: Disclosures (applicable for
accounting years beginning on or after 1 January 2007)
• IAS 1 Presentation of Financial Statements - Amendment
- Capital Disclosures (applicable for accounting years
beginning on or after 1 January 2007)
• IFRIC 7 Applying the Restatement Approach under IAS
29 Financial Reporting in Hyperinflationary Economies
(applicable for accounting years beginning on or after
1 march 2006)
• IFRIC 8 Scope of IFRS 2 (applicable for accounting years
beginning on or after 1 may, 2006)
• IFRIC 9 Reassessement of Embedded Derivatives
(applicable for accounting years beginning on or after
1 June 2006)
• IFRIC 10 Interim Financial Reporting and Impairment
(applicable for accounting years beginning on or after
1 November 2006)
Issued but not yet effective
• IAS 1 Presentation of Financial Statements (annual
periods beginning on or after 1 January 2009). This
Standard replaces IAS 1 presentation of financial
Statements (revised in 2003) as amended in 2005.
• Amendment to IAS 27 Consolidated and Separate
financial Statements (applicable for annual periods
beginning on or after 1 July 2009). This Standard
amends IAS 27 Consolidated and Separate financial
Statements (revised 2003).
• Amendment to IFRS 2 – Vesting Conditions and
Cancellations (applicable for annual periods beginning
on or after 1 January 2009).
• Amendments to IAS 32 Financial Instruments:
presentation and IAS 1 presentation of financial
Statements – Puttable financial instruments an
obligations arising on liquidation (applicable for annual
periods beginning on or after 1 January 2009).
• IFRS 3 Business Combinations (applicable to business
combinations for which the acquisition date is on or
after the beginning of the first annual reporting period
beginning on or after 1 July 2009). This Standard
replaces IfRS Business Combinations as issued in 2004.
• IFRS 8 Operating Segments (applicable for accounting
years beginning on or after 1 January 2009)
III. Notes to the consolidated financial statements
I I I .1. KEy ACCOUNTING RULES

SIO
EN
IN
DU
ST
RIE
S
I A
nn
ua
l R
ep
ort
20
07
29
General principles
The consolidated annual financial statements give a
general overview of the Group’s activities and the results
obtained. They give an accurate picture of the entity’s
financial position, financial performance and cash flow,
and are drawn up on a going concern basis.
The annual financial statements are stated in thousands of
euros, as the euro is the currency of the primary economic
environment in which the Group is active. The annual
financial statements of foreign participations are converted
in accordance with the principles described in the section
‘foreign currencies’.
The consolidated financial statements are presented on
the basis of the historical cost method, unless otherwise
stipulated in the accounting principles set out below.
Foreign currencies
On the basis of the Group’s relevant economic
environment and its transactions, the euro has been
chosen as the reporting currency.
Foreign subsidiaries’ financial statements are converted as
follows:
Transactions in foreign currencies are converted at the
exchange rate which is applicable on the date of the
transaction. On each balance sheet date, cash assets and
liabilities expressed in foreign currency are converted
at the closing rate. Non-cash assets and liabilities which
are shown at their fair value in a foreign currency are
converted at the exchange rate which is applicable when
their fair value was determined.
Gains and losses arising from such conversions are recorded
in the income statement. However, if they are deferred, they
are recorded as equity. Assets and liabilities from the Group’s
foreign activities are converted at the closing rate.
Income and expenses are converted at the average
exchange rate over the period, unless exchange rates
have fluctuated significantly. The resultant exchange rate
differences are recorded in equity, under the heading
“Conversion differences”.
If a foreign activity is disposed of, the cumulative amount
of the exchange rate differences that was recognised in
equity, is recorded in the income statement.
Goodwill and adjustments to the fair value arising on the
acquisition of a foreign entity are treated as assets and
liabilities of the foreign entity and converted at the closing
rate.
Consolidation principles
Subsidiaries
Subsidiaries are companies over which the Company
exercises a decisive influence (‘control’). Control is the
power to steer an entity’s financial and operational policy
in order to derive benefit from its activities.
The consolidation of subsidiaries starts on the date on
which the Group acquires control over them and stops
when it loses that control. The companies in question are
accounted for by the full consolidation method.
Subsidiaries’ annual financial statements are drawn up for
the same financial year as those of the parent company
and on the basis of uniform financial reporting principles
for comparable transactions and other events in similar
circumstances.
Combinations of companies
If the Group takes over an entity or business activity, the
identifiable assets, liabilities and contingent liabilities of
the party which has been taken over are adopted at their
fair value.
Subsidiaries’ financial statements are included in the scope
of consolidation from the date of acquisition until control
ceases.
The difference between the cost price and the acquiring
party’s stake in the net fair value of the identifiable
assets, liabilities and contingent liabilities is recorded as
goodwill. If this difference is negative, the surplus, after
reassessment of the fair values, is accounted for directly in
the income statement.
If the group increases its interest in an investment in which
30 I SIOEN INDUSTRIES I Annual Report 2007
it did not yet have control, the surplus or deficit compared
with the net asset, after adjustment to the fair value that
was acquired, is processed as if it were a new acquisition
according to the methodology explained in the section
above. If the group increases its interest in an investment
in which it already had control, the greater or lesser price
that was paid vis-à-vis the share in the net assets that was
acquired, is included directly in the company’s own equity.
All intercompany transactions, intercompany balances
and unrealised profits on intercompany transactions are
eliminated unless they relate to a permanent write-down.
minority interests are valued on the basis of their share
in the fair value of the recorded assets, liabilities and
contingent liabilities.
Balance sheet
Intangible assets
Intangible assets are valued at cost price. Intangible assets
are recognised if it is likely that the Group will receive
the associated future economic benefits and if the asset’s
cost price can be reliably determined. After their initial
recognition in the accounts, all intangible assets are
valued at cost price, less any accumulated depreciation
or impairments. Intangible assets are depreciated on a
straight-line basis over the best estimate of their economic
life.
The remaining economic life and the depreciation method
used are reassessed at the close of every financial year.
Any change in the economic life of an intangible asset is
treated as a revaluation.
Internally generated intangible assets are only recognised
if all the following conditions are satisfied:
• an identifiable asset has been generated;
• it is likely that the generated asset will yield future
economic benefits; and
• the asset’s cost price can be reliably determined.
Subsequent expenditure on capitalised intangible assets
is only included in the balance sheet if it increases the
likely future economic benefits associated with the asset
concerned. All other expenditure is recorded in the
income statement at the time it is incurred.
Licences, patents and similar rights
Expenditure on purchased licences, patents, trademarks
and similar rights is capitalised and depreciated on a
straight-line basis over the contractual term, where
applicable, or over the estimate economic life, which is
deemed to be no more than five years.
Computer software
Expenditure relating to the development or maintenance
of computer software is normally offset against the
result of the period in which it is incurred. Only external
expenditure which is directly related to the purchase
and implementation of purchased software is recorded
as an intangible asset and depreciated on a straight-line
basis over three years. purchased ERp software and the
associated implementation costs are depreciated on a
straight-line basis over seven years.
Research and development
Research expenditure with a view to the acquisition of
new scientific or technological insights or knowledge is
included as a cost in the income statement as it arises.
Development expenditure in which research results are
used in a plan or design for the production of new or
substantially improved products and processes prior
to commercial production or implementation is only
recognised in the balance sheet if all the following
conditions are satisfied:
• the product or process is precisely defined and the
expenditure is individually identifiable and reliably
measurable;
• the product’s technical feasibility has been sufficiently
demonstrated;
• the product or process will be commercialised or used
within the company;
III. Notes to the consolidated financial statements
I I I .1. KEy ACCOUNTING RULES
SIO
EN
IN
DU
ST
RIE
S
I A
nn
ua
l R
ep
ort
20
07
31
• the assets will generated future economic benefits
(e.g. a potential market exists for the product or its
internal usefulness has been sufficiently proven);
• the appropriate technical, financial and other resources
are available to finalise the project.
If the above criteria are not satisfied, the development costs
are taken to the income statement as they arise. Capitalised
development costs are depreciated on a straight-line basis
over the expected duration of the generated benefits from
the start of commercial production or the implementation
of the product or process.
Goodwill
Goodwill represents the additional premium paid on the
acquisition of an interest over the fair value of the Group’s
interest in the acquired assets and liabilities at the time of
acquisition.
Goodwill is recorded as an asset and subjected to a
impairment test at least once a year. Any impairment loss
is immediately recorded in the profit and loss account and
is not subsequently written back.
Negative goodwill represents the amount by which the
fair value of the Group’s interest in the acquired assets and
liabilities at the time of acquisition exceeds the price paid.
On the disposal of a subsidiary, associated undertaking
or entity over which joint control is exercised, the related
goodwill is included in the calculation of the gain or loss
on disposal.
Tangible fixed assets
Tangible fixed assets are valued at cost price less
accumulated depreciation and impairments. A tangible
fixed asset is recognised if it is likely that the Group will
receive the associated future economic benefits and if the
asset’s cost price can be reliably determined.
The cost price includes all direct costs and all directly
attributable costs incurred in order to bring the asset to
the location and condition necessary for it to function in
the intended way.
Subsequent expenditure associated with a tangible fixed
asset is usually recorded in the income statement as it is
incurred. Such expenditure is only capitalised if it can
be clearly shown to result in an increase in the expected
future economic benefits from the use of the tangible fixed
asset compared with the original estimate. Repair and
maintenance costs which do not increase the likely future
economic benefits are recorded as costs as they are incurred.
The different categories of tangible fixed assets are
depreciated by the straight-line method over their
estimated economic life. Depreciation commences once
the assets are ready for their intended use.
The estimated economic life of the main tangible fixed
assets lies within the following ranges:
Buildings: 20 years
machines: 5 to 15 years
Equipment: 10 years
furniture: 5 years
Hardware: 5 years
Vehicles: 5 years
If an asset’s book value is lower than the estimated
realisable value, it is immediately written down to the
realisable value.
The gain or loss on the sale or disposal of an asset is
determined as the difference between the net income
on disposal and the asset’s book value. This difference is
recorded in the income statement.
Lease agreements
Financial leasing
Lease agreements which assign to the Group all the main
risks and benefits associated with ownership are regarded as
financial leasing. The assets acquired under financial leasing
arrangements are stated in the balance sheet at their fair

32 I SIOEN INDUSTRIES I Annual Report 2007
value at the start of the lease agreement, or, if this is lower,
at the present value of the minimum lease payments, less
accumulated depreciation and impairments.
The discount rate used in the calculation of the present
value of the minimum lease payments is the interest
rate implicit in the lease agreement, where this can
be determined, or otherwise the company’s marginal
borrowing rate. Initial direct costs are included in the
capitalised amount. Lease payments are broken down into
interest charges and repayments of the principal.
The interest charges are spread over the duration of the
lease agreement such that a constant periodic interest rate
is obtained on the outstanding balance for each period.
A financial lease agreement results in the recording of both
a depreciation amount and an interest charge in each
period. The depreciation rules for assets acquired under
financial leasing arrangements are consistent with those for
assets over which full ownership is acquired.
Operational leasing
Lease agreements in which all the main risks and benefits
associated with ownership reside with the lessor are regarded
as operational leasing. In operational leasing, the lease
payments are recorded as costs and spread on a straight-line
basis over the lease period. The total value of discounts or
benefits granted by the lessor is offset against the leasing costs
and spread on a straight-line basis over the lease period.
Property investments
A property investment, i.e. one which is maintained in
order to generate rental income, an appreciation of value
or both, is shown at fair value on the balance sheet date.
Gains or losses arising from a change in the fair value of a
property investment are recorded in the income statement
for the period in which they arise.
Financial investments
Investments are recorded in/ removed from the accounts
on the transaction date, i.e. the date on which an entity
undertakes to buy or sell the asset in question.
financial investments are valued at the fair value of the
price paid, plus the transaction costs. Investments held
for trading or available for sale are recorded at their fair
value. If investments are maintained for trading purposes,
the gains and losses arising from changes in the fair value
are taken to the profit and loss account for the period in
question. In the case of investments which are available for
sale, gains and losses arising from changes in the fair value
are immediately recognised in equity until the financial
asset is sold or subject to impairment.
In this case, the cumulative gain or loss which had
previously been recognised in equity is included in the
income statement for the period. participations which
are classified as available for sale, which are not listed on
an active market and whose fair value cannot reliably be
determined using alternative valuation rules are valued at
cost price. financial investments which are held until they
mature are valued at their amortised cost price, using the
effective interest method. This does not apply to short-term
deposits, as these are valued at their cost price.
Investment grants
Investment grants relating to the purchase of tangible fixed
assets are offset against the purchase price or manufacturing
cost of the assets in question. The expected amount is
recorded in the balance sheet at the time of initial approval,
and, if necessary, corrected subsequently at the time of
definitive allocation of the grant. The grant is recorded in the
income statement in proportion with the depreciation of the
tangible fixed assets for which it was obtained.
Inventories
Inventories are valued at the lower of cost price or realisable
value. The cost price includes all direct and indirect costs
incurred to bring the goods to the stage of completion they
have reached on the balance sheet date. The cost price is
calculated using the weighted average cost price method.
The realisable value is the estimated sale price minus
the estimated finishing costs and costs associated with
marketing, sale and distribution.
III. Notes to the consolidated financial statements
I I I .1. KEy ACCOUNTING RULES

SIO
EN
IN
DU
ST
RIE
S
I A
nn
ua
l R
ep
ort
20
07
33
Receivables
Short-term receivables are stated at nominal value, less
suitable provisions for any debts regarded as doubtful.
Long-term receivables are valued at amortised cost price.
Cash and cash equivalents
Cash and short-term investments which are maintained
until the end of the period are stated at their cost
price. Cash equivalents are short-term, extremely liquid
investments which can be converted immediately into
cash of a known amount, and which do not carry any
material risk of change of value.
Financial liabilities and equity instruments
Financial liabilities and equity instruments are classified
on the basis of the economic reality of the contractual
agreement. An equity instrument is a contract which
includes the residual right to a share in the Group’s assets,
after the deduction of all liabilities. Equity instruments
issued by the Company are recorded to the amount of the
received consideration, less the direct costs of issue.
Income tax
Tax expenses consist of tax due for the reporting period
and deferred taxes. The tax due for the reporting period is
based on the taxable profit for the period. Taxable profit
differs from the net profit in the income statement, because
it excludes certain items of income or expenditure which
are taxable or deductible in subsequent years, or which will
never be taxable or deductible.
The current tax liability is calculated on the basis of
the tax rates for which the legislative process has been
(substantially) completed by the balance sheet date.
Deferred taxes are taxes which are expected to be paid
or recovered on the basis of differences between the
book value of assets or liabilities in the annual accounts
and their taxable value used for the calculation of the
taxable profit. They are accounted for using the balance
sheet liability method. Deferred tax liabilities are usually
recognised for all taxable temporary differences and
deferred tax receivables are recognised to the extent
that it is likely that a taxable profit will be available
against which the recoverable temporary difference can
be offset. Such assets and liabilities are not recorded if
the temporary differences arise from goodwill or from
the initial recognition (other than in connection with a
business combination) of other assets and liabilities in a
transaction which has no effect on the taxable profit or
the profit before tax.
Deferred tax liabilities are recognised for taxable temporary
differences which relate to investments in subsidiaries,
associated undertakings and enterprises accounted for by
the equity method unless the Group can determine the time
when the temporary difference will be resolved or if it is likely
that the temporary difference will not be resolved in the near
future.
The book value of deferred tax receivable is assessed at every
balance sheet date and reduced if it is no longer likely that
sufficient taxable profit will be available to make it possible to
use all or some of the benefit of the deferred tax receivable.
Deferred taxes are valued on the basis of the tax rates
which are expected to apply in the period in which the tax
recovery is realised or the liability is settled. Deferred taxes
are recorded as income or expenses in the income statement
for the period, unless the taxation arises from a transaction or
event that has been directly included in equity. In this case,
the deferred tax is also accounted for in equity.
Pensions and related liabilities
In accordance with laws and practices of each country,
associated entities have either defined benefit schemes or
defined contribution schemes.
Defined contribution schemes
Contributions to defined contribution schemes are
recorded as an expense as they fall due.
Defined benefit schemes
In defined benefit schemes, the amount on the balance

34 I SIOEN INDUSTRIES I Annual Report 2007
sheet (the ‘net liability’) corresponds to the present value
of the gross liability, adjusted for unrecorded actuarial
gains and losses, after deduction of the fair value of the
scheme investments and unrecorded past service costs.
The ‘present value of the gross liability of a defined benefit
scheme’ is the present value, before deduction of the
scheme investments, of expected future payments required
to settle the liability which results from the employee’s
service record in the current and previous periods.
The discounted value of the liability arising from defined
pension rights and the assigned pension costs associated
with the year of service and prior service pension
costs are calculated by accredited actuaries using the
projected unit credit method.
The discount rate corresponds to the rate of return
on the balance sheet date on corporate bonds with a
high degree of creditworthiness and a remaining term
comparable with the term of the Group’s liabilities.
The discount rate is adjusted annually to reflect the
market return from high-value corporate bonds whose
term is consistent with the estimated term of the gross
liabilities arising from payments after retirement.
‘Actuarial gains and losses’ include adjustments on the
basis of experience (the consequences of differences
between previous actuarial assumptions and what has
actually happened) and the consequences of changes to
actuarial assumptions. In principle, actuarial gains and
losses are not recognised at the moment they arise, but,
to the extent that the cumulative amount falls outside a
certain ‘corridor’, they are spread on a straight-line basis
over the expected average remaining working life of the
employees who are members of the scheme.
This corridor is determined individually for each defined
benefit scheme and has lower and upper limits of 110%
and 90% respectively of the higher of the present value
of the gross liabilities and the fair value of the scheme
investments.
‘past service costs’ refer to the increase in the present value
of the gross liability for services provided by employees
in previous periods and which result in the current period
from the introduction of or changes to payments after
retirement or other long-term personnel remuneration.
past service costs are taken gradually to the income
statement and spread on a straight-line basis over the
average term until the benefit rights have been acquired.
If benefit rights can be regarded as acquired as a result
of a new scheme or changes to an existing scheme, prior
service costs are immediately recorded in the income
statement.
If the liability to be recorded on the balance sheet is
negative, the asset entry that is included may not exceed
the total unrecorded cumulative actuarial net losses
and prior service costs and the present value of future
repayments from the scheme or reductions in future
contributions to the scheme (the ‘asset ceiling’ principle).
In this case, however, the actuarial gains and losses are
immediately taken to the income statement if deferring
them would result in the recording of a gain purely as a
consequence of an actuarial loss in the current financial
year, or of a loss purely and simply as a consequence of an
actuarial gain in the current financial year. Past service costs
are in this case likewise immediately included if spreading
them out on a straight-line basis would result in the
recording of a gain purely as a consequence of an increase
in past service costs during the current financial year.
Other long-term personnel remuneration
Other long-term personnel remuneration such as long-
service bonuses is accounted for using the ‘projected
unit credit’ method. However, the accounting treatment
differs from that of defined benefit schemes, in that
actuarial gains and losses and past service costs are
recorded immediately.
Provisions
provisions are established in the balance sheet if the
III. Notes to the consolidated financial statements
I I I .1. KEy ACCOUNTING RULES

SIO
EN
IN
DU
ST
RIE
S
I A
nn
ua
l R
ep
ort
20
07
35
Group has a legally enforceable or de facto liability on
the balance sheet date as a result of an event in the past,
for which it is likely that an outlay will be required of
resources which contain economic benefits, and if this
outlay can be reliably estimated. The amount recorded
as a provision is the best estimate on the balance sheet
date of the outlay required to satisfy the existing liability,
if necessary discounted if the time value of money is
relevant.
provisions for reorganisation costs are recorded if the
Group has a detailed formal plan for the reorganisation
that has already been communicated to the parties
concerned before the balance sheet date.
Interest-bearing financing
Interest-bearing financing is recorded at the value of the
income received less transaction costs incurred. It is then
valued at amortised cost price using the effective interest
rate method. Any difference between the income (after
deduction of transaction costs) and the redemption
value (including premiums payable on redemption) is
recorded in the income statement over the period of the
financing.
Trading accounts payable and other payables
Non-interest-bearing trade liabilities are valued at their
cost price, which represents the fair value of the amount
payable.
Derivative financial instruments
The Group uses various derivatives to hedge against
currency risks arising from its operating activities,
financing and investment activities. The net risk of all
Group subsidiaries is managed centrally in line with
the objectives and rules established by the Group
management. It is the Group’s policy to avoid engaging
in speculative transactions or transactions with a
leverage effect and not to engage in trading in financial
instruments under any circumstances.
Derivative financial instruments are treated as follows:
Cash flow hedging
Changes in the fair value of derivative financial
instruments which are ascertained to provide effective
hedging for future cash flows are recorded directly
in equity, while the non-effective element of the gain
or loss on the hedging instrument is recorded in the
profit and loss account. If the cash flow hedging of a
fixed commitment or a highly likely future transaction
results in the recognition of an asset or liability, then the
associated profits and losses on the derivative instrument
which were formerly recorded in equity are now
included in the initial valuation of the asset or liability
at the time of recognition. for hedges which do not
result in the recognition of non financial asset or liability,
amounts which were deferred in equity are recorded in
the profit and loss account for the period during which
the hedged item affects the gain or loss.
Fair value hedging
A derivative instrument is recorded as a fair value
hedge if the instrument hedges against the risk that
the fair value of the recorded assets and liabilities may
change. Derivatives accounted for as fair value hedges
and hedged assets and liabilities are recorded at their
fair value. The corresponding changes in the fair value
are recorded in the income statement. Changes in the
fair value of derivative financial instruments which do
not qualify as hedging transactions are recorded in the
income statement when they arise. Hedge accounting
is discontinued when the hedging instrument expires, is
sold, terminated or exercised or when the hedging no
longer satisfies the criteria for hedge accounting.
In this case the cumulative gain or loss on the hedging
instrument which is accounted for directly in equity
continues to be recorded separately in equity until the
expected future transaction takes place. If an expected
future transaction is not expected to take place any
more, the cumulative gain or loss shown in the equity is
transferred to the income statement for the period.
36 I SIOEN INDUSTRIES I Annual Report 2007
Revenue
Revenue is recorded if it is likely that the company
will receive the economic benefits associated with
the transaction and the amount of the revenue can
be measured reliably. Turnover is recorded after the
deduction of turnover tax and discounts.
Revenue from the sale of goods is recorded when the
delivery and the complete transfer of risks and benefits
have taken place.
Interest revenue is recorded on a time basis that reflects
the actual return on the asset. Royalties are included on
an accrual basis in accordance with the conditions of the
agreement.
Dividends are recorded when the shareholder’s right to
receive them has arisen.
miscellaneous
Impairment of tangible and intangible assets
As goodwill, which is subjected to an impairment test
every year, intangible assets and tangible fixed assets also
are subject to an evaluation when there is an indication
that their book value may be lower than their realisable
value. If an asset does not generate a cash inflow which
is independent of other assets, the Group estimates the
realisable value of the cash flow generating unit to which
the asset belongs.
The realisable value is the highest value of the fair value
minus sales costs and the value to the business.
The method of the going concern value uses cash flow
forecasts based on the financial budget that is approved
by the management. Cash flows after this period
are extrapolated by making use of the most justified
percentage growth over the long term for the sector
in which the cash flow-generating unit is active. The
management bases its assumptions (prices, volumes,
return) on past performances and on its expectations with
regard to the development of the market. The weighted
average growth percentages are in conformity with the
forecasts included in the sector reports. The discount rate
used is the estimated weighted average equity cost of the
group before taxes, and takes account of the current market
evaluations of the time value of money and the risks for
which the future cash flows are adapted.
If the realisable value of an asset (or cash flow generating
unit) is estimated to be lower than its book value, the asset’s
(or cash flow generating unit’s) book value is reduced to its
realisable value. An impairment loss is immediately recorded
in the income statement.
If an impairment loss is subsequently written back, the asset’s
(or cash flow generating unit’s) book value is increased to
the revised estimate of its realisable value, but only to the
extent that the increased book value is no higher than the
book value that would have been recorded if no impairment
loss had been recorded for the asset (or cash flow generating
unit) in previous years. However, impairment losses on
goodwill are never written back.
Post-balance sheet events
Post-balance sheet events which provide additional
information about the company’s situation on the balance
sheet date (‘adjusting events’) are included in the annual
accounts. Other post-balance sheet events are only
mentioned in the notes if they may have a significant impact.
The most important assessment criteria in the
application of the Valuation rules
In the application of the valuation rules, in certain cases an
accounting assessment must be made. This assessment is
done by making the most accurate assessment possible of
uncertain future evolutions. The management determines
its assessment on the basis of different realistically assessed
parameters, such as future market expectations, sector
growth rates, industry studies, economic realities, budgets
and multi-year plans, expected profitability studies, etc. The
most important elements within the group that are subject
to this are: impairments, provisions and deferred tax items.
III. Notes to the consolidated financial statements
I I I .1. KEy ACCOUNTING RULES

SIO
EN
IN
DU
ST
RIE
S
I A
nn
ua
l R
ep
ort
20
07
37
I I I .2. SEGmENT INfORmATION
PRIMARY SEGMENT INFORMATION
for management purposes, the Group is organised into four major operating divisions – Coating, Apparel, Chemicals and
Industrial Applications. These divisions are the basis on which the Group reports its primary segment information.
The principal products and services of each of these divisions are described earlier in this annual report.
For more details on these divisions reference is made to the first part of this annual report.
Inter-segment sales are undertaken at prevailing market conditions.
The segment liabilities, including the centrally contracted financial debt, have been allocated according to the capital
employed by the segment. The assets and liabilities of the head office (group) have been allocated to the segments as far as
possible.
Segments 2007 Coating Apparel Industrial applications
Chemicals Head office
Elimina – tions
Conso–lidated
Net sales 201 230 69 929 89 661 63 878 26 -44 373 380 350
External sales 170 241 69 924 85 995 54 165 26 380 350
Intersegment sales 30 989 5 3 666 9 713 -44 373 0
Segment profit from operational activities
26 642 7 814 2 323 2 800 39 578
Unallocated profit from operational activities
2 014
Profit from operational activities
38 792
Net financial charges -5 463 -1 299 -1 090 -2 062 1 829 -287 -8 372
Profit before taxation 30 419
Taxes -11 234
Profit after taxation 19 186
Segment assets 217 456 57 965 54 547 59 847 -14 349 375 466
Unallocated assets 2 646
Total consolidated assets 378 112
Segment liabilities 217 456 57 965 54 547 59 847 -14 349 375 466
Unallocated liabilities 2 646
Total consolidated liabilities 378 112
Other information Coating Apparel Industrial applications
Chemicals Head office
Elimina–tions
Conso–lidated
Depreciation 11 521 1 211 2 105 4 556 936 0 20 330
Write downs of inventories 187 1 574 33 -190 0 0 1 604
Write downs of receivables 431 -7 157 80 0 0 661
Additions to/(reversals) of provisions
-259 0 -34 78 0 0 -215
EBITDA 38 521 10 591 4 584 7 325 -138 287 61 171
Impairments 0 0 1 500 0 0 0 1 500
Investments in intangible fixed assets
31 140 38 1 992 1 324 0 3 525
Investments in tangible fixed assets
14 040 1 279 2 873 1 413 1 565 0 21 169

38 I SIOEN INDUSTRIES I Annual Report 2007
I I I .2. SEGmENT INfORmATION
PRIMARY SEGMENT INFORMATION
Segments 2006 Coating Apparel Industrial applications
Chemicals Head office
Elimina – tions
Conso–lidated
Net sales 187 343 75 270 83 687 35 938 18 -79 855 339 389
External sales 157 852 75 211 80 692 25 617 18 339 389
Intersegment sales 29 492 60 2 994 10 321 -42 867 0
Segment profit from operational activities
15 909 3 229 6 084 3 061 28 285
Unallocated profit from operational activities
-2 394
Profit from operational activities
25 891
Net financial charges -4 850 -1 616 -1 029 -596 1 554 -29 -6 565
Profit before taxation 19 326
Taxes -7 172
Profit after taxation 12 153
Segment assets 274 296 58 825 55 225 58 634 -78 680 368 299
Unallocated assets 3 534
Total consolidated assets 371 833
Segment liabilities 274 296 58 825 55 225 58 634 -78 680 368 299
Unallocated liabilities 3 534
Total consolidated liabilities 371 833
Other information Coating Apparel Industrial applications
Chemicals Head office
Elimina–tions
Conso–lidated
Depreciation 12 311 1 499 1 691 1 638 780 0 17 919
Write downs of inventories 61 1 690 366 -1 0 0 2 116
Write downs of receivables -810 -356 -522 -198 0 0 -1 886
Additions to/(reversals) of provisions
605 76 123 0 0 0 804
EBITDA 28 077 6 138 7 742 4 500 -1 642 0 44 843
Reorganisation costs 1 195 61 1 0 50 0 1 307
Investments in intangible fixed assets
20 32 2 8 2 712 0 2 773
Investments in tangible fixed assets
14 140 721 2 561 5 123 548 0 23 097

SIO
EN
IN
DU
ST
RIE
S
I A
nn
ua
l R
ep
ort
20
07
39
2007 Gross sales Assets Capital Expenditure
Germany 74 672 19.5% 240 0.1% 0 0.0%
france 71 304 18.6% 50 669 13.3% 1 830 7.4%
Belgium 43 287 11.3% 270 294 71.0% 20 043 81.2%
Eastern Europe 28 683 7.5% 14 352 3.8% 1 539 6.2%
Netherlands 32 585 8.5% 11 569 3.0% 39 0.2%
Great Britain 27 212 7.1% 5 615 1.5% 20 0.1%
Italy 15 862 4.1% 0 0.0% 0 0.0%
Scandinavia 9 798 2.6% 0 0.0% 0 0.0%
Spain 11 652 3.0% 0 0.0% 0 0.0%
USA 6 365 1.7% 3 212 0.8% 36 0.1%
Ireland 4 147 1.1% 3 498 0.9% 30 0.1%
Switzerland 7 239 1.9% 0 0.0% 0 0.0%
Austria 4 158 1.1% 0 0.0% 0 0.0%
Other 46 171 12.1% 21 221 5.6% 1 140 4.6%
Subtotal 383 137 100.0% 380 669 100.0% 24 676 100.0%
Discounts 2 786
Net Sales 380 350
2006 Gross sales Assets Capital Expenditure
Germany 68 519 20.0% 1 376 0.4% 4 0.0%
france 62 657 18.3% 57 286 15.4% 4 293 16.6%
Belgium 39 801 11.6% 259 779 69.9% 20 143 77.9%
Eastern Europe 33 872 9.9% 10 866 2.9% 819 3.2%
Netherlands 31 202 9.1% 13 070 3.5% 8 0.0%
Great Britain 23 173 6.8% 1 952 0.5% 0 0.0%
Italy 14 232 4.2% 0 0.0% 0 0.0%
Scandinavia 9 637 2.8% 0 0.0% 0 0.0%
Spain 8 979 2.6% 0 0.0% 0 0.0%
USA 8 654 2.5% 3 386 0.9% 151 0.6%
Ireland 4 206 1.2% 3 127 0.9% 41 0.2%
Switzerland 4 138 1.2% 0 0.0% 0 0.0%
Austria 3 759 1.1% 0 0.0% 0 0.0%
Other 29 120 8.5% 20 992 5.6% 411 1.6%
Subtotal 341 949 100.0% 371 833 100.0% 25 871 100.0%
Discounts 2 560
Net Sales 339 389
I I I .2. SEGmENT INfORmATION
SECONDARY SEGMENT INFORMATION

40 I SIOEN INDUSTRIES I Annual Report 2007
I I I .3. EXCHANGE RATES
Code RATE 2006 2007
EUR average 1.0000 1.0000
closing 1.0000 1.0000
USD average 1.2632 1.3794
closing 1.3170 1.4721
GBp average 0.6819 0.6873
closing 0.6715 0.7334
RmB average 10.0492 10.4536
closing 10.2796 10.7525
pLN average 3.9011 3.7749
closing 3.8310 3.5935
TDN average 1.6742 1.7557
closing 1.7106 1.7919
UAH average 6.3686 6.9457
closing 6.6551 7.4354

SIO
EN
IN
DU
ST
RIE
S
I A
nn
ua
l R
ep
ort
20
07
41
2006 2007NET SALES
Sales of goods 342 190 384 507Subcontracting 1 641 1 881Commissions and discounts -4 442 -6 038Net sales 339 389 380 350
COST OF SALES
purchases 165 329 187 965Transport cost goods purchased 1 144 1 207
Stock variation -3 440 -7 905Subcontracting 5 669 3 945personnel expenses 43 439 46 165Depreciation 14 589 15 252Services and other goods 38 590 40 957Amounts written off inventory and receivables 2 116 1 604Cost of goods sold 267 436 289 191
SALES AND MARKETING
Subcontracting 4 0personnel expenses 9 725 11 219Depreciation 303 90Other services and other goods 7 428 8 490Amounts written off inventory and receivables -1 886 661Sales and marketing 15 573 20 460
RESEARCH AND DEVELOPMENT
personnel expenses 3 272 3 909Depreciation 544 544Other services and goods 3 206 2 900Research and development expenses 7 021 7 352
GENERAL AND ADMINISTRATIVE ExPENSES
personnel expenses 11 245 11 349Depreciation 2 483 4 444Other services and goods 8 737 9 945General overhead expenses 22 465 25 738
OTHER OPERATING INCOME AND ExPENSES
Gain/loss on realization fixed assets 54 129Provision liabilities & charges -804 215Exceptional loss 0 -234Received indemnities 548 2 025Local taxes -910 -1 485Other 718 1 408Received Rent 697 623Other operating income and expenses 304 2 682
I I I .4. DETAILED INCOmE STATEmENT
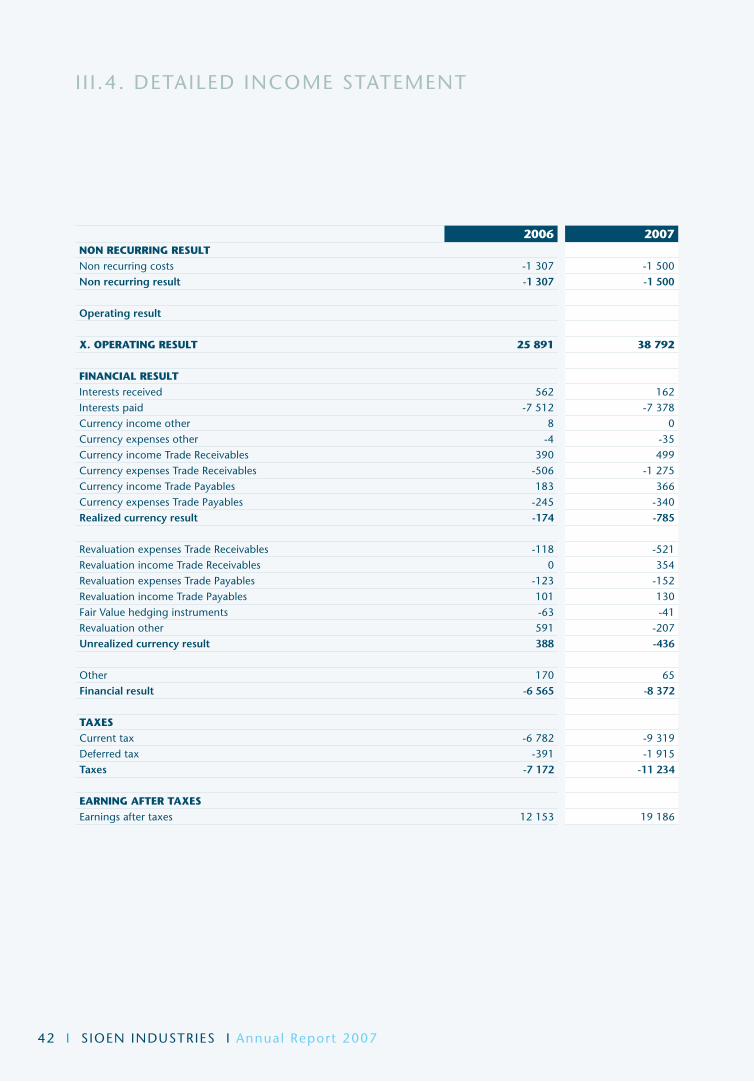
42 I SIOEN INDUSTRIES I Annual Report 2007
2006 2007NON RECURRING RESULTNon recurring costs -1 307 -1 500Non recurring result -1 307 -1 500
Operating result
x. OPERATING RESULT 25 891 38 792
FINANCIAL RESULTInterests received 562 162Interests paid -7 512 -7 378Currency income other 8 0Currency expenses other -4 -35Currency income Trade Receivables 390 499Currency expenses Trade Receivables -506 -1 275Currency income Trade payables 183 366Currency expenses Trade payables -245 -340Realized currency result -174 -785
Revaluation expenses Trade Receivables -118 -521Revaluation income Trade Receivables 0 354Revaluation expenses Trade payables -123 -152Revaluation income Trade payables 101 130fair Value hedging instruments -63 -41Revaluation other 591 -207Unrealized currency result 388 -436
Other 170 65Financial result -6 565 -8 372
TAxESCurrent tax -6 782 -9 319Deferred tax -391 -1 915Taxes -7 172 -11 234
EARNING AFTER TAxESEarnings after taxes 12 153 19 186
I I I .4. DETAILED INCOmE STATEmENT
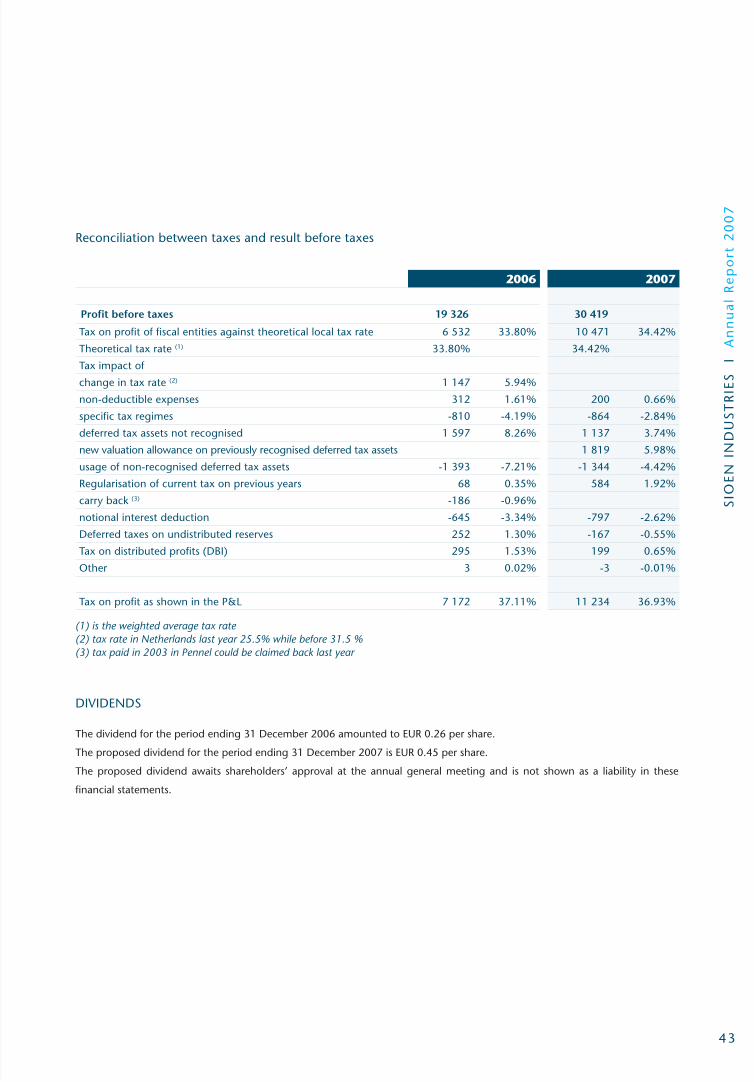
SIO
EN
IN
DU
ST
RIE
S
I A
nn
ua
l R
ep
ort
20
07
43
Reconciliation between taxes and result before taxes
2006 2007
Profit before taxes 19 326 30 419
Tax on profit of fiscal entities against theoretical local tax rate 6 532 33.80% 10 471 34.42%
Theoretical tax rate (1) 33.80% 34.42%
Tax impact of
change in tax rate (2) 1 147 5.94%
non-deductible expenses 312 1.61% 200 0.66%
specific tax regimes -810 -4.19% -864 -2.84%
deferred tax assets not recognised 1 597 8.26% 1 137 3.74%
new valuation allowance on previously recognised deferred tax assets 1 819 5.98%
usage of non-recognised deferred tax assets -1 393 -7.21% -1 344 -4.42%
Regularisation of current tax on previous years 68 0.35% 584 1.92%
carry back (3) -186 -0.96%
notional interest deduction -645 -3.34% -797 -2.62%
Deferred taxes on undistributed reserves 252 1.30% -167 -0.55%
Tax on distributed profits (DBI) 295 1.53% 199 0.65%
Other 3 0.02% -3 -0.01%
Tax on profit as shown in the P&L 7 172 37.11% 11 234 36.93%
(1) is the weighted average tax rate(2) tax rate in Netherlands last year 25.5% while before 31.5 %(3) tax paid in 2003 in Pennel could be claimed back last year
DIVIDENDS
The dividend for the period ending 31 December 2006 amounted to EUR 0.26 per share.
The proposed dividend for the period ending 31 December 2007 is EUR 0.45 per share.
The proposed dividend awaits shareholders’ approval at the annual general meeting and is not shown as a liability in these
financial statements.

44 I SIOEN INDUSTRIES I Annual Report 2007
Earnings per share
The calculation of the basic earnings and diluted earnings per share is based on the following data:
2006 2007
Net earnings for the period 12 153 19 186
Net earnings from continuing activities 12 153 19 186
Weighted average number of outstanding shares 21 391 070 21 391 070
Ordinary shares 21 391 070 21 391 070
Weighted average number of shares for ordinary profit per share 21 391 070 21 391 070
Basic earnings per share 0,57 0,90
Basic earnings per share from continuing activities 0,57 0,90
Diluted earnings per share
2006 2007Diluted elements
Net earnings from continuing activities 12 153 19 186
Earnings attributable to ordinary shareholders 12 153 19 186
Weighted average number of outstanding ordinary shares 21 391 070 21 391 070
Weighted average number of shares for diluted earnings per share 21 391 070 21 391 070
Diluted earnings per share 0,57 0,90
Diluted earnings per share from continuing activities 0,57 0,90
Anti dilutive elements not included in the calculation
Shares option plan as the options are out of the money compared to the average share price in 2006 and 2007.
I I I .4. DETAILED INCOmE STATEmENT

SIO
EN
IN
DU
ST
RIE
S
I A
nn
ua
l R
ep
ort
20
07
45
2007Opening balance Purchases Transfers
Exchange rate
differences
Acquired via business
combination Depreciation OtherClosing balance
Development expenses : acquisition 0Concessions, patents, licences etc.: acquisition
10 082 18 -15 0 10 084
Software : acquisition 11 345 1 519 -22 0 1 184 14 026Customer portfolio : acquisition 8 150 0 1 989 10 139TOTAL 29 576 1 537 0 -36 1 989 0 1 184 34 249Concessions patents licences etc.: depreciation
1 758 -15 0 2 101 -62 3 782
Software : depreciation 7 859 -12 0 533 8 380Customer portfolio : depreciation 2 243 0 1 217 -208 3 253TOTAL 11 860 0 0 -27 0 3 851 -270 15 415Intangible assets 17 716 1 537 -9 1 989 -3 851 1 453 18 834
2006Opening balance Purchases Transfers
Exchange rate
differences
Acquired via business
combination Depreciation OtherClosing balance
Development expenses : acquisition 8 -8Concessions, patents, licences etc.: acquisition
1 653 6 4 8 418 10 082
Software : acquisition 8 399 2 767 15 -16 180 11 345Customer portfolio : acquisition 2 568 0 5 582 0 8 150TOTAL 12 628 2 773 7 -11 14 180 0 0 29 576Concessions patents licences etc.: depreciation
1 512 4 242 1 758
Software : depreciation 7 334 1 -10 173 361 7 859Customer portfolio : depreciation 1 514 0 0 729 0 2 243TOTAL 10 361 0 1 -6 173 1 333 0 11 860Intangible assets 2 267 2 773 6 -5 14 007 -1 333 0 17 716
III.5. Detailed balance sheet
I I I .5.1 INTANGIBLE FIXED ASSETS
Total purchases of intangible fixed assets amount to
EUR 3.5 million in 2007 compared with EUR 2.8 million
in 2006. purchases in 2007 mainly relate to the SAp
software implementation project. On the other hand,
two customer portfolios, related to fillink Technologies
NV (share deal) and Clariant france (asset deal), were
purchased by the division chemicals in 2007.
purchases of software in 2006 mainly consisted of SAp
implementation costs. As SAp was not yet in use in 2006,
no depreciation was booked. As from 2007, the ERp
software and associated implementation costs are partly
implemented (Roltrans Group) and are being depreciated
over seven years on a straight-line basis.
Customer portfolios of fillink and Clariant, purchased in
2007, were valued at respectively EUR 1.5 million and
EUR 0.5 million and are being depreciated over 5 years.
Depreciation of intangible fixed assets amounts to
EUR 3.9 million and is shown in the income statement by
function. Depreciation of customer portfolios is included
in administration expenses.
No development expenses have been capitalized.
No impairments have been recorded.

46 I SIOEN INDUSTRIES I Annual Report 2007
III.5. Detailed balance sheet
I I I .5.2 GOODWILL
2007 Op
enin
g b
alan
ce
Dec
reas
e
Incr
ease
Exch
ang
e ra
te d
iffe
ren
ces
Acq
uire
d v
ia b
usin
ess
com
bin
atio
n
Clo
sin
g b
alan
ce
Goodwill 17 935 -508 152 7 0 17 585
2006
Goodwill 16 548 -2 1 388 17 935
Allocation to segments
Coating 10 950
Apparel 2 367
Industrial application 15
Chemicals 4 253
In January 2007 fillink Technologies SA was purchased by
the chemicals division. The purchased assets were included
in the consolidated annual accounts using the purchase
accounting method. The goodwill of EUR 0.2 million is not
depreciated, in line with IfRS 3.
In October 2006 Richard Colorants SA, Copidis SAS and
Astra SA were purchased, resulting in a goodwill of
EUR 1.4 million. In 2007 goodwill decreased by
EUR 0.5 million, related to the Richard group. A deferred
tax asset was recognised in 2007 (tax loss carryforward of
Astra SA) from the merger with Richard SA in 2007. This
has been subtracted from the initial goodwill.
The carrying amount of goodwill acquired in a business
combination must be allocated on a reasonable and
consistent basis to each cash flow-generating unit or the
smallest group of cash flow-generating units, in conformity
with IAS 36.
The recoverable amount of a cash flow-generating unit is
determined on the basis of the going concern value. for
calculating the going concern value, cash flow forecasts
are used that are based on financial budgets for 1 year
approved by the Board of Directors, and projections. These
projections contain extrapolations making use of the most
justified growth percentage of 2% to 3% that cannot be
higher than the average growth percentage over the long
term for the sector in which the cash flow-generating unit
is active, that is, between 2% and 3%.
management bases its assumptions on past performances
and on its expectations over the coming years. The
discount rate used is calculated per segment and varies
between 6% and 10%.
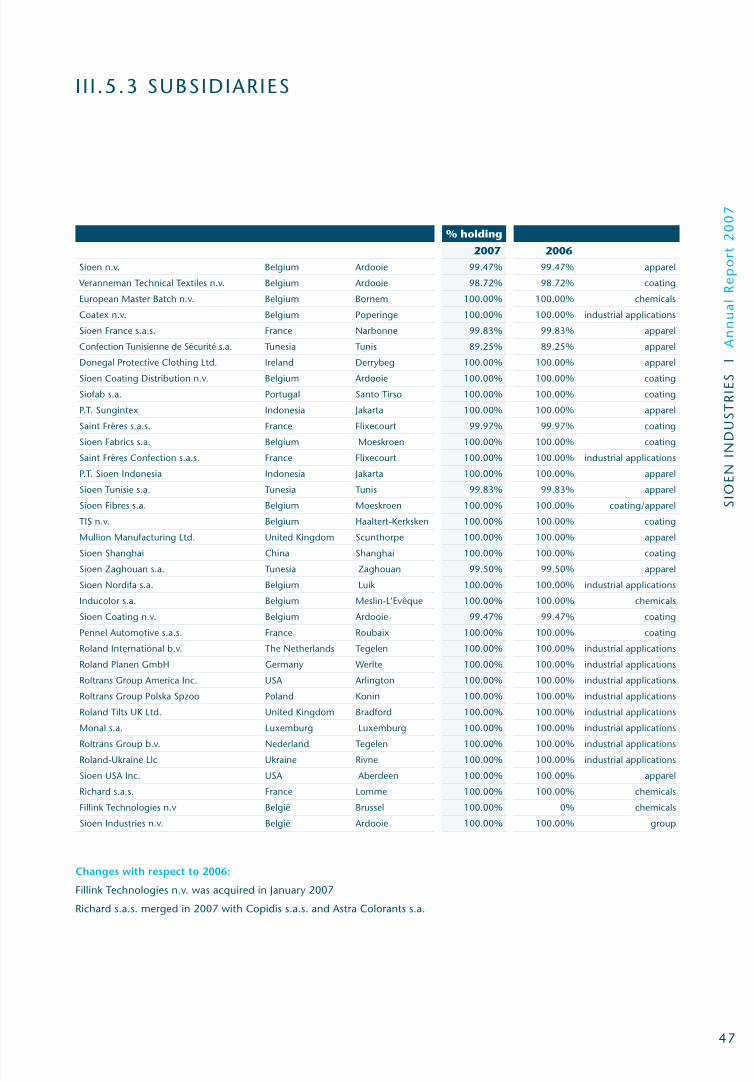
SIO
EN
IN
DU
ST
RIE
S
I A
nn
ua
l R
ep
ort
20
07
47
I I I .5.3 SUBSIDIARIES
% holding
2007 2006Sioen n.v. Belgium Ardooie 99.47% 99.47% apparel
Veranneman Technical Textiles n.v. Belgium Ardooie 98.72% 98.72% coating
European master Batch n.v. Belgium Bornem 100.00% 100.00% chemicals
Coatex n.v. Belgium poperinge 100.00% 100.00% industrial applications
Sioen france s.a.s. france Narbonne 99.83% 99.83% apparel
Confection Tunisienne de Sécurité s.a. Tunesia Tunis 89.25% 89.25% apparel
Donegal protective Clothing Ltd. Ireland Derrybeg 100.00% 100.00% apparel
Sioen Coating Distribution n.v. Belgium Ardooie 100.00% 100.00% coating
Siofab s.a. portugal Santo Tirso 100.00% 100.00% coating
p.T. Sungintex Indonesia Jakarta 100.00% 100.00% apparel
Saint frères s.a.s. france flixecourt 99.97% 99.97% coating
Sioen fabrics s.a. Belgium moeskroen 100.00% 100.00% coating
Saint frères Confection s.a.s. france flixecourt 100.00% 100.00% industrial applications
p.T. Sioen Indonesia Indonesia Jakarta 100.00% 100.00% apparel
Sioen Tunisie s.a. Tunesia Tunis 99.83% 99.83% apparel
Sioen fibres s.a. Belgium moeskroen 100.00% 100.00% coating/apparel
TIS n.v. Belgium Haaltert-Kerksken 100.00% 100.00% coating
mullion manufacturing Ltd. United Kingdom Scunthorpe 100.00% 100.00% apparel
Sioen Shanghai China Shanghai 100.00% 100.00% coating
Sioen Zaghouan s.a. Tunesia Zaghouan 99.50% 99.50% apparel
Sioen Nordifa s.a. Belgium Luik 100.00% 100.00% industrial applications
Inducolor s.a. Belgium Meslin-L’Evêque 100.00% 100.00% chemicals
Sioen Coating n.v. Belgium Ardooie 99.47% 99.47% coating
pennel Automotive s.a.s. france Roubaix 100.00% 100.00% coating
Roland International b.v. The Netherlands Tegelen 100.00% 100.00% industrial applications
Roland planen GmbH Germany Werlte 100.00% 100.00% industrial applications
Roltrans Group America Inc. USA Arlington 100.00% 100.00% industrial applications
Roltrans Group polska Spzoo poland Konin 100.00% 100.00% industrial applications
Roland Tilts UK Ltd. United Kingdom Bradford 100.00% 100.00% industrial applications
monal s.a. Luxemburg Luxemburg 100.00% 100.00% industrial applications
Roltrans Group b.v. Nederland Tegelen 100.00% 100.00% industrial applications
Roland-Ukraine Llc Ukraine Rivne 100.00% 100.00% industrial applications
Sioen USA Inc. USA Aberdeen 100.00% 100.00% apparel
Richard s.a.s. france Lomme 100.00% 100.00% chemicals
fillink Technologies n.v België Brussel 100.00% 0% chemicals
Sioen Industries n.v. België Ardooie 100.00% 100.00% group
Changes with respect to 2006:
fillink Technologies n.v. was acquired in January 2007
Richard s.a.s. merged in 2007 with Copidis s.a.s. and Astra Colorants s.a.
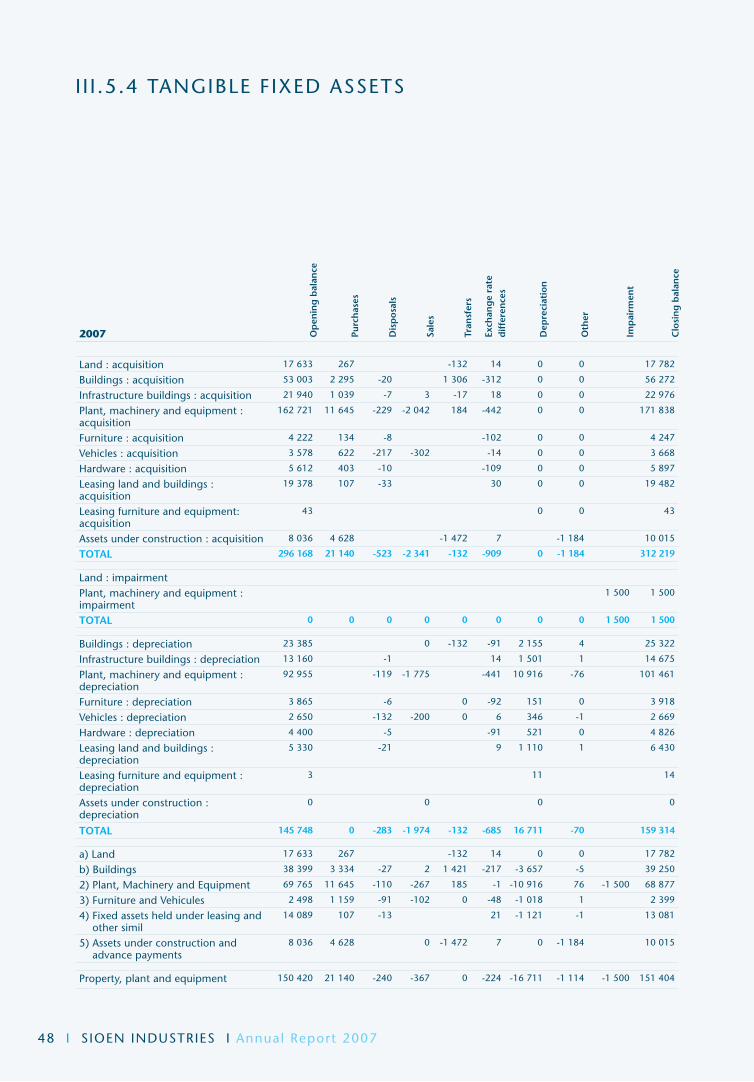
48 I SIOEN INDUSTRIES I Annual Report 2007
2007 Op
enin
g b
alan
ce
Purc
has
es
Dis
po
sals
Sale
s
Tran
sfer
s
Exch
ang
e ra
te
dif
fere
nce
s
Dep
reci
atio
n
Oth
er
Imp
airm
ent
Clo
sin
g b
alan
ce
Land : acquisition 17 633 267 -132 14 0 0 17 782
Buildings : acquisition 53 003 2 295 -20 1 306 -312 0 0 56 272
Infrastructure buildings : acquisition 21 940 1 039 -7 3 -17 18 0 0 22 976
plant, machinery and equipment : acquisition
162 721 11 645 -229 -2 042 184 -442 0 0 171 838
furniture : acquisition 4 222 134 -8 -102 0 0 4 247
Vehicles : acquisition 3 578 622 -217 -302 -14 0 0 3 668
Hardware : acquisition 5 612 403 -10 -109 0 0 5 897
Leasing land and buildings : acquisition
19 378 107 -33 30 0 0 19 482
Leasing furniture and equipment: acquisition
43 0 0 43
Assets under construction : acquisition 8 036 4 628 -1 472 7 -1 184 10 015
TOTAL 296 168 21 140 -523 -2 341 -132 -909 0 -1 184 312 219
Land : impairment plant, machinery and equipment : impairment
1 500 1 500
TOTAL 0 0 0 0 0 0 0 0 1 500 1 500
Buildings : depreciation 23 385 0 -132 -91 2 155 4 25 322
Infrastructure buildings : depreciation 13 160 -1 14 1 501 1 14 675
plant, machinery and equipment : depreciation
92 955 -119 -1 775 -441 10 916 -76 101 461
furniture : depreciation 3 865 -6 0 -92 151 0 3 918
Vehicles : depreciation 2 650 -132 -200 0 6 346 -1 2 669
Hardware : depreciation 4 400 -5 -91 521 0 4 826
Leasing land and buildings : depreciation
5 330 -21 9 1 110 1 6 430
Leasing furniture and equipment : depreciation
3 11 14
Assets under construction : depreciation
0 0 0 0
TOTAL 145 748 0 -283 -1 974 -132 -685 16 711 -70 159 314
a) Land 17 633 267 -132 14 0 0 17 782
b) Buildings 38 399 3 334 -27 2 1 421 -217 -3 657 -5 39 250
2) plant, machinery and Equipment 69 765 11 645 -110 -267 185 -1 -10 916 76 -1 500 68 877
3) furniture and Vehicules 2 498 1 159 -91 -102 0 -48 -1 018 1 2 399
4) fixed assets held under leasing and other simil
14 089 107 -13 21 -1 121 -1 13 081
5) Assets under construction and advance payments
8 036 4 628 0 -1 472 7 0 -1 184 10 015
property, plant and equipment 150 420 21 140 -240 -367 0 -224 -16 711 -1 114 -1 500 151 404
I I I .5.4 TANGIBLE FIXED ASSETS

SIO
EN
IN
DU
ST
RIE
S
I A
nn
ua
l R
ep
ort
20
07
49
2006 Op
enin
g b
alan
ce
Purc
has
es
Dis
po
sals
Sale
s
Tran
sfer
s
Exch
ang
e ra
te
dif
fere
nce
s
Acq
uire
d v
ia b
usin
ess
com
bin
atio
n
Dep
reci
atio
n
Clo
sin
g b
alan
ce
Land : acquisition 16 718 675 -1 -7 -61 308 0 17 633
Buildings : acquisition 50 312 2 539 -121 -179 -544 996 0 53 003
Infrastructure buildings : acquisition 16 580 3 166 -46 -15 2 2 253 0 21 940
plant, machinery and equipment : acquisition
151 462 8 783 -324 -754 23 -577 4 107 0 162 721
furniture : acquisition 3 649 142 -18 -3 -116 568 0 4 222
Vehicles : acquisition 3 407 693 -33 -441 -40 -30 22 0 3 578
Hardware : acquisition 5 335 426 -26 -2 -121 0 0 5 612
Leasing land and buildings : acquisition 20 245 -874 7 0 0 19 378
Leasing furniture and equipment: acquisition
277 156 -40 -347 -3 0 0 43
Assets under construction : acquisition 102 6 517 1 416 1 0 0 8 036
TOTAL 268 087 23 097 -568 -1 256 -7 -1 440 8 255 0 296 168
Buildings : depreciation 20 363 -64 525 -169 882 1 849 23 385
Infrastructure buildings : depreciation 10 057 -33 -15 2 1 927 1 222 13 160
plant, machinery and equipment : depreciation
80 686 -110 -759 -1 -504 2 364 11 280 92 955
furniture : depreciation 3 304 -11 -7 0 -99 494 184 3 865
Vehicles : depreciation 2 733 -33 -350 -30 -17 1 345 2 650
Hardware : depreciation 3 928 -3 -21 -85 0 580 4 400
Leasing land and buildings : depreciation
4 674 -411 2 0 1 064 5 330
Leasing furniture and equipment : depreciation
64 -37 -85 -1 0 61 3
Assets under construction : depreciation
0 0 0 0
TOTAL 125 808 0 -253 -1 189 -1 -871 5 668 16 586 145 748
a) Land 16 718 675 -1 -7 -61 308 0 17 633
b) Buildings 36 472 5 705 -70 0 -704 -374 440 -3 071 38 399
2) plant, machinery and Equipment 70 776 8 783 -213 5 24 -73 1 743 -11 280 69 765
3) furniture and Vehicules 2 426 1 261 -31 -68 -10 -66 96 -1 110 2 498
4) fixed assets held under leasing and other simil
15 784 156 -2 -726 3 0 -1 125 14 089
5) Assets under construction and advance payments
102 6 517 1 416 1 0 0 8 036
property, plant and equipment 142 278 23 097 -315 -67 -6 -569 2 587 -16 586 150 420

50 I SIOEN INDUSTRIES I Annual Report 2007
I I I .5.4 TANGIBLE FIXED ASSETS
Tangible fixed assets
During 2007, tangible fixed assets were acquired in a total
amount of EUR 21.1 million.
The main investments in 2007 were:
• EUR 5.7 million in calandering machinery
• EUR 1.5 million in infrastructure and EUR 1.3 million
building for calendering project
• EUR 1.5 million in looms and 0.8 million in IR ovens
• EUR 1.2 million in coating machinery
• EUR 1.1 million in machinery
• EUR 0.9 million in wide format printer and welding
machine
• EUR 0.7 million in Weaving looms
• EUR 0.7 million in machinery and infrastructure for
chemicals
• EUR 0.6 million in Apparel division
The fixed assets under construction mainly relate to the
calandering factory, that is expected to come into use in
march 2008.
During 2006, the total acquisition of tangible fixed assets
amounted to EUR 24.3 million (including investment grants).
In 2007, no capital grants were received compared to EUR
1.6 million in 2006 for the investments in Nordifa
The main investments in 2006 were:
• EUR 4.7 million in calendering machinery at Moeskroen
• EUR 1.7 million in a building at Moeskroen for the
calendering project
• EUR 0.7 million in land at Moeskroen for the calendering
project
• EUR 1.9 million in a needlefelt production line at Nordifa
• EUR 1.3 million in a building for Richard Colorants at
Lomme
• EUR 2.6 million in a new warehouse at EMB in Bornem
• EUR 1.0 million in machinery at EMB in Bornem
• EUR 1.0 million in a new showroom at Ardooie.
The building in Tegelen is not used in production and
therefore is not depreciated.
The different categories of tangible fixed assets are
depreciated by the straight-line method over their
estimated economic life. Depreciation commences once
the assets are ready for their intended use.
The estimated economic life of the main tangible fixed
assets lies within the following ranges:
Buildings: 20 years
machines: 5 to 15 years
Equipment: 10 years
furniture: 5 years
Hardware: 5 years
Vehicles: 5 years
There are no mortgages secured on the tangible fixed
assets. Tangible fixed assets are subject to the application
of IAS 36, Impairments, when there is an indication that
their book value may be lower than their recoverable
amount. If an asset does not generate a cash inflow which
is independent of other assets, the Group estimates the
recoverable amount of the cash flow generating unit to
which the asset belongs. In 2007 an impairment loss,
amounting to EUR 1.5 million was recognized on assets of
the ‘Non Wovens’ cash generating unit of the Industrial
Applications division.
At 31 December 2007, the Group had entered into
contractual commitments for the acquisition of
property, plant & equipment amounting to EUR 7.7
million, including EUR 6.3 million for a new building for
Veranneman and Sioen Coating.
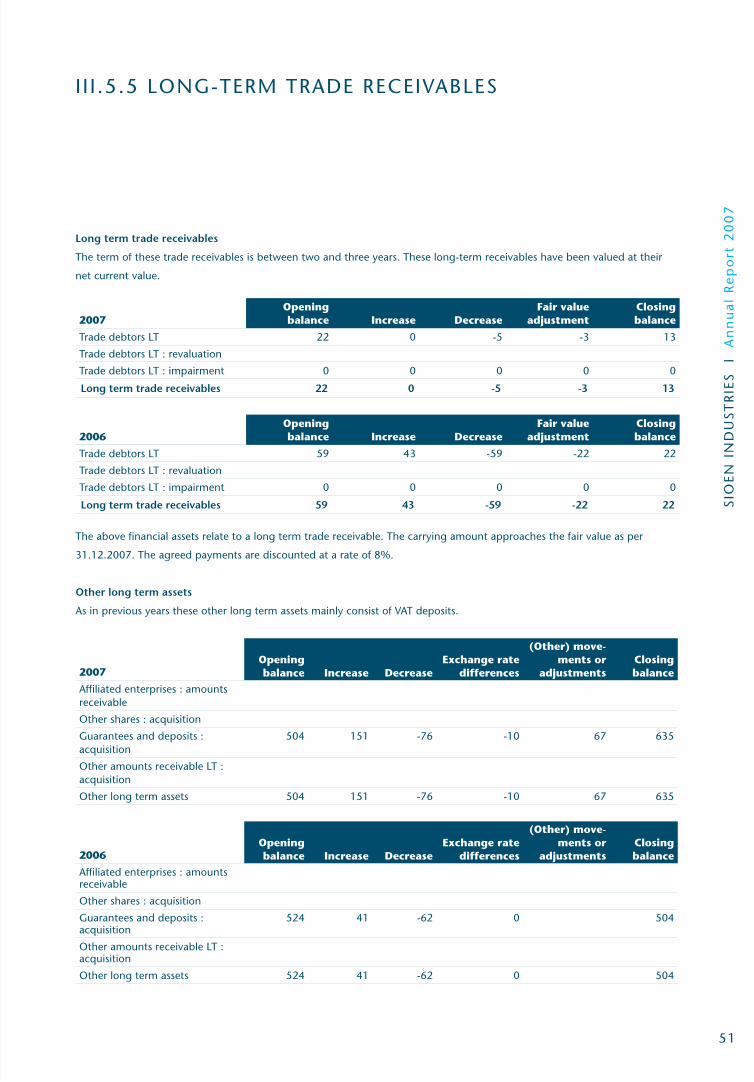
SIO
EN
IN
DU
ST
RIE
S
I A
nn
ua
l R
ep
ort
20
07
51
I I I .5.5 LONG-TERM TRADE RECEIVABLES
Long term trade receivables
The term of these trade receivables is between two and three years. These long-term receivables have been valued at their
net current value.
2007Opening balance Increase Decrease
Fair value adjustment
Closing balance
Trade debtors LT 22 0 -5 -3 13
Trade debtors LT : revaluation
Trade debtors LT : impairment 0 0 0 0 0
Long term trade receivables 22 0 -5 -3 13
2006Opening balance Increase Decrease
Fair value adjustment
Closing balance
Trade debtors LT 59 43 -59 -22 22
Trade debtors LT : revaluation
Trade debtors LT : impairment 0 0 0 0 0
Long term trade receivables 59 43 -59 -22 22
The above financial assets relate to a long term trade receivable. The carrying amount approaches the fair value as per
31.12.2007. The agreed payments are discounted at a rate of 8%.
Other long term assets
As in previous years these other long term assets mainly consist of VAT deposits.
2007Opening balance Increase Decrease
Exchange rate differences
(Other) move-ments or
adjustmentsClosing balance
Affiliated enterprises : amounts receivable
Other shares : acquisition
Guarantees and deposits : acquisition
504 151 -76 -10 67 635
Other amounts receivable LT : acquisition
Other long term assets 504 151 -76 -10 67 635
2006Opening balance Increase Decrease
Exchange rate differences
(Other) move-ments or
adjustmentsClosing balance
Affiliated enterprises : amounts receivable
Other shares : acquisition
Guarantees and deposits : acquisition
524 41 -62 0 504
Other amounts receivable LT : acquisition
Other long term assets 524 41 -62 0 504

52 I SIOEN INDUSTRIES I Annual Report 2007
Gross inventories (excluding write-offs) increased by
EUR 7.0 million compared with 2006. Increased activity
resulted in inventory increases of EUR 3.2 million in
the coating division, EUR 1.8 million in the industrial
applications divisions and EUR 1.2 million in the chemicals
division. In the apparel division inventory decreased by
EUR 0.2 million, in line with the decreased activity.
Obsolescence reserves on inventories amounted to EUR 8.8
million in 2007 compared with EUR 7.7 million in 2006.
Write-downs of obsolete inventory to net realisable value
amounted to EUR 1.6 million in 2007 compared with EUR
2.1 million in 2006.
These obsolescence reserves are recorded on the basis of a
detailed ageing and rotation analysis per unit.
Gross inventory 2006 2007
Raw materials 32 566 32 350
Consumables 848 963
Work in progress 5 101 7 943
finished goods 49 877 53 452
Goods in transit 3 845 4 512
Contracts in progress
92 237 99 219
Amounts written off 2006 2007
Amounts written off raw materials -2 888 -3 374
Amounts written off consumables -7
Amounts written off work in progress
Amounts written off finished goods -4 876 -5 389
Amounts written off goods in transit
Amounts written off : contracts in progress
-7 765 -8 770
Net inventory 2006 2007
1) Raw materials 29 677 28 975
2) Consumables 848 956
3) Work in progress 5 101 7 943
4) finished goods 48 846 52 575
5) Contracts in progress
84 472 90 450
I I I .5.6 INVENTORIES

SIO
EN
IN
DU
ST
RIE
S
I A
nn
ua
l R
ep
ort
20
07
53
I I I .5.7 TRADE RECEIVABLES
2007Trade receivables 72 928
Trade receivabes doubtful 4 597
Subtotal Trade Receivables 77 525
Amounts written off -4 317
Total Financial instrument ‘trade receivables’ 73 208
Outstanding Balance turnover
Customer 1 5 356 6.91% 12 590 3.31%
Customer 2 2 396 3.09% 8 691 2.28%
Customer 3 1 532 1.98% 2 534 0.67%
Customer 4 1 288 1.66% 4 258 1.12%
Customer 5 1 104 1.42% 5 796 1.52%
Other 65 849 84.94% 346 482 91.10%
Total 77 525 100.00% 380 350 100.00%
2006Trade receivables 69 599
Trade receivabes doubtful 4 820
Amounts written off -4 005
Total Financial instrument ‘trade receivables’ 70 414
Outstanding Balance
turnoverCustomer 1 4 594 6.17% 11 565 3.41%
Customer 2 2 162 2.91% 5 940 1.75%
Customer 3 1 666 2.24% 4 609 1.36%
Customer 4 1 631 2.19% 4 055 1.19%
Customer 5 1 413 1.90% 2 717 0.80%
Other 62 953 84.59% 310 503 91.49%
Total 74 419 100.00% 339 389 100.00%
Overdue Analysis Total Not Due 30 Days
Overdue
60 Days
Overdue
90 Days
Overdue
120
Days
Overdue
150 Days
Overdue
More than
150 Days
Overdue
Subtotal Trade Receivables 77 525 62 719 6 179 1 370 1 159 404 78 5 617
54 I SIOEN INDUSTRIES I Annual Report 2007
Trade receivables include EUR 77.5 million to be received
from the sale of goods. Compared to last year, trade
receivables increased by EUR 3.2 million due to increased
business activity.
Less than 10% of the total outstanding is expressed in
foreign currency. The main foreign currencies are the USD
and GBp.
A provision is accounted for the estimated uncollectible
amounts of EUR 4.3 million. A provision for trade
receivables overdue between 30 days and 150 days
and more is recorded based on estimated irrecoverable
amounts from the sale of goods, determined by reference
to past default experience. This provision is recorded in
‘sales & marketing expenses’ in the P&L by function.
As of 1/4/2005 the Group decided to cover itself for credit
risk by concluding a stop loss credit insurance.
The average credit period on sales of goods is about 70
days. Generally no interest is charged on the overdue
trade receivables except when legal procedures are
started.
Before accepting any new customer, the Group uses an
internal credit scoring system, based on internal and
external information, to assess the potential customer’s
credit quality and defines credit limits by customer.
Limits and scoring attributed to customers are reviewed
continuously.

SIO
EN
IN
DU
ST
RIE
S
I A
nn
ua
l R
ep
ort
20
07
55
I I I .5.8 OTHER CURRENT ASSETS
Other current assets 2006 2007
Advances 26 49
VAT receivable 6 348 9 204
Tax prepayment 2 493 1 893
Insurance premiums receivable 362 94
Other 195 275
Other receivables 9 423 11 515
Other current assets consist primarily of VAT to be reclaimed amounting to EUR 9.2 million, pre-paid taxes amounting to EUR
1.9 million and EUR 0.1 million insurance premiums to be received.
Investments 2006 2007
Other investments and deposits 532
Options 288
Investments 532 288
Cash and cash equivalents 2006 2007
Cash at bank 12 210 5 970
At hand 374 41
Cash and cash equivalents 12 584 6 011
The other investments relate to deposits on 3 months,
but shorter than 1 year. The book value of the investment
reflects the estimated market value. The options are held
to hedge (one-on-one basis) the obligations generated by
the share option plan II as explained in section V “General
Information on share based payments”. The options have
an expiry date of 10 years starting from date of issuing.
The beneficiaries have the choice, after a freeze period,
to sell their granted options, or to execute the options
on expiry date. The book value of the options equals the
fair value per 31/12/2007 as the options were bought per
31/12/2007.
Deferred charges and accrued income 2006 2007
Deferred charges 1 476 1 145
Other 136 110
Deferred charges and accrued income 1 612 1 255
Deferred charges amounting to EUR 1.1 million consist primarily of pre-paid rent, insurance policies and interest charges.

56 I SIOEN INDUSTRIES I Annual Report 2007
I I I .5.9 pENSION LIABILITIES
DEfINED BENEfIT pLANS
The following net liabilities are recognized for post-employment and other long term benefits :
2006 2007Post-employment benefits (pension plans) 1 578 1 315Other long term benefits (jubilee benefits) 136 142Total 1 714 1 457
The amounts recognised in the balance sheet are as follows:present value of funded obligations 420 430fair value of plan assets -381 -394present value of unfunded obligations 1 849 1 598(Surplus)/deficit 1 888 1 634Unrecognised actuarial gains/(losses) -303 -313Unrecognised past service cost -7 -6Net liability recognized in balance sheet 1 578 1 315 of which liabilities 1 578 1 315
The amounts recognised in profit or loss are as follows :Service cost 139 173Interest cost 82 114Expected return on plan assets 0 -17past service cost recognized -4 9Actuarial losses (gains) recognized -22 -151Settlement (gain)/loss -104 -353Benefit expense 91 -225
Changes in the present value of the defined benefit obligation are as follows:Opening defined benefit obligation 1 422 2 269Service cost 139 173Interest cost 82 114past service cost -4 9Benefits paid -112 -49Curtailment -104 -353Actuarial losses (gains) 75 -118Liabilities assumed in a business combination 773 0Currency translation changes -2 -17Closing defined benefit obligation 2 269 2 028
Changes in the fair value of plan assets are as follows:Opening fair value of plan assets 0 381Expected return 0 17Actuarial gains and (losses) 0 -4Contributions 112 0Benefits paid -112 0Assets acquired in a business combination 381 0Settlement 0Currency translation changes 0 0Closing fair value of plan assets 381 394
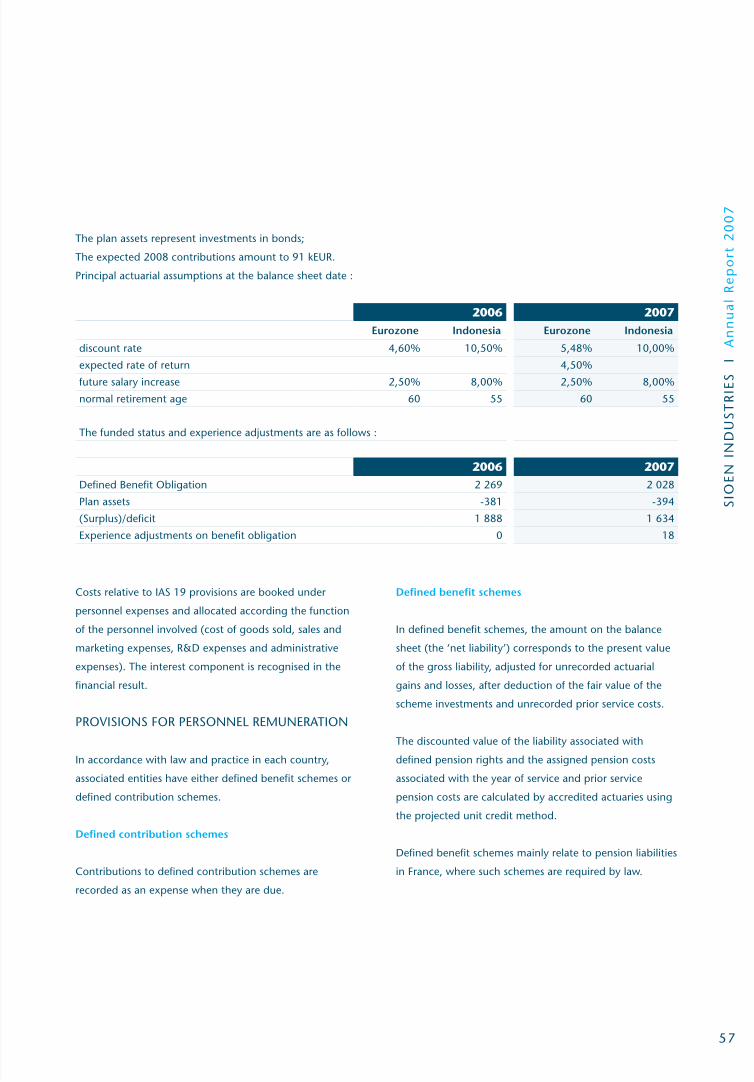
SIO
EN
IN
DU
ST
RIE
S
I A
nn
ua
l R
ep
ort
20
07
57
Costs relative to IAS 19 provisions are booked under
personnel expenses and allocated according the function
of the personnel involved (cost of goods sold, sales and
marketing expenses, R&D expenses and administrative
expenses). The interest component is recognised in the
financial result.
pROVISIONS fOR pERSONNEL REmUNERATION
In accordance with law and practice in each country,
associated entities have either defined benefit schemes or
defined contribution schemes.
Defined contribution schemes
Contributions to defined contribution schemes are
recorded as an expense when they are due.
Defined benefit schemes
In defined benefit schemes, the amount on the balance
sheet (the ‘net liability’) corresponds to the present value
of the gross liability, adjusted for unrecorded actuarial
gains and losses, after deduction of the fair value of the
scheme investments and unrecorded prior service costs.
The discounted value of the liability associated with
defined pension rights and the assigned pension costs
associated with the year of service and prior service
pension costs are calculated by accredited actuaries using
the projected unit credit method.
Defined benefit schemes mainly relate to pension liabilities
in france, where such schemes are required by law.
The plan assets represent investments in bonds;
The expected 2008 contributions amount to 91 kEUR.
principal actuarial assumptions at the balance sheet date :
2006 2007Eurozone Indonesia Eurozone Indonesia
discount rate 4,60% 10,50% 5,48% 10,00%
expected rate of return 4,50%
future salary increase 2,50% 8,00% 2,50% 8,00%
normal retirement age 60 55 60 55
The funded status and experience adjustments are as follows :
2006 2007Defined Benefit Obligation 2 269 2 028
plan assets -381 -394
(Surplus)/deficit 1 888 1 634
Experience adjustments on benefit obligation 0 18

58 I SIOEN INDUSTRIES I Annual Report 2007
I I I .5.10 pROVISIONS
2007 Op
enin
g b
alan
ce
Incr
ease
Uti
lisat
ion
Rev
ersa
l
Exch
ang
e ra
te d
iffe
ren
ces
Acq
uire
d v
ia
bus
ines
s co
mb
inat
ion
Fair
val
ue
Clo
sin
g b
alan
ce
Mo
re t
han
1 y
ear
Wit
hin
1 y
ear
provisions for taxation
provisions for environmental issues 1 575 750 -111 2 214 1 764 450
provisions for other liabilities and charges
2 227 914 -514 -203 -8 2 416 837 1 579
VII. Provisions 3 802 1 664 -625 -203 -8 0 0 4 630 2 601 2 029
2006
provisions for taxation
provisions for environmental issues 1 023 500 52 1 575 1 575 -
provisions for other liabilities and charges
379 2 213 -770 -43 448 2 227 934 1 293
VII. Provisions 1 402 2 713 -770 -43 448 52 3 802 2 509 1 293
The carrying amount of the provisions reflects the net
present value of future liabilities discounted at 8%.
The provisions for environmental issues consist mainly of a
provision relating to the cleaning of polluted soils in Temse
belonging to TIS NV and the land in Ardooie belonging
to Sioen Coating NV. The risk in Temse originates in
the period before the takeover. The risk in Ardooie was
identified during the periodical environmental check-up of
the site. These provisions are mainly set up for more than
one year and are discounted using the weighted average
capital cost of the Group.
provisions for other liabilities and charges mainly relate
to social costs of ongoing restructuring processes by
the coating division, by the apparel division and by the
chemicals division in france.
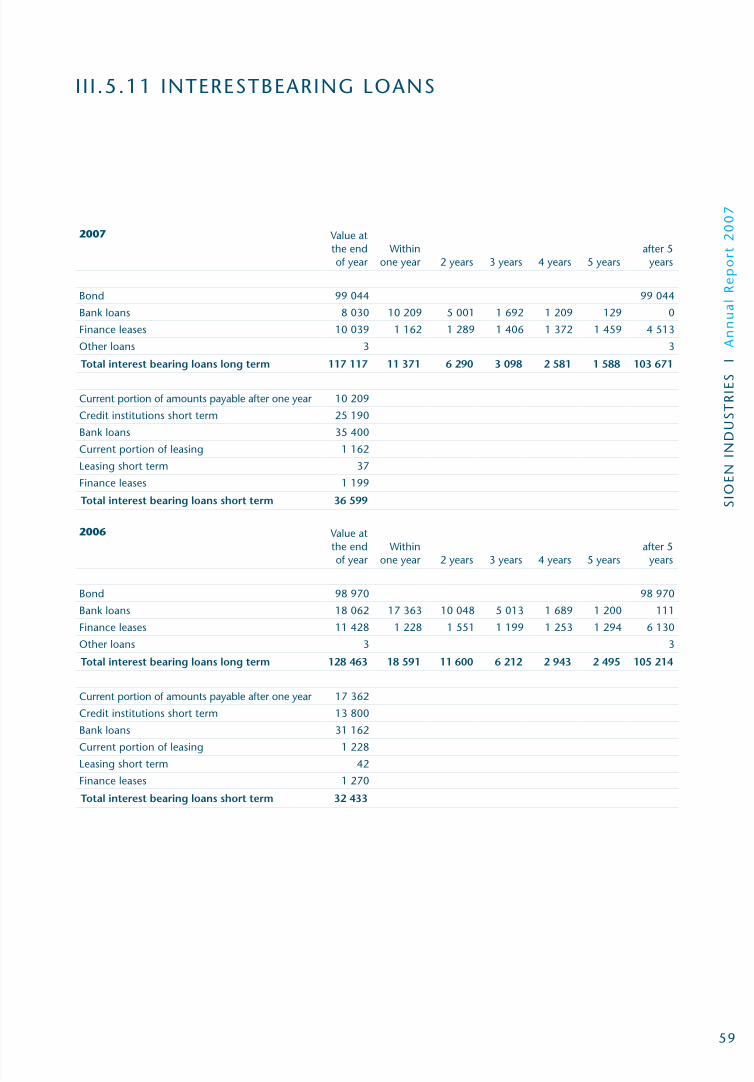
SIO
EN
IN
DU
ST
RIE
S
I A
nn
ua
l R
ep
ort
20
07
59
I I I .5.11 INTERESTBEARING LOANS
2007 Value at the end of year
Within one year 2 years 3 years 4 years 5 years
after 5 years
Bond 99 044 99 044
Bank loans 8 030 10 209 5 001 1 692 1 209 129 0
finance leases 10 039 1 162 1 289 1 406 1 372 1 459 4 513
Other loans 3 3
Total interest bearing loans long term 117 117 11 371 6 290 3 098 2 581 1 588 103 671
Current portion of amounts payable after one year 10 209
Credit institutions short term 25 190
Bank loans 35 400
Current portion of leasing 1 162
Leasing short term 37
finance leases 1 199
Total interest bearing loans short term 36 599
2006 Value at the end of year
Within one year 2 years 3 years 4 years 5 years
after 5 years
Bond 98 970 98 970
Bank loans 18 062 17 363 10 048 5 013 1 689 1 200 111
finance leases 11 428 1 228 1 551 1 199 1 253 1 294 6 130
Other loans 3 3
Total interest bearing loans long term 128 463 18 591 11 600 6 212 2 943 2 495 105 214
Current portion of amounts payable after one year 17 362
Credit institutions short term 13 800
Bank loans 31 162
Current portion of leasing 1 228
Leasing short term 42
finance leases 1 270
Total interest bearing loans short term 32 433

60 I SIOEN INDUSTRIES I Annual Report 2007
Interest Bearing Loans
This note provides information about the group’s interest-
bearing loans.
Long-term interest bearing loans, including financial
long-term leasing debts.
The weighted average interest rate of long-term debts in
2007 was 4.76%, compared to 4.77% in 2006.
All long-term loans have a fixed interest rate.
In 2006, a EUR 20 million variable-rate roll-over loan was
prerepaid on 14 march 2006 without additional cost. This
‘bullet’ loan was taken up on 20 December 2005 with an
expiry date of 30 June 2007.
On 14 march 2006, a EUR 100 million bond listed on
Eurolist by Euronext Brussels was successfully issued, with
a ten-year term and fixed coupon interest of 4.75%. To
cover the interest rate on this bond issue, an IRS (Interest
Rate Swap) was concluded on 20 December 2005. This
IRS is described in the note on ‘financial instruments’, and
designated as ‘cash flow hedging’. The effective combined
interest rate on the EUR 100 million bond is 4.72%.
Sioen has no covenants on material loan agreements,
except for general terms and conditions applicable to
general finance agreements in Belgium.
Short-term interest bearing loans
As per 31/12/2007, short-term loans amounted to
EUR 21.3 million. They consist of EUR 16.8 million of
euro straight loans with a weighted average interest rate
of 4.6% and a dollar loan of USD 5.0 million at 5.7%.
There is also a tax prepayment loan of EUR 3.5 million
which expires on 10 April 2008.
At 31/12/2006, short-term straight loans amounted to
EUR 13.8 million.
No securities have been issued for these financial debts.
Most (approx. 90%) of the Group’s financial liabilities are
centrally contracted and managed.

SIO
EN
IN
DU
ST
RIE
S
I A
nn
ua
l R
ep
ort
20
07
61
I I I .5.12 fINANCIAL LEASING DEBTS
Obligations under financial leases
2007
Value at the end of year
Within one year 2 years 3 years 4 years 5 years
after 5 years
Leasing and other similar obligations LT 10 039 61 1 228 1 406 1 372 1 459 4 513Current portion of leasing 1 162 1 162Leasing short term 37 37 5 27Obligations under financial leases 11 238 1 260 1 233 1 433 1 372 1 459 4 513
Minimum lease payments
Present value of lease payments
Lease payments due within one year 2 143 1 260One - Two years 1 735 1 233Two - Three years 1 737 1 433Three - Five years 3 064 1 372After 5 years 4 954 1 459Total lease payments 14 051 4 513Future financial charges 2 611present value of lease obligations 10 767 10 767Less amount due for settlement within 12 months 1 260Amount due for settlement after 12 months 9 979
Obligations under financial leases
2006
Value at the end of year
Within one year 2 years 3 years 4 years 5 years
after 5 years
Leasing and other similar obligations LT 11 428 1 551 1 199 1 253 1 294 6 130Current portion of leasing 1 228 1 228Leasing short term 42 42Obligations under financial leases 12 698 1 270 1 551 1 199 1 253 1 294 6 130
Minimum lease payments
Present value of lease payments
Lease payments due within one year 0 1 270One - Two years 2 125 1 485Two - Three years 1 984 1 406Three - Five years 1 740 1 228After 5 years 3 480 7 309Total lease payments 6 683 12 698Future financial charges 16 067 12 753present value of lease obligations 3 314 0Less amount due for settlement within 12 months 1 270Amount due for settlement after 12 months 11 428
Leasing debts mainly relate to buildings (Ardooie, Flixecourt and Moeskroen). The interest inherent in the leases is fixed for
the entire lease term. The average effective interest rate contracted is approximately 5.44% p.a. (2006 5.44% p.a.).

62 I SIOEN INDUSTRIES I Annual Report 2007
I I I .5.13 OTHER ACCOUNTS pAyABLE
Trade accounts payable and other debts
2007
Trade payables 35 609
Credit notes to receive -2 048
Advances 630
Total 34 191
2006
Trade payables 33 104
Credit notes to receive -2 010
Advances 650
Total 31 744
Trade and other payables include outstanding amounts for trade purchases and current charges. Trade payables increased
compared with 2006, in line with the increased activity.
The trade payables are payable within a range of 30 to 60 days. The group has no major overdue positions. foreign
currencies in trade payables relate mainly to USD and represent less than 10% of the total trade payables.
Other debts up to one year
Other Accounts payables (non-financial instrument)
2006 2007
Current tax liabilities 3 449 440
Social debts 9 466 10 523
Other 5 461 4 548
Accrued charges and deferred income 1 145 1 159
Total other debts up to one year 19 521 16 670
The other liabilities consist mainly of VAT payable and various other taxes.

SIO
EN
IN
DU
ST
RIE
S
I A
nn
ua
l R
ep
ort
20
07
63
I I I .5.14 fINANCIAL INSTRUmENTS
Financial Derivatives 2006 2007
Notional Value
Fair Value Notional Value
Fair Value
forward sales contracts
forward sales contracts within 1 year
Rights 7 375 62 0 0
Obligations 11 063 -85 2 353 -41
IRS forward 100 000 1 346 0 0
The Group manages a portfolio of derivatives to hedge
against risks relating to exchange rate and interest rate
positions arising as a result of operating and financial
activities. It is the Group’s policy to avoid engaging in
speculative transactions or transactions with a leverage
effect and not to hold derivatives for trading purposes.
Interest risk
The Group’s interest risk is relatively limited, as the interest
rate on all long-term loans is fixed. It is the group’s
strategy to arrange a fixed interest rate for the long-term
portion of debts, and to keep short-term debts floating.
Thanks to an optimal portfolio of long-term and short-
term debt financing, potential negative interest rate
fluctuations are minimised.
As per 31/12/2007, there was EUR 21.4 million of short-
term financing at floating rates with a weighted average
of 4.73%. A 5% increase in interest rates (24 basispoints),
would impact the financial result with 51 kEUR more
interest costs an annual basis.
In connection with the group’s refinancing, it was
decided in December 2005 to enlist the support of the
capital market via the issue of a EUR 100 million bond
over ten years with fixed coupon interest. Because such
an operation can easily take three months, and interest
rates at the end of December 2005 were very attractive,
Sioen concluded a ten-year IRS starting in April 2006, the
presumed starting date of the bond. As this IRS can be
regarded as effective cash flow hedging as per IAS39, the
EUR 0.636 million negative market value fluctuation on
31/12/2005 of this IRS was deducted from equity.
At 02/02/2006, the market value was up EUR 1.346
million, and it was realised following the hedge strategy
at the moment of issuing of the bond. This received
premium satisfies the conditions for cash flow hedging
defined in IAS39, and will be spread out over the term of
the bond.
The realized capital gain (EUR 1.346 million) was
recognised in equity and is being taken into income over
the life of the bond (10year).
Exchange rate risk
It is the Group’s policy to hedge against exchange risks
arising from financial and operating activities centrally.
The risks are limited by compensating for transactions
in the same currency (‘natural hedging’), or by fixing
exchange rates via forward contracts or options.
The main currencies for the Sioen Group are GBP (inflow)
and USD (outflow). In 2007, the GBP net inflow represents
EUR 17 million (GBp 12.5 million) and the USD net
outflow EUR 6.1 million (USD 9 million). As these volumes
represent less than 10% of total net sales, the impact of
changes in these exchange rates is limited.
The fluctuation in the market value of exchange rate
contracts has been included in the profit and loss account
and amounted to a EUR 41k negative balance in 2007 and
a EUR 23k negative balance in 2006.

64 I SIOEN INDUSTRIES I Annual Report 2007
I I I .5.14 fINANCIAL INSTRUmENTS
Credit risk
In view of the relative concentration of credit risk (see
note ‘trade receivables’). The company covers credit risk
on trade receivables via a stop loss insurance with an own
risk exposure of EUR 500 k. In addition, credit control
strategies and procedures have been elaborated in order
to monitor individual customers’ credit risk.
Liquidity risk
In order to guarantee liquidity and financial flexibility,
the Sioen group has credit lines available to meet current
and future financial needs. The Sioen group has total
credit lines available of EUR 81.5 million. Of these
EUR 20.5 million were used at 31/12/2007. Of this
amount, EUR 16.8 million consisted of straight loans at a
weighted average interest rate of 4.6%, and a
USD 5 million straight loan at 5.7%.
Fair value
fair value is the amount for which an asset could be
exchanged, or a liability settled, between knowledgeable,
willing parties in an arm’s length transaction. In
conformity with IAS 39 all derivatives are recognized at fair
value in the balance sheet.
Non-derivative financial liabilities
The fair value of non-derivate financial liabilities is
calculated based on commonly-used valuation techniques
(i.e. net present value of future principal and interest cash
flows discounted at market rate). These are based on
market inputs from reliable financial information providers.
fair values determined by reference to prices provided
by reliable financial information providers are periodically
checked for consistency against other pricing sources.
financial InstrumentsInterest bearing loans
Fixed Rate (EUR) Carrying Amount
Fair value
Bond 100 000 96 885
borrowing costs capitalised -956 0
finance Leases 11 089 11 305
Bank loans 18 355 18 203
Total 128 488 126 393
As shown in the fair value analysis, Sioen Industries is now
in an overall favourable position concerning interest rate
conditions compared to the actual fair values of the loans.
Capital management
The equity structure of the Sioen Group is managed with
the main objectives of:
• protecting the equity structure so as to ensure
continuous business operations resulting in continuous
shareholder value, and benefits for other stakeholders;
• the payment of an appropriate dividend to shareholders.
The Group’s capital is formed in accordance with the risk,
which changes with economic developments and the
risk profile of the underlying assets. The Sioen group can
change the dividend to shareholders, issue new shares
or sell assets in order to maintain or change the capital
structure.
The Board of Directors of Sioen Industries views equity
together with the 10-year bond loan (cf. interest bearing
loans III.5.11) as permanent capital. At 31/12/2007 equity
and the bond loans represented respectively 39.3% and
26.2% and together 65.5% of the balance sheet total.

SIO
EN
IN
DU
ST
RIE
S
I A
nn
ua
l R
ep
ort
20
07
65
I I I .5.15 DEFERRED TAX
2006 2007 2006 2007deferred tax asset deferred tax liability
Intangible fixed assets 399 545 1 697 1 792Tangible fixed assets 2 868 2 894 16 178 16 847Inventories 1 656 1 688Receivables 253 762Other assets 0pension liabilities 512 648Other provisions 339 518Other liabilities 59 102Conversion differences 74 156 1 937 2 433Hedging reserves 458 398Undistributed reserves 2 152 2 095Tax losses carried forward 10 952 9 662Total 17 112 16 976 22 422 23 565
non recognition of deferred tax receivable -6 851 -6 829Netting -4 062 -4 702 -4 062 -4 702Total 6 199 5 445 18 360 18 863
The value of carried-forward tax losses arranged by expiry dateOne yearTwo yearsThree years four years 2 037 8 260five years and later 17 557 7 806No expiry date 16 319 16 590
Unrecognised carried forward tax losses 17 273 20 195
Unrecognised deferred tax on undistributed reserves 306 295
Deferred tax assets which do not appear to be collectable
in the near future are not recognized. In this assessment
the management takes account of budgets and multi-year
planning.
The major deferred tax asset on tax loss carryforwards is
relative to Roland International BV. Compared with 2006, a
EUR 1.8 million valuation allowance on tax losses of Roland
International BV was recognized in 2007. Based upon
business plans an asset has been recognized using estimated
tax profits over 9 years.
The company recognizes deferred tax liabilities on
undistributed reserves in affiliates unless there is a firm
commitment not to distribute reserves from that particular
affiliate in the foreseeable future.
In the Netherlands the tax rate was decreased from 31.5%
to 25.5% in 2006, resulting to EUR 1.1 million additional tax
expense given the decrease in the deferred tax asset.
Reconciliation of movement of deferred tax
Net tax liability as per 31 December 2006 12 161
Net tax liability as per 31 December 2007 13 418
Difference 1 257
deferred tax as shown in the P&L 1 915
deferred tax effect through equity -149
deferred tax acquired via business combinations
-508

66 I SIOEN INDUSTRIES I Annual Report 2007
I I I .5.16 ACQUISITIONS AND DISpOSALS Of INTERESTS
EFFECTS OF ACQUISITIONS AND SALES OF INVESTMENTS
2007Divestment Granulates EMB
Sale price Granulate business 847Sale fixed assets 49Liability sales related provision -227Stock write off -428
Receipt in Cash 896Non Cash items -655Gain realised on the transaction 241
Acquisition Fillink Business (in ‘000 EUR) Book value Adjustments Fair value
Non current assets 215 1 285 1 500 Intangible and tangible fixed assets 215 1 285 1 500
Current assets 1 872 -319 1 553 Inventories 319 -319 -Debtors 1 440 - 1 440 Other debtors 113 - 113
Non current liabilities 355 - 355 Long term financial debt 355 355
Current liabilities 2 598 184 2 781 Creditors 2 180 84 2 264 Other creditors 418 100 517 Total net assets -865 -718 -83 Goodwill on acquisition 152
Paid in cash 206 Cash and banks acquired 137 137
Net cash paid 69

SIO
EN
IN
DU
ST
RIE
S
I A
nn
ua
l R
ep
ort
20
07
67
EmB (division chemicals) realized an exchange deal on
1 October 2007, in which the chips (granules) department
was sold and a pigment paste-customer portfolio was
acquired (see intangible assets), in order to align the
business with its core competence. EmB recorded the
gain of EUR 0.2 million in ‘Other operating Income’ in
2007.
The sales of this chips department represented in 2006
EUR 5.1 million and in 2007 EUR 4.7 million (January –
October 2007).
On January 18 2007 fillink Technologies SA was acquired
by EmB. fillink specializes in inks for wide and superwide
format digital printers. Fillink distributes eco-solvent,
solvent and UV inks through a selected network of
distributors. These quality products are very well
positioned in the market thanks to the know how and
market intelligence of the company. fillink’s experience
with unique product formulations and wide market
knowledge are real added value for the chemicals division.
The sales of fillink were EUR 2.2 million in 2006 and EUR
4.0 million in 2007.

68 I SIOEN INDUSTRIES I Annual Report 2007
I I I .5.16 ACQUISITIONS AND DISpOSALS Of INTERESTS
The Richard group (Richard s.a.s., Copidis s.a.s. and Astra
Colorants s.a.) was acquired on 27 October 2006.
The EUR 16.1 million acquisition cost was paid in cash.
The necessary market valuations have been performed
to determine the fair value of the customer portfolio and
the formulations. Richard Colorants is a french company
based at Lomme, near Lille. founded in 1864, the
company has specialized in pigment pastes since its early
days.
At end of September 2006, EmB bought the assets of
Siegwerk, a producer of inks and varnishes. These inks
and varnishes have numerous applications in the various
markets related to the EmB markets.
EFFECTS OF ACQUISITIONS AND SALES OF INVESTMENTS
2006Acquisition of Group Richard Colorants
Book value Adjustments Fair valueNon current assets 2 991 5 007 7 998 Intangible and tangible fixed assets 2 991 5 007 7 998
Current assets 15 588 -280 15 308 Inventories 4 402 -127 4 275 Debtors 6 113 -153 5 960 Other debtors - Cash and banks 5 073 5 073
Non current liabilities 1 168 2 238 3 406 provisions 548 209 757 pensions 353 353 Deferred tax liabilities 1 676 1 676 Long term financial debt 620 620
Current liabilities 3 965 636 4 601 Creditors 3 406 3 406 Other creditors 559 636 1 195 Total net assets 13 446 1 853 15 299 Goodwill on acquisition 752 Paid in cash 16 051
Acquisition of assets of Siegwerk Benelux NVCustomer portfolio 1 425 product portfolio 5 948 machinery 1 153 Goodwill 622 Deferred tax asset 380 Paid in cash 9 528

SIO
EN
IN
DU
ST
RIE
S
I A
nn
ua
l R
ep
ort
20
07
69
IV. Other
IV.1. Operating lease arrangements
2006 2007
Amounts recognised in income 1 172 1 150
payments due within one year 985 1 179
Between one and five years 905 1 092
Over five years 10
minimal future payments 1 889 2 282
These leases relate mainly to vehicles, small equipment and office equipment.
IV.2 Events after balance sheet date
No significant events have happened after balance sheet
date.
IV.3. Off balance sheet items
2007 within 1 year
Guarantees given as securities for debts or commitments
Rights due to hedging of foreign currencies
related to GBp
0 0
Commitments due to hedging of foreign currencies
related to GBp
2 353
2 353 2 353
Commitments for the acquisition of intangible and tangible assets 7 688
2006 within 1 year
Guarantees given as securities for debts or commitments
Rights due to hedging of foreign currencies
related to GBp
7 375
7 375 7 375
Commitments due to hedging of foreign currencies
related to GBp
11 063
11 063 11 063
Commitments for the acquisition of intangible and tangible assets 6 447

70 I SIOEN INDUSTRIES I Annual Report 2007
IV.4. Transactions with related parties
Nature of transaction 2007
Recticel Group Sale 1 764
Recticel Group purchase 222
INCH Sale 1 436
SVB purchase 227
Nature of transaction 2006Recticel Group Sale 1 945
Recticel Group purchase 264
INCH Sale 1 524
SVB purchase 0
These transactions are done on an arm’s length basis.Other transactions with related parties other than directors are not included, given the negligible amount (under EUR 100,000). With regard to directors’ remuneration, we refer to section V.6.B.
IV.5. Staff
Land 2006 2007Belgium 930 988
China 16 16
Germany 25 11
france 392 361
Ireland 38 33
Indonesia 1 900 1 975
Netherlands 6 27
poland 539 587
portugal 24 25
Tunesia 766 752
UK 28 32
USA 23 22
Ukraine 40
Grand Total 4 687 4 869
Blue Collar 3 816 4 125
White Collar 871 744
Grand Total 4 687 4 869

SIO
EN
IN
DU
ST
RIE
S
I A
nn
ua
l R
ep
ort
20
07
71
2007 DeloitteAudit fees 277
Other assurance services 41
Tax services 14
IV.7 Contingent assets and liabilities
A number of commercial disputes are pending, albeit with
a limited value in dispute.
A contingent asset amounting to EUR 0.4 million is related
to the apparel division.
The industrial applications division is currently facing a
quality claim in france, which could reach EUR 3 million.
However, the court verdict in first instance was in favour of
Sioen Industries.
IV.6. Audit and non audit services provided by the statutory auditor and his network

72 I SIOEN INDUSTRIES I Annual Report 2007
In 2007 the following fees were paid to the members of
the board of directors and the executive management:
• Non-executive and independent directors, as well as the
members of the executive management in their capacity
as director:
Mr. Jean-Jacques Sioen EUR 20,000
mJS Consulting b.v.b.a. (represented by
mrs. michèle Sioen)
EUR 20,000
Mrs. Jacqueline Sioen-Zoete EUR 20,000
D-Lance b.v.b.a. (represented by
mrs. Danielle Sioen)
EUR 20,000
p. Company b.v.b.a. (represented by
mrs. pascale Sioen)
EUR 20,000
pol Bamelis n.v. (represented by
mr. pol Bamelis)
EUR 22,250
Revam b.v.b.a. (represented by
mr. Wilfried Vandepoel)
EUR 29,000
Louis Verbeke e.b.v.b.a. (represented
by Mr. Louis-Henri Verbeke)
EUR 26,000
K.E.m.p. n.v. (represented by
mr. Luc Sterckx)
EUR 26,000
Vean n.v. (represented by
mr. Luc Vansteenkiste
EUR 21,500
• Mrs. Michèle Sioen received in 2007 as CEO, besides her
remuneration as a member of the board of directors,
a fixed remuneration of EUR 419,491. She received a
variable remuneration for 2007 in an amount of EUR
125,286.
• The fixed remunerations paid to the executive
management(*), including directors in their capacity as
members of the executive management, amounted to
EUR 2,011,567 (excluding CEO). Variable remuneration
for 2007 in an amount of EUR 208,658 was granted. This
includes contributions to pension insurance and other
remuneration related expenses.
• All sums mentioned above are gross sums and represent
the entire cost to the Company.
In 2007 no shares in Sioen Industries, share options or
other rights for the acquisition of shares in Sioen Industries
were granted to the CEO and the other members of the
executive management. There are no specific recruitment
or golden handske agreements with the members of the
executive management.
IV.8 Remuneration of the directors and the executive management
(*) The executive management consists of executive directors and members of the management committee.

SIO
EN
IN
DU
ST
RIE
S
I A
nn
ua
l R
ep
ort
20
07
73
V. Statutory auditor’s report
STATUTORy AUDITOR’S REpORT TO THE SHAREHOLDERS’
mEETING ON THE CONSOLIDATED fINANCIAL
STATEmENTS fOR THE yEAR ENDED
31 DECEmBER 2007
free translation – the original report is in Dutch
To the shareholders
As required by law and the company’s articles of
association, we are pleased to report to you on the
audit assignment which you have entrusted to us.
This report includes our opinion on the consolidated
financial statements together with the required additional
comment.
Unqualified audit opinion on the consolidated
financial statements
We have audited the accompanying consolidated financial
statements of Sioen Industries NV (“the company”)
and its subsidiaries (jointly “the group”), prepared
in accordance with International financial Reporting
Standards as adopted by the European Union and with the
legal and regulatory requirements applicable in Belgium.
Those consolidated financial statements comprise the
consolidated balance sheet as at 31 December 2007,
the consolidated income statement, the consolidated
statement of changes in equity and the consolidated
cash flow statement for the year then ended, as well as
the summary of significant accounting policies and other
explanatory notes. The consolidated balance sheet shows
total assets of 378.112 (000) EUR and a consolidated
profit (group share) for the year then ended of 19.186
(000) EUR.
The financial statements of several significant entities
included in the scope of consolidation which represent
total assets of 50.688 (000) EUR and a turnover of 49.330
(000) EUR have been audited by other auditors. Our
opinion on the accompanying consolidated financial
statements, insofar as it relates to the amounts contributed
by those entities, is based upon the reports of those other
auditors.
The board of directors of the company is responsible
for the preparation of the consolidated financial
statements. This responsibility includes among other
things: designing, implementing and maintaining internal
control relevant to the preparation and fair presentation
of consolidated financial statements that are free from
material misstatement, whether due to fraud or error,
selecting and applying appropriate accounting policies,
and making accounting estimates that are reasonable in
the circumstances.
Our responsibility is to express an opinion on these
consolidated financial statements based on our audit.
We conducted our audit in accordance with legal
requirements and auditing standards applicable in
Belgium, as issued by the “Institut des Reviseurs
d’Entreprises/Instituut der Bedrijfsrevisoren”. Those
standards require that we plan and perform the audit to
obtain reasonable assurance whether the consolidated
financial statements are free from material misstatement.
In accordance with these standards, we have performed
procedures to obtain audit evidence about the amounts
and disclosures in the consolidated financial statements.
The procedures selected depend on our judgment,
including the assessment of the risks of material
misstatement of the consolidated financial statements,
whether due to fraud or error. In making those risk
assessments, we have considered internal control relevant
to the group’s preparation and fair presentation of the
consolidated financial statements in order to design audit
procedures that are appropriate in the circumstances
but not for the purpose of expressing an opinion on the
effectiveness of the group’s internal control. We have
assessed the basis of the accounting policies used, the
reasonableness of accounting estimates made by

74 I SIOEN INDUSTRIES I Annual Report 2007
the company and the presentation of the consolidated
financial statements, taken as a whole. Finally, the board
of directors and responsible officers of the company
have replied to all our requests for explanations and
information. We believe that the audit evidence we have
obtained, together with the reports of other auditors on
which we have relied, provides a reasonable basis for our
opinion.
In our opinion, and based upon the reports of other
auditors, the consolidated financial statements give a true
and fair view of the group’s financial position as of 31
December 2007, and of its results and its cash flows for the
year then ended, in accordance with International financial
Reporting Standards as adopted by the EU and with the
legal and regulatory requirements applicable in Belgium.
Additional comment
The preparation and the assessment of the information
that should be included in the directors’ report on the
consolidated financial statements are the responsibility of
the board of directors.
Our responsibility is to include in our report the following
additional comment which does not change the scope
of our audit opinion on the consolidated financial
statements:
•The directors’ report on the consolidated financial
statements includes the information required by law
and is in agreement with the consolidated financial
statements. However, we are unable to express an opinion
on the description of the principal risks and uncertainties
confronting the group, or on the status, future evolution,
or significant influence of certain factors on its future
development. We can, nevertheless, confirm that the
information given is not in obvious contradiction with any
information obtained in the context of our appointment.
Diegem, 13 march 2008
The Statutory Auditor
DELOITTE Bedrijfsrevisoren
BV o.v.v.e. CVBA
represented by
Dirk Van Vlaenderen Kurt Dehoorne
V. Statutory auditor’s report

SIO
EN
IN
DU
ST
RIE
S
I A
nn
ua
l R
ep
ort
20
07
75
VI. Statutory annual accounts Of I SIOEN INDUSTRIES NV
Condensed balance sheet of Sioen Industries n.v. after appropriation of profit
December 31 (000) EUR 2007
2006
fixed assets 61 584 61 459
II. Intangible fixed assets 7 505 5 934
III. Tangible fixed assets 1 004 1 170
IV. Financial fixed assets 53 075 54 355
Currents assets 188 049 179 902
VII. Amounts receivable within one year 187 023 178 807
IX. Cash at hand and in bank 872 825
X. Deferred charges and accrued income 154 270
Total assets 249 633 241 361
Capital and reserves 82 705 80 814
I. Capital 46 000 46 000
IV. Legal reserves 4 352 3 766
V. Profit brought forward 32 353 31 048
Creditors 166 929 160 547
VIII. Amounts payable after one year 106 312 115 765
IX. Amounts payable within one year 54 983 39 588
X. Accrued charges and deferred income 5 634 5 194
Total liabilities 249 633 241 361
The statutory annual accounts of the parent company
Sioen Industries n.v. are shown below in condensed form.
In June 2008, the annual report and annual accounts of
Sioen Industries n.v. and the auditor’s report will be filed
with the National Bank of Belgium in accordance with
Articles 98-102 of the Companies Act.
These reports are available on request at the following
address:
Sioen Industries n.v. – fabriekstraat 23 – 8850 Ardooie.
The statutory auditor has issued an unqualified opinion
with explanatory paragraph on the statutory financial
statements of Sioen Industries NV. The explanatory
paragraph is as follows:
Without qualifying the unqualified opinion expressed
above, we draw the attention to the annual report.
Sioen Industries NV has per December 31, 2007, a
total outstanding receivable of 12,5mio EUR on Roland
International BV, a 100% subsidiary of Sioen Industries
NV. In addition, Sioen Coating Distribution NV, a 100%
subsidiary of Sioen Industries NV, has outstanding
receivables on Roland International BV for an amount
of 16,1mio EUR. The realisation of these amounts is
dependent of the further successful development of the
implemented recovery plan. The accompanying financial
statements do not included any less values or provisions
relating to the above.

76 I SIOEN INDUSTRIES I Annual Report 2007
Condensed income statement of Sioen Industries n.v.
December 31 (000) EUR 2007 2006
I. Operating income 7 188 5 922
A. Sales 6 912 5 715
D. Other operating income 277 207
II. Operating charges -8 363 -7 022
B. Services and other goods 3 280 2 897
C. Renumeration 3 726 3 060
D. Depreciation and amounts written off 1 344 944
G. Other operating charges 14 121
III. Operating profit/loss -1 175 -1 100
IV financial income 21 736 24 581
V. financial charges -8 110 -7 438
Financial result 13 626 17 143
VI. Profit on ordinary activities 12 452 16 043
VII. Extraordinary result -711 -7 402
Ix. Profit before tax 11 741 8 641
x. Income taxes -25 -99
xI. Profit for the financial year 11 716 8 542
VI. Statutory annual accounts Of I SIOEN INDUSTRIES NV

SIO
EN
IN
DU
ST
RIE
S
I A
nn
ua
l R
ep
ort
20
07
77
Activity of Sioen Industries
The function of Sioen Industries is essentially to outline
the strategy of the four divisions. It also appoints the
management of the Group companies and supports the
Group companies in the areas of personnel management,
financial and treasury management, budgeting and
controlling, mIS and IT, and legal affairs.
Comments
The turnover of the holding company increased with
20.9% to EUR 6.9 million. In 2007 the operating loss
amounted to EUR 1.2 million, compared with an operating
loss in 2006 of EUR 1.1 million. financial Income
decreased from EUR 17.1 million in 2006 to EUR 13.6
million in 2007 explained by the lower dividend payments
from the subsidiaries.
All participating interests have been recorded at book
value. Extraordinary result for the year 2007 increased by
EUR 6.7 million compared to 2006 due to adjusted book
values of participation interests at the end of last year.
Accounting principles
The accounting principles and translation rules applied to
the statutory annual accounts of Sioen Industries are in
accordance with Belgian Generally Accepted Accounting
principles.
Statement of capital
In accordance with Articles 1 to 4 of the Act of march 2,
1989 concerning the disclosure of important holdings
in listed companies and regulating take-over bids,
the applicable quotas were set at, on the one hand, 5
percent or a multiple thereof and on the other hand
at 3 percent or a multiple thereof. (Article 8 of the
Articles of Association). In accordance with Article 4 of
the Act of March 2, 1989, the following notifications of
shareholdings in the company were received:
(1) Sihold n.v. is controlled by Sicorp n.v., which is controlled in turn by the Dutch foundation Stichting Administratiekantoor Midapa.
Situation at 31 March 2008
Notifying party Date of notification
Number of shares
Percentage of total number of
shares
Sihold n.v.(1)
fabriekstraat 23, 8850 Ardooie 18 October 1996 13,336,501 62.5%
Notification of change of percentage shareholding
Sihold n.v. 12 October 2005 12,715,010 59.4%
“Stichting Shell Pensioenfonds” 12 October 2005 726,320 3.4%
Sihold n.v. 30 January 2006 12,906,212 60.3%
Total number of shares 21,391,070 100.0%
This foundation is controlled by the Sioen family.

78 I SIOEN INDUSTRIES I Annual Report 2007
VII. Proposal to the annual meeting
Proposals to the Annual Meeting of Sioen Industries n.v.
of April 25, 2008
The board of directors of Sioen Industries proposes to
the annual meeting to approve the annual accounts at
December 31, 2007 and to consent to the appropriation
of profit.
The profit for the financial year ended is 11 716 461 EUR,
compared to a profit of 8 542 378 EUR for the financial
year 2006. The profit brought forward from the previous
financial year is 31 048 176 EUR. The profit available for
appropriation is consequently 42 764 637 EUR.
The board of di42,764,637poses to appropriate the
profit available for appropriation of 42,764,637
EUR as follows:
(in EUR)
Gross dividends for the 21.391.070 shares 9 625 982
Directors’ fees 200 000
Transfer to the legal reserves 585 823
Profit to be carried forward (32 352 833)
The proposed net dividend per share is
calculated as follows:
(in EUR)
Net dividend per share 0.3375
Withholding tax 25/75 0.1125
Gross dividend per share 0.4500
Pay-out ratio (1) 50.17%
(1) Gross dividend in relation to the share of the Group in the consolidated result
The proposed dividend is 73.1% higher than that of 2006.
If this proposal is accepted, the net dividend of 0,3375
EUR per share will be made payable as from may 9, 2008
onwards at the counters of Dexia Bank, ING Bank, fortis
Bank, Bank Degroof and KBC Bank on presentation of
coupon n°10.

SIO
EN
IN
DU
ST
RIE
S
I A
nn
ua
l R
ep
ort
20
07
79
Definitions
Gross margin % (Turnover +/- stock movements finished goods - purchases raw materials -/+ stock
movements raw materials)/turnover
EBITDA Earnings Before Interest, Taxes, Depreciation and Amortization = Operating profit +
amortization + provisions for liabilities and other risks + depreciation
EBIT Earnings Before Interest and Taxes = Operating profit
REBIT EBIT + non recurring costs
REBITDA EBITDA + non recurring costs
EBT Profit Before Taxation
EAT Profit After Taxation
NOPAT EBIT - Taxes
EVA NOPAT - cost of capital at start of the period
ROE Net result part of the group / equity at end of previous financial year
ROCE NOpAT / Capital employed of the period
Cash flow consolidated net profit + depreciation + amortization + provisions for liabilities and charges
+ deferred taxes
FFO Net result + depreciations + provisions for liabilities and taxes + amortization + deferred
taxes.
Free operating CF Funds from operations - funds from investing activities
Working capital Financial fixed assets + current assets (minus cash deposits and cash equivalents) - non
financial debt up to one year - accrued charges and deferred income.
Capital employed Working capital + tangible and intangible fixed assets + goodwill
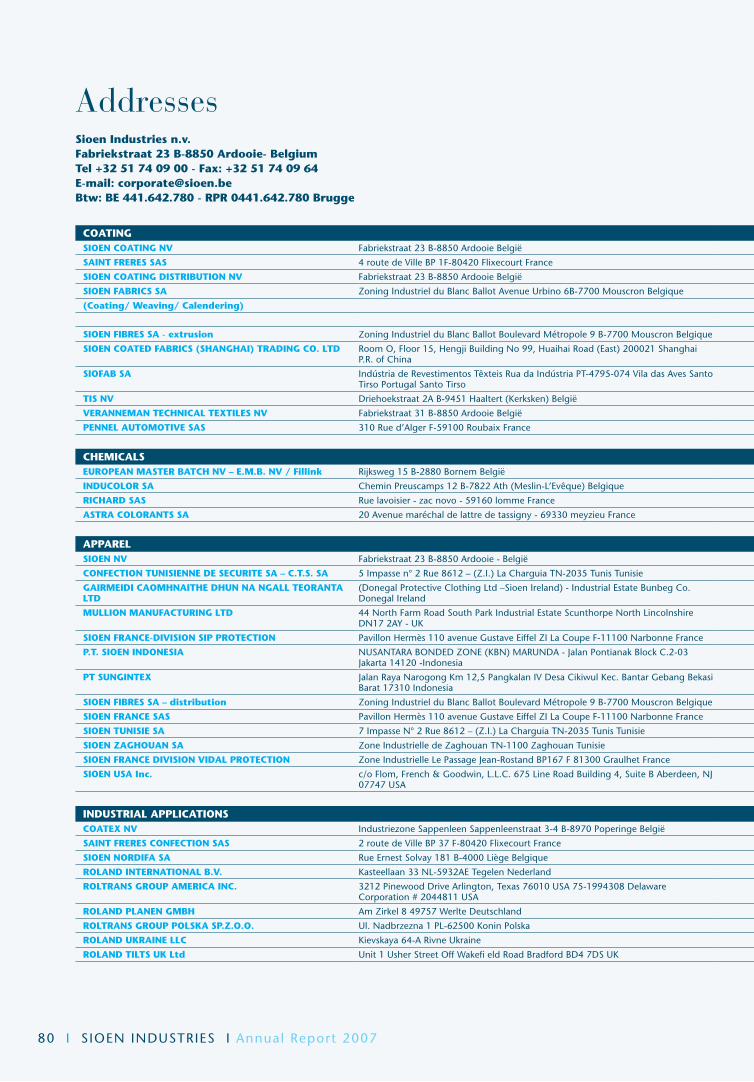
80 I SIOEN INDUSTRIES I Annual Report 2007
Addresses
COATINGSIOEN COATING NV Fabriekstraat 23 B-8850 Ardooie België BTW BE 402.753.106 RpR 0402.753.106 Brugge T +32 51 74 09 00 f +32 51 74 09 64 [email protected]
SAINT FRERES SAS 4 route de Ville BP 1F-80420 Flixecourt France TVA fR 76408448850 RCS AmIENS B 408 448 850 T +33 322 51 51 45 f +33 322 51 51 49 [email protected]
SIOEN COATING DISTRIBUTION NV Fabriekstraat 23 B-8850 Ardooie België BTW BE 436.241.167 RpR 0436.241.167 Brugge T +32 51 74 09 00 f +32 51 74 09 64 [email protected]
SIOEN FABRICS SA Zoning Industriel du Blanc Ballot Avenue Urbino 6B-7700 Mouscron Belgique TVA BE 458.801.684 Rpm 0458.801.684 Tournai
(Coating/ Weaving/ Calendering) T +32 56 85 68 80 f +32 56 34 61 31 [email protected]
T +32 56 85 01 40 f +32 56 85 01 49 [email protected]
SIOEN FIBRES SA - extrusion Zoning Industriel du Blanc Ballot Boulevard Métropole 9 B-7700 Mouscron Belgique TVA BE 463.789.464 Rpm 0463.789.464 Tournai T+32 56 48 12 70 f+32 56 48 12 85 [email protected]
SIOEN COATED FABRICS (SHANGHAI) TRADING CO. LTD Room O, floor 15, Hengji Building No 99, Huaihai Road (East) 200021 Shanghai p.R. of China
T+86 21 63 84 25 21 f+86 21 63 84 27 39 [email protected]
SIOFAB SA Indústria de Revestimentos Têxteis Rua da Indústria PT-4795-074 Vila das Aves Santo Tirso portugal Santo Tirso
SOB O N° 4641 NIf 505.046.644 T+351 252 87 47 14 f+351 252 94 29 68 [email protected]
TIS NV Driehoekstraat 2A B-9451 Haaltert (Kerksken) België BTW BE 405.085.064 RpR 0405.085.064 Aalst T+32 53 85 92 20 f+32 53 85 92 56 [email protected]
VERANNEMAN TECHNICAL TExTILES NV Fabriekstraat 31 B-8850 Ardooie België BTW BE 429.387.623 RpR 0429.387.623 Brugge T+32 51 24 81 70 f+32 51 22 61 68 [email protected]
PENNEL AUTOMOTIVE SAS 310 Rue d’Alger F-59100 Roubaix France TVA fR 53448273615 RCS Roubaix-Tourcoing B 448 273 615 T+33 320 76 21 10 f+33 320 76 21 12 [email protected]
CHEMICALSEUROPEAN MASTER BATCH NV – E.M.B. NV / Fillink Rijksweg 15 B-2880 Bornem België BTW BE 421.485.289 RpR 0421.485.289 mechelen T+32 3 890 64 00 f+32 3 899 26 03 [email protected]
INDUCOLOR SA Chemin Preuscamps 12 B-7822 Ath (Meslin-L’Evêque) Belgique TVA BE 400.685.125 Rpm 0400.685.125 Tournai T+32 68 25 02 30 f+32 68 55 26 02 [email protected]
RICHARD SAS Rue lavoisier - zac novo - 59160 lomme France T+33 320 00 18 88 f+33 320 00 18 80 [email protected]
ASTRA COLORANTS SA 20 Avenue maréchal de lattre de tassigny - 69330 meyzieu France + 33 478 31 58 02 f+33 478 04 02 57 [email protected]
APPARELSIOEN NV Fabriekstraat 23 B-8850 Ardooie - België BTW BE 478.652.141 RpR 0478.652.141 Brugge T+32 51 74 08 00 f+32 51 74 09 62 [email protected]
CONFECTION TUNISIENNE DE SECURITE SA – C.T.S. SA 5 Impasse n° 2 Rue 8612 – (Z.I.) La Charguia TN-2035 Tunis Tunisie Code TVA 03030 V / A / m / 000 RC B 133171996 T+216 71 77 34 77 f+216 71 78 40 47 [email protected]
GAIRMEIDI CAOMHNAITHE DHUN NA NGALL TEORANTA LTD
(Donegal Protective Clothing Ltd –Sioen Ireland) - Industrial Estate Bunbeg Co. Donegal Ireland
VAT IE 4621355m Company Nr. 78212 T+353 74 953 11 69 f+353 74 953 15 91 [email protected]
MULLION MANUFACTURING LTD 44 North farm Road South park Industrial Estate Scunthorpe North Lincolnshire DN17 2AY - UK
VAT GB 365.1873.34 Company Nr. 1871440 T+44 1724 28 00 77 f+44 1724 28 01 46 [email protected]
SIOEN FRANCE-DIVISION SIP PROTECTION Pavillon Hermès 110 avenue Gustave Eiffel ZI La Coupe F-11100 Narbonne France TVA fR 49300774767 RCS Narbonne B 300 774 767 T+33 4 68 42 35 15 f+33 4 68 42 27 43 [email protected]
P.T. SIOEN INDONESIA NUSANTARA BONDED ZONE (KBN) MARUNDA - Jalan Pontianak Block C.2-03Jakarta 14120 -Indonesia
NPWP 1.068.001.5-052 T+62 21 44853222 f+62 21 44853444 [email protected]
PT SUNGINTEx Jalan Raya Narogong Km 12,5 pangkalan IV Desa Cikiwul Kec. Bantar Gebang Bekasi Barat 17310 Indonesia
NPWP 1.068.012.2-407 T+62 21 825 22 22 f+62 21 825 44 44 [email protected]
SIOEN FIBRES SA – distribution Zoning Industriel du Blanc Ballot Boulevard Métropole 9 B-7700 Mouscron Belgique TVA BE 463.789.464 Rpm 0463.789.464 Tournai T+32 56 85 54 30 T+32 56 34 66 10 [email protected]
SIOEN FRANCE SAS Pavillon Hermès 110 avenue Gustave Eiffel ZI La Coupe F-11100 Narbonne France TVA fR 49300774767 RCS Narbonne B 300 774 767 T+33 4 68 42 35 15 f+33 4 68 42 27 43 [email protected]
SIOEN TUNISIE SA 7 Impasse N° 2 Rue 8612 – (Z.I.) La Charguia TN-2035 Tunis Tunisie Code TVA 614715 S / A / m / 000 RC B 19711998 T+216 71 80 75 47 f+216 71 80 92 62 [email protected]
SIOEN ZAGHOUAN SA Zone Industrielle de Zaghouan TN-1100 Zaghouan Tunisie Code TVA 747023 f / A / m / 000 RC B 177132000 T+216 72 68 06 60 f+216 72 68 26 60 [email protected]
SIOEN FRANCE DIVISION VIDAL PROTECTION Zone Industrielle Le Passage Jean-Rostand BP167 F 81300 Graulhet France T+33 5 63 34 52 46 f+33 5 63 34 69 99 [email protected]
SIOEN USA Inc. c/o Flom, French & Goodwin, L.L.C. 675 Line Road Building 4, Suite B Aberdeen, NJ 07747 USA
T+1 732 441 12 50 f+1 732 441 12 53 [email protected]
INDUSTRIAL APPLICATIONSCOATEx NV Industriezone Sappenleen Sappenleenstraat 3-4 B-8970 Poperinge België BTW BE 434.140.425 RpR 0434.140.425 Ieper T+32 57 34 61 60 f+32 57 33 35 23 [email protected]
SAINT FRERES CONFECTION SAS 2 route de Ville BP 37 F-80420 Flixecourt France TVA fR 44408449098 RCS Amiens 408 449 098 T+33 322 51 51 70 f+33 322 51 51 79 [email protected]
SIOEN NORDIFA SA Rue Ernest Solvay 181 B-4000 Liège Belgique TVA BE 474.276.154 Rpm 0474.276.154 Liège T+32 4 252 21 50 f+32 4 253 04 25 [email protected]
ROLAND INTERNATIONAL B.V. Kasteellaan 33 NL-5932AE Tegelen Nederland BTW NL003812522B01 HR Venlo 12011983 T+31 77 376 92 92 f+31 77 373 69 66 [email protected]
ROLTRANS GROUP AMERICA INC. 3212 Pinewood Drive Arlington, Texas 76010 USA 75-1994308 Delaware Corporation # 2044811 USA
T+1 817 607 00 80 f+1 817 607 00 88 [email protected]
ROLAND PLANEN GMBH Am Zirkel 8 49757 Werlte Deutschland Ust-id.Nr.: DE 812873033 Osnabrück HRB 122296 T+49 59 51 99 55 70 f+49 59 51 99 55 71 [email protected]
ROLTRANS GROUP POLSKA SP.Z.O.O. Ul. Nadbrzezna 1 PL-62500 Konin Polska NIP 665-100-18-19 RHB 1210 T+ 48 632 44 39 25 f+48 632 44 39 21 [email protected]
ROLAND UKRAINE LLC Kievskaya 64-A Rivne Ukraine T+38 362 28 65 39 f+38 362 28 65 39 [email protected]
ROLAND TILTS UK Ltd Unit 1 Usher Street Off Wakefi eld Road Bradford BD4 7DS UK VAT GB 311746186 Company Nr 1380441 T+44 1274 39 16 45 f+44 1274 30 51 56 [email protected]
Sioen Industries n.v. Fabriekstraat 23 B-8850 Ardooie- BelgiumTel +32 51 74 09 00 - Fax: +32 51 74 09 64E-mail: [email protected]: BE 441.642.780 - RPR 0441.642.780 Brugge

SIO
EN
IN
DU
ST
RIE
S
I A
nn
ua
l R
ep
ort
20
07
81
COATINGSIOEN COATING NV Fabriekstraat 23 B-8850 Ardooie België BTW BE 402.753.106 RpR 0402.753.106 Brugge T +32 51 74 09 00 f +32 51 74 09 64 [email protected]
SAINT FRERES SAS 4 route de Ville BP 1F-80420 Flixecourt France TVA fR 76408448850 RCS AmIENS B 408 448 850 T +33 322 51 51 45 f +33 322 51 51 49 [email protected]
SIOEN COATING DISTRIBUTION NV Fabriekstraat 23 B-8850 Ardooie België BTW BE 436.241.167 RpR 0436.241.167 Brugge T +32 51 74 09 00 f +32 51 74 09 64 [email protected]
SIOEN FABRICS SA Zoning Industriel du Blanc Ballot Avenue Urbino 6B-7700 Mouscron Belgique TVA BE 458.801.684 Rpm 0458.801.684 Tournai
(Coating/ Weaving/ Calendering) T +32 56 85 68 80 f +32 56 34 61 31 [email protected]
T +32 56 85 01 40 f +32 56 85 01 49 [email protected]
SIOEN FIBRES SA - extrusion Zoning Industriel du Blanc Ballot Boulevard Métropole 9 B-7700 Mouscron Belgique TVA BE 463.789.464 Rpm 0463.789.464 Tournai T+32 56 48 12 70 f+32 56 48 12 85 [email protected]
SIOEN COATED FABRICS (SHANGHAI) TRADING CO. LTD Room O, floor 15, Hengji Building No 99, Huaihai Road (East) 200021 Shanghai p.R. of China
T+86 21 63 84 25 21 f+86 21 63 84 27 39 [email protected]
SIOFAB SA Indústria de Revestimentos Têxteis Rua da Indústria PT-4795-074 Vila das Aves Santo Tirso portugal Santo Tirso
SOB O N° 4641 NIf 505.046.644 T+351 252 87 47 14 f+351 252 94 29 68 [email protected]
TIS NV Driehoekstraat 2A B-9451 Haaltert (Kerksken) België BTW BE 405.085.064 RpR 0405.085.064 Aalst T+32 53 85 92 20 f+32 53 85 92 56 [email protected]
VERANNEMAN TECHNICAL TExTILES NV Fabriekstraat 31 B-8850 Ardooie België BTW BE 429.387.623 RpR 0429.387.623 Brugge T+32 51 24 81 70 f+32 51 22 61 68 [email protected]
PENNEL AUTOMOTIVE SAS 310 Rue d’Alger F-59100 Roubaix France TVA fR 53448273615 RCS Roubaix-Tourcoing B 448 273 615 T+33 320 76 21 10 f+33 320 76 21 12 [email protected]
CHEMICALSEUROPEAN MASTER BATCH NV – E.M.B. NV / Fillink Rijksweg 15 B-2880 Bornem België BTW BE 421.485.289 RpR 0421.485.289 mechelen T+32 3 890 64 00 f+32 3 899 26 03 [email protected]
INDUCOLOR SA Chemin Preuscamps 12 B-7822 Ath (Meslin-L’Evêque) Belgique TVA BE 400.685.125 Rpm 0400.685.125 Tournai T+32 68 25 02 30 f+32 68 55 26 02 [email protected]
RICHARD SAS Rue lavoisier - zac novo - 59160 lomme France T+33 320 00 18 88 f+33 320 00 18 80 [email protected]
ASTRA COLORANTS SA 20 Avenue maréchal de lattre de tassigny - 69330 meyzieu France + 33 478 31 58 02 f+33 478 04 02 57 [email protected]
APPARELSIOEN NV Fabriekstraat 23 B-8850 Ardooie - België BTW BE 478.652.141 RpR 0478.652.141 Brugge T+32 51 74 08 00 f+32 51 74 09 62 [email protected]
CONFECTION TUNISIENNE DE SECURITE SA – C.T.S. SA 5 Impasse n° 2 Rue 8612 – (Z.I.) La Charguia TN-2035 Tunis Tunisie Code TVA 03030 V / A / m / 000 RC B 133171996 T+216 71 77 34 77 f+216 71 78 40 47 [email protected]
GAIRMEIDI CAOMHNAITHE DHUN NA NGALL TEORANTA LTD
(Donegal Protective Clothing Ltd –Sioen Ireland) - Industrial Estate Bunbeg Co. Donegal Ireland
VAT IE 4621355m Company Nr. 78212 T+353 74 953 11 69 f+353 74 953 15 91 [email protected]
MULLION MANUFACTURING LTD 44 North farm Road South park Industrial Estate Scunthorpe North Lincolnshire DN17 2AY - UK
VAT GB 365.1873.34 Company Nr. 1871440 T+44 1724 28 00 77 f+44 1724 28 01 46 [email protected]
SIOEN FRANCE-DIVISION SIP PROTECTION Pavillon Hermès 110 avenue Gustave Eiffel ZI La Coupe F-11100 Narbonne France TVA fR 49300774767 RCS Narbonne B 300 774 767 T+33 4 68 42 35 15 f+33 4 68 42 27 43 [email protected]
P.T. SIOEN INDONESIA NUSANTARA BONDED ZONE (KBN) MARUNDA - Jalan Pontianak Block C.2-03Jakarta 14120 -Indonesia
NPWP 1.068.001.5-052 T+62 21 44853222 f+62 21 44853444 [email protected]
PT SUNGINTEx Jalan Raya Narogong Km 12,5 pangkalan IV Desa Cikiwul Kec. Bantar Gebang Bekasi Barat 17310 Indonesia
NPWP 1.068.012.2-407 T+62 21 825 22 22 f+62 21 825 44 44 [email protected]
SIOEN FIBRES SA – distribution Zoning Industriel du Blanc Ballot Boulevard Métropole 9 B-7700 Mouscron Belgique TVA BE 463.789.464 Rpm 0463.789.464 Tournai T+32 56 85 54 30 T+32 56 34 66 10 [email protected]
SIOEN FRANCE SAS Pavillon Hermès 110 avenue Gustave Eiffel ZI La Coupe F-11100 Narbonne France TVA fR 49300774767 RCS Narbonne B 300 774 767 T+33 4 68 42 35 15 f+33 4 68 42 27 43 [email protected]
SIOEN TUNISIE SA 7 Impasse N° 2 Rue 8612 – (Z.I.) La Charguia TN-2035 Tunis Tunisie Code TVA 614715 S / A / m / 000 RC B 19711998 T+216 71 80 75 47 f+216 71 80 92 62 [email protected]
SIOEN ZAGHOUAN SA Zone Industrielle de Zaghouan TN-1100 Zaghouan Tunisie Code TVA 747023 f / A / m / 000 RC B 177132000 T+216 72 68 06 60 f+216 72 68 26 60 [email protected]
SIOEN FRANCE DIVISION VIDAL PROTECTION Zone Industrielle Le Passage Jean-Rostand BP167 F 81300 Graulhet France T+33 5 63 34 52 46 f+33 5 63 34 69 99 [email protected]
SIOEN USA Inc. c/o Flom, French & Goodwin, L.L.C. 675 Line Road Building 4, Suite B Aberdeen, NJ 07747 USA
T+1 732 441 12 50 f+1 732 441 12 53 [email protected]
INDUSTRIAL APPLICATIONSCOATEx NV Industriezone Sappenleen Sappenleenstraat 3-4 B-8970 Poperinge België BTW BE 434.140.425 RpR 0434.140.425 Ieper T+32 57 34 61 60 f+32 57 33 35 23 [email protected]
SAINT FRERES CONFECTION SAS 2 route de Ville BP 37 F-80420 Flixecourt France TVA fR 44408449098 RCS Amiens 408 449 098 T+33 322 51 51 70 f+33 322 51 51 79 [email protected]
SIOEN NORDIFA SA Rue Ernest Solvay 181 B-4000 Liège Belgique TVA BE 474.276.154 Rpm 0474.276.154 Liège T+32 4 252 21 50 f+32 4 253 04 25 [email protected]
ROLAND INTERNATIONAL B.V. Kasteellaan 33 NL-5932AE Tegelen Nederland BTW NL003812522B01 HR Venlo 12011983 T+31 77 376 92 92 f+31 77 373 69 66 [email protected]
ROLTRANS GROUP AMERICA INC. 3212 Pinewood Drive Arlington, Texas 76010 USA 75-1994308 Delaware Corporation # 2044811 USA
T+1 817 607 00 80 f+1 817 607 00 88 [email protected]
ROLAND PLANEN GMBH Am Zirkel 8 49757 Werlte Deutschland Ust-id.Nr.: DE 812873033 Osnabrück HRB 122296 T+49 59 51 99 55 70 f+49 59 51 99 55 71 [email protected]
ROLTRANS GROUP POLSKA SP.Z.O.O. Ul. Nadbrzezna 1 PL-62500 Konin Polska NIP 665-100-18-19 RHB 1210 T+ 48 632 44 39 25 f+48 632 44 39 21 [email protected]
ROLAND UKRAINE LLC Kievskaya 64-A Rivne Ukraine T+38 362 28 65 39 f+38 362 28 65 39 [email protected]
ROLAND TILTS UK Ltd Unit 1 Usher Street Off Wakefi eld Road Bradford BD4 7DS UK VAT GB 311746186 Company Nr 1380441 T+44 1274 39 16 45 f+44 1274 30 51 56 [email protected]

SIOEN Industries nv fabriekstraat 23
8850 Ardooie - Belgium
T +32 51 74 09 00
f +32 51 74 09 64
www.sioen.be
JAARVERSLAG / RAppORT ANNUEL / ANNUAL REpORT
Dit jaarverslag is beschikbaar in het Nederlands, het frans en het Engels.
Ce rapport annuel est disponible en français, en néerlandais et en anglais.
This annual report is available in Dutch, french and English.