Corporate Governance and Persistence of Mutual Fund Ratings: A Markov Chain … · 2017-02-16 · 1...
38
1 Corporate Governance and Persistence of Mutual Fund Ratings: A Markov Chain Approach 1 AUROBINDO GHOSH 2 and WEE SENG NG 3 This version: 03 June 2013 We explore the use of continuous-time Markov chains in examining the dynamics of Morningstar star rating. By employing the Aalen-Johansen method, we estimate the transition probabilities over a long time horizon and study the rating dynamics for different types of mutual funds and for funds having different corporate governance ratings given by the Morningstar stewardship grades. One economically important result that emerges is that among funds with a good initial star rating, those with a good stewardship grade exhibit a higher chance of having their rating maintained or upgraded, and a lower chance of having their rating downgraded. Results of this kind provide some credence to the widely accepted notion that corporate governance matters in performance. JEL Code: G11, G23, G24, C22 Corporate governance, Markov chain, mutual fund ratings, stewardship grades 1 ©2013 Aurobindo Ghosh and Ng Wee Seng, all rights reserved. Preliminary draft, please do not quote without permission. This paper is supported through Research Grant from the Sim Kee Boon Institute for Financial Economics and we acknowledge Morningstar for the mutual fund data provided. Usual disclaimers apply. 2 Assistant Professor of Finance (Education), Lee Kong Chian School of Business, Singapore Management University. Email: [email protected] 3 PhD Candidate, Lee Kong Chian School of Business, Singapore Management University.
Transcript of Corporate Governance and Persistence of Mutual Fund Ratings: A Markov Chain … · 2017-02-16 · 1...
1
Corporate Governance and Persistence of Mutual
Fund Ratings: A Markov Chain Approach1
AUROBINDO GHOSH
2 and WEE SENG NG
3
This version: 03 June 2013
We explore the use of continuous-time Markov chains in examining the dynamics of
Morningstar star rating. By employing the Aalen-Johansen method, we estimate the
transition probabilities over a long time horizon and study the rating dynamics for
different types of mutual funds and for funds having different corporate governance
ratings given by the Morningstar stewardship grades. One economically important
result that emerges is that among funds with a good initial star rating, those with a
good stewardship grade exhibit a higher chance of having their rating maintained or
upgraded, and a lower chance of having their rating downgraded. Results of this kind
provide some credence to the widely accepted notion that corporate governance
matters in performance.
JEL Code: G11, G23, G24, C22
Corporate governance, Markov chain, mutual fund ratings, stewardship grades
1 ©2013 Aurobindo Ghosh and Ng Wee Seng, all rights reserved. Preliminary draft, please do not
quote without permission. This paper is supported through Research Grant from the Sim Kee Boon
Institute for Financial Economics and we acknowledge Morningstar for the mutual fund data
provided. Usual disclaimers apply. 2 Assistant Professor of Finance (Education), Lee Kong Chian School of Business, Singapore
Management University. Email: [email protected] 3 PhD Candidate, Lee Kong Chian School of Business, Singapore Management University.

2
1. Introduction
The mutual fund Industry is burgeoning. According to the Investment
Company Fact book, as of the end of year 2011, the total asset under management
worldwide exceeded 26 trillions U.S. dollars and the total number of mutual funds
available worldwide surpassed 73,000. To mutual fund investors, one implication of
these statistics is the increasingly tedious and costly task of screening and selecting
funds. For those who seek a simple and affordable solution to their conundrum,
mutual fund ratings such as those provided by Morningstar and Lipper are obvious
choices. Debuting in 1985 and revamped in 2002, the Morningstar star ratings are
probably the most popular and influential4 mutual find rating. Star ratings (five
possible grades with 1-star the worst and 5-star the best) are based on a fund’s
relative standing within its own peer category in terms of some measure of its past
risk-adjusted returns. Funds in the top 10- percentile and the next 22.5-percentile are
graded the best 5-star rating and second-best 4-star rating respectively. Funds in the
middle 35-percentile and the next 22.5-percentile are given a 3-star rating and a 2-star
rating respectively. Those in the bottom 10-percentile receive the worst 1-star rating.
In response to public outcry over the mutual fund scandals in 2002 – 2003
which precipitated a series of prosecutions and regulatory reforms, Morningstar
launched in 2004 a new mutual fund governance evaluation system to complement
the well-established star rating. This new rating, first named the Fiduciary Grade and
subsequently renamed the Stewardship Grade in year 2007, is derived from five
corporate governance scores based on the following five factors - (i) Board Quality
4 See Morningstar Factsheet for Star Ratings Morningstar (2008a)
3
(0 to 2 points) (ii) Corporate Culture (0 to 4 points) (iii) Fees (0 to 2 points) (iv)
Manager Incentives (0 to 2 points) (v) Regulatory Issues (-2 to 0 points). 5
Mutual fund ratings are popular for many reasons. Investors, especially the less
experienced and hence less informed ones, regard them as an endorsement of a fund’s
quality. The top rating recognized with the prestigious Morningstar’s 5-star icon is
often used as an advertising tool to entice investors. Indeed, one can find ample
evidence suggesting that investors gravitate towards top-rated funds. Some reports
claim “… almost 90% of the new money that flowed into stock funds last year went to
funds with four-star and five-star ratings” – (Wall Street Journal, April 5, 1996) and
“… Even in 2008’s brutal market, when the other star-rated funds saw net outflows
ranging from $111 billion for 3-star funs to $14 billion for 4-star funds, 5-star funds
enjoyed $67.5 billion in net inflows’ – (Wall Street Journal, 1 June, 2010 ). On the
academic front, two recent studies (Del Guercio & Tkac, 2008), Wellman & Zhou,
2007) document that the funds that receive the top rating for the first time attract very
high abnormal fund inflows overr a six-month post-rating period. Their studies also
demonstrate that both rating upgrades and downgrades have significant impact on
fund flows.
Given the influence mutual fund ratings have on investors’ financial decision-
making, one natural question to explore is whether the “chasing the star” strategy is
sound? To answer this question, one has to examine at least two crucial issues. The
first concerns the predictive nature of ratings. It is important to find out whether
ratings possess any ability to predict future performance and if so, to what extent and
over what time horizon. The second issue to investigate is the persistence of ratings.
5 See Morningstar Factsheet for Stewardship Grade (2008b)

4
More specifically, one should find out to what extent top-rated funds are able to
maintain its rating and for how long a period of time. Our previous study (Ghosh,
Goh and Ng, 2012) among others has explored the first question using a more
structural approach. One objective of this current paper is to focus on the second
question and test empirically the degree of persistence of the Morningstar star rating.
Surprisingly, the amount of academic publications that examine mutual fund
ratings pale in comparison with those that focus on other aspects of mutual funds
such as fund performance and fund managers’ skills. In particular, academic study on
persistence of mutual fund ratings are difficult to come by. Khorana and Nelling
(1998) are among the earliest to examine the persistence of mutual fund ratings. Their
findings indicate that the Morningstar star ratings exhibit a high degree of persistence
over the period December 1992 – June 1995. However, Warshawsky et al. (2000)
find that their results could be plagued by survivorship bias. The latter examine the
degree of persistence of the top two ratings (four-star and five-star) by tracking the
percentage of funds that can retain their top rating over a one-year observation
window over the period 1997 – 1998. Their results reveal that more than 50% of
these top-rated funds suffer a rating downgrade, and the degree of persistence varies
with the age of funds: older funds show a higher degree of persistence than the
younger ones.
Blake and Morey (2000) use a data set covering the period 1992 – 1997 to
evaluate the predictive ability of the star ratings. They find little evidence to support
the notion that highest-rated (5-star) funds can outperform funds with a lower rating.
However, their findings do suggest that poor ratings indicate weak future

5
performance. Morey and Gottesman (2006) re-examine the issue of predictability
based on Morningstar’s new rating methodology (See Morningstar (2008a)).
Analyzing the first batch of funds rated under the new methodology as of June 2005
and tracking their performance over the period July 2002 – June 2005, they find that
monotonically, high-rated funds exhibit better post-rating performance than their low-
rated counter-parts. For example, two-star funds outperform one-star funds over a
three-year post-evaluation period. These results provide evidence that the revamped
system does possess some predictive power6.
In a separate but related line of research, many authors examine the
persistence of mutual fund performance. Earlier work by Grinblatt and Titman
(1992), Hendricks et al. (1993), Goetzmann and Ibbotson (1994), Brown and
Goetzmann(1995) and Malkiel (1995) all provide some evidence that persistence of
mutual fund performance exists. Carhart (1997) demonstrates that short-term
persistence disappears once the momentum factor of Jegadeesh and Titman (1993) is
included in the regression model, thus suggesting that top performing funds generate
superior returns simply by holding stocks that have recently performed well.
Subsequent studies that employ the Carhart’s four-factor model for performance
produce mixed results. Bollen and Busse (2005) find evidence of persistence over a
short three-month horizon. Using bootstrap analysis, Kosowski et al. (2006)
document persistence among growth-oriented funds but find no evidence of
persistence among income-oriented funds. Huij and Verbeek (2007) apply Bayesian
6 These studies do not directly address the persistence of ratings, but rather their predictive relation to
future performance
6
techniques to examine short-run persistence and report that persistence is most
pronounced among the relatively younger small cap funds and growth funds.
In this paper, we model the dynamics of mutual fund ratings as a continuous-
time Markov process and use the estimated transition probabilities to examine the
degree of persistence of ratings. The use of Markov chains to model the evolution of
financial ratings can be dated back to the seminal work of Jarrow, Lando and
Turnbull (1997) in the context of credit ratings. However, the concept of applying the
same approach to mutual fund ratings has only been brought to light recently by the
non-academic publication of Garnier and Pujol (2007), followed by the related work
of Duret et al. (2008) and Herei et al. (2010). Using time-homogeneous discrete
Markov chains, Garnier and Pujol (2007) study persistence of mutual fund ratings
provided by Morningstar and Standard and Poors7 based on a sample of mutual funds
distributed in France over the period 2000 – 2005. Duret et al. (2008) employ
continuous-time Markov chains under the assumption of time-homogeneity to re-
examine the sample funds analysed by Garnier and Pujol (2007). Both studies
contend that persistence of ratings is weak over a long horizon of three years,
although a certain degree of short-term persistence exists. Using monthly
Morningstar star ratings of funds distributed in Europe over the period 2000 – 2009,
Hereil, Mitaine & Moussavi (2010) propose a new measure of persistence based on
their estimated transition probabilities. This measure corresponds to the time during
which the probability of having no rating changes exceeds the probability of a rating
migration. Focusing on the top rating, they find that the average duration time of the
5-star rating is approximately 5 months.
7 Morningstar acquired Standard & Poors’ fund data business, including fund ratings, in 2007
7
None of the above studies have addressed the important issue of time
homogeneity. Although Hereil et al. (2010) have acknowledged that the assumption
of time homogeneity is probably tenuous, they conduct no further examination on its
validity. Time homogeneity of transition probabilities is not an innocuous assumption
and warrants verification. In the literature on the use of Markov models for credit
ratings, there has been mounting evidence against time homogeneity. For example,
both Nickell et al. (2000) and Bangia et al. (2002) demonstrate that transition
probabilities of credit ratings vary with the business cycles. In the light of this, we
consider a range of issues central to the estimation of transition probabilities. With
the aid of standard statistical tests of Anderson and Goodman (1957), we first assess
the validity of time-homogeneity in a robust manner, using data that covers different
time periods and over different time horizons. Having derived strong statistical
evidence that the Morningstar star ratings is not a time-homogeneous process, we
estimate the transition probabilities based on the non-parametric Aalen-Johansen
estimator (Anderson, Hansen and Keiding 1991, Gill and Johansen 1990) over a 72-
month period.
Estimating transition probabilities over a long time horizon, we proceed to
conduct a study on the dynamics of the Morningstar star ratings for different types of
mutual funds. Keeping the interests of an individual investor in mind, we seek to
answer the questions: “How likely a 5-star rated mutual fund can retain its rating in
the future” and “Once rated, what is the duration of a 5-star rating”. It is also
worthwhile to investigate how likely a 4-star fund can be upgraded to a 5-star rating
over a specific time horizon Essentially, the transition probability that a rating

8
remains unchanged between two observation months measures the strength of
persistence of the rating, while the transition probability corresponding to a change of
rating from a 5-star to a lower rank indicates the likelihood of a downgrade.
Given that the star rating is calculated from a long-term (at least three years)
past risk-adjusted return (see [Morningstar (2008)]) , our paper contributes to the
literature by examining long-term performance persistence of mutual fund within the
Markov chain framework, using the star rating as the performance measure. Having
both the star ratings and the stewardship grade, we are also in a position to investigate
whether corporate governance plays a role in persistence and transitions of ratings.
For example, by dividing funds with a 5-star rating into groups based on a fund’s
stewardship grade, we can examine whether the degree of rating persistence is
influenced by the standard of corporate governance. For this purpose, we divide the
sample funds into categories based on a fund’s stewardship grade and analyse the
differences in transition probabilities across different stewardship grade groups. It
turns out that funds with better governance generally exhibit a lower chance of rating
downgrade and a higher chance of rating upgrade. Results of this kind provide some
credence to the widely accepted notion that corporate governance plays a positive and
significant role in protecting the interests of the shareholders i.e. the mutual fund
investors.
The scope of this paper can be broadened to the use of Markov chains in
examining the persistence of mutual fund performance, extending the commonly-
used “Winner-Loser” methodology adopted by many authors, such as Goetzmann and
Ibbotson (1994), Brown and Goetzmann (1995) and Malkiel (1995). One obvious

9
advantage that the Markov chain approach has over the WL method is that one can
examine many more states (five in the case of Morningstar Fund ratings) than a
simple dichotomy.
The outline of this paper is as follows: In Section 2, we give an overview of
the theory of discrete-time and continuous-time Markov chains that is relevant to this
study and discuss related issues such as the statistical tests for time homogeneity,
estimation of transition matrices and derivation of some useful persistence measures
from the estimated transition probabilities. Section 3 describes the data set and
presents the empirical findings. we conclude this paper and offer suggestions for
further research in Section 4.
2 Markov Chain Models for Mutual Fund Ratings
2.1 Markov Chains
A typical mutual fund rating system produces a time series of ordinal
variables (ratings) KRRR ,...,, 21 for which ji RR if ji . These ratings are
typically based on some measure of past performance. For the case of Morningstar
star rating system, risk-adjusted returns based on expected utility theory are used to
rank mutual funds within specific peer groups on a monthly basis. The end-product is
a set of 5 grades (1-star, 2-star, 3-star, 4-star and 5-star).
A stochastic process ... 2, 1, ,0:)( ttR is said to be a discrete-time Markov
chain on some finite set S = {1, 2, .., K} if for all integers ntttt ,...,,, 210 with
ttttt nn 011 ... ,
the following Markov property holds

10
),(: |P
,..,, , |P
0
21
0
210
ttpiRjR
iRiRiRiRjR
ijtt
nttttt n
The set S is known as the state space of the Markov chain and the probability
),( 0 ttpij is called the ( t – 0t ) – step transition probability for transition from state i
at time 0t to state j at time t. The KK square matrix
P ),( 0 tt = ),( 0 ttpij
is known as the transition matrix for the interval [ 0t , t]. By the definition of transition
matrices, 1),(0 0 ttpij and each row sum, ),(1
0
K
j
ij ttp of the transition matrix
equals to unity.
A discrete-time Markov chain is said to be time-homogeneous if the transition
probability ),( 0 ttpij depends only on the duration 0tt over which transition of
states occurs. In this case, ),( 0 ttpij can be written as )( 0ttpij and the
corresponding transition matrix is given by
P 0tt = )( 0ttpij
It follows that for any time-homogeneous Markov chain and for any integers n > m,
mnmn PPP
and
nn PP 1 .
In this paper, we consider monthly Morningstar ratings for which the state
space is S= 5 ,4 ,3 ,2 ,1 . For example, {Rt = i} is the event that a fund has a i – star
rating at month t .
11
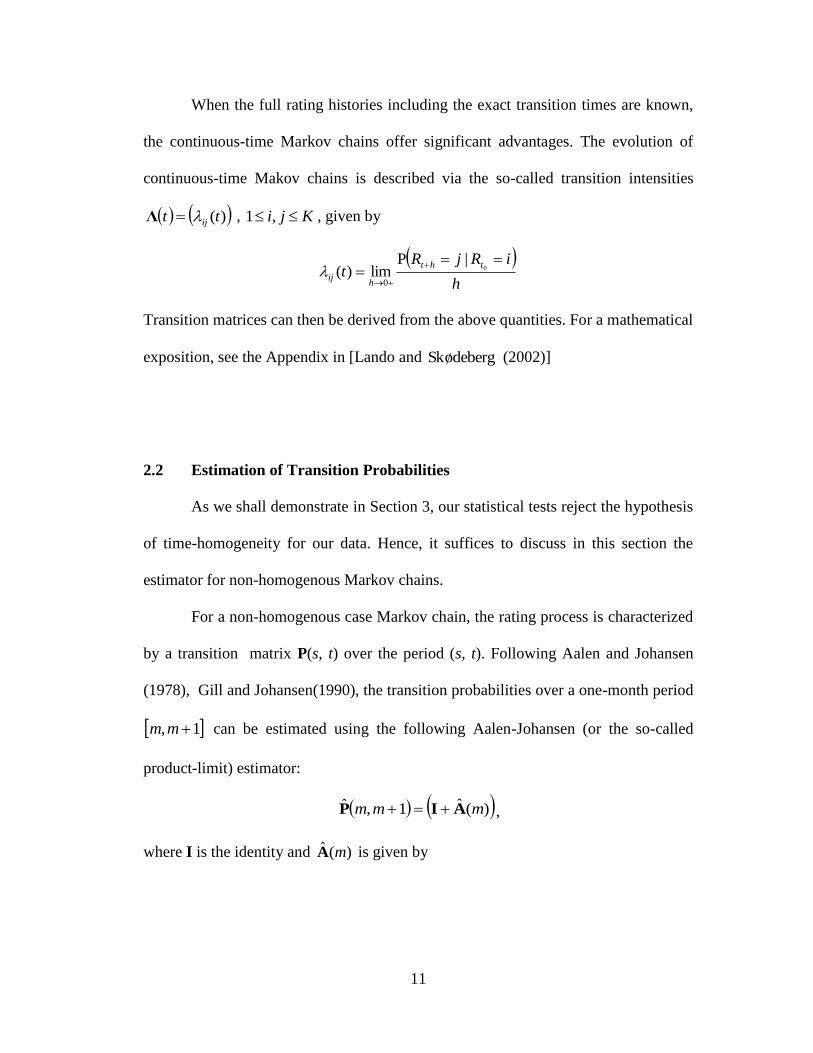
When the full rating histories including the exact transition times are known,
the continuous-time Markov chains offer significant advantages. The evolution of
continuous-time Makov chains is described via the so-called transition intensities
)(tt ijΛ , Kji ,1 , given by
h
iRjRt
tht
hij
0 |P
lim)(0
Transition matrices can then be derived from the above quantities. For a mathematical
exposition, see the Appendix in [Lando and debergoSk (2002)]
2.2 Estimation of Transition Probabilities
As we shall demonstrate in Section 3, our statistical tests reject the hypothesis
of time-homogeneity for our data. Hence, it suffices to discuss in this section the
estimator for non-homogenous Markov chains.
For a non-homogenous case Markov chain, the rating process is characterized
by a transition matrix P(s, t) over the period (s, t). Following Aalen and Johansen
(1978), Gill and Johansen(1990), the transition probabilities over a one-month period
1, mm can be estimated using the following Aalen-Johansen (or the so-called
product-limit) estimator:
)(ˆ1,ˆ mmm AIP ,
where I is the identity and )(ˆ mA is given by

12
)(
)(~......
)(
)(~
)(
)(
...)(
)(~.........
......)(
)(~......
)(
)(...
)(
)(
)(
)(~
)(
)(
)(
)(
)(
)(~
)(
)(
)(
)(
)(
)(~
)(ˆ
5
5
5
52
5
51
4
4
3
3
2
25
2
23
2
2
2
21
1
15
1
14
1
13
1
12
1
1
mn
mn
mn
mn
mn
mn
mn
mn
mn
mn
mn
mn
mn
mn
mn
mn
mn
mn
mn
mn
mn
mn
mn
mn
mn
mn
mn
mn
mA
Here, )(~ mni counts the number of rating transitions away from state i from month m
to month (m + 1) and )(mnji counts the number of transitions from state i at month m
to state j at month (m + 1). As before, )(mni denotes the total number of mutual
funds with a rating of i at month m.
It is easy to see that each row of )(ˆ mA sums to zero. A k-month transition
estimator, k,0P̂ over the period [0, k] can then be obtained via matrix
multiplication of the corresponding one-month transition matrices,
1
0
)(ˆ,0ˆk
m
mk AIP .
One obvious advantage of the above estimator is that it utilizes all available
information on rating transitions in the data set including the exact time (month) at
which rating changes take place.
2.3. Probabilities of Rating Persistence and Rating Change
Hereil et al. (2010) propose the use of following function to derive measure of rating
persistence
1 P2
P P)(
0
00
iRjR
iRiRiRjRtd
t
tti,

13
for each Ki .., 2, 1, . A positive )(td i indicates a higher chance of maintaining an
initial of i-star. Hereil et al. (2010) also suggest that the following quantity be used to
measure how resilient a particular rating is
i = 0)(:0inf tdt i .
Clearly, i represents the earliest time at which migration of state i is more likely to
occur than not.
For different pairs of ratings, i and j, the time series of the transition probabilities
...3 ,2 ,1:)(0, ttpij can provide useful insights on the evolution of mutual fund
ratings. For the case when i = j, one can use these transition probabilities )(0,tpii to
measure the persistence of the rating i since )(0,tpii gives the odds that a fund retains its
initial rating of i after t months. For j > i, the probabilities )(0,tpij indicate the chance of
a rating upgrade from the initial rating of i to a higher rating of j. Of particular interest is
the case when i = 4 and j = 5, since investors are interested in how probable a 4-star fund
can attain the best rating in subsequent months. Similarly, for j < i, the probabilities
)(0,tpij represent the chance of a rating downgrade from i to j . The case when i = 5 and
j = 4 may be of special significance to investors for a similar reason.
3 Data and Empirical Analysis
3.1 Data Description
The data covers 79 months of rating (Morningstar star ratings and stewardship
grades) history from November 2004 through May 2011. There are altogether 1803

14
mutual funds, all of which are classified under the Morningstar’s ‘US Broad Asset
Class’ as balanced funds, bond funds (‘municipal bond’ or ‘taxable bond’),
‘international stock funds’ or ‘U.S. stock’ fund. For simplicity, we shall enumerate
the months as month 1 – month 79.
3.2 Ratings Statistics and Dynamics
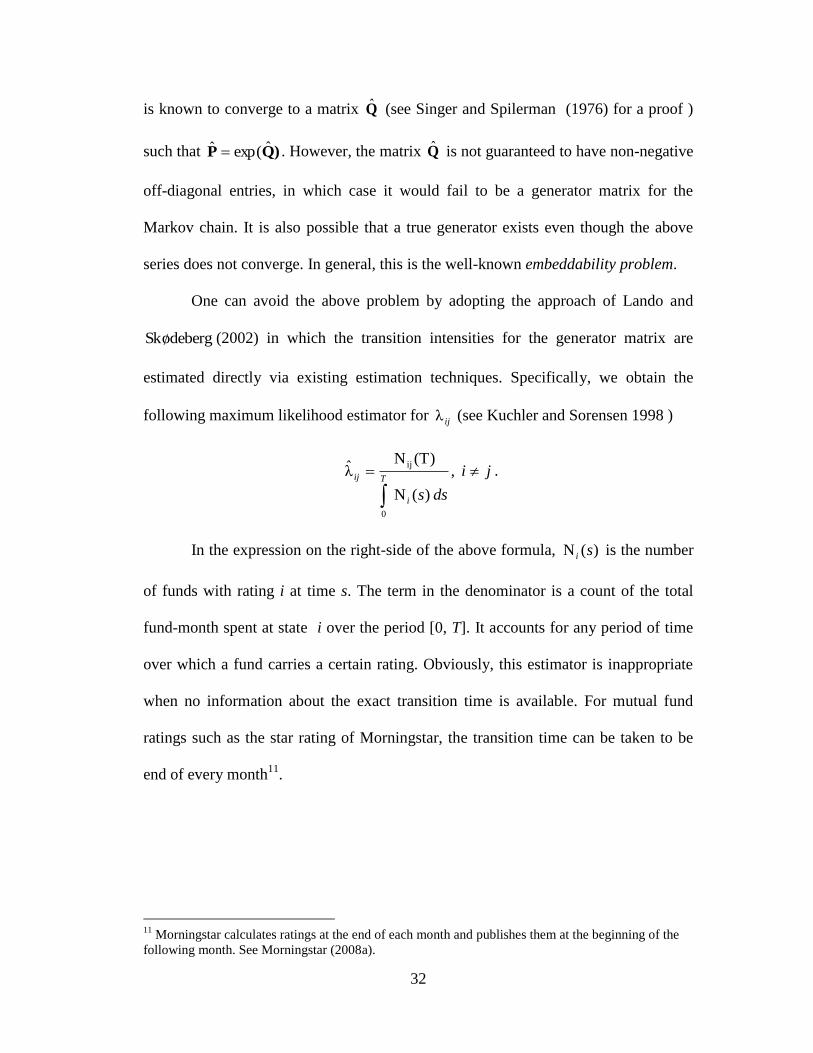
We conduct a preliminary analysis of rating persistence by tracking the time series
average star rating of funds with the same initial rating over a post-ranking period of
duration up to 72 months. Specifically, we sort the sample funds into five star -rating
portfolios based on their initial (month 1, November 2004) star rating (SR) (1-star to
5- star). Table 1 displays the average star rating of each portfolio computed at
quarterly intervals over the next 78 months. It is obvious that each time series of
average rating exhibits a long-term “mean-reversion” pattern with the average rating
for each portfolio stabilizing at an average of about 2.5 to 3.5, thus suggesting that the
level of rating persistence is low over a long (3- to 6-year) time horizon.
3.3 Time Homogeneity Test
Following Anderson and Goodman (1957), we divide a test period of duration
13 months into 12 non-overlapping subintervals [t – 1 , t] , t = 1, 2, .., 13 and apply
the cohort method on each of these sub-intervals to obtain an estimate ),1(ˆ ttpij for
the transition probability ),1( ttpij , and also on the entire 12-month time period to
obtain the estimate 12,0ˆijp for each fixed i, i = 1, 2,3…, 5.
15
For testing the null hypothesis that )12,0(),1( ijij pttp for each t , given a
specific i, the following test statistic has an asymptotic chi-squared distribution with
448 degrees of freedom
jt ji
jijii
ip
ptptn
, ,
2
,,2
ˆ
ˆˆ)( ,
where we have used the notations in Appendix A. For testing the joint hypotheses
that ),1( ttpij is independent of t for all possible i, test statistics
i jt ji
jijii
i
ip
ptptn
, ,
2
,,2
ˆ
ˆˆ)(
has an asymptotic chi-squared distribution with 220 degrees of freedom.
We perform the above test using five non-overlapping intervals of length 12
months, and repeat the test using four test periods each of length 36 months. For the
latter, we divide each test period into three non-overlapping sub-periods of length 12
months. Table 2 reports the results of these tests.
Overall, there is overwhelming evidence against time-homogeneity. The
hypothesis of time-homogeneity is rejected in all cases. Although not reported, we
have also conducted the test based on four subsamples formed by dividing the sample
into four groups based on a fund’s ‘Morningstar U.S. Broad Asset’ category: ‘U.S.
Stock’ , ‘International Stock’ , ‘Bond’ (‘Taxable Bond’ or ‘Municipal Bond’) and
‘Balanced’. We reach the same conclusion. It follows that the Aalen-Johansen
estimator is the appropriate estimator to use for the transition probabilities.
8 For K states and T transition periods, the number of degree of freedom is (K – 1)(T– 1)
16
Examining the Aalen-Johansen estimators, one observes that the 3-star rating
exhibits the highest degree of persistence over a one-year horizon. Furthermore, the
5-star rating has a higher probability of non-transition than 1-star rating over the
period months 1 to 37 but the dominance relation reverses for the period months 37 to
73. By and large, even for a short one-year period, the probability of any rating being
maintained is low, with the highest reading recorded being 0.502 for the 3-star rating
over the estimation period [61, 73].
3.4 Persistence and Probabilities of Rating Upgrades or Downgrades
With the aid of the estimated transition probabilities, we proceed to investigate
whether the degree of rating persistence /upgrade /downgrade will be differentiated
by the type of funds being examined. For this purpose, we split the sample into four
groups according to the four classifications - ‘U.S. Stock’, ‘International Stock’ ,
‘Bond’ (‘Taxable Bond’ or ‘Municipal Bond’) and ‘Balanced’ funds under
Morningstar’s ‘US Broad Category’ classification. Figure 1 displays the graphs of
selected transition probabilities against time. More precisely, we consider transition
among the three states: 3-star, 4-star and 5-star funds. Of particular interest would be
rating upgrade from 4-star to 5-star and rating downgrade form 5-star to 4-star. On
the whole, we find no obvious evidence of heterogeneity in the transition
probabilities among the four types of funds. The only notable exception is the case of
a rating upgrade from 3-star to 5-star where bond funds outperform the other groups.

17
We proceed to investigate whether corporate governance makes a difference
to the persistence of fund rating. To this end, we use a fund’s stewardship grade at
month 1 (November 2004 data) to partition the sample funds into two SG
(stewardship grade) groups9. Specifically, funds with SG = ‘A’ are placed in the
‘Good SG’ group while funds with SG = ‘D’ or ‘F’ are placed in the ‘Poor SG’
group. We then compute the estimated transition matrices from each of these
subsamples. Figure 2 presents the graphs of estimated transition probabilities
tp ji ,0ˆ, versus time, where 5,4,3, ji and 73..., ,2 ,1t denotes month with month
1 = November 2004.
These graphs provide strong evidence on the positive relation between
stewardship grade and mutual fund rating changes. For rating upgrades (3-star to 4-
star or 4-star to 5-star), funds with a good initial stewardship grade exhibit a higher
transition probability (hence, higher chance of upgrading) than funds with a poor
initial stewardship grade over the entire 72-month observation period. We can draw a
similar conclusion by examining rating downgrades (4-star to 3-star or 5-star to 4-
star). Specifically, funds with a good initial stewardship grade have a lower transition
probability (hence, lower chance of downgrading) than funds with a poor initial
stewaridship grade over the entire 72-month observation period. On the flip side, as
depicted in the bottom right panel of figure 2, there is no convincing evidence that
funds with better stewardship grade have a better chance of keeping the top 5-star
rating over a short time horizon of one to two years, though over a longer time span,
9 I do not use the original rating of 1-star to 5-star for the star rating and A to F for the stewardship
grade so as to avoid having highly uneven sizes among the ranking groups. For example, less than 1%
of the funds receive both a 1-star for SR and F grade for SG

18
5-star funds with better stewardship grades do show a higher chance of maintaining
the top rating.
To complement the above qualitative analyses with quantitative results, we
perform both Wilcoxon signed rank test and paired-sample t – tests with Newey-West
adjusted standard errors on the time series of differences in transition probabilities.
More specifically, letting tp ji
)good(
, denote the transition probability, Prob( Rating
after t month = j-star | Initial Rating at month 1 = i-star and initial stewardship grade
= ‘A’) and tp ji
)good(
, denote the transition probability, Prob( Rating after t month =
j-star | Initial Rating at month 1 = i-star and initial stewardship grade = ‘D’ or ‘F’),
we test the hypothesis that the difference )()((poor)(good)
tptp ijij is significantly
positive for upgrades ( j > i) and significantly negative for downgrades (j < i).
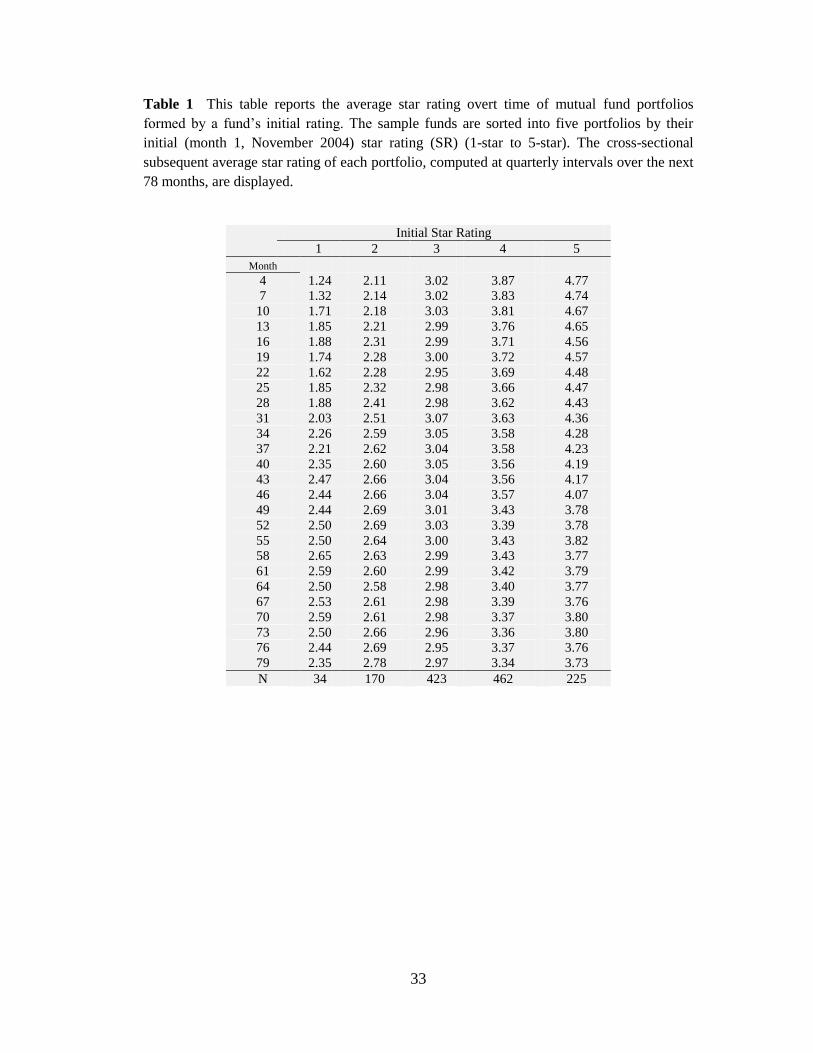
Following Hereil et al. (2008), we compute the quantity 1),(2),( tsptsd iii
for each initial rating i and for three different initial months s (namely, month 1
(November 2004), month 13(November 2005) and month 25 (November 2006) ), and
plot the graphs of ),( tsdi against time t in Figure 3 based on the entire sample. Two
salient observations can be made from these graphs. First, the persistence of each
rating, as measured by the quantity
i = 0)(:0inf tdt i
(graphically being the time at which the graph of ),( tsdi crosses the horizontal axis)
is very low for all ratings, invariably for less than a year. Second, 3–star rating

19
exhibits the highest resilience while the best (5–star) and the worst (1–star) rating
show the lowest resilience.
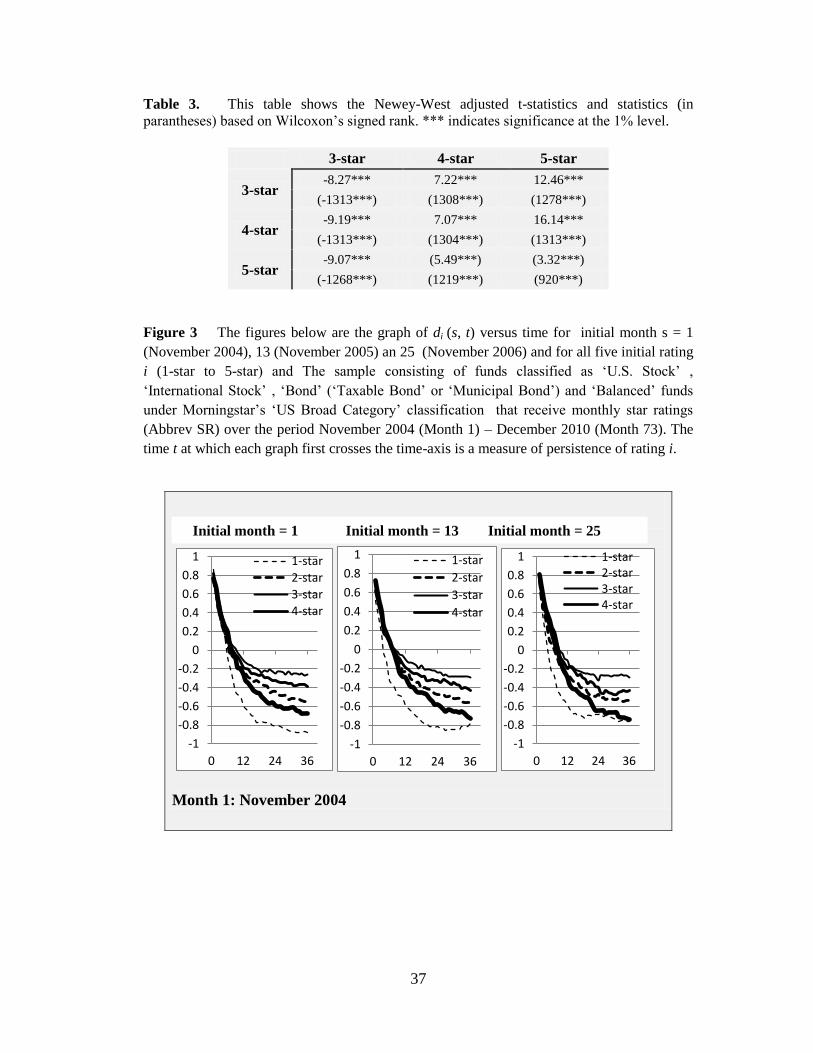
Finally, as a robustness check for our earlier results on the relation between
stewardship grades and rating transition probabilties, we re-construct the graphs in
Figure 2 for four different starting months : month 1 (November 2004), month 13,
month 25 and month 26 over a period of 36 months. To conserve space, we display
only the graphs for rating transitions from 4-star rating. We find that despite non-
homogeneity, the relation between stewardship grating and probability of rating
changes are robust to the choice of the starting month.
Summing up, the above results suggest that persistence of the star rating is
weak regardless of the type of funds assessed. In particular, the top-rated funds that
are most favored by investors have a high chance (probability > 0.4) of suffering a
rating downgrade. On a positive note, corporate governance appears to have a
positive impact on rating persistence and rating changes, suggesting that investors
should consider not just past performance, but also the standard of corporate
governance when selecting mutual funds.
4 Conclusions
A typical empirical method of examining the persistence of mutual fund performance
is the ranked-portfolio test in which during a so-called formation period, the sample
funds are first sorted and placed in two or more groups based on some performance
measures (such as the Sharpe ratio and Carhart’s four factor alpha). Using the same
performance metric, the mean return of each portfolio is then computed during a
subsequent period known, as the evaluation period, and the portfolios are re-sorted
20
based on the mean portfolio return. The strength of the correlation between the
formation-period ranking and evaluation-period ranking is a measure of performance
persistence. In particular, in the studies by Goetzmann and Ibbotson (1994), Brown
and Goetzmann (1995) and Malkiel (1995), a fund is categorized as a winner (loser)
if its performance is above (below) the median fund return. This gives rise to a 2 by 2
contingency table of winners and losers in the two ranking periods. Standard
statistical tests of two-way tables based on log odds ratio can then be applied to test
the significance of occurrences of ‘Winner-Winner’ (‘Loser-Loser’ ) which indicates
a high degree of persistence of good (poor) performance.
In this paper, we model mutual fund rating as a continuous-time Markov
chain and use the transition probabilities to examine the persistence of ratings. This
method can be viewed as a generalization of the above “Winner-Loser” dichotomy.
One issue that arises from the use of a Markov process is the choice of estimators for
the transition matrices which depends on whether the true transition probabilities are
time-homogeneous. Following standard statistical procedures in Anderson and
Goodman (1957), we conduct asymptotic chi-square tests of time-dependence using
different time periods and durations to ensure robustness of our results. It turns out
that the null hypothesis of time-homogeneity is rejected in all the tests, leading us to
conclude that the Aalen-Johnsen estimator is the appropriate tool for estimating
transition probabilities.
Using the estimated 72-month transition matrices for both the entire sample as
well as for subsamples based either on a fund’s category (bond, balanced,
international stock or U.S. stock) or on a fund’s corporate governance rating

21
(stewardship grade), we examine the strength of rating persistence as well as the
likelihood of rating upgrades or downgrades over time and investigate whether the
results vary across different fund categories or across different corporate governance
groups. Results obtained suggest that while persistence of rating is feeble, funds with
a good stewardship grade tend to have a greater chance of maintaining their top star
rating (4-star) or improving their rating (4-star to 5-star), and a smaller chance of
experiencing a rating downgrade. These results provide some support for the
contention that corporate governance and performance go hand in hand.
The results on the persistence of ratings warrant caution on the use of ratings.
The lack of strong persistence of the 5-star rating over a short horizon underscores the
need for investors to consider criteria besides ratings when selecting funds. The
evidence of the positive role that good corporate governance plays in rating
persistence is an indication that investors would be better off if they take into
consideration both the star rating and the stewardship grade when making investment
decisions.
We would like to point out that many issues surrounding the persistence of
ratings have not been addressed in this paper due to time and data constraints. For
example, one can seek to determine factors that can affect the degree of persistence of
ratings. A simple approach to this problem would be to sort the sample funds by
specific fund characteristics, such as managerial experience and turnover ratio, that
can potentially affect the rating dynamics, and form equal-size subsamples (e.g.
quintiles). One can then compare the transition matrices estimated from the
subsamples using well-known metrics that quantify and measure the difference

22
between two transition matrices (see e.g. Jafry and Schuermann (2004), Truck and
Rachev (2011)).
Another notable omission from this paper is the impact that fund exit from
and fund entry into the rating system has on the empirical results. One possible
extension of our model is one that includes an additional state, besides the five states
that represent the ratings, to incorporate the events of fund entry or fund exit. If we
assign the value 6 to this state, then a transition from state 6 to 5 represents the
initiation of the best rating.
Finally, it has been documented in a number of publications (Bangia et al.
2002, Lando and Skodeberg, 2002) that credit ratings of firms exhibit a so-called
rating drift, a phenomenon whereby firms that have been downgraded (upgraded)
before are likely to be downgraded (upgraded) in the next period. To investigate the
phenomenon of rating drift, one has to separately estimate three conditional transition
probabilities: one conditioned on upgrading in the prior period, one conditioned on
downgrading in the prior period and one conditioned on no rating change in the prior
period. It would be interesting to explore how the study of the issue of rating
momentum can be extended to the context of mutual fund ratings.
23
References
Aalen O. O., Johansen S., 1978. An empirical transition matrix for non-homogeneous
Markov chain based on censored observations. Scandinavian Journal of Statistics 5,
141 – 150.
Anderson, T. W., Goodman L. A., 1957. Statistical inference about Markov chains.
Ann. Math. Statistics 28, 89 – 110.
Anderson, K., Hansen L. S., Keiding N., 1991. Non- and semi-parametric estimation
of transition probabilities from censored observations of a non-homogeneous Markov
process. Scandinavian Journal of Statistics 18, 153 – 167.
Baker, M., Wurgler, J., 2000. Investor sentiment and the cross-section of stock
returns. Journal of Finance 61, 1645–1680.
Bangia, A., Diebold, F. X., Kronimus, A., Schagen, C., Schuermann, T., 2002.
Ratings migration and the business cycle with application to credit portfolio stress
testing. Journal of Banking and Finance 26, 445 – 474.
Blake, C., More, M. R., 2000. Morningstar ratings and mutual fund performance.
Journal of Financial and Quantitative Analysis 35, 451-483.

24
Bollen, Nicholas P., Jeffrey A., Busse J. A., 2005. Short-term persistence in mutual
fund performance. Review of Financial Studies 18, 569 – 597.
Brown K. C., Harlow W. V., Starks L. T., 1996. Of tournaments and temptations: an
analysis of managerial incentives in the mutual fund industry. Journal of Finance 51,
85-110.
Brown, S. J., Goetzmann W., 1995, Performance persistence, Journal of Finance,
50(2), 679 – 698.
Carhart, M. M., 1997. On persistence in mutual fund performance. Journal of Finance
51, 57-82.
Del Guercio D., Tkac P. A., 2008. Star power: the effect of Morningstar ratings on
mutual fund flows. Journal of Financial and Quantitative Analysis 43, 907 - 936.
Duret, A.S., Hereil, P., Mitaine, P., Moussavi, N., Roncalli. T., 2008. Fund rating
systems and performance predictability. Working Paper, Université d’Évry.
Garnier O., Pujol Thierry, 2007. Can today’s stars be used to read the stars of the
future? Case study of equity funds distributed in France between 2000 and 2005.. Les
Cahiers Scientifiques de l'AMF.
25
Ghosh A., Goh J., Ng W. S., 2013. Grades matter in performance. Morningstar
stewardship grade and mutual fund performance. Working Paper. Singapore
Management University.
Gill, R., Johansen S., 1990. A survey of product-integration with a view towards
applications in survival analysis. The Annals of Statistics 184, 1501 – 1555.
Goetzmann, W. N., Ibbotson, R., 1994, Do winners repeat? Patterns in mutual funds
selection. Journal of Portfolio Management 20, 9 –18.
Hendricks, D., Patel, J., Zeckhauser, R., 1993. Hot hands in mutual funds: sort-run
persistence of relative performance, 1974-1988. Journal of Finance 48, 93-130.
Hereil P., Mitaine P., Moussavi N., Roncalli T., 2010. Mutual fund ratings and
performance persistence. White Paper. Quant Research by Lyxor.
Huij J., Verbeek M., 2007. Cross-sectional learning and short-run persistence in
mutual fund performance. Journal of Banking and Finance 31, 973–997.
Investment Company Institute, 2012. Mutual Fund Fact Book, Washington DC.
Israel, R. B., 2001, Finding generators for Markov chains via empirical transition
matrices with applications to credit ratings. Mathematical Finance, II, 2, 245-265.

26
Jafry, Y., T. Schauermann, 2004. Measurement, estimation and comparison of credit
migration matrices. Journal of Banking and Finance, 28, 2603 – 2639.
Jarrow, R. A., F. Lando, S. M. Turnbull, 1997. A Markov model for the term
structure of credit risk spreads. Review of Financial Studies. 10, 481–523.
Jegadeesh N., Titman S., 1993. Returns to buying winners and selling losers:
implications for stock market efficiency. Journal of Finance 48, 65–91.
Khorana, A, Nelling E., 1998. The determinants and predictive ability of mutual fund
ratings. The Journal of Investing 7, 61–66
Kosowski R., Timmermann A., Wermers R., and White H., 2006. Can mutual fund
“stars” really pick stocks? New evidence from a bootstrap analysis. Journal of
Finance 61, 2551 – 2596.
Kuchler. U., Sorensen, M., 1997. Exponential Families of Stochastic Processes, New
York, Springer-Verlag.
Lando D., debergoSk T. M. 2002. Analyzing rating transitions and rating drift with
continuous observations. Journal of Banking and Finance, 26, 423-444.

27
Malkiel, B., 1995. Returns from investing in equity mutual funds 1971 – 1991.
Journal of Finance 50, 549 – 572.
Morey R. M., 2005, The kiss of death: a 5-star Morningstar fund rating? The Journal
of Investment Management 3, 41–52.
Morey R. M., Gottesman A., 2006. Morningstar Mutual Fund Ratings Redux. The
Journal of Investment Consulting 8, 25 – 37.
Morey, R. M., 2002. Mutual fund age and Morningstar ratings. Financial Analysts
Journal 58, 2, 56 – 63.
Morningstar Inc., 2008a. Fact sheet: the Morningstar Stewardship Grade for Funds
URL http://morningstaradvisor.com/uploaded/pdf/Stewardship.pdf
Morningstar Inc., 2008b. Fact sheet: Morningstar rating for Funds
URL:http://corporate.morningstar.com/us/documents/methodologydocuments/factshe
ets/morningstarratingforfunds_factsheet.pdf
Nickell P., Perraudin. W., Varatto, S., 2000. Stability of rating transitions. Journal of
Banking and Finance 24, 203 – 227.
28
Sharpe, William., 1998a. Morningstar’s risk-adjusted ratings. Financial Analysts
Journal 54, 21–32.
Sharpe, William., 1998b. Asset allocation: Management style and performance
measurement. The Journal of Portfolio Management 18, 7 – 12 .
Singer B., Spilerman S., 1976. The representation of social processes by Markov
models. American Journal of Sociology 82, 1 – 54 .
Truck S., Rachev S. T., 2011, Changes in migration matrices and credit VaR – a new
class of difference indices. Working Paper.
Warshawsky M., DiCarlantonio M., Mullan L., 2000. The persistence of Morningstar
ratings. Journal of Financial Planning 13, 110-128.
Wellman, J., Zhou, J., 2007. Corporate governance and mutual fund performance: a
first look at the Morningstar stewardship grades. Working Paper, Binghamton
University

29
Appendix A Two Classical Methods of Estimating Transition Matrices
Two classical methods of estimation transition probabilities are the
cohort/multinomial method and the duration/continuous-time method. While the
former is formulated in the discrete-time framework, the latter is used in the
continuous-time setting.
Cohort -Method
Let us consider a sample of N mutual funds whose monthly rating, assumed to be an
integer between 1 and 5 inclusive, are observed at the end of each month, over a
period of (T + 1) months from t = 0 to t = T inclusive. For references hereafter and in
other parts of this paper, we introduce the following notations:
(i) )(tni = the total number of mutual funds with a rating of i at month t
(ii) nij(t) = the number of rating transitions from i at time t - 1 to j at time t
(iii)
1
0
)(T
t
ii tnTN , the total number of mutual funds with a rating of i –
observed at time t = 0, 1, …, T – 1.
(iv)
1
0
)(T
t
ijij tnTN , the total number of rating transitions from i at time t - 1
to j throughout the entire observation period
30
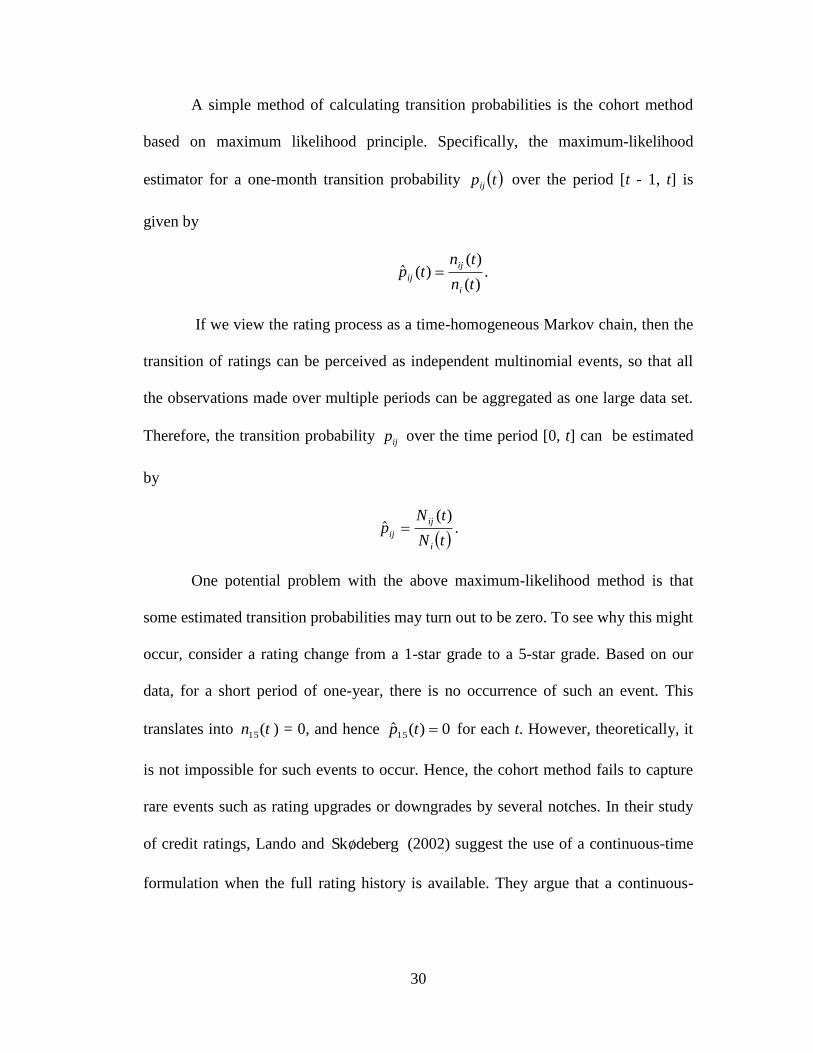
A simple method of calculating transition probabilities is the cohort method
based on maximum likelihood principle. Specifically, the maximum-likelihood
estimator for a one-month transition probability tpij over the period [t - 1, t] is
given by
.)(
)()(ˆ
tn
tntp
i
ij
ij
If we view the rating process as a time-homogeneous Markov chain, then the
transition of ratings can be perceived as independent multinomial events, so that all
the observations made over multiple periods can be aggregated as one large data set.
Therefore, the transition probability ijp over the time period [0, t] can be estimated
by
.
)(ˆ
tN
tNp
i
ij
ij
One potential problem with the above maximum-likelihood method is that
some estimated transition probabilities may turn out to be zero. To see why this might
occur, consider a rating change from a 1-star grade to a 5-star grade. Based on our
data, for a short period of one-year, there is no occurrence of such an event. This
translates into tn (15 ) = 0, and hence 0)(ˆ15 tp for each t. However, theoretically, it
is not impossible for such events to occur. Hence, the cohort method fails to capture
rare events such as rating upgrades or downgrades by several notches. In their study
of credit ratings, Lando and debergoSk (2002) suggest the use of a continuous-time
formulation when the full rating history is available. They argue that a continuous-

31
time model only solves the afore-mentioned problem, but also facilitates the
estimation of transition matrices over arbitrary time-horizons.
Duration-Method
As discussed in the preceding section, for a continuous-time Markov chain, the
transition matrix ),0( 0 , tpt, jiP over the period [0, t], for any t > 0, can be
calculated from a generator matrix ijλΛ whose elements satisfy the conditions
0λ ij for ji and
ij
ijii λλ .
The transition matrix P(0, t) is given by
Λ)P tt, exp( 0 ,
where Λt is the matrix obtained by multiplying every entry of the matrix Λ by t and
exp M of a square matrix M is the infinite power series
...!
1...
!3
1
!2
11exp 32 n
nMMMMM
The computational costs involved in calculating the above series is huge due to the
large number of matrix exponents involved. In practice, one could use the Jordan
decomposition of M to significantly reduce computational complexity.
One way to estimate the matrix Λ is to first obtain an estimator, 1 0ˆˆ ,PP
for a one-step transition matrix P using the cohort method. Under certain
conditions10
, the following infinite series of matrix sums
...ˆI1
...ˆI4
1ˆI3
1ˆI2
1ˆI432
n
nPPPPP
10
P̂ should satisfy some sufficient conditions. The mathematical details can be found in Israel et al.
(2001)
32
is known to converge to a matrix Q̂ (see Singer and Spilerman (1976) for a proof )
such that )QP ˆexp(ˆ . However, the matrix Q̂ is not guaranteed to have non-negative
off-diagonal entries, in which case it would fail to be a generator matrix for the
Markov chain. It is also possible that a true generator exists even though the above
series does not converge. In general, this is the well-known embeddability problem.
One can avoid the above problem by adopting the approach of Lando and
debergoSk (2002) in which the transition intensities for the generator matrix are
estimated directly via existing estimation techniques. Specifically, we obtain the
following maximum likelihood estimator for ijλ (see Kuchler and Sorensen 1998 )
ji
dss
T
i
ij
,
)(N
(T)Nλ̂
0
ij.
In the expression on the right-side of the above formula, )(N si is the number
of funds with rating i at time s. The term in the denominator is a count of the total
fund-month spent at state i over the period [0, T]. It accounts for any period of time
over which a fund carries a certain rating. Obviously, this estimator is inappropriate
when no information about the exact transition time is available. For mutual fund
ratings such as the star rating of Morningstar, the transition time can be taken to be
end of every month11
.
11
Morningstar calculates ratings at the end of each month and publishes them at the beginning of the
following month. See Morningstar (2008a).
33
Table 1 This table reports the average star rating overt time of mutual fund portfolios
formed by a fund’s initial rating. The sample funds are sorted into five portfolios by their
initial (month 1, November 2004) star rating (SR) (1-star to 5-star). The cross-sectional
subsequent average star rating of each portfolio, computed at quarterly intervals over the next
78 months, are displayed.
Initial Star Rating
1 2 3 4 5
Month
4 1.24 2.11 3.02 3.87 4.77
7 1.32 2.14 3.02 3.83 4.74
10 1.71 2.18 3.03 3.81 4.67
13 1.85 2.21 2.99 3.76 4.65
16 1.88 2.31 2.99 3.71 4.56
19 1.74 2.28 3.00 3.72 4.57
22 1.62 2.28 2.95 3.69 4.48
25 1.85 2.32 2.98 3.66 4.47
28 1.88 2.41 2.98 3.62 4.43
31 2.03 2.51 3.07 3.63 4.36
34 2.26 2.59 3.05 3.58 4.28
37 2.21 2.62 3.04 3.58 4.23
40 2.35 2.60 3.05 3.56 4.19
43 2.47 2.66 3.04 3.56 4.17
46 2.44 2.66 3.04 3.57 4.07
49 2.44 2.69 3.01 3.43 3.78
52 2.50 2.69 3.03 3.39 3.78
55 2.50 2.64 3.00 3.43 3.82
58 2.65 2.63 2.99 3.43 3.77
61 2.59 2.60 2.99 3.42 3.79
64 2.50 2.58 2.98 3.40 3.77
67 2.53 2.61 2.98 3.39 3.76
70 2.59 2.61 2.98 3.37 3.80
73 2.50 2.66 2.96 3.36 3.80
76 2.44 2.69 2.95 3.37 3.76
79 2.35 2.78 2.97 3.34 3.73
N 34 170 423 462 225

34
Table 2. This table reports results of statistical tests of time homogeneity of Morningstar
star rating using five test periods, each of length 12 months. Each period is divided into T =
12 monthly in (Panel A) and T = 3 yearly (in Panel B) test periods. *, **, and ** indicate
significance (against the null hypothesis) at the 10, 5 and 1% level of significance
respectively.
Panel A (T = 12 sub-periods of duration 1 month)
Panel B (T = 3 sub-periods of duration 12 months
Test for individual i Joint Test
Test for individual i Joint Test
Test Period
i Test
Statistics
Test
Statistics
Test Period
i Test
Statistics
Test Statistics
month 1 - 13
1 100.3***
1134.93***
month 1 -37
1 35.23***
361.71***
2 284.85***
2 66.58***
3 354.78***
3 84.18***
4 310.93***
4 123.35***
5 84.07***
5 52.37***
month 13 - 25
1 173.99***
908.45***
month 13 -49
1 363.39***
2904.40***
2 248.9***
2 631.26***
3 122.17***
3 793.04***
4 275.11***
4 642.68***
5 137.29***
5 474.04***
month 25 - 37
1 126.26***
1458.35***
month 25 - 61
1 387.01***
2600.91***
2 291.37***
2 509.97***
3 481.29***
3 663.13***
4 350.09***
4 607.76***
5 209.33***
5 439.04***
month 37 - 48
1 292.65***
3930.53***
month 37 - 73
1 663.98***
4399.98***
2 1035.17***
2 974.19***
3 1279.24***
3 1142.99***
4 946.02***
4 982.69***
5 377.46***
5 636.13***
month 49 - 61
1 103.07***
981.53***
2 216.23***
3 311.09***
4 243.74***
5 107.4***
month 61 - 73
1 57.21***
757.34***
2 114.33***
3 235.87***
4 234.34***
5 115.58***

35
Figure 1. In this figure, the graph in the i-th row and j-th column shows the transition probabilities
from state i to state j, where the state are indicated by the symbols ( , or )
representing the star rating of the funds: , for each of the four groups of funds classified as ‘U.S.
Stock’ , ‘International Stock’ , ‘Bond’ (‘Taxable Bond’ or ‘Municipal Bond’) and ‘Balanced’ funds
categorised under Morningstar’s ‘US Broad Category’ Classification). These funds have received
monthly star ratings (Abbrev SR) over the period November 2004 (Month 1) – December 2010 (Month
73).
0
0.2
0.4
0.6
0.8
1
0 12 24 36 48 60 72
Bal
Bond
Int
0
0.2
0.4
0.6
0.8
1
0 12 24 36 48 60 72
Bal
Bond
Int
0
0.2
0.4
0.6
0.8
1
0 12 24 36 48 60 72
Bal
Bond
Int
0
0.2
0.4
0.6
0.8
1
0 12 24 36 48 60 72
BalBondInt
0
0.2
0.4
0.6
0.8
1
0 12 24 36 48 60 72
BalBondInt
0
0.2
0.4
0.6
0.8
1
0 12 24 36 48 60 72
BalBondInt
0
0.2
0.4
0.6
0.8
1
0 12 24 36 48 60 72
Bal
Bond
Int
0
0.2
0.4
0.6
0.8
1
0 12 24 36 48 60 72
BalBondInt
0
0.2
0.4
0.6
0.8
1
0 12 24 36 48 60 72
Bal
Bond
Int

36
Figure 2. In this figure, the graph in the i-th row and j-th column shows the transition probabilities
from state i to state j, where the possible states are indicated by the symbols representing the star rating
of the funds ( , and ) , for each of the two rating group – ‘good stewardship
grade’ and ‘poor stewardship grade’. Funds with SG = ‘A’ are placed in the ‘Good SG’ group
while Funds with SG = ‘D’ or ‘F’ are placed in the ‘Poor SG’ group. These funds have
received monthly star ratings (Abbrev SR) over the period November 2004 (Month 1) –
December 2010 (Month 73) and have a stewardship grade (SG) reported for the month of
November 2004 (month 1).
0
0.2
0.4
0.6
0.8
1
0 12 24 36 48 60 72
Good SGPoor SG
0
0.2
0.4
0.6
0.8
1
0 122436486072
Good SG
Poor SG
0
0.2
0.4
0.6
0.8
1
0 12 24 36 48 60 72
Good SG
Poor SG
0
0.2
0.4
0.6
0.8
1
0 12 24 36 48 60 72
Good SGPoor SG
0
0.2
0.4
0.6
0.8
1
0 122436486072
Good SGPoor SG
0
0.2
0.4
0.6
0.8
1
0 12 24 36 48 60 72
Good SGPoor SG
0
0.2
0.4
0.6
0.8
1
0 12 24 36 48 60 72
Good SG
Poor SG
0
0.2
0.4
0.6
0.8
1
0 12 24 36 48 60 72
Good SG
Poor SG
0
0.2
0.4
0.6
0.8
1
0 12 24 36 48 60 72
Good SG
Poor SG
37
Table 3. This table shows the Newey-West adjusted t-statistics and statistics (in
parantheses) based on Wilcoxon’s signed rank. *** indicates significance at the 1% level.
3-star 4-star 5-star
3-star -8.27*** 7.22*** 12.46***
(-1313***) (1308***) (1278***)
4-star -9.19*** 7.07*** 16.14***
(-1313***) (1304***) (1313***)
5-star -9.07*** (5.49***) (3.32***)
(-1268***) (1219***) (920***)
Figure 3 The figures below are the graph of di (s, t) versus time for initial month s = 1
(November 2004), 13 (November 2005) an 25 (November 2006) and for all five initial rating
i (1-star to 5-star) and The sample consisting of funds classified as ‘U.S. Stock’ ,
‘International Stock’ , ‘Bond’ (‘Taxable Bond’ or ‘Municipal Bond’) and ‘Balanced’ funds
under Morningstar’s ‘US Broad Category’ classification that receive monthly star ratings
(Abbrev SR) over the period November 2004 (Month 1) – December 2010 (Month 73). The
time t at which each graph first crosses the time-axis is a measure of persistence of rating i.
Month 1: November 2004
-1
-0.8
-0.6
-0.4
-0.2
0
0.2
0.4
0.6
0.8
1
0 12 24 36
1-star
2-star
3-star
4-star
-1
-0.8
-0.6
-0.4
-0.2
0
0.2
0.4
0.6
0.8
1
0 12 24 36
1-star
2-star
3-star
4-star
-1
-0.8
-0.6
-0.4
-0.2
0
0.2
0.4
0.6
0.8
1
0 12 24 36
1-star2-star3-star4-star
Initial month = 1 Initial month = 13 Initial month = 25
38
Figure 4 The figures below are the graphs of the time series of transition probabilities
( probabilities of transition from 4-star to 5-star in Panel A and probabilities of transition
from 4-strar to 3-star in Panel B) for different starting months (months 1(November 2004),
month 13 (November 2005) an month 25(November 2006)) over a duration of 36 months.
The sample consisting of funds classified as ‘U.S. Stock’ , ‘International Stock’ , ‘Bond’
(‘Taxable Bond’ or ‘Municipal Bond’) and ‘Balanced’ funds under Morningstar’s ‘US Broad
Category’ classification that receive monthly star ratings (Abbrev SR) over the period
November 2004 (Month 1) – December 2010 (Month 73). .
Panel A Rating Upgrade from 4-star to 5-star Month 1 (Nov 2004) Month 13 (Nov 2005) Month 25(Nov 2006) Month 37(Nov 2007)
Panel B Rating Downgrade from 4-star to 3-star Month 1 (Nov 2004) Month 13 (Nov 2005) Month 25(Nov 2006) Month 37(Nov 2007)
0
0.1
0.2
0.3
0.4
0.5
0.6
0 12 24 36 48 60 72
Good SGPoor SG
0
0.1
0.2
0.3
0.4
0.5
0.6
0 12 24 36 48 60
Good SG
Poor SG
0
0.1
0.2
0.3
0.4
0.5
0.6
0 12 24 36 48
Good SGPoor SG
0
0.1
0.2
0.3
0.4
0.5
0.6
0 12 24 36
Good SG
0
0.1
0.2
0.3
0.4
0.5
0.6
0 12 24 36 48 60 72
Good SGPoor SG
0
0.1
0.2
0.3
0.4
0.5
0.6
0 12 24 36 48 60
Good SG
0
0.1
0.2
0.3
0.4
0.5
0.6
0 12 24 36 48
Good SG
Poor SG
0
0.1
0.2
0.3
0.4
0.5
0.6
0 12 24 36
Good SG