Cornell University Laboratory for Intelligent Machine Systems Optimizing Building Geometry to...
27
Cornell University Laboratory for Intelligent Machine Systems Optimizing Building Geometry to Increase the Energy Yield in the Built Environment Malika Grayson Dr. Ephrahim Garcia Laboratory for Intelligent Machine Systems Cornell University June 10 th , 2015 NAWEA Symposium 2015 Virginia Tech. 1
-
Upload
brenda-bell -
Category
Documents
-
view
230 -
download
14
Transcript of Cornell University Laboratory for Intelligent Machine Systems Optimizing Building Geometry to...

Cornell UniversityLaboratory for Intelligent Machine Systems
Optimizing Building Geometry to Increase the Energy Yield in the Built
Environment
Malika Grayson
Dr. Ephrahim Garcia
Laboratory for Intelligent Machine Systems
Cornell University
June 10th, 2015
NAWEA Symposium 2015
Virginia Tech.
1

Motivation: Why Urban Areas?
• 51% of the energy consumption in NYC came from buildings[1]
– 42% attributed to electricity
• On-site energy generation leads to a decrease in transmission losses – 6% of electricity lost in transmission[2]
• Use of a clean, green, and indigenous energy source to become more sustainable
3
Image Source: U.S. Department of Energy, 2012 Energy Data Book
[1] http://www.rrojasdatabank.info/statewc08093.4.pdf[2] Energy Information Administration
US Renewable Electricity Generation by Technology

4
Motivation: Flow behavior over rectangular buildings
• Local topography in urban areas decreases the velocity of the flow at lower levels but flow velocity increases with height
• Above high-rise buildings, the wind speed increases 20% higher than the local undisturbed velocity[2]
• Wind- turbine located on the roof center of buildings, requires a minimum tower height of 0.25(building height)[4]
Velocity vectors showing flow behavior[4]Pathlines showing flow behavior[3]
[2] Mertens, 2002[3] Mols, 2005[4] Brussel & Mertens, 2005[5] Blackledge et al., 2012
Image Source: a) Logan International Airport, Boston b) Dermont Wind Turbine, Brussel &
Mertens, 2005
ba
𝑷𝒐𝒘𝒆𝒓 𝑫𝒆𝒏𝒔𝒊𝒕𝒚=𝟏𝟐𝝆𝑽 𝟑
Illustration of the ‘speed up effect’ in a rural area due to the presence of a smooth hill[5]

Approach: Sloped façade
Goal: Investigate the effects of building morphology on wind flow to increase the potential wind energy yield in urban environments
• Two main parameters are needed for wind turbines– High wind velocity – Low Turbulence
• Changing the structure’s façade 1. Accelerate the mean flow velocity in the region directly above the roof top
resulting in a higher velocity wind field on the rooftop
2. Decrease the turbulence intensity
3. Decrease the flow separation region
5
θrectangular building Modified building using a sloped façade
leading edgeRoof middle
trailing endhp

Approach: Preliminary CFD
• Using Computational Fluid Dynamics (CFD), a 60m high-rise building was simulated– Fluent Ansys: realizable k-epsilon turbulence model
• Computationally cost effective– Reynolds stresses are modeled using eddy viscosity
• More robust than standard k-epsilon model– Standard k-epsilon performs poorly for flows with high separation
• Four different angles were simulated (20o, 30o, 45o, 60o ) and compared to a rectangular high-rise building
6
building
inlet farfield domain
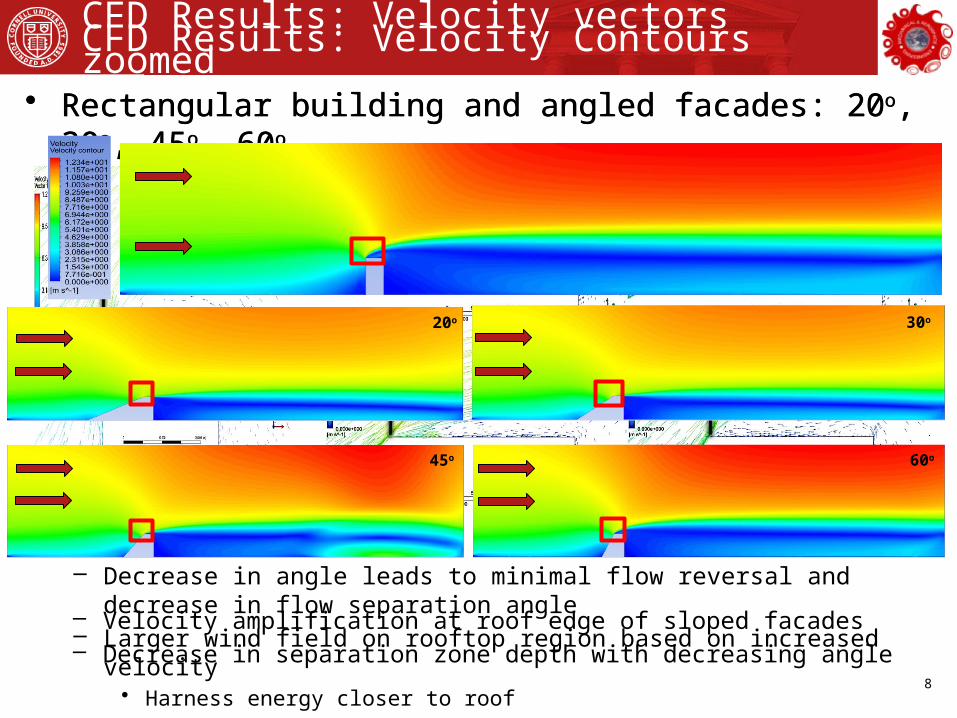
• Rectangular building and angled facades: 20o, 30o, 45o, 60o
– Decrease in angle leads to minimal flow reversal and decrease in flow separation angle
– Larger wind field on rooftop region based on increased velocity• Harness energy closer to roof
CFD Results: Velocity vectors zoomed
8
60o
30o
45o
20o
CFD Results: Velocity Contours
• Rectangular building and angled facades: 20o, 30o, 45o, 60o
– Velocity amplification at roof edge of sloped facades– Decrease in separation zone depth with decreasing angle
20o
60o
30o
45o
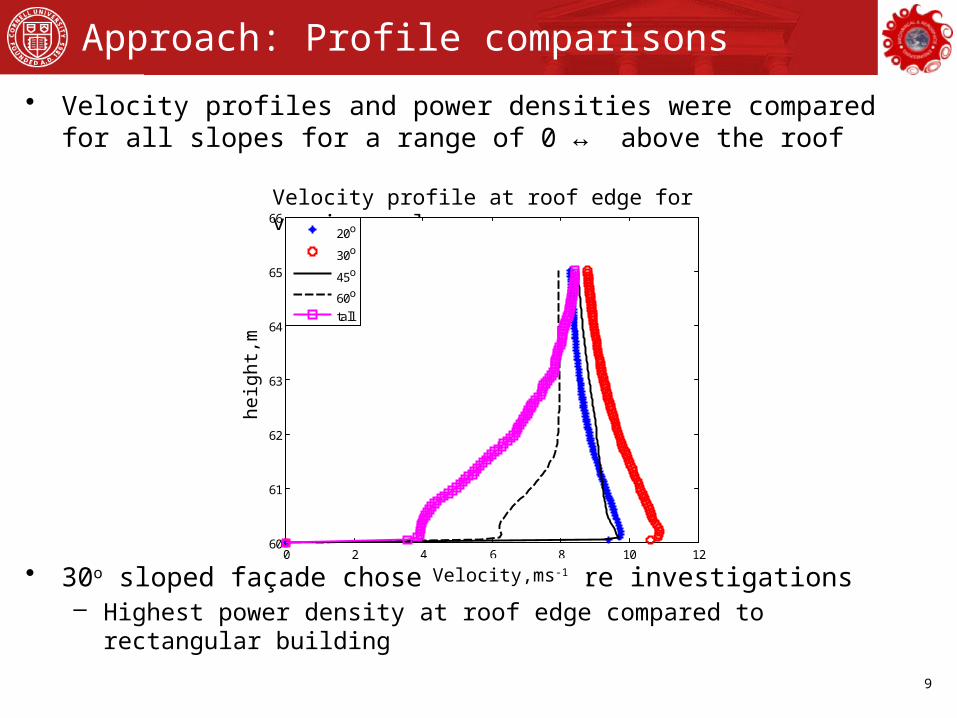
Approach: Profile comparisons
• Velocity profiles and power densities were compared for all slopes for a range of 0 ↔ above the roof
• 30o sloped façade chosen for future investigations– Highest power density at roof edge compared to rectangular building
9
rectangle
20o30o
45o
60o
Velocity profile at roof edge for varying angles
0 2 4 6 8 10 1260
61
62
63
64
65
66Velocity Profile at roof edge for varying angles
Velocity,ms-1
heig
ht,m
20o
30o
45o
60o
0 2 4 6 8 10 1260
61
62
63
64
65
66
Velocity,ms-1
Hei
ght,
m
20o
30o
45o
60o
tall
heig
ht,m
Velocity,ms-1
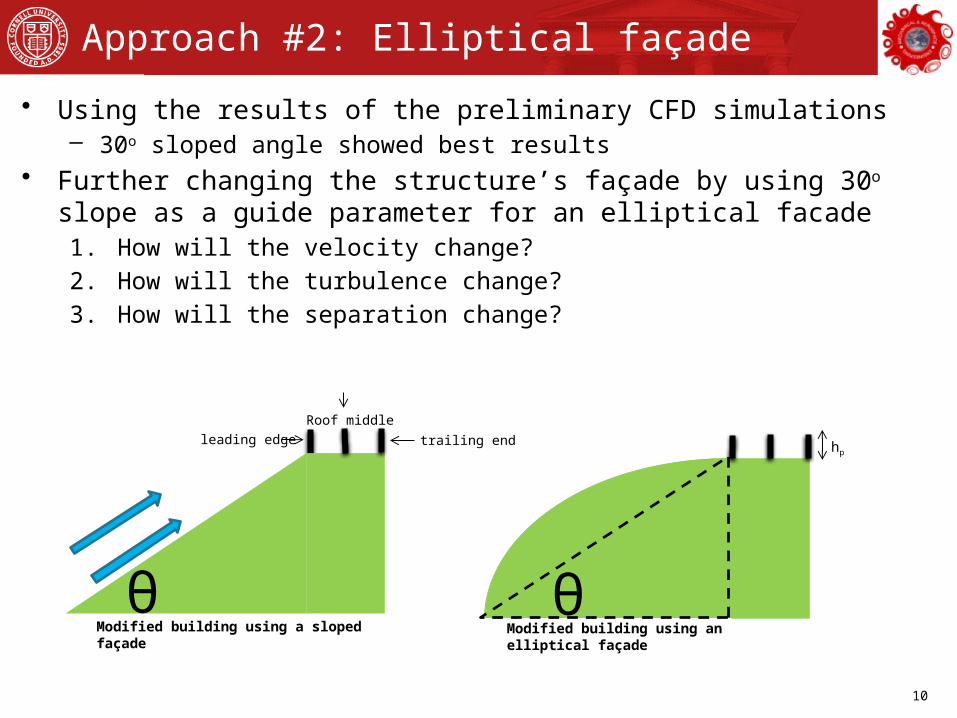
Approach #2: Elliptical façade
• Using the results of the preliminary CFD simulations– 30o sloped angle showed best results
• Further changing the structure’s façade by using 30o slope as a guide parameter for an elliptical facade1. How will the velocity change?
2. How will the turbulence change?
3. How will the separation change?
10
θModified building using a sloped façade
leading edge
Roof middle
trailing end hp
Modified building using an elliptical façade θ

11
Experimental Setup
• DeFrees wind tunnel system– 1m x 0.95m test section, 20m fetch– 1:300 model scale– Protuberances used to provide continuing
production of turbulence at lower level6
– Analytical relationship used for calculating roughness height 7
– 11m fetch of cubes– 7m fetch of cubes with 4m fetch of cylinders
• Measurement Process– Hot wire anemometry – 2D plane in centerline of building
[6] Cook,1973
hm = 0.2m
0.15m
0.08m0.05m
[7] Gatshore & De Croos, 1977

12
Experimental Results: Velocity Contours
• Increase in velocity directly above roof with sloped and elliptical façades • Area of higher velocity both close to and across entire roof top region• Enhanced velocity field increases wind energy yield potential • Potential energy yield at roof edge is increased with sloped façade• Separation bubble is further decreased with the presence of elliptical
facade
30o
0.67in = 5m full scale

Experimental Results: Velocity Profiles
0.2 0.3 0.4 0.5 0.6 0.7 0.8 0.9 1 1.1 1.21
1.5
2
2.5
U/U
z/h
m
rectangular
sloped
elliptical
0.2 0.3 0.4 0.5 0.6 0.7 0.8 0.9 1 1.1 1.21
1.5
2
2.5
U/U
z/h
m
rectangular
sloped
elliptical
0.2 0.3 0.4 0.5 0.6 0.7 0.8 0.9 1 1.1 1.21
1.5
2
2.5
U/U
z/h
m
rectangular
sloped
elliptical
3
𝐴𝑣𝑔=1h𝑝∫0
h 𝑝
𝑈 (h ) h𝑑
• Sloped leading edge location experienced average velocity increase over rectangle model ~ 6.29%– Rectangle model enhanced freestream
velocity ~ 23.5%– Sloped model enhanced freestream velocity
~ 32%
• Elliptical leading edge location experienced average velocity decreased compared to rectangle model ~ 13%
• Sloped roof middle location experienced average velocity increase over rectangular model ~ 90%
• Elliptical roof middle location experienced average velocity increase over rectangular model ~ 89.3%
• Sloped trailing end location experienced average velocity increase ~ 59%
• Elliptical trailing end location experienced average velocity increase ~ 61.7%
14
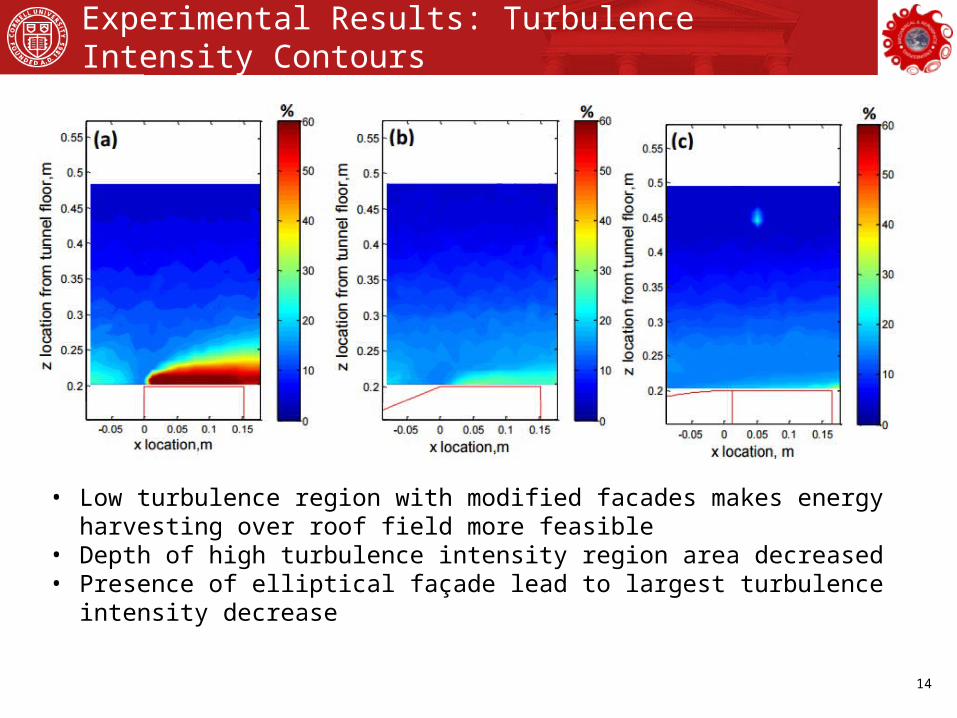
Experimental Results: Turbulence Intensity Contours
• Low turbulence region with modified facades makes energy harvesting over roof field more feasible
• Depth of high turbulence intensity region area decreased• Presence of elliptical façade lead to largest turbulence intensity decrease
15
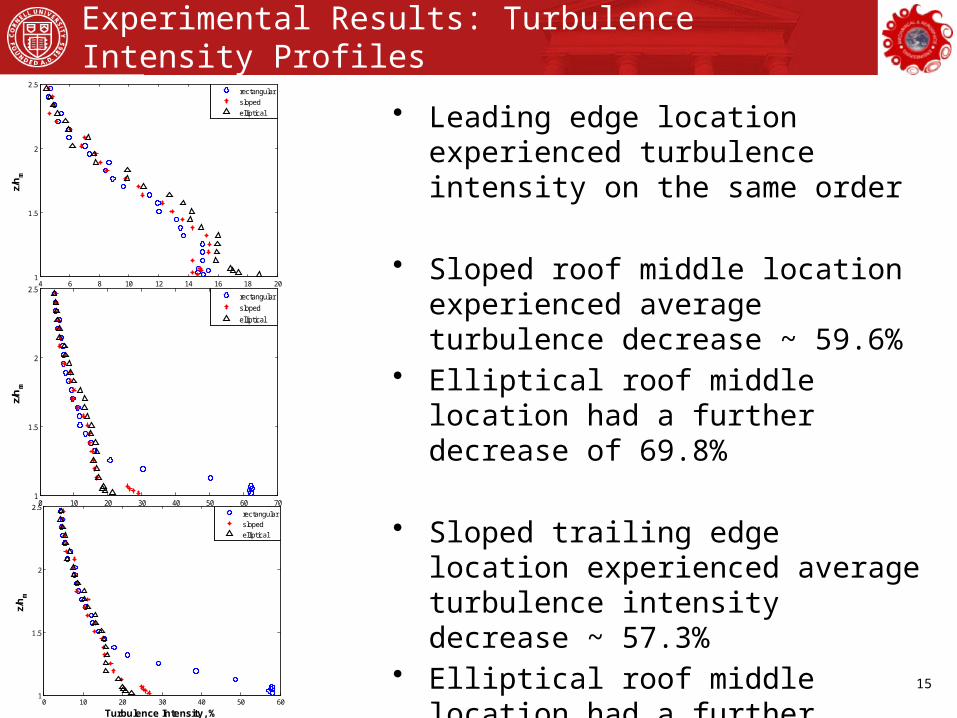
Experimental Results: Turbulence Intensity Profiles
4 6 8 10 12 14 16 18 201
1.5
2
2.5
Turbulence Intensity, %
z/h
m
rectangular
sloped
elliptical
0 10 20 30 40 50 60 701
1.5
2
2.5
Turbulence Intensity, %
z/h
m
rectangular
sloped
elliptical
0 10 20 30 40 50 601
1.5
2
2.5
Turbulence Intensity, %
z/h
m
rectangular
sloped
elliptical
• Leading edge location experienced turbulence intensity on the same order
• Sloped roof middle location experienced average turbulence decrease ~ 59.6%
• Elliptical roof middle location had a further decrease of 69.8%
• Sloped trailing edge location experienced average turbulence intensity decrease ~ 57.3%
• Elliptical roof middle location had a further decrease of 64.9%

16
Conclusions
• Assessed the wind energy potential using a sloped façade– Demonstrated there can be an increase by 90% in velocity with
simple building façade changes
• Established a larger area for potential energy yield closer roof top
• Accelerated the mean flow near the rooftop region across all roof locations
• Decreased the vertical extent of the separation bubble above the building
– Decreasing the separation angle at leading edge – Minimizing turbulence intensity: 69% decrease
• Subsequently increased the power density near the roof top region

17
Current & Future Considerations
• Optimization using angle guide to create varying elliptical façades
0 10 20 30 40 50 60 70 80 90 1000
0.050.1
0.150.2
0.250.3
0.350.4
0.450.5
Maximum Turbulence Intensity at hp
Leading Edge Middle Trailing Edge
Angle (Degrees)T
urbu
lenc
e In
tens
ity
0 10 20 30 40 50 60 70 80 90 1006
6.5
7
7.5
8
8.5
9
9.5
10
10.5
Maximum Velocity at hp
Leading Edge Middle Trailing Edge
Angle (Degrees)
Vel
ocit
y (m
/s)
θ

18
Current & Future Considerations
• Further preliminary studies– Elliptical façade models used as a base for 3D wind rose inspired
structures– Broader parameters used to find optimized shapes based on wind
direction and magnitude• Trough/Scoop radius• Base to width ratio

19
Acknowledgements
• National Science Foundation• Professor Bhaskaran, Swanson Simulation Lab Director• Ansys Technical Support: Mr. Guang Wu• Urban Wind undergraduate student team • Professor Ephrahim Garcia

20
Questions?
Thank You

21
EXTRA SLIDES…..

22
Procedure: Measurements
• Designed an automated positioner system which was able to move along each axis– Probe arm was free to move along Z axis
• Measurement Process– Hot wire anemometry – 2D plane in centerline of building– Sampling frequency – 60s @ 1Khz– Freestream velocity – 8.33 m/s
• Measurements taken 1/8 inches above model – 0.003174m ≡ 1/8 inches
-4 -2 0 2 4 6 80
2
4
6
8
10
12
14
16
18
20
z
Sample points
xy
z
distance downstream, indi
stan
ce fr
om tu
nnel
floo
r, in

23
Outline
• Motivation • Background• CFD Modeling • Experiments
• Validation• Preliminary• Future Work

24
Comparison with CFD
• Boundary conditions used in CFD– Inlet velocity profile U(z), used from wind tunnel, k(z) and ε(z)
calculated from previous profile equations using friction velocity, u*
• Recall
ε (𝑧)=𝑢∗
3
𝜅(𝑧+𝑧 0)𝑘(𝑧)=
𝑢∗2
√𝐶μ
• k(z) – mean kinetic energy per unit mass of flow fluctuations• ε(z) – rate at which turbulent kinetic energy dissipates • Cμ – modeling constraint

25
Comparison with CFD: Velocity contours of rectangle
• Both contours show similar flow acceleration above low velocity flow region
• Discontinuity at leading edge
CFD Simulation Experiment

26
Comparison with CFD: Velocity contours of slope
• Contour similarity - amplification at roof edge in both models• Enhanced flow velocity over entire roof region verified
ExperimentCFD Simulation

27
Comparison with CFD: Velocity Profiles Rectangular
0 1 2 3 4 5 6 7 8 90.2
0.25
0.3
0.35
0.4
0.45
0.5Wind tunnel comparison to CFD for rectangular model: roof end
Velocity, ms-1
heig
ht,m
experiment
CFD
0 1 2 3 4 5 6 7 8 9 100.2
0.25
0.3
0.35
0.4
0.45
0.5Wind tunnel comparison to CFD for rectangular model: roof edge
Velocity, ms-1
heig
ht,m
experiment
CFD
0 1 2 3 4 5 6 7 8 9 100.2
0.25
0.3
0.35
0.4
0.45
0.5Wind tunnel comparison to CFD for rectangular model: roof middle
Velocity, ms-1
heig
ht,m
experiment
CFD
Leading edge
heig
ht,m
Velocity,ms-1
Velocity,ms-1
Velocity,ms-1
Roof middle
heig
ht,m
Trailing end

28
Comparison with CFD: Velocity Profiles 30o Slope
0 1 2 3 4 5 6 7 8 90.2
0.25
0.3
0.35
0.4
0.45
0.5Wind tunnel comparison to CFD for sloped model: roof end
Velocity, ms-1
heig
ht,m
experiment
CFD
0 1 2 3 4 5 6 7 8 90.2
0.25
0.3
0.35
0.4
0.45
0.5Wind tunnel comparison to CFD for sloped model: roof edge
Velocity, ms-1
heig
ht,m
experiment
CFD
0 1 2 3 4 5 6 7 8 90.2
0.25
0.3
0.35
0.4
0.45
0.5Wind tunnel comparison to CFD for sloped model: roof middle
Velocity, ms-1
heig
ht,m
experiment
CFD
Leading edge
heig
ht,m
Velocity,ms-1
Roof middle
heig
ht,m
Velocity,ms-1Trailing end
heig
ht,m
Velocity,ms-1

29
Further Research
• Investigate additional façade and structure shapes– Analysis of simple façade changes– Three dimensional structural changes to
correlate with environmental conditions such as multiple flow directions
• E.g., Wind Rose
• Study the effects of the modified structure within an urban array– Building’s effect on flow behavior from
nearby building structures– Asymmetric orientation based on wind
distribution