
Core Idea Task Score Properties and Soup and Beans …€¦ · · 2009-10-07Core Idea Task Score...
103
Algebra Copyright © Noyce Foundation All rights reserved. 1 Balanced Assessment Test –Algebra 2009 Core Idea Task Score Properties and Representations Soup and Beans This task asks students write equation to describe objects on a scale. Students need to use proportional reasoning or equivalent expressions to find the ratio of beans to soup. Functions and Representations Quadratic This task asks students to work with quadratics in various forms, including substitution, graphical representations, and using algebra to solve the equation. Properties and Representations Circles and Spheres This task asks students to reason about equations and their graphs. Students should be able to distinguish functions on a graph by reasoning about the difference between multiplying by a number, the square of the number, or the number cubed. Successful students were able to solve an equation for one variable in terms of another. Functions Words and Equations This task asks students to read a simple scenario and match it to an equation representing the situation described. Successful students could work with equations involving subtraction and division as well as addition and multiplication. Functions and Representations Coffee This task asks students to use a chart to solve situations involving simultaneous equations. Successful students are moving from guess and check to using algebra to express relationships and solve equations.
Transcript of Core Idea Task Score Properties and Soup and Beans …€¦ · · 2009-10-07Core Idea Task Score...

Algebra Copyright © Noyce Foundation All rights reserved.
1
Balanced Assessment Test –Algebra 2009
Core Idea Task Score Properties and Representations
Soup and Beans
This task asks students write equation to describe objects on a scale. Students need to use proportional reasoning or equivalent expressions to find the ratio of beans to soup. Functions and Representations
Quadratic
This task asks students to work with quadratics in various forms, including substitution, graphical representations, and using algebra to solve the equation. Properties and Representations
Circles and Spheres
This task asks students to reason about equations and their graphs. Students should be able to distinguish functions on a graph by reasoning about the difference between multiplying by a number, the square of the number, or the number cubed. Successful students were able to solve an equation for one variable in terms of another. Functions Words and Equations This task asks students to read a simple scenario and match it to an equation representing the situation described. Successful students could work with equations involving subtraction and division as well as addition and multiplication. Functions and Representations
Coffee
This task asks students to use a chart to solve situations involving simultaneous equations. Successful students are moving from guess and check to using algebra to express relationships and solve equations.

Algebra Copyright © Noyce Foundation All rights reserved.
2

Algebra Copyright © Noyce Foundation All rights reserved.
3

Algebra Soup and Beans Copyright © Mathematics Assessment Resource Service. All rights reserved.
4
Soup and Beans This problem gives you the chance to: • make an equation and solve a problem The weight of one can of beans is x ounces. The weight of one can of soup is y ounces. 1. Write an expression for the weight of the cans on the left hand side of the weighing scales. ___________________________________ 2. Write an expression for the weight of the cans on the right hand side of the weighing scales. ___________________________________
3. Write an equation that shows the relationship between x and y.
_____________________________________________________________________________
4. Use your equation to find the number of cans of beans that balance 9 cans of soup. ____________ Show your work.
6
Soup Soup Soup
Soup SoupSoup
Beans Beans Beans
Beans
Beans BeansBeans Beans
Soup
Soup Soup Soup
Soup Soup Soup
Soup Soup Soup
?
Soup Soup Soup
Soup SoupSoup
Beans Beans Beans
Beans
Beans BeansBeans Beans
Soup
Soup Soup Soup
Soup Soup Soup
Soup Soup Soup
?

Algebra Copyright © Mathematics Assessment Resource Service. All rights reserved.
5
2009 Rubrics Soup and Beans Rubric The core elements of performance required by this task are: • make an equation and solve a problem Based on these, credit for specific aspects of performance should be assigned as follows
points
section points
1. Gives correct answer: 5x + 2y
1
1
2. Gives correct answer: 3x + 5y
1
1
3. Gives correct answers: 5x + 2y = 3x + 5y or 2x = 3y
1 1
4. Gives correct answers: 6 Shows correct work such as: 2x = 3y 6x = 9y
2 1
3 Total Points 6

Algebra Copyright © Noyce Foundation All rights reserved.
6
Soup and Beans Work the task and look at the rubric. What are the key mathematical ideas being assessed? ______________________________________________________________ Look at student work for part 1 and 2, writing expressions. How many of your students:
• Wrote correct expressions for the pictures?___________ • Wrote expressions with exponents?_________ • Wrote numbers sentences (no variables)?__________________ • Gave values for x and y?_________ • Other?_____________
What is confusing students about algebraic notation and the use of variables? Now look at student work for part 3, writing an equation. How many of your students:
• Wrote a correct equation?____________ • Combined like terms (8x +7y)?___________ • Gave values for x and y?___________ • Used exponents?__________ • Other?_____________
How do their misunderstandings about variable and notation effect their equations? What other misconceptions do you see as you examine their equations? Now look at their work in part 4. How many of your students put:
6 13.5 9 10 18 7 Other
Now examine their strategies. What were some of the misconceptions that you noticed in their work? What strategies did successful students use?

Algebra Copyright © Noyce Foundation All rights reserved.
7
Looking at Student Work on Soup and Beans Student A is able to write expressions and equations to represent the figures. The student is able to combine like terms in the equation using symbolic manipulation to find the equation 2x =3y. The student then realizes that he is not solving for x or y but looking for an equivalent ratio. Student A

Algebra Copyright © Noyce Foundation All rights reserved.
8
Student B gives a complete description of how to write the expressions and equation. The student then finds the unit ratio, y =2/3 x. The student doesn’t realize that the 9 is not the value of y, but the number of y units. So the 9 cannot be plugged into the equation to solve for x. This is a very subtle distinction. What question can we pose in the classroom to help students explore this idea? Student B

Algebra Copyright © Noyce Foundation All rights reserved.
9
Student C is able to write the expressions and equations. However the student seems to assign values to the soup and beans to reach a numeric value for x and y. The beans appear to be given a value 0.5. See the work in the top diagram. Can you figure out what the student is doing? Student C
Algebra Copyright © Noyce Foundation All rights reserved.
10
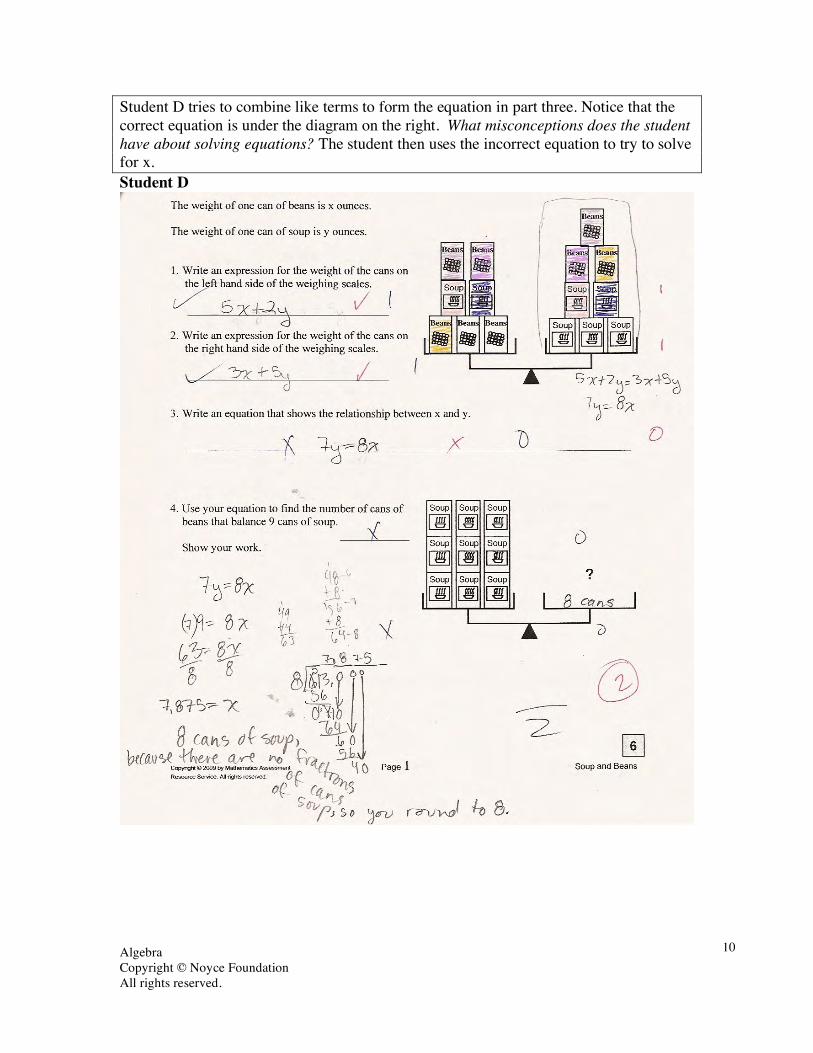
Student D tries to combine like terms to form the equation in part three. Notice that the correct equation is under the diagram on the right. What misconceptions does the student have about solving equations? The student then uses the incorrect equation to try to solve for x. Student D

Algebra Copyright © Noyce Foundation All rights reserved.
11
Student E has also tried to combine like terms and then generalize about the values. Can you follow the reasoning that led to the equation x = y +1? What would be your next steps with this student? Student E

Algebra Copyright © Noyce Foundation All rights reserved.
12
Student F writes the meaning of the variable instead of the expression in parts 1 and 2, but is able to build a correct equation in part 3. The student tries to use a table to solve for the cans of beans in part 5. Students often have trouble setting up tables for themselves, because too often the logic of designing the table is done by the textbook. Students pick up only pieces of the logic of making a table. How could the table be modified to help the student find the correct number of cans? Student F

Algebra Copyright © Noyce Foundation All rights reserved.
13
Student G uses number sentences instead of writing expressions in part 1 and 2. This means that the equation will have a numerical value or be in a familiar form. What is the conceptual understanding of equality that a student needs to make an equation from the diagram? Student G

Algebra Copyright © Noyce Foundation All rights reserved.
14
Student H does not understand algebraic notation and uses exponents in the expressions and equation. Notice that in part 4 the student assigns a value to the soup and beans rather than solving for x and y. Student H
Algebra Copyright © Noyce Foundation All rights reserved.
15
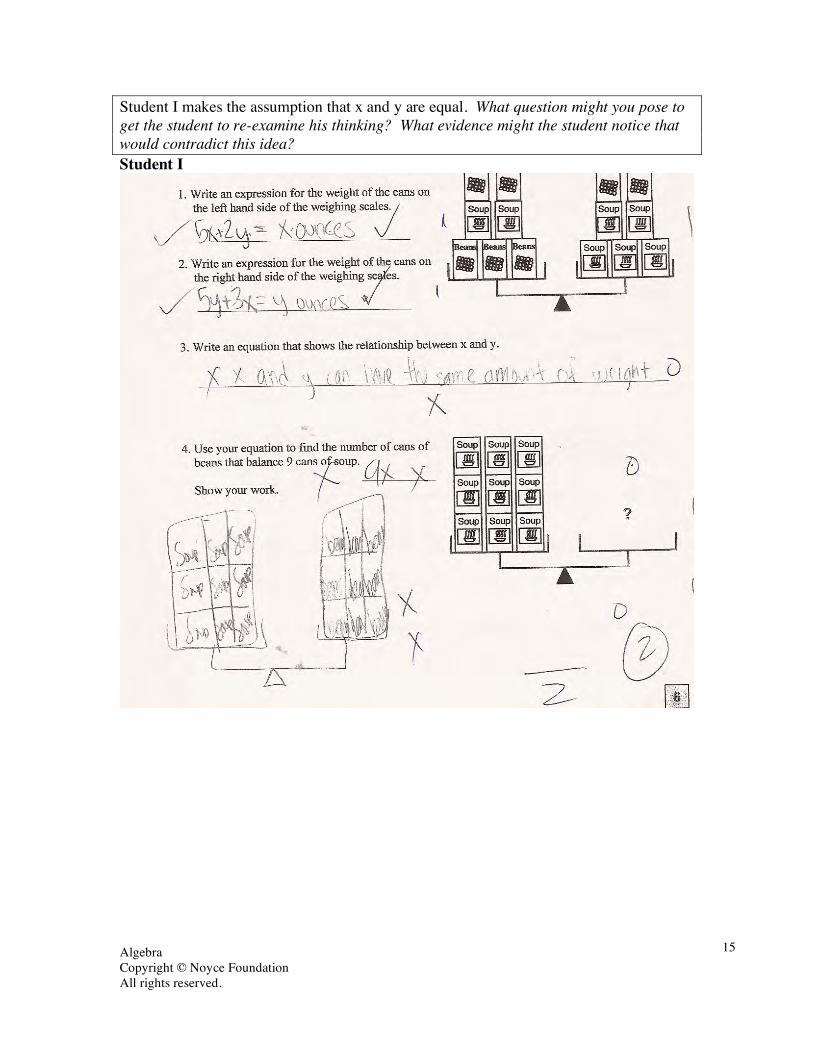
Student I makes the assumption that x and y are equal. What question might you pose to get the student to re-examine his thinking? What evidence might the student notice that would contradict this idea? Student I

Algebra Copyright © Noyce Foundation All rights reserved.
16
Algebra Task 1 Soup and Beans
Student Task Make an equation and solve a problem. Core Idea 3 Algebraic Properties and Representations
Represent and analyze mathematical situations and structures using algebraic symbols.
• Understand the meaning of equivalent forms of expressions, equations, inequalities, or relations.
• Write equivalent forms of equations, inequalities and systems of equations and solve them.
• Use symbolic algebra to represent and explain mathematical relationships.
Mathematics of this task:
• Writing an expression from a diagram • Understanding the relationship of equality in the context of a balanced scale • Using equivalent ratios in context • Distinguishing between a numerical coefficient and a value for the variable • Understanding when there is sufficient information to solve for a variable • Understanding meaning of variable or unknown
Based on teacher observations, this is what algebra students know and are able to do:
• Write expressions for diagrams • Write equations for the diagram
Areas of difficulties for algebra students:
• Trying to assign values to x and y • Trying to combine like terms from different sides of an equality • Understanding the concept of equality illustrated in the diagram • Using relational thinking to find equivalent ratios

Algebra Copyright © Noyce Foundation All rights reserved.
17
The maximum score available for this task is 6 points. The minimum score needed for a level 3 response, meeting standards, is 3 points. Most students, 87%, could write expressions for each side of the diagram. More than half the students, 69%, could also combine the expressions to make an equality statement about the diagram. 31% could meet all the demands of the task including using the new diagram and equivalent ratios to find the number of cans of beans to equal 9 cans of soup. Almost 11% of the students scored no points on this task. All of the students in the sample with this score attempted the task.

Algebra Copyright © Noyce Foundation All rights reserved.
18
Soup and Beans Points Understandings Misunderstandings
0 All of the students in the sample with this score attempted the task.
Students struggled with writing expressions from the diagram. Some students wrote number sentences, such as 5 + 2 = 7. Some students used exponents, such as x5 + y2. Some students tried to solve, giving answers like x=5 or y = 2.
2 Students could write expressions to represent the relationships in the diagram
Students struggled with writing the equation represented by the balance scale. 7% of the students wrote the expression 8x + 7y. Some students assumed that x = y or that x=y +1. Some students had equations with exponents. Others gave values for x and y.
3 Students could write expressions and equations for the situation depicted by the balance scale.
Students did not know how to combine the information in the diagram and the equation to find the number of cans of beans. 10% of the students thought the answer was 10. 10% thought the answer was 9. 8% thought the answer was 13.5. Many students got 2x = 3y and did no further work. 7% tried to substitute in 9 for y to get 2x = 27.
6 Students could write expressions and equations for the situation depicted by the balance scale. Students realized that 9 was the number of cans, not a value for y and could use equivalent ratios to find the number of cans of beans.
Algebra Copyright © Noyce Foundation All rights reserved.
19
Implications for Instruction Students need more experiences using algebra to describe relationships. They should be able to understand and use equal value to write equations. Some students struggle with the basic concept of variable as a symbol describing a relationship between objects versus an answer. Students need more opportunity to work with algebraic ideas in context. Students should be able to recognize equalities in situations, such as using a balance scale. Many students tried to combine the x’s to equal the y’s. They didn’t think about the left side of the balance being equal to the right side of the balance. Students need to understand the difference between a numerical coefficient and the value of the variable. Students saw the total of 8x and 7y and tried to define relationships with expressions like x = y +1. Students were not thinking about multiplicative relationships. They also missed basic principals of symbolic manipulation, such as using inverse operations. We want students to develop instincts about when there is enough information to solve for x or y and when there isn’t enough information. This will help them when confronted with unusual problems like this one, where they needed instead to find equivalent ratios. Context is so important to developing a deeper conceptual understanding of algebraic principles because so many other ideas are brought into play that don’t arise when just following procedures. Ideas for Action Research The Berkeley Lesson Study team at Willard Middle School developed a lesson on looking at numeric and symbolic strings. The Lesson, “Things that Mingle”, was taught by Jacob Disston. The idea was to help students begin looking at the expressions and equations as mathematical objects with varying attributes. This lesson is designed to push students to make connections between ideas about equations, inequalities, and expressions. The lesson gives students opportunities to use mathematical vocabulary for a purpose: to describe, discuss, and work with these number strings. In the process it is hoped that the students begin developing instincts about these symbolic, numeric strings, what might be used for. If this were on a test what might be the question? What is the purpose of looking at numeric strings as objects and gathering global information about the whole number string rather than thinking only about individual procedures or steps? Hopefully students will begin to see the number strings as mathematical objects with their own unique set of attributes. The lesson is designed to go across several standards in the algebra strand and to help students make connections across standards. The lesson also explores various pedagogical strategies aimed at increasing student involvement, particularly from the African American and Latino students to help close the achievement gap. Students first need to walk around the room and interact with each to find people with number strings. Students are then asked to huddle at the board to discuss groupings. Cards are used for recording so that they can be moved easily if different students make different connections. Students are then placed in groups to have deeper conversations. They are also given opportunities to write and reflect as the lesson progresses.

Algebra Copyright © Noyce Foundation All rights reserved.
20
Video, worksheets, discussion, student work, and a complete lesson plan are available on the Noyce website, Inside Mathematics: a professional learning community for educators. Sit down with colleagues and look at key parts of the lessons and lesson goals. Then discuss how the lesson changed the thinking of students. What changed about the attributes that they discussed? How were opportunities for conversation built into the lesson? How did features of the lesson increase the level of student participation? How might some of the ideas in this lesson help some of the struggles and misunderstandings that you saw in student work on this task. www.Insidemathematics.org
The Math Things Mingle 7th grade mathematics lesson Willard Middle School to be taught by Jake Disston Thursday January 22, 2009 Mathematical Topic: Algebraic Symbol Strings – Making sense of the differences between equations, inequalities and expressions. Lesson Objectives:
• To have students sort and classify various types of equations, inequalities and expressions. • To help students develop instincts and vocabulary for describing, discussing and working with
equations, inequalities and expressions. • To give students an opportunity to discuss and express what they know about various mathematical
objects without providing a script or a procedure for them to follow. Lesson Background: Our lesson study group began the year by creating a list of big ideas that we feel students need to be comfortable with in order to succeed in 8th grade Algebra. We deliberately focused on ideas that were big and conceptual and which from our perspective reached across specific standards and through the middle school grades, rather than focusing on specific skills or procedures described in one particular standard and belonging to one grade level. We distilled our list down to four ideas that we felt were essential for students to have significant experience with and of which they should have a strong understanding by the end of 7th grade:
• variables • equality • operations • different types of numbers
This year our district adopted a new text book published by Holt. In our lesson study group, our discussions this year have largely focused on the need to balance the procedurally based material presented in the text book with opportunities for students to make sense of the big ideas in a way that enables them to both ground their mathematical understanding in the context of their own lives, and to make connections between ideas so that the knowledge they are building is coherent. Our discussions and work have also been influenced by the pedagogical practices associated with the Center For Culturally Responsive Teaching and Learning, an organization that is providing professional development at our school aimed at helping teachers incorporate routines and activities that enhance the engagement of African American and Latino students and ultimately reduce the achievement gap that is so apparent at our school. Our lesson is adapted from an activity that Ann Lawrence presented at the 2007 California Math Council Conference at Asilomar. The activity is called “See what your kids know” and presents students with a set of 12 cards, each containing a mathematical symbol string – equations, including single and double variable equations, formulas, identities, and also expressions. Students are asked to sort the cards into sets that make sense to them, to describe the attributes that the items in the set share, and to create new examples that fit within each of the sets. We like the activity in that it creates an opportunity for students to apply their own understanding and language to work with a variety of mathematical objects simultaneously, rather than presenting a single idea and dictating what students do and how they do it, as typical text book activities do. Our plan tries to address two main concerns that we have: 1) that we create a set of cards that are appropriate for 7th graders and which highlight the mathematical concepts of variable and equality, and 2) that we create a structure in which all students can become engaged, and that the teacher fosters a discussion in which students articulate their understanding of the ideas and connections between them that go deeper than just surface level, trivial observations at which students often stop.
Algebra Copyright © Noyce Foundation All rights reserved.
22
Our Lesson: We will start by passing a card to each student. Each card will contain a single symbol string – an equation, an inequality or an expression. Students will be asked to stand up and mingle with each other, trying to find all the other students who have a symbol string that they feel is similar to their own. The teacher will circulate, encouraging students to explain what they are seeing and how they are grouping together. Once students have grouped together into sub-sets, the teacher will call all students to the board for a huddle. On the board there will be set of the same cards. The teacher will foster a discussion in which students share their initial thoughts about the cards and the subgroups into which they can be sorted. The object of this huddle will be to allow the class to come to some consensus about the sorts of attributes that are important in sorting and distinguishing the various symbol strings, and ultimately to establish at least the three ‘top level’ sub groups: equations, inequalities and expressions. Next students will be asked to sit at a table with other students with the same ‘top level’ type of card. The teacher will collect these cards, and will pass out a complete set of cards to each group and ask students to sort the whole deck into the ‘top level’ sub-groups. Once they have completed the first sort they will be asked to answer a reflection question on their activity recording sheet: 1) how can you tell the differences between equations, inequalities and expressions?

Algebra Copyright © Noyce Foundation All rights reserved.
23
!
4x + 2 "18
!
2x "16
!
5x "1# 34
B – 2 > 0
!
m
5 > 20
X – 7 < 5
3x + 2y + 2x
3a – 2b + 4c - a
4p + 3p – 2p
5 ( x + 2)
Algebra Copyright © Noyce Foundation All rights reserved.
24
3b + 4p + 17
3x + 2y + 4z

Algebra Copyright © Noyce Foundation All rights reserved.
25
105 + 2a = 101
3x + 2x = 5x
a + (b + c) = (a + b) + c
F • 1 = F
X + Y = Y + X
V ( W + X) = VW + VX
3 + 2n = 8
40 = 5x

Algebra Copyright © Noyce Foundation All rights reserved.
26
-4m ≤ 8
3x - 4 ≤ -8
2 – p > 7
3
42
m
mm •
3p + 7m 4n - 6
3
42)4(
c
ba •
y = 2
x = ¼
A = L • W
P = 2W + 2L

Algebra Quadratic Copyright © 2009 by Mathematics Assessment Resource Service. All rights reserved.
27
Quadratic This problem gives you the chance to: • work with a quadratic function in various forms This is a quadratic number machine.
1. a. Show that, if x is 5, y is 7. _________________________________________________
b. What is y if x is 0? _______________________________________________________
c. Use algebra to show that, for this machine, y = x2 – 2x – 8. _________________________
__________________________________________________________________________
__________________________________________________________________________
The diagram on the next page shows the graph of the machine’s quadratic function y = x2 – 2x – 8 and the graphs of y = 3 and y = x.
2. a. Which point on the diagram shows the minimum value of y? ____________________
b. Which point(s) on the diagram show(s) the solution(s) to the equation 3 = x2 – 2x – 8?
__________________________________________________________________________
c. Which point(s) on the diagram show(s) the solution(s) to the equation x = x2 – 2x – 8?
__________________________________________________________________________
xSubtract
1
Square the
result ySubtract
9

Algebra Quadratic Copyright © 2009 by Mathematics Assessment Resource Service. All rights reserved.
28
3. a. Use the graph to solve the equation x2 – 2x – 8 = 0. Mark the solutions on the graph.
x = _________ or x = ___________
b. Use algebra to solve the same equation.
__________________________________________________________________________
__________________________________________________________________________
__________________________________________________________________________
__________________________________________________________________________
x
y
5
10
15
20
-5
-10
-15
-4 -3 -2 -1 0 1 2 3 4 5 6
A
B
C
D
E
9

Algebra Copyright © 2009 by Mathematics Assessment Resource Service. All rights reserved.
29
Quadratic Rubric The core elements of performance required by this task are: • work with a quadratic function in various forms Based on these, credit for specific aspects of performance should be assigned as follows
points
section points
1. a. Gives a correct answer: 5 4 16 7 b. Gives a correct answer: - 8 c. Gives a correct answer: y = (x – 1)2 – 9 = x2 – 2x + 1 – 9 = x2 – 2x - 8
1 1 2
4
2. a. Gives a correct answer: C b. Gives a correct answer: A and E c. Gives a correct answer: B and D
1 1 1
3
3. a. Gives a correct answer: -2, 4 b. Gives a correct answer such as: (x+2)(x-4) = 0, so x = -2 or 4
or uses completing the square to find 1 or 2 correct answers or uses quadratic formula.
1
1
2
Total Points 9

Algebra Copyright © 2009 by Noyce Foundation All rights reserved.
30
Quadratic Work the task and look at the rubric. What are the key mathematical ideas being assessed? _____________________________________________________________ Look at student work on part 1b, using the using the number machine. How many of your students put:
-8 -10 0 7 10 Other
What caused some of the student errors? What did they struggle with? Now look at work on part 1c, using algebra to show that the number machine is equivalent to the equation y = x2 –2x – 8. How many of your students:
• Wrote an expression for the number machine and then carried out the algebraic manipulations to show that the result was equal to the equation?
• How many tried to use substitution of values to show that both would give the same answer?
• How many students were unwilling to attempt this part of the task? How often do students in your class get opportunities to use algebra to make a proof or justification? Do students get opportunities to rectify different equations that come up when identifying patterns? What do students in your class seem to understand about justification? Look at work on part 2b. How many of your students put:
A & E E B & D B C All No answer
Other
What are some of the misconceptions behind these responses? Now look at work on part 2c. How many of your students put:
B &D D C B A &E All No answer
Other
Now look at student work on part 3a.
• How many of your students could use the graph to find the correct values for x?_________
• How many students made errors with the signs for x?_________ • How many of the students were not able to give a response?_________
What other errors did you see?

Algebra Copyright © 2009 by Noyce Foundation All rights reserved.
31
Now look at student work for solving the quadratic for x. How many of your students: • Used factoring?____________ • Used substitution?__________ • Attempted the quadratic formula?__________ • Had no strategies for using the equation?___________
How much work have your students had with factoring? Do you see evidence that they understand or see the purpose for factoring to solve an equation? What are the big ideas or underlying conceptual knowledge that we want students to have about quadratics and their solutions?

Algebra Copyright © 2009 by Noyce Foundation All rights reserved.
32
Looking at Student Work on Quadratic Student A is able to use the number machine to calculate values for y. The student understands how to encode the number machine into an algebraic expression. In trying to prove that the machine is equal to the equation y = x2 –2 – 8, the student sets it equal to the expression representing the machine. The student doesn’t understand that the steps for transforming the expression need to be shown to complete the argument. The student is able to use factoring and setting the factors equal to zero to find the solutions to the quadratic equation. Student A

Algebra Copyright © 2009 by Noyce Foundation All rights reserved.
33
Student A, continued

Algebra Copyright © 2009 by Noyce Foundation All rights reserved.
34
Student B tries to use substitution to prove that the number machine is equal to the equation y = x2 –2 – 8. To find the solution to the equation x = x2 –2 – 8, the student uses factoring. However when needing the same information in part 3b, the student uses the quadratic equation. Do you think the student knows that both are yielding the same solution? What question would you like to pose to the student to probe for understanding? Student B
Algebra Copyright © 2009 by Noyce Foundation All rights reserved.
35
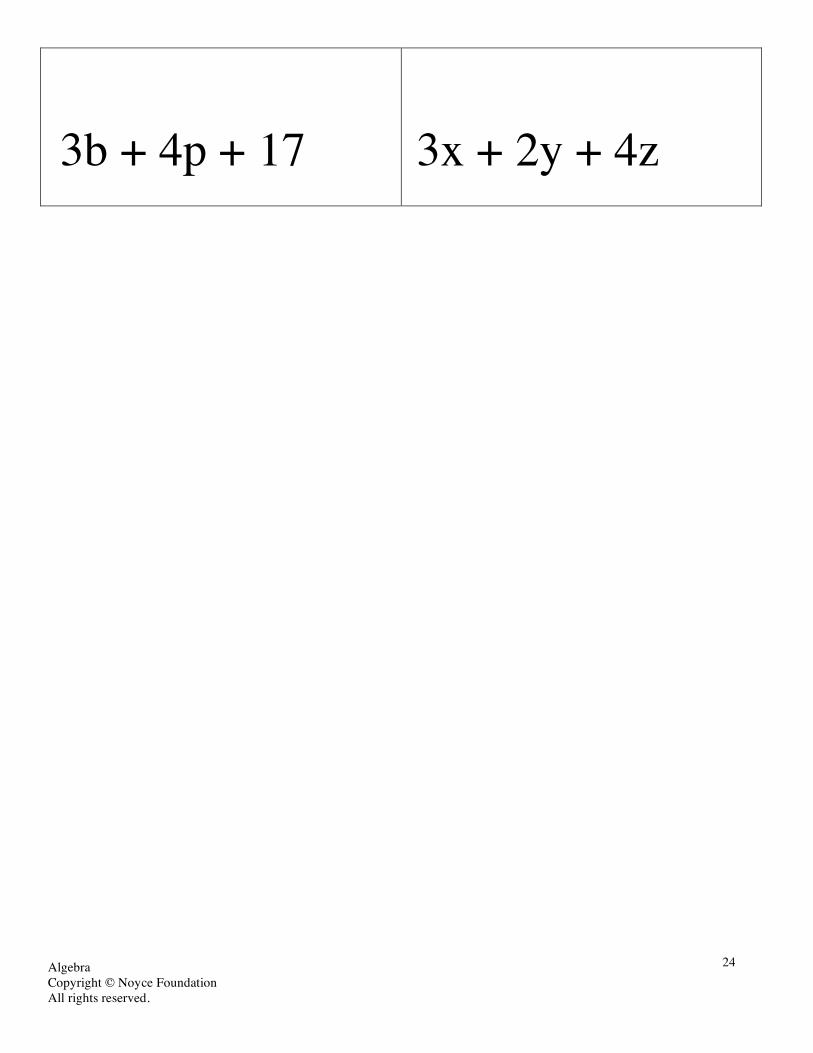
Student B, continued
Student C is able to calculate y using the number machine. The student does not attempt to show why the number machine is equal to the equation y = x2 –2 – 8. The student understands the minimum value on the parabola. But the student doesn’t connect the equations to solutions on the graph in part 2. In part 3, the student does seem to understand that the solution of a quadratic is the value of x when y = 0. However the student has not mastered how to find these solutions using algebra. Instead the student uses guess and check to find the solution.

Algebra Copyright © 2009 by Noyce Foundation All rights reserved.
36
Student C
Algebra Copyright © 2009 by Noyce Foundation All rights reserved.
37
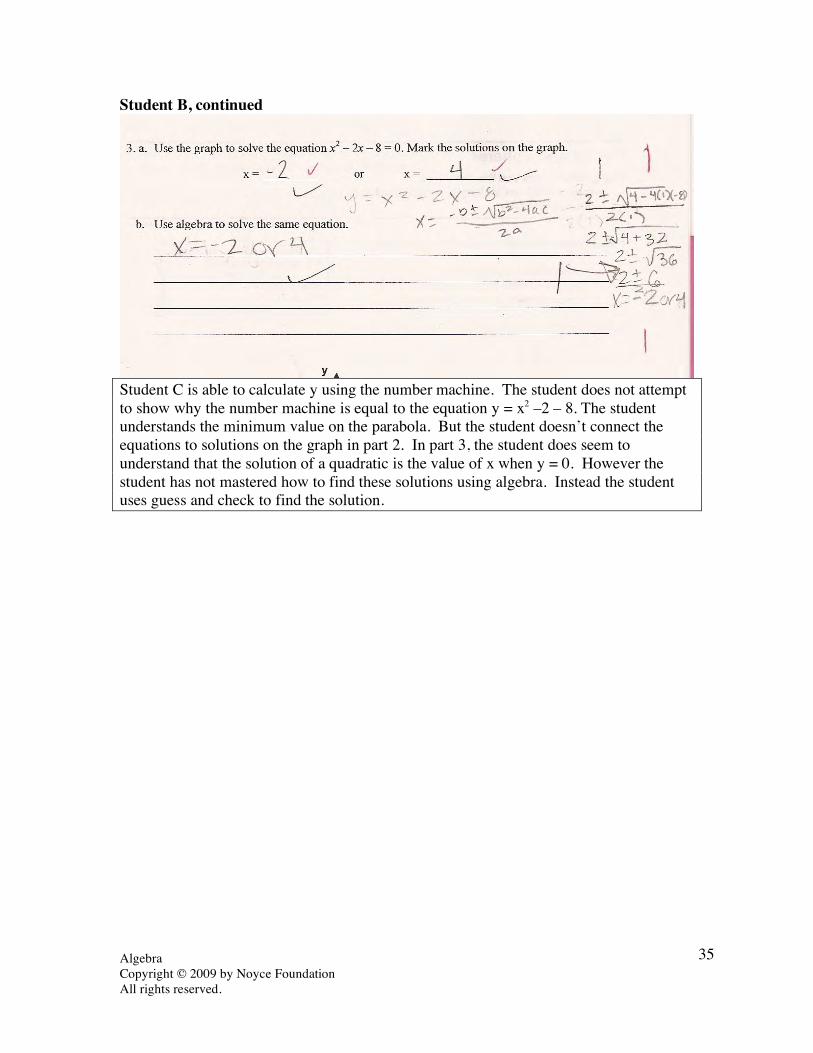
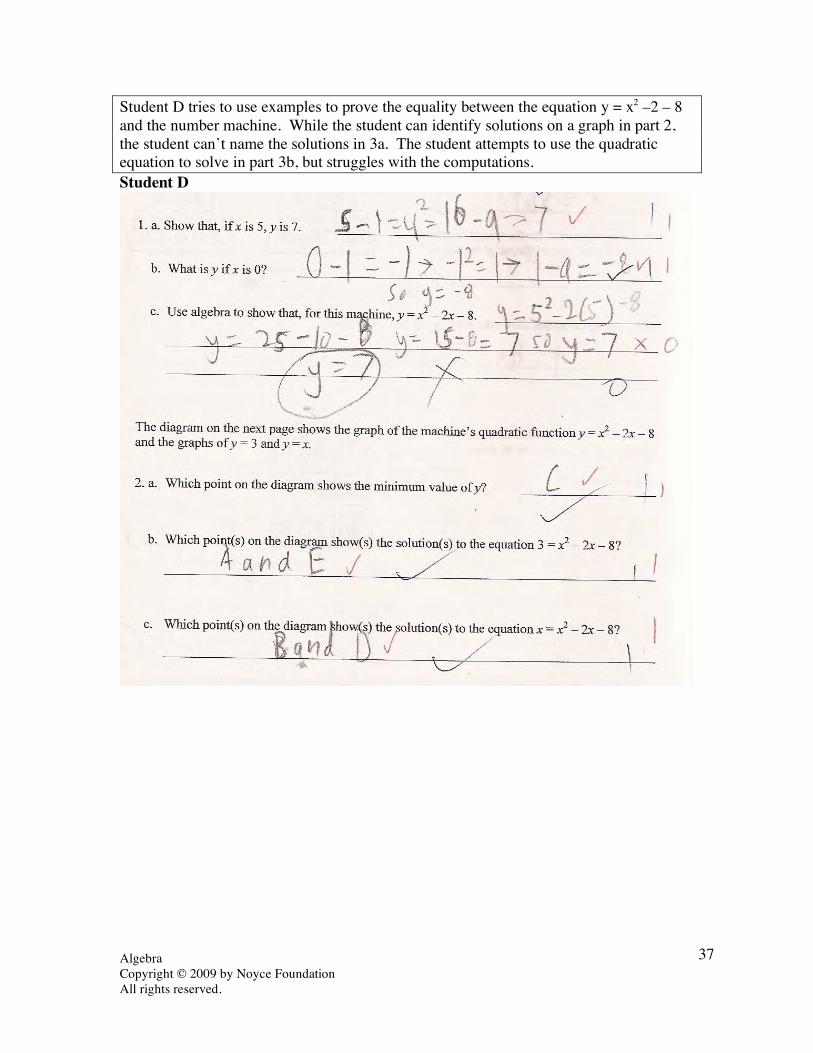
Student D tries to use examples to prove the equality between the equation y = x2 –2 – 8 and the number machine. While the student can identify solutions on a graph in part 2, the student can’t name the solutions in 3a. The student attempts to use the quadratic equation to solve in part 3b, but struggles with the computations. Student D

Algebra Copyright © 2009 by Noyce Foundation All rights reserved.
38
Student D, continued
Student E struggles with detail and signs. In 1b the student either doesn’t square the –1 or adds – 1 and –9 incorrectly. In 1c the student factors the equation y = x2 –2 – 8, which yields an equality, but doesn’t connect the equation to the number machine. The student loses track of what needs to be proved. In part 3 the student understands that the equation needs to be factored, but doesn’t use the factors to set up equations equal to zero. Thus, the student’s solutions have incorrect signs. Student E

Algebra Copyright © 2009 by Noyce Foundation All rights reserved.
39
Student E, continued
Student F is able to do the calculations in 1a and 1b. The student doesn’t seem to understand what is meant by proving that the calculations in the number machine are the same as the equation. The student writes about what is confusing in the equation. While the student answers part of 2 correctly, the uncertainty or tentativeness of the solution is clear. In part 3, the student attempts to manipulate the equation in a manner that would solve for x. However when solving a quadratic the equation needs to be in the form 0 = ax2 +bx +cy2. The scorer should not have given the process point.

Algebra Copyright © 2009 by Noyce Foundation All rights reserved.
40
Student F

Algebra Copyright © 2009 by Noyce Foundation All rights reserved.
41
Student G struggles with representing ideas symbolically. The student can do the step-by-step calculations in the number machine. When attempting to express those actions in algebra the student only squares the (-1) rather than the whole quantity (x-1). The student doesn’t know how to connect solutions to the graphical representation in part 2. Student G also understands that the solution for a quadratic can be found by factoring, but doesn’t know how to complete the process. Student G

Algebra Copyright © 2009 by Noyce Foundation All rights reserved.
42
Student G, continued
Student H is also confused by the graphical representations. First the student doesn’t seem to connect the description of the graph with the idea that 3 different equations are being displayed. The student doesn’t realize that minimum is a term used with quadratics and parabolas. The student does lots of symbolic manipulation but can’t make sense of the information. Student H

Algebra Copyright © 2009 by Noyce Foundation All rights reserved.
43
Student H, continued

Algebra Copyright © 2009 by Noyce Foundation All rights reserved.
44
Student I struggles with calculations. The student should not be given credit for the solution in 1a because the 4 is never squared. 4-9 ≠ 7. The student also errs in solving 1b. The student does not realize that the solution given in part 1c is not equal. While the student is able to guess one of the 2 points correctly in 2b and 2c, it is unclear if this is just luck. What do you think this student needs? What would be your next steps? Student I

Algebra Copyright © 2009 by Noyce Foundation All rights reserved.
45
Algebra Task 2 Quadratic Student Task Work with a quadratic function in various forms. Core Idea 3 Algebraic Properties and Representations
Represent and analyze mathematical situations and structures using algebraic symbols.
• Approximate and interpret rates of change, from graphic and numeric data.
Core Idea 1 Functions and Relations
• Understand relations and functions and select, convert flexibly among, and use various representations for them.
Mathematics of the task:
• Calculations with exponents and negative numbers • Codifying calculations into a symbolic string • Rectifying two forms of an equation • Interpreting graphical representations of linear and quadratic equations and
identifying minimum point and solutions • Using algebra to find the solution to a quadratic equation (using factoring or the
quadratic equation) Based on teacher observation, this is what algebra students know and are able to do:
• Calculate using the number machine • Identify the minimum point on a parabola using a graph
Areas of difficulty for algebra students:
• Using algebra to show that two equations are equal • Finding solutions to two equations on a graph • Using algebra to find the solutions to a quadratic equation

Algebra Copyright © 2009 by Noyce Foundation All rights reserved.
46
The maximum score available on this task is 9 points. The minimum score needed for a level 3 response, meeting standards, is 5 points. Most students, 92%, could either identify the minimum or use the number machine to prove that an input of 5 equals an output of 7. 82% could do both calculations with the number machine. More than half the students, 66%, could use the number machine and find the minimum point on a parabola. Some students, 30%, could calculate with the number machine, find minimum, locate solutions to two equations on a graph, and use the graph to identify the solutions of the quadratic. About 2% of the students could meet all the demands of the task including showing that two equations are equal and using algebra to solve a quadratic. 8% of the students scored no points on this task. All the students in the sample with this score attempted the task.

Algebra Copyright © 2009 by Noyce Foundation All rights reserved.
47
Quadratic Points Understandings Misunderstandings
0 All the students in the sample with this score attempted the task.
Students did not know how to square numbers or calculate with negative numbers. They could not interpret the directions on the number machine.
1 Students could either solve the first number machine or locate the minimum on the graph.
Students struggled with the second number machine. 8% got an answer of -10. 8% got an answer of 0.
2 Students could solve both number machines or solve the first number machine and find the minimum.
Most students who struggled with the minimum put a value of –8 rather than identifying point C.
3 Students could use the number machine and find the minimum.
Students struggled with finding solutions to two equations on the graph. For the equation 3=x2 –2x –8 common errors were D & B, E, E &D, and no attempt. For the equation x = x2 –2x –8 common errors were no attempt, D, C, B, and A & E.
5 Students could use the number machine, find the minimum, and locate solutions to two equations on a graph.
Students struggled with identifying the solution to a quadratic on a graph and using algebra to find the solution to a quadratic. 16% did not attempt a graphical solution. 26% did not attempt an algebraic solution. 19% used substitution from the graphical solution as their algebraic strategy.
7 Students could use the number machine, find the minimum, and locate solutions to two equations on a graph.
Students struggled with using algebra to prove that the number machine was equal to the equation = x2 –2x –8. 40% tried to use substitution for their proof. 19% did not attempt this part of the task.
9 Students could use the number machine, find the minimum, and locate solutions to two equations on a graph. Students could solve quadratics graphically and algebraically. They could also use algebra to show that two expressions were equal.
Algebra Copyright © 2009 by Noyce Foundation All rights reserved.
48
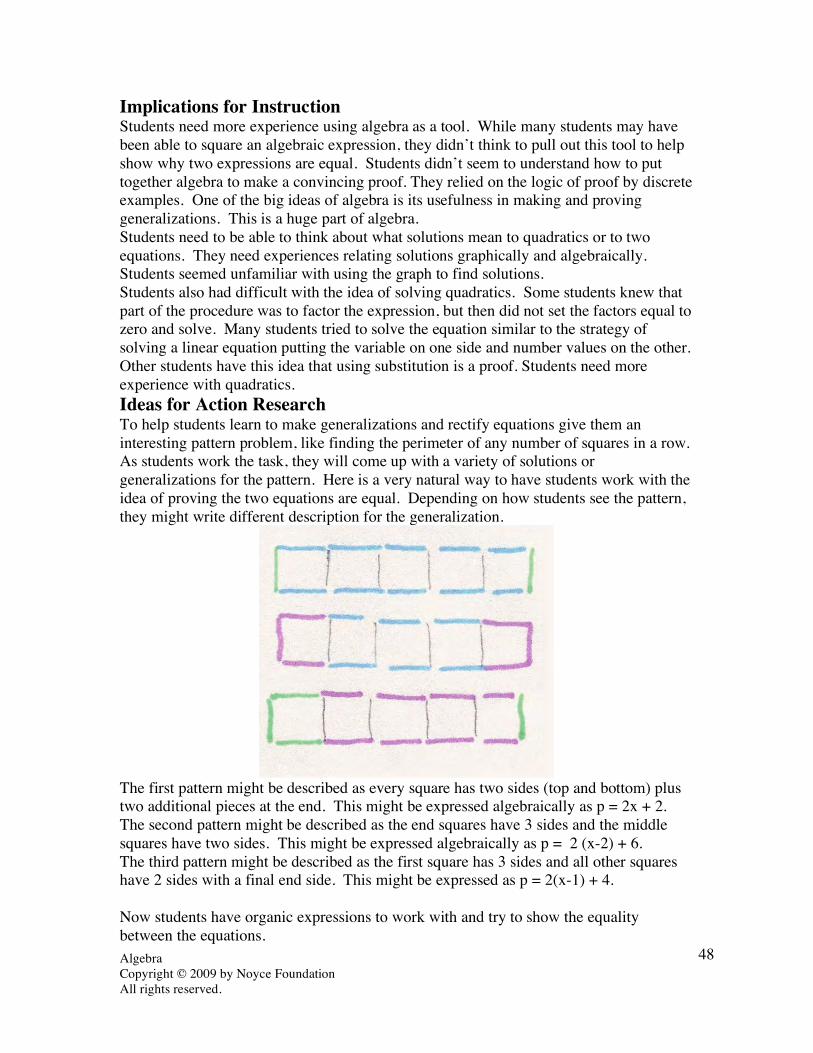
Implications for Instruction Students need more experience using algebra as a tool. While many students may have been able to square an algebraic expression, they didn’t think to pull out this tool to help show why two expressions are equal. Students didn’t seem to understand how to put together algebra to make a convincing proof. They relied on the logic of proof by discrete examples. One of the big ideas of algebra is its usefulness in making and proving generalizations. This is a huge part of algebra. Students need to be able to think about what solutions mean to quadratics or to two equations. They need experiences relating solutions graphically and algebraically. Students seemed unfamiliar with using the graph to find solutions. Students also had difficult with the idea of solving quadratics. Some students knew that part of the procedure was to factor the expression, but then did not set the factors equal to zero and solve. Many students tried to solve the equation similar to the strategy of solving a linear equation putting the variable on one side and number values on the other. Other students have this idea that using substitution is a proof. Students need more experience with quadratics. Ideas for Action Research To help students learn to make generalizations and rectify equations give them an interesting pattern problem, like finding the perimeter of any number of squares in a row. As students work the task, they will come up with a variety of solutions or generalizations for the pattern. Here is a very natural way to have students work with the idea of proving the two equations are equal. Depending on how students see the pattern, they might write different description for the generalization.
The first pattern might be described as every square has two sides (top and bottom) plus two additional pieces at the end. This might be expressed algebraically as p = 2x + 2. The second pattern might be described as the end squares have 3 sides and the middle squares have two sides. This might be expressed algebraically as p = 2 (x-2) + 6. The third pattern might be described as the first square has 3 sides and all other squares have 2 sides with a final end side. This might be expressed as p = 2(x-1) + 4. Now students have organic expressions to work with and try to show the equality between the equations.

Algebra Copyright © 2009 by Noyce Foundation All rights reserved.
49
Now students have some background to help them re-engage with the mathematics of the task. Students did not understand what it meant to use algebra to prove that the number machine is the same as y=x2 – 2x – 8. I might start by showing them the work of Student B:
“I saw this work on a student’s paper. What do you think the student was doing?” I would give students first some individual think time and then let them share their ideas with a neighbor. The idea of re-engagement is to maximize the amount of talking students get to do, so that they can talk their way into understanding the concept. After everyone has had a chance to form and verbalize an opinion, I would then open up the question to a group discussion. If it doesn’t come out naturally, I would also add a prompt to get students to question whether or not this is a proof. We want students at this age to understand that it is impossible to test for every possible case and that proving it for one or even many cases is not a proof. A good reading on this topic is found in Thinking Mathematically by Carpenter, Franke, and Levi, chapter 7 Justification and Proof along with videos of young students making justifications. It has some good questions to push students’ thinking about proof. “Is that always true? How do you know that is true for all numbers? Okay, so we have seen that it works for a lot of numbers, but how do we know that there is not some number – maybe a very, very big number – that it will not work for?” How would you get students to move from this idea to actually setting up an equality? Work with colleagues to think about the types of questions that would help students know what to set equal and how to rectify the two sides. Are there any snippets of student work that you could use from your own student work or the toolkit that would help you? Students also had difficulty with the idea of using algebra to find the solution to the equation y=x2 – 2x – 8. Many students used substitution, which only works if you already know the answer or can read the answer off the graph. How can we push students to think beyond this. I might start with a prompt: “Dawn says that she can use factoring to find the solution to the equation. What do you think she did?” This prompt gives a strategy but allows all students now the opportunity to try and apply what they know. A follow up question might be: “How does this help her find a solution?”

Algebra Copyright © 2009 by Noyce Foundation All rights reserved.
50
Next I might want students to confront a common misconception. So I might use the work of Student E:
Why do you think Earl’s paper is marked incorrect? What mistake has Earl made? Finally, I might push students by saying that Anita said that it was just easier to use the quadratic formula. “What do you think she did? How did this help her?” After students have had a chance to think through this strategy, I think it is important for them to compare strategies. I might ask them to say which strategy they think is easier and why? Then I might give them a different equation that is not factorable so that they can see that sometimes the quadratic is a better choice. I want them to start to see the purpose for knowing more than one strategy and for thinking about making decisions up front about picking a strategy that is convenient and easy for the particular situation. Look through your student work and work in the toolkits. Are there any other misconceptions that you want students to discuss explicitly? Are there some more important mathematical ideas that you want to address? How could you use student work to pose questions to address those issues? What kind of question do you want to pose at the end of lesson to get students to reflect on what they have learned? Is there a follow up problem that you want to use in a few days to see if students can transfer what they have discussed to a new situation? Would you consider giving students back their original work with a red pen and allow them to edit their papers? How would this help further their understanding?

Algebra Circles and Spheres Copyright © 2009 by Mathematics Assessment Resource Service. All rights reserved.
51
0 1 2 3 4 5
Rad ius
A
B
C
Circles and Spheres This problem gives you the chance to: • compare functions for length, area and volume • rearrange formulas 1.The diagram shows the graphs of three functions:
• Area of circle against radius • Volume of sphere against radius • Circumference of circle against radius
In each case, the radius varies from 0 to 5 units, For each letter, choose the correct description of the graph from the list above. A _________________________________________________________________ B _________________________________________________________________ C _________________________________________________________________ Say how you figured it out. ________________________________________________________________________________ ________________________________________________________________________________
The formula to calculate the volume of a sphere from its radius is V = 4/3πr3 where r is the radius and V is the Volume

Algebra Circles and Spheres Copyright © 2009 by Mathematics Assessment Resource Service. All rights reserved.
52
________________________________________________________________________________ 2. The formula to calculate the area of a circle from its radius is
!
A = "r2 ,
where r units is the radius and A square units is the area. Which of the formulas below works out the radius of a circle from its area? Say ‘yes’ or ‘no’ for each one.
!
r ="
A __________________
!
r =A
2" __________________
!
r =2"
A __________________
!
r =A
" __________________
3. The formula to calculate the circumference of a circle from its radius is
!
C = 2"r , where r units is the radius and C units is the circumference. Find a formula to work out the radius of a circle from its circumference. _____________________________________________________________________________ _____________________________________________________________________________ _____________________________________________________________________________
8

Algebra Copyright © 2009 by Mathematics Assessment Resource Service. All rights reserved.
53
Circles and Spheres Rubric The core elements of performance required by this task are: • compare functions for length, area and volume • rearrange formulas Rearrange formula Based on these, credit for specific aspects of performance should be assigned as follows
points
section points
1. Gives correct answers: A: Volume of sphere against radius B: Area of circle against radius C: Circumference of circle against radius Gives correct explanations such as: C shows a linear relationship so represents length B and A must represent the quadratic relationship for area and the cubic relationship for volume – comparing them shows B is the quadratic and C is the cubic graph. May calculate some values such as:
Partial credit 1 error
3x1
2
or 2
(1)
5
2. Gives correct answers: No, no, no, yes Partial credit One error
2
(1)
2
3. Gives correct answer:
!
r =C
2" 1
1
Total Points 8

Algebra Copyright © 2009 by Noyce Foundation All rights reserved.
54
Circles and Spheres Work the task and look at the rubric. What are the key mathematical ideas that a student needs to understand to be successful on this task?________________________________ Look at student work on part 1, matching the descriptions to the graphs. How many of your students put:
Graph Volume Circumference Area Other A B C
Now look at student explanations. How many of your students:
• Used an argument based on the power of the radius?_________ • Used an argument based on calculations for all 3 measures?_______ • Calculated only some of the measures?__________ • Used arguments based on shape of the graph or shape of the object?________ • Didn’t attempt an explanation?_________
Now look at student work on part 2 and 3.
• Did students show making the conversions?______ • Did student responses indicate a confusion about the meaning of
exponents?______ • How many of your students put r = (2π)/C? _________What misconception do
these students have? What was the faulty logic in their solution process? • How many of your students solved for C instead of 4 in part 3?_________ • How many of your students did not attempt part 3?__________
Why do you think students had difficulty with this section? List some incorrect responses and see if you can identify the misconceptions associated with the response.

Algebra Copyright © 2009 by Noyce Foundation All rights reserved.
55
Looking at Student Work on Circles and Squares Student A is able to match the graphs to the descriptions by computing values for the same radius. The student is also able to manipulate equations to solve for different variables. Student A

Algebra Copyright © 2009 by Noyce Foundation All rights reserved.
56
Student A, part 2
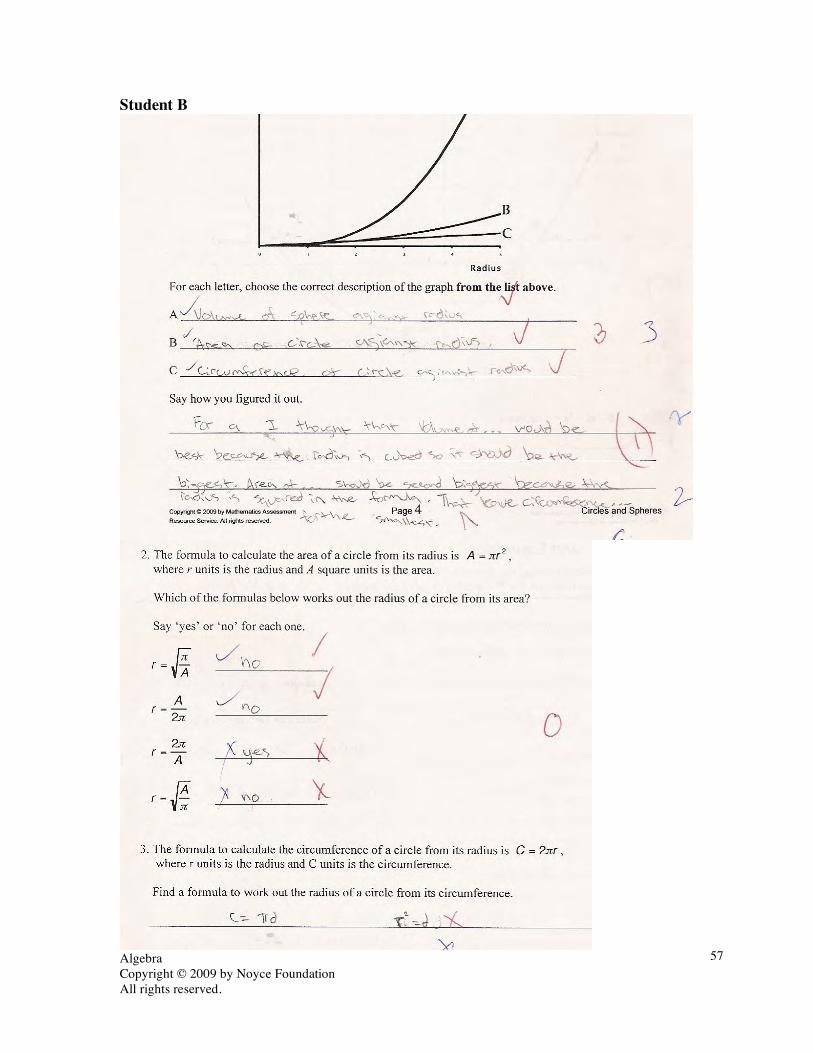
Student B is able to match the descriptions to graph by reasoning about the power of the radius. The student struggles with symbol manipulation in part 2 and 3. While the student shows a good understanding of the effect of exponents on size, the errors in solving equations may indicate some other misunderstanding of exponents. Where would you go next with this student?
Algebra Copyright © 2009 by Noyce Foundation All rights reserved.
57
Student B

Algebra Copyright © 2009 by Noyce Foundation All rights reserved.
58
Student C has managed to match the descriptions with the graphs. However the explanations are unclear and don’t give much indication of understanding. What is the misunderstanding shown by the answer for part 3? What doesn’t the student understand about solving equations? Student C

Algebra Copyright © 2009 by Noyce Foundation All rights reserved.
59
Many students tried to use reasoning about the shape of the objects or graphs to help match the descriptions to the graphs. Student D uses language about rolling up. The student is also concerned that the volume isn’t a function. The student looks at the formulas, but doesn’t choose to quantify values. What should students know about the shape of a graph from looking at an equation? Student D

Algebra Copyright © 2009 by Noyce Foundation All rights reserved.
60
Student E is also concerned about the shape of objects and their graphs. In part 2 and 3 the student, while not required, shows the steps for solving the equations for the new variables. Student E

Algebra Copyright © 2009 by Noyce Foundation All rights reserved.
61
Student E, part 2

Algebra Copyright © 2009 by Noyce Foundation All rights reserved.
62
Student F also tries to use reasons about shape. Student F
Student G is able to reason about volume being largest, but can’t continue that train of reasoning to the other measures. Student G

Algebra Copyright © 2009 by Noyce Foundation All rights reserved.
63
Student H cannot find even the largest of the measures in part 1. In part 3 the student finds 2 new formulas for C instead of solving for r. Student H
Student H, part 2

Algebra Copyright © 2009 by Noyce Foundation All rights reserved.
64
Student I thinks about volume as the space under the graph. The student misses the context of the problem in part 1. The student scores no points in part 2 and doesn’t attempt part 3. Student I
Algebra Copyright © 2009 by Noyce Foundation All rights reserved.
65
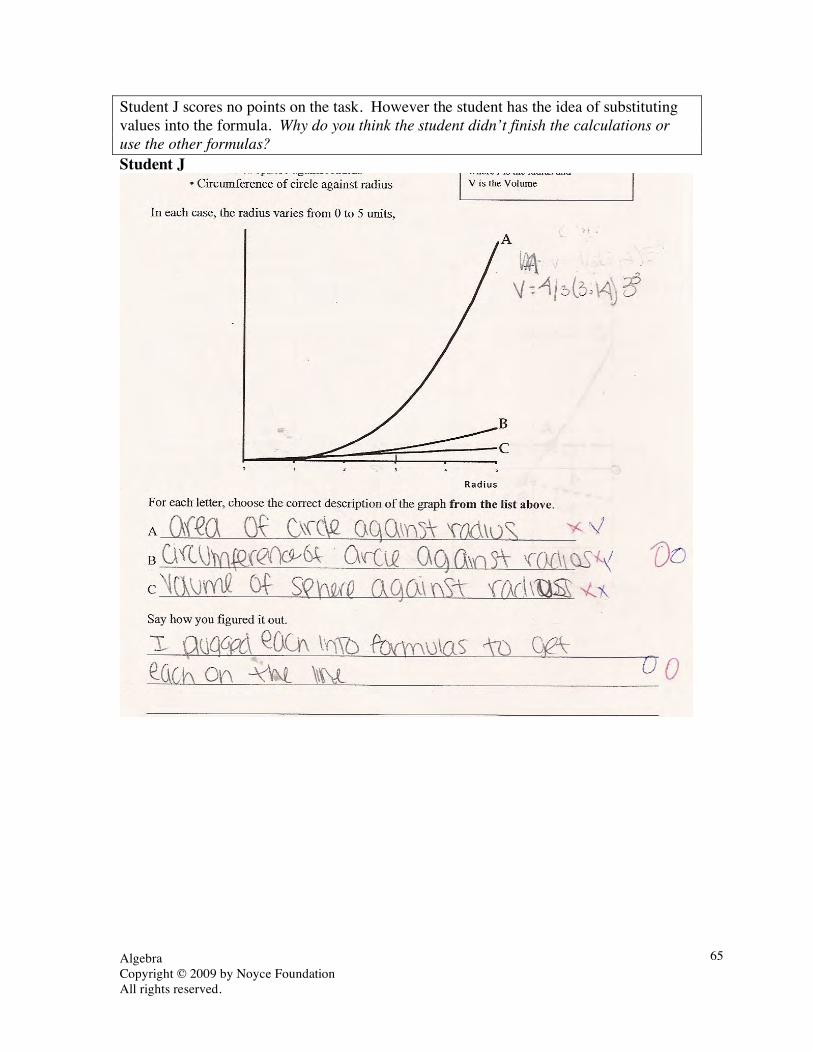
Student J scores no points on the task. However the student has the idea of substituting values into the formula. Why do you think the student didn’t finish the calculations or use the other formulas? Student J

Algebra Copyright © 2009 by Noyce Foundation All rights reserved.
66
Algebra Task 3 Circles and Spheres
Student Task Find numbers that obey given rules or constraints. Find rules for sets of numbers. Use understanding of place value to solve problems in context.
Core Idea 3 Algebraic Properties and Representations
Represent and analyze mathematical situations and structures using algebraic symbols.
• Use symbolic expressions to represent relationships arising from various contexts.
• Compare and contrast the properties of numbers and number systems including real numbers
Core Idea 2 Mathematical Reasoning
Employ forms of mathematical reasoning and proof appropriate to the solution of the problem, including deductive and inductive reasoning, making and testing conjectures and using counterexamples and indirect proof.
• Show mathematical reasoning in a variety of ways, including words, numbers, symbols, pictures, charts, graphs tables, diagram and models.
• Draw reasonable conclusions about a situation being modeled. Core Idea 1 Functions and Relations
• Understand relations and functions and select, convert flexibly among, and use various representations for them.
Mathematics of the task:
• Know and be able to calculate volume, area, and circumference • Reason about shapes of graphs, particularly relative to linear functions and
quadratic or cubic functions • Solve equations for different variables
Based on teacher observations, this is what algebra students knew and were able to do:
• Recognize that volume would show the steepest growth curve • Match the graphs to the descriptions • Solve area formula for the radius
Areas of difficulty for algebra students:
• Explaining why the descriptions matched the graphs • Giving quantities for some measures, but not for all to make the comparison • Solving a formula for a different variable

Algebra Copyright © 2009 by Noyce Foundation All rights reserved.
67
The maximum score available for this task is 8 points. The minimum score for a level 3 response, meeting standards, is 5 points. Most students, 83%, could match volume to the graph. More than half the students , 58%, could match all the descriptions to the graphs. Some students, about 32%, could match the graphs to the descriptions and do some successful work on solving formulas for new variables. 6% of the students could meet all the demands of the task including justifying the matching of the descriptions to the graphs using calculations or reasoning about the power of r. 17% of the students scored no points on this task. 77% of the students with this score attempted the task.

Algebra Copyright © 2009 by Noyce Foundation All rights reserved.
68
Circles and Spheres Points Understandings Misunderstandings
0 77% of the students with this score attempted the task.
Students could not recognize that volume was graph A. Almost 15% thought graph A was area. Almost 10% thought graph A was the circumference.
1 Students could match volume to the graph.
Students had trouble discerning between the graph for area and circumference.25% of the students thought graph B was circumference. 10% thought it was volume. 20% thought graph C was area. 14% thought graph C was volume.
3 Students could match descriptions to the graphs.
Students struggled with solving formulas for variables. Most students picked 2 correct responses for part 2, giving them partial credit. Most common extra choices were r= A/2π and r= 2π/A.
5 Students could match descriptions to the graphs and do some of the solving of equations for new variables.
Students did not know how to explain their reasoning for ordering the descriptions.
8 Students could match descriptions to graphs and use calculations or reasoning about exponents to support their choice. Students could take a formula and solve for a different variable in parts 2 and 3.

Algebra Copyright © 2009 by Noyce Foundation All rights reserved.
69
Implications for Instruction Students at this grade level come to algebra with a weak background in geometry. Students need to build up their geometric foundation by exploring geometric properties using algebra. This context provides students with opportunities to think about how the radius effects the size of three different measures. Many students gave explanations about the shape of the sphere or circumference rather than thinking about the measures of area, circumference, and volume. Some students gave explanations that showed they thought radius was only connected with one of the measures or a showed no understanding of the word radius. Students should understand that quantifying answers or values makes it easier to compare. They should also realize that something needs to remain constant to make the comparison between measures. For example if the volume is calculated with a radius of 4 and the other two measures need to be calculated with a radius of 5. Otherwise no direct comparison is possible. As students build up algebra concepts they need to connect them to multiple representations. For example, students should think about how equations with exponents are not linear, but curve. They should also be able to reason about how the cubing a number would make the curve steeper. Some students thought that volume was the space underneath the graph lines. Students should be able to notice attributes of equations and get general impressions about the look of the graph. Students do not know how to solve a formula for a variable. They have some partially learned procedures, but are not consistent in applying the algebra rules for symbol manipulation. Students still struggle with expressions with squares. Many try to equate square with multiplying by 2. Ideas for Action Research This task would lend itself to a re-engagement lesson.
Re-engagement – Confronting misconceptions, providing feedback on thinking, going deeper into the mathematics. (See overview at beginning of toolkit). 1. Start with a simple problem to bring all the students along. This allows students to
clarify and articulate the mathematical ideas. 2. Make sense of another person’s strategy. Try on a strategy. Compare strategies. 3. Have students analyze misconceptions and discuss why they don’t make sense. In
the process students can let go of misconceptions and clarify their thinking about the big ideas.
4. Find out how a strategy could be modified to get the right answer. Find the seeds of mathematical thinking in student work.
The story of this problem seems to center on students not understanding how to justify matching the descriptions to the graph. The teacher might start by saying: David thinks that circumference is larger than area because the area is 28 and the circumference is 31. Can you figure out how David got his answers?
Algebra Copyright © 2009 by Noyce Foundation All rights reserved.
70
The purpose of this question is to push students to remember the formulas and use them to quantify the expressions. After they have shown how the answers were arrived. The teacher might then push students to analyze the results. Do you agree with David? Why or why not? Here we want students to notice the radii being used in the calculations are different. To make a comparison the radius needs to be the same. Where do you think volume fits in the graph? Is it steeper or lower than the circumference? How would you find out? The question gives students an opportunity to apply the ideas from the beginning of the lesson to the new measure. Calculators should be available, if possible, because the focus of the lesson is on the idea of quantifying measures and using comparable measures rather than on computation. Now the teacher might throw in a new strategy. Part of re-engagement is to have students try on new strategies. The teacher might say: Melissa says that it is not necessary to do all the calculations. She can just think about the radius and use that to make a comparison. What do you think she means? Hopefully this question will get students to think about r, r2, and r3 found in the formulas and how they relate to each other. Can you think of any other issues that you would like students to explore or misconceptions that you want students to confront? What might they be? Do you think it is important for them to discuss some of the examples about trying to justify by shapes and why those are not complete? Would you like them to examine some of the incorrect solutions for 2 and 3 to confront errors and misconceptions? How might you pose the questions to get students to re-examine their thinking? Sit down with your grade level team and see what other issues or questions to add to this re-engagement lesson.
Algebra Words and Equations Copyright © 2009 by Mathematics Assessment Resource Service. All rights reserved.
71
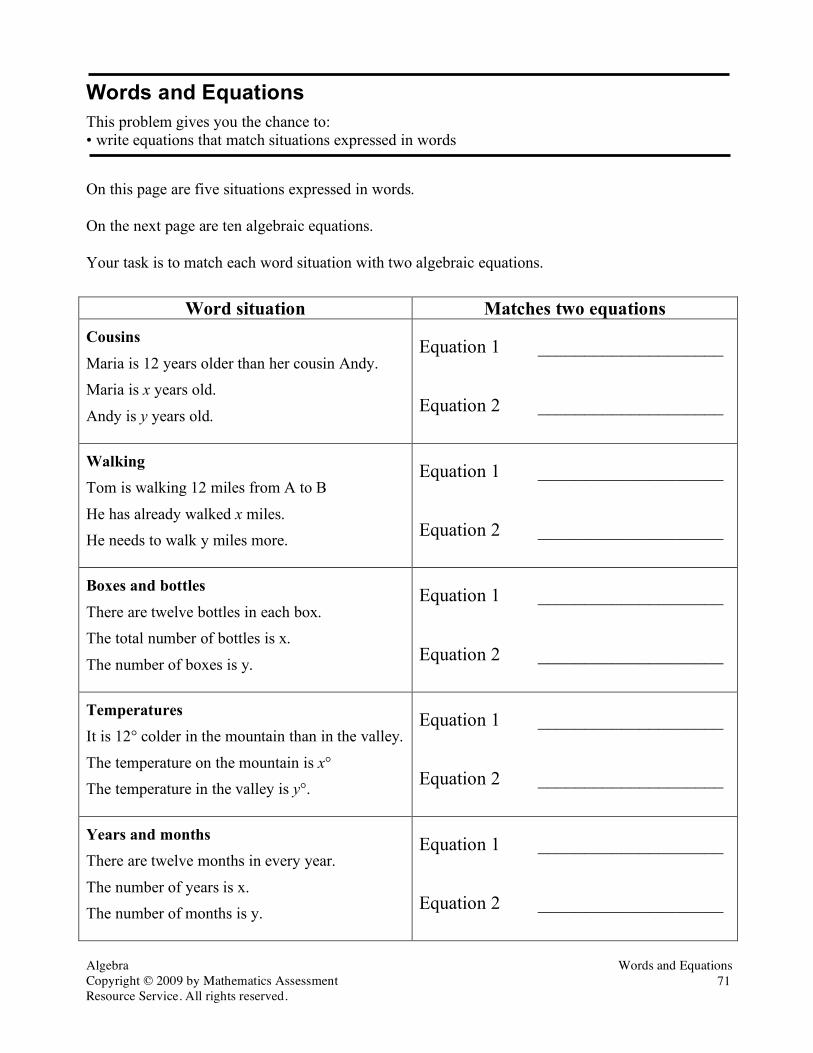
Words and Equations This problem gives you the chance to: • write equations that match situations expressed in words On this page are five situations expressed in words. On the next page are ten algebraic equations. Your task is to match each word situation with two algebraic equations.
Word situation Matches two equations
Cousins Maria is 12 years older than her cousin Andy. Maria is x years old.
Andy is y years old.
Equation 1 ____________________
Equation 2 ____________________
Walking Tom is walking 12 miles from A to B
He has already walked x miles. He needs to walk y miles more.
Equation 1 ____________________
Equation 2 ____________________
Boxes and bottles There are twelve bottles in each box. The total number of bottles is x.
The number of boxes is y.
Equation 1 ____________________
Equation 2 ____________________
Temperatures It is 12° colder in the mountain than in the valley.
The temperature on the mountain is x° The temperature in the valley is y°.
Equation 1 ____________________
Equation 2 ____________________
Years and months There are twelve months in every year.
The number of years is x. The number of months is y.
Equation 1 ____________________
Equation 2 ____________________

Algebra Words and Equations Copyright © 2009 by Mathematics Assessment Resource Service. All rights reserved.
72
!
x =12y
!
y = x +12
!
y = x "12
!
x = y +12
!
x = y "12
!
y =12x
!
y =12 " x
!
y =x
12
!
x =y
12
!
x =12 " y
10
Algebra Copyright © 2009 by Mathematics Assessment Resource Service. All rights reserved.
73
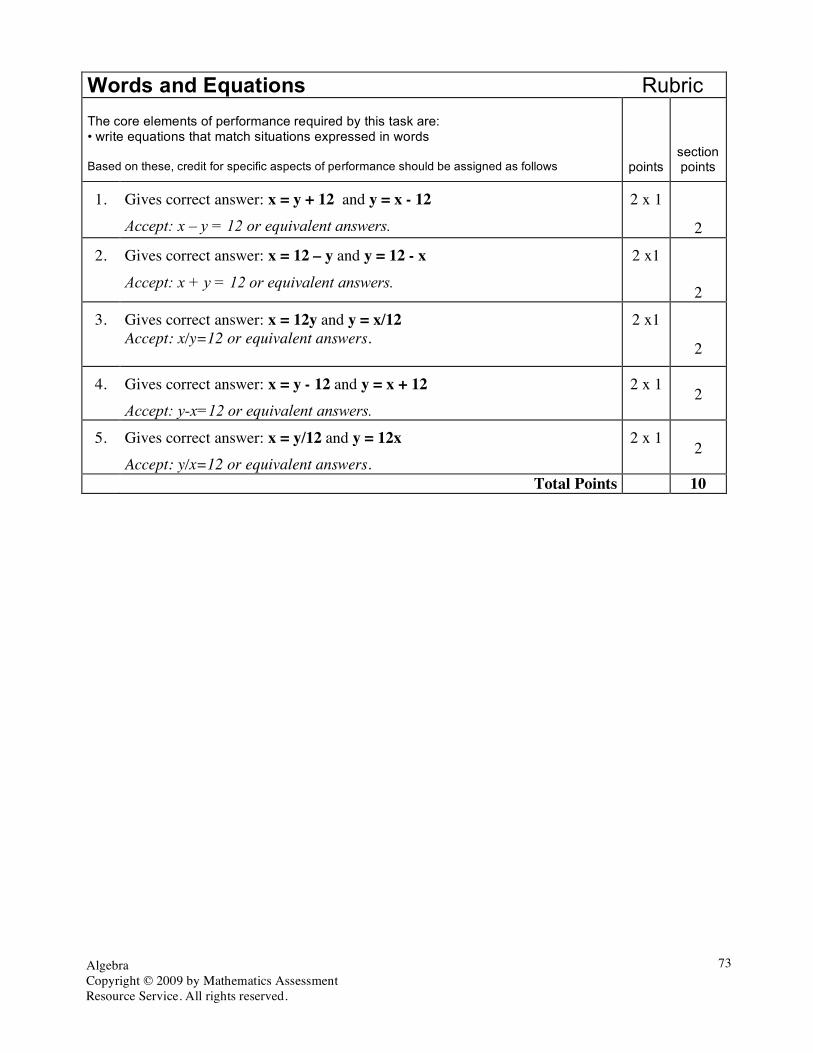
Words and Equations Rubric The core elements of performance required by this task are: • write equations that match situations expressed in words Based on these, credit for specific aspects of performance should be assigned as follows
points
section points
1. Gives correct answer: x = y + 12 and y = x - 12 Accept: x – y = 12 or equivalent answers.
2 x 1
2
2. Gives correct answer: x = 12 – y and y = 12 - x Accept: x + y = 12 or equivalent answers.
2 x1
2
3. Gives correct answer: x = 12y and y = x/12 Accept: x/y=12 or equivalent answers.
2 x1
2
4. Gives correct answer: x = y - 12 and y = x + 12 Accept: y-x=12 or equivalent answers.
2 x 1 2
5. Gives correct answer: x = y/12 and y = 12x Accept: y/x=12 or equivalent answers.
2 x 1 2
Total Points 10

Algebra Copyright © 2009 by Noyce Foundation All rights reserved.
74
Words and Equations Work the task and look at the rubric. What are the big mathematical ideas that students need to know to be successful on this task? What might give them difficulty? Look at student work for part 1. Maria is 12 years older than her cousin Andy. Maria is x years old. Andy is y years old. How many of your students put:
x = y + 12 x = 12 – y x = 12y x = y/12 Other
y = x –12 y = x + 12 y =12x y= 12-x Other
What do you think caused students difficulty with this section? How are the misconceptions different for the different responses? Now look at student work for part 2. Tom is walking 12 miles from A to B. He has already walked x miles. He needs to walk y miles more. How many of your students put:
x = 12-y x = 12y x = y + 12 x = y –12 Other
y = 12 – x y = x – 12 y = x + 12 y = 12 x y = x/12
How was the thinking different in this context? What model might a student draw to help them understand this situation and the relationships of the variables? Now look at student work for part 3. There are twelve bottles in each box. The total number of bottles is x. The number of boxes is y. How many of your students put:
x = 12y x = y/12 x = 12 – y x = y + 12 x = y/12
y = x/12 y = 12 x y=12 – x y = x – 12 y = 12/x
Why do you think some students struggled with this prompt? What misconceptions led to some of these answers? What were students not understanding about algebraic notation? About operations in context?

Algebra Copyright © 2009 by Noyce Foundation All rights reserved.
75
Look at student work for part 4. It is 12° colder in the mountain than in the valley. The temperature on the mountain is x°. The temperature in the valley is y°. How many of your students put:
x = y – 12 x = y + 12 x = 12 – y x = y/12 Other
y = x + 12 y = 12 – x y = x – 12 y = 12 x y = x /12
Now look at the student work for part 5. There are twelve months in every year. The number of years is x. The number of months is y. How many of your students put:
x = y/12 x = 12y x = y-12 x = y + 12 x = 12 – y
y = 12 x y = x/12 y = x + 12 y = 12 – x y = x –12
What was the most difficult context for your students? What confused them about the symbolic notation? What were some of their misconceptions around number operation? How do you help students develop symbolic notation? What kinds of activities do you use to help them translate between context and symbolic notation? If students don’t master a basic facility with symbolic notation to depict situations or make sense of contextual information can they function beyond the first month of algebra or is lack of academic language putting everything else beyond reach? How important is it for students to be able to move between an operation and its inverse? How does this task push at the idea of inverses or “doing and undoing”?

Algebra Copyright © 2009 by Noyce Foundation All rights reserved.
76
Looking at Student Work on Words and Equations For the most part students did not show work or thinking on this task. Some students made up their own equations and some students may have put two x equations for a situation or 2 y equations for a situation. Because of the lack of work, the results of student thinking will be presented in tabular form.
1. Maria is 12 years older than her cousin Andy. Maria is x years old. Andy is y years old. x = y + 12 x = 12 – y x = 12y x = y/12
76% 4% 13.5% Less than 1% y = x –12 y = x + 12 y =12x y= 12-x
68% 22% 5% 5%
2. Tom is walking 12 miles from A to B. He has already walked x miles. He needs to walk y miles more.
x = 12-y x = 12y x = y + 12 x = y –12 61% 7% 11% 9%
y = 12 – x y = x – 12 y = x + 12 y = 12 x y = x/12 62% 16% 7% 7% 7%
3. There are twelve bottles in each box. The total number of bottles is x. The number of boxes
is y. x = 12y x = y/12 x = 12 – y x = y + 12 x = y/12
65% 12% 4% 4% 4% y = x/12 y = 12 x y=12 – x y = x – 12 y = 12/x
64% 31% 2% 2% 4%
4. It is 12° colder in the mountain than in the valley. The temperature on the mountain is x°. The temperature in the valley is y°.
x = y – 12 x = y + 12 x = 12 – y x = y/12 66% 19% 15% 2%
y = x + 12 y = 12 – x y = x – 12 y = 12 x y = x /12 53% 19% 9% 2% 4%
5. There are twelve months in every year. The number of years is x. The number of months is
y. x = y/12 x = 12y x = y-12 x = y + 12 x = 12 – y
65% 24% 5% Less than1% 4% y = 12 x y = x/12 y = x + 12 y = 12 – x y = x –12
57% 28% 5% 2% 8%
Algebra Copyright © 2009 by Noyce Foundation All rights reserved.
77
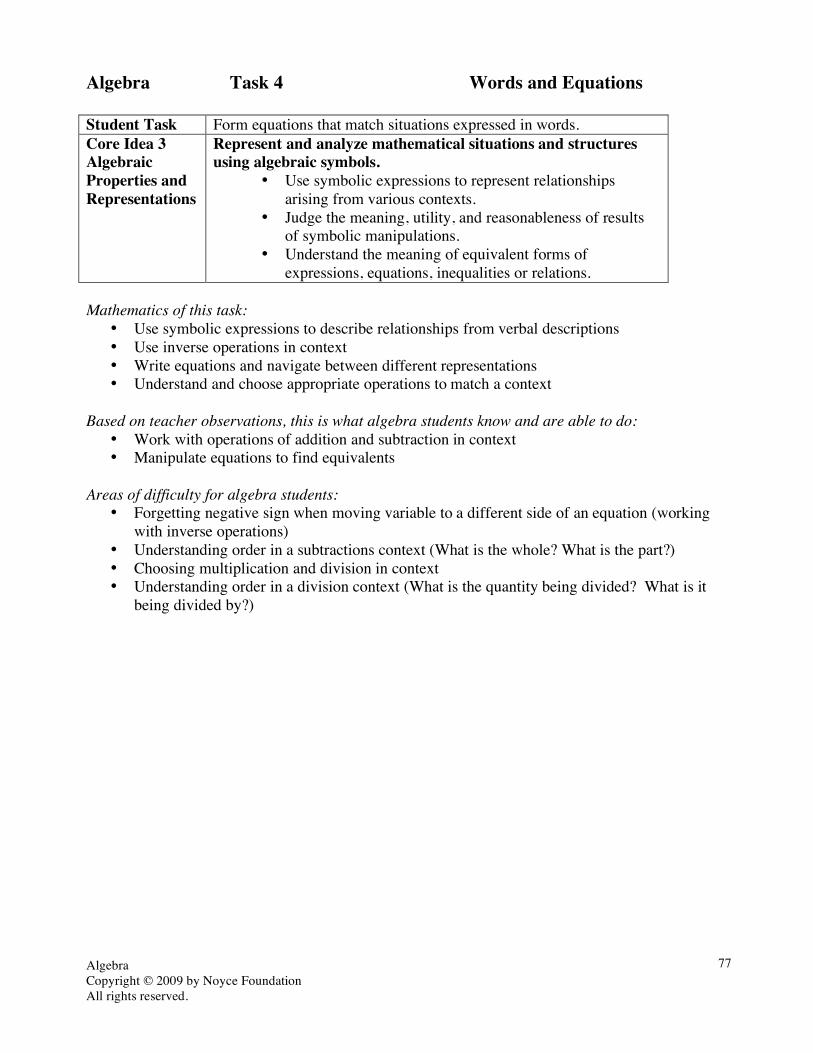
Algebra Task 4 Words and Equations Student Task Form equations that match situations expressed in words. Core Idea 3 Algebraic Properties and Representations
Represent and analyze mathematical situations and structures using algebraic symbols.
• Use symbolic expressions to represent relationships arising from various contexts.
• Judge the meaning, utility, and reasonableness of results of symbolic manipulations.
• Understand the meaning of equivalent forms of expressions, equations, inequalities or relations.
Mathematics of this task:
• Use symbolic expressions to describe relationships from verbal descriptions • Use inverse operations in context • Write equations and navigate between different representations • Understand and choose appropriate operations to match a context
Based on teacher observations, this is what algebra students know and are able to do:
• Work with operations of addition and subtraction in context • Manipulate equations to find equivalents
Areas of difficulty for algebra students:
• Forgetting negative sign when moving variable to a different side of an equation (working with inverse operations)
• Understanding order in a subtractions context (What is the whole? What is the part?) • Choosing multiplication and division in context • Understanding order in a division context (What is the quantity being divided? What is it
being divided by?)

Algebra Copyright © 2009 by Noyce Foundation All rights reserved.
78
The maximum score available on this task is 10 points. The minimum score needed for a level 3 response, meeting standards, is 6 points. Most students, 97%, could find the x equation for part 1, understanding addition relationships. Many students, 81%, could find the x and y equations for part 1, addition and subtraction, and find one of the equations in part 4, also addition and subtraction. More than half the students, 54%, could find both equations for part 1, part 4, and part 2 (looking at addition and subtraction relationships where the number is the total instead of one of the variables). 23% of the students could meet all the demands of the task including writing equations using multiplication and division. About 3% of the students scored no points on this task. All of the students in sample with this score did not attempt the task.

Algebra Copyright © 2009 by Noyce Foundation All rights reserved.
79
Words and Equations Points Understandings Misunderstandings
0 All the students in the sample with this score did not attempt the task.
1 Students could find the addition equation for x in part 1.
See table
3 Students could use addition and subtraction for x and y in part 1 and solve for 1 equation in part 4 (also addition and subtraction).
See table
6 Students could find both equations for part 1, part 4, and part 2 (looking at addition and subtraction relationships where the number is the total instead of one of the variables).
See table
8 Students could also use division and multiplication to solve for years and months in part 5.
See table
10 Students could write equations for context situations using all operations and write equivalent equations using inverse operations.
Algebra Copyright © 2009 by Noyce Foundation All rights reserved.
80
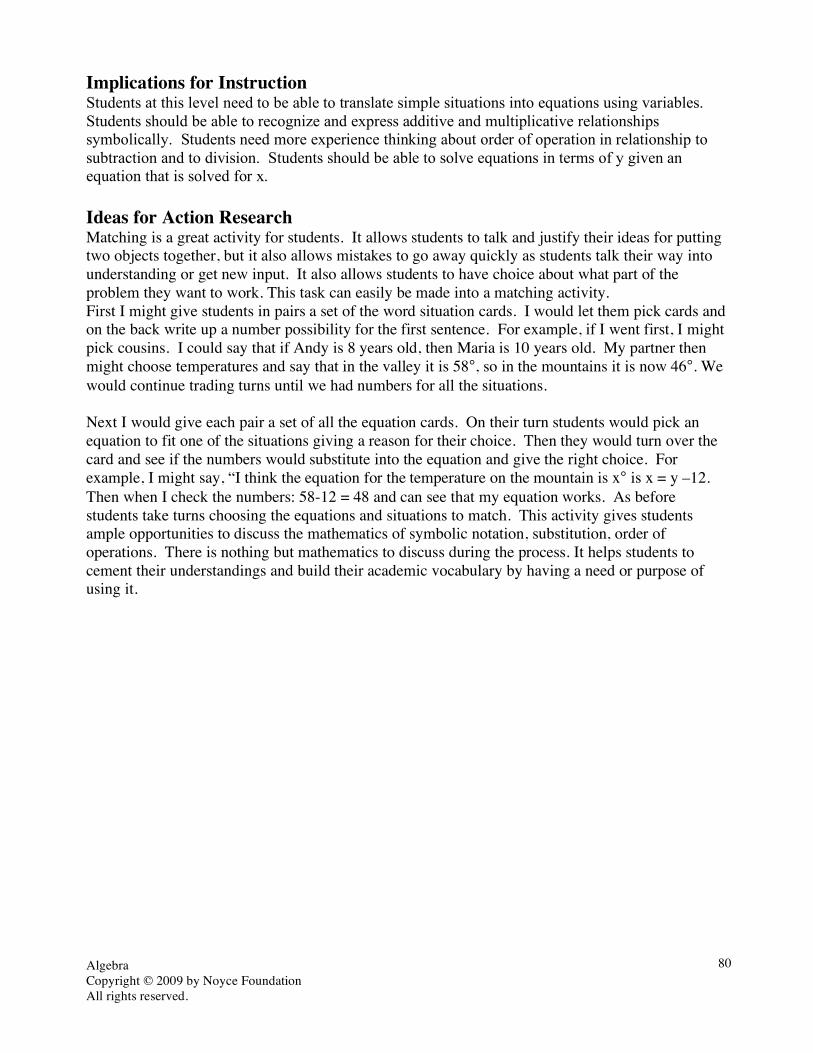
Implications for Instruction Students at this level need to be able to translate simple situations into equations using variables. Students should be able to recognize and express additive and multiplicative relationships symbolically. Students need more experience thinking about order of operation in relationship to subtraction and to division. Students should be able to solve equations in terms of y given an equation that is solved for x. Ideas for Action Research Matching is a great activity for students. It allows students to talk and justify their ideas for putting two objects together, but it also allows mistakes to go away quickly as students talk their way into understanding or get new input. It also allows students to have choice about what part of the problem they want to work. This task can easily be made into a matching activity. First I might give students in pairs a set of the word situation cards. I would let them pick cards and on the back write up a number possibility for the first sentence. For example, if I went first, I might pick cousins. I could say that if Andy is 8 years old, then Maria is 10 years old. My partner then might choose temperatures and say that in the valley it is 58°, so in the mountains it is now 46°. We would continue trading turns until we had numbers for all the situations. Next I would give each pair a set of all the equation cards. On their turn students would pick an equation to fit one of the situations giving a reason for their choice. Then they would turn over the card and see if the numbers would substitute into the equation and give the right choice. For example, I might say, “I think the equation for the temperature on the mountain is x° is x = y –12. Then when I check the numbers: 58-12 = 48 and can see that my equation works. As before students take turns choosing the equations and situations to match. This activity gives students ample opportunities to discuss the mathematics of symbolic notation, substitution, order of operations. There is nothing but mathematics to discuss during the process. It helps students to cement their understandings and build their academic vocabulary by having a need or purpose of using it.

Algebra Coffee Copyright © 2009 by Mathematics Assessment Resource Services. All right reserved. 81
Coffee This problem gives you the chance to: • use a chart to solve simultaneous equations This chart shows the cost, in cents. of different numbers of small and large cups of coffee.
1. Explain what the number 500 in the chart means.
_____________________________________________________________________________
2. Use the information in the chart to find the cost of a small cup of coffee and the cost of a large cup of coffee. Show how you figured it out. Small cup of coffee costs__________cents Large cup of coffee costs ____________cents
6
5
4 680
3
2 500
1
0
0 1 2 3 4 5 6
Num
ber o
f lar
ge c
ups
Number of small cups
This means that 2 small cups and 4 large cups cost 680¢

Algebra Coffee Copyright © 2009 by Mathematics Assessment Resource Services. All right reserved. 82
3. What number should go in the empty box that the arrow is pointing to. _________________ Explain your work.
_____________________________________________________________________________
_____________________________________________________________________________
_____________________________________________________________________________
7

Algebra Copyright © 2009 by Mathematics Assessment Resource Services. All right reserved.
83
Coffee Rubric The core elements of performance required by this task are: • use a chart to solve simultaneous equations Based on these, credit for specific aspects of performance should be assigned as follows
points
section points
1. Gives correct answer such as: the cost of 3 small cups of coffee and 2 large cups of coffee is 500¢.
1
1
2. Gives correct answer: small 80¢, large 130¢ Shows work such as: solving simultaneous equations Partial credit Some correct work
2 x 1 2
(1)
4
3. Gives correct answer: 340 and Gives correct explanation such as: The cost of one small cup and two large cups. (is half the cost of two small cups and four large cups.)
2ft
2
Total Points 7

Algebra Copyright © 2009 by Noyce Foundation All right reserved.
84
Coffee Work the task and look at the rubric. What are the big mathematical ideas being assessed in the task? ________________________________________________________________________ Look at student work on part 1, explaining the 500. How many of your students put:
• Complete explanation, 2 large and 3 small cups cost 500 cents?_______ • Cost of the coffees?(Ignored the units cents or didn’t quantify the cups of coffee)?
___________ • Misread the scale:
o 2 large and 2 small?_______ o 3 large and 2 1/2 small?_______ o 2 large and 1 small?_______ o Other?___________
Now look at student work on part 2, finding the cost of small and large coffees. How many of your students:
• Could solve simultaneous equations to find the cost?___________ • Tried to set up an equality between the 2 equations?_______ • Used guess and check or substitution?_________ • Gave answers with no work?________ • Did not attempt this part of the task?_______
How often do students get opportunities to apply their algebraic skills in context? Why do you think guess and check is such a prevalent strategy? How can you design a lesson that would help students see the reason to leave behind comfortable arithmetic and make it worthwhile to learn new mathematics? Now look at work in part 3, finding the cost of the empty square. How many students:
• Could use the correct or incorrect solutions in part 2 were able to read the scale and calculate the cost of 2 large and 1 small coffee?________
• Used proportional reasoning to find the cost?________ • Tried to estimate using one of the values in the table?_______ • Only looked at the horizontal or vertical scale, but not both, to compute a value?
Why do you think students struggled with part 3? What was confusing for them? What misconceptions did they have?

Algebra Copyright © 2009 by Noyce Foundation All right reserved.
85
Looking at Student Work on Coffee Student A uses equations to find the cost of small and large coffee. The student is competent computing with negative numbers. In part 3 the student writes an equation and uses substitution to find the cost represented by the empty box. Student A

Algebra Copyright © 2009 by Noyce Foundation All right reserved.
86
Student A, part 2
Student B understands the table, shown by the clear labeling next to the arrow. The student does not know how to set up equations in part 2. Student B uses proportional reasoning to find the cost represented by the empty box.

Algebra Copyright © 2009 by Noyce Foundation All right reserved.
87
Student B
Student B, part 2
Student C tries to use the 2 equations to set up a new equality. The problem with this strategy is that there are always 2 variables. The student at some point needs to use guess and check to get the values. The student can use the values found from guess and check to find the cost of the empty box.

Algebra Copyright © 2009 by Noyce Foundation All right reserved.
88
Student C
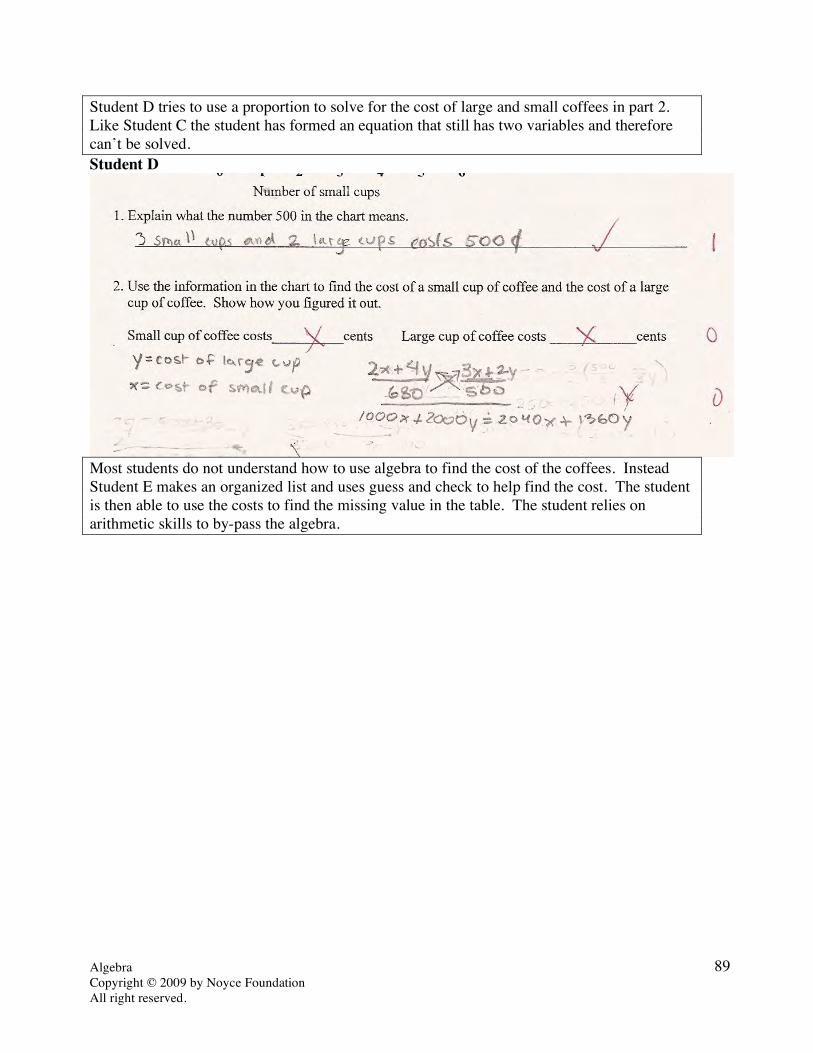
Algebra Copyright © 2009 by Noyce Foundation All right reserved.
89
Student D tries to use a proportion to solve for the cost of large and small coffees in part 2. Like Student C the student has formed an equation that still has two variables and therefore can’t be solved. Student D
Most students do not understand how to use algebra to find the cost of the coffees. Instead Student E makes an organized list and uses guess and check to help find the cost. The student is then able to use the costs to find the missing value in the table. The student relies on arithmetic skills to by-pass the algebra.
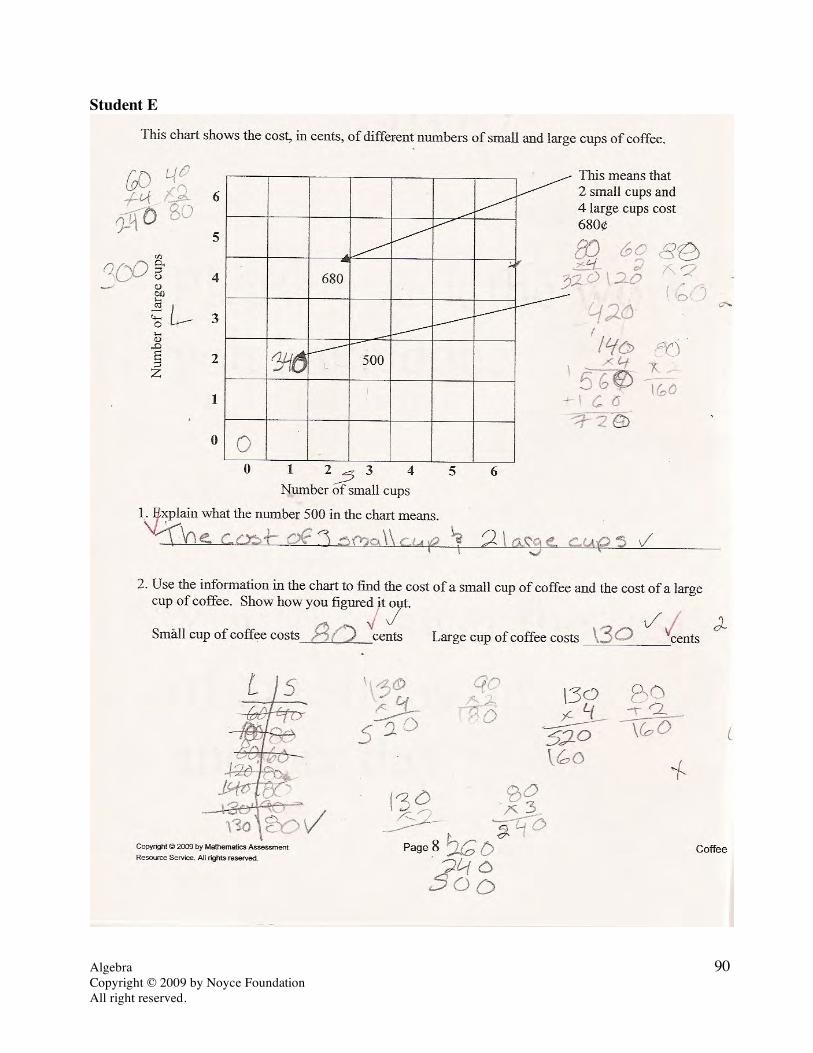
Algebra Copyright © 2009 by Noyce Foundation All right reserved.
90
Student E

Algebra Copyright © 2009 by Noyce Foundation All right reserved.
91
Student F is able to set up ratios to find the missing value in the table. The thinking for this is shown in the section 2. The student attempts to use algebra in part 2 to find the cost of the coffees. However the student doesn’t see a second equation. Instead the student tries to add cups of coffee to make a second equation, x + y = 6. Student F

Algebra Copyright © 2009 by Noyce Foundation All right reserved.
92
Student G makes the same assumption that the coffees can be added together to make the second equation. When Student G works out the cost of the coffee in the empty box, the size of the answer is way out of scale with other numbers in the table. Why doesn’t the student use this as a trigger that something is wrong? Why do you think students are doing this? What is their misunderstanding? What prompt could you pose to these students to get them to rethink their strategy? Student G
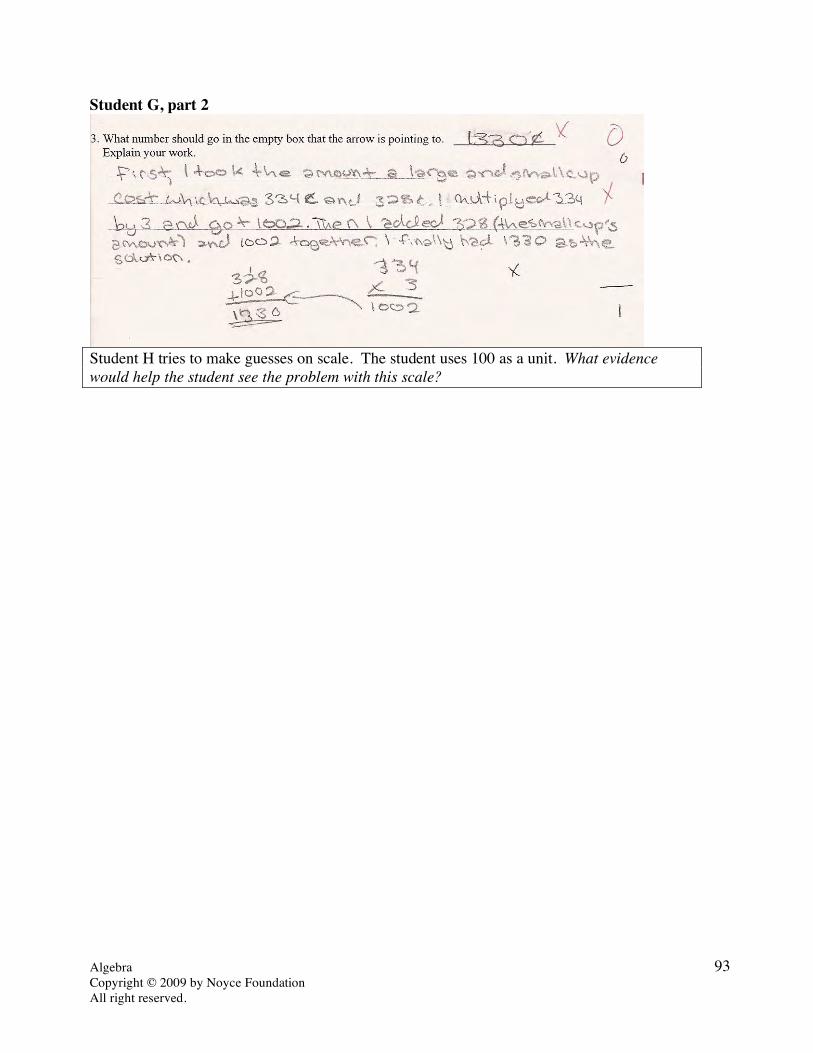
Algebra Copyright © 2009 by Noyce Foundation All right reserved.
93
Student G, part 2
Student H tries to make guesses on scale. The student uses 100 as a unit. What evidence would help the student see the problem with this scale?

Algebra Copyright © 2009 by Noyce Foundation All right reserved.
94
Student H

Algebra Copyright © 2009 by Noyce Foundation All right reserved.
95
Student H, part 2
Student I also tries to find a scale. The student looks at one scale at a time to find equal units to get to the 500. Unfortunately this method ignores the idea that both scales contribute to the 500. In part 3 the student tries to use the same logic to find the value of the empty box, but finally adds the two prices together. This ignores the quantity of large and small coffees.

Algebra Copyright © 2009 by Noyce Foundation All right reserved.
96
Student I

Algebra Copyright © 2009 by Noyce Foundation All right reserved.
97
Student I, part 2
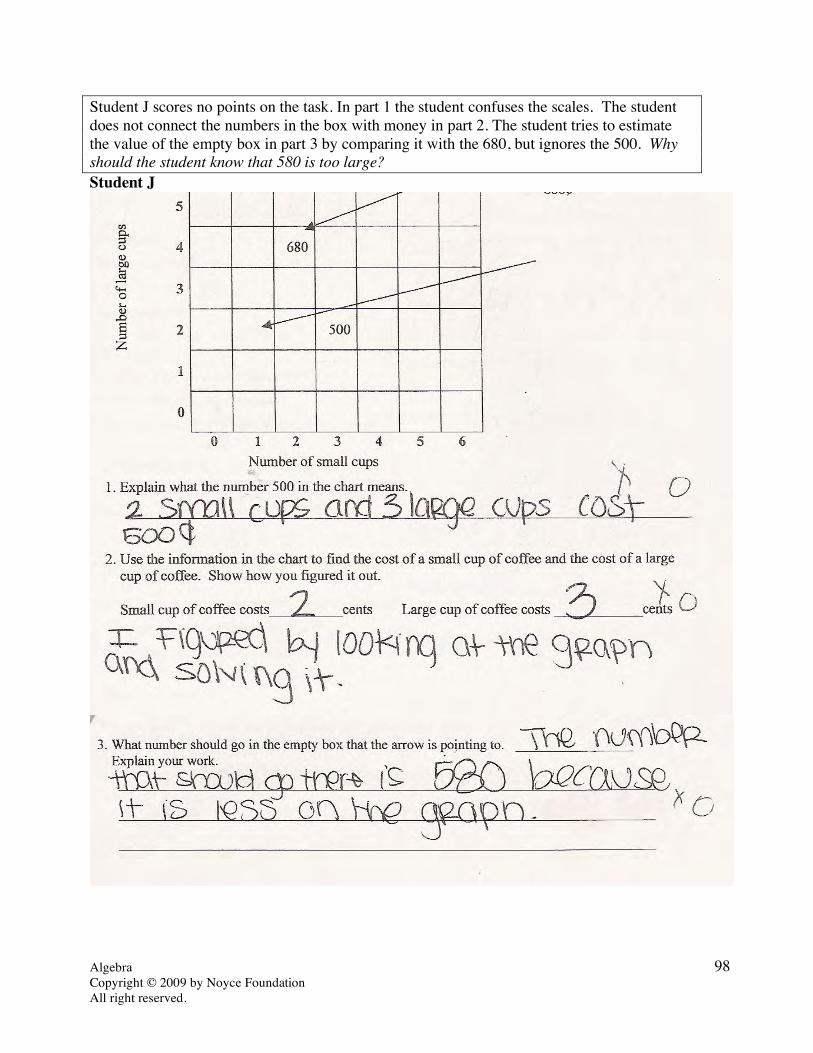
Algebra Copyright © 2009 by Noyce Foundation All right reserved.
98
Student J scores no points on the task. In part 1 the student confuses the scales. The student does not connect the numbers in the box with money in part 2. The student tries to estimate the value of the empty box in part 3 by comparing it with the 680, but ignores the 500. Why should the student know that 580 is too large? Student J

Algebra Copyright © 2009 by Noyce Foundation All right reserved.
99
Algebra Task 5 Coffee Student Task Use a chart to solve simultaneous equations. Core Idea 3 Algebraic Properties and Representations
Represent and analyze mathematical situations and structures using algebraic symbols.
• Write equivalent forms of equations, inequalities and systems of equations and solve them.
• Understand the meaning of equivalent forms of expressions, equations, inequalities, or relations.
Mathematics of this task:
• Read and interpret a diagram • Write equations from a graphical representation • Solve 2 equations with 2 unknowns to find a unit price • Use proportional reasoning or equations to find the cost of an amount not on the table
Based on teacher observations, this is what algebra students knew and were able to do:
• Read and interpret the table to describe the 500 using appropriate units • Find the cost in part 2 • Use guess and check to find the unit prices in part 2
Areas of difficulty for algebra students:
• Using the information in the table to write equations • Solving simultaneous equations or recognizing the using equations could be a strategy
to find the unit prices • Trying to impose a unit of scale on the table without considering all the information

Algebra Copyright © 2009 by Noyce Foundation All right reserved.
100
The maximum score available on this task is 7 points. The minimum score needed for a level 3 response, meeting standards, is 4 points. Many students, 79%, were able to describe the meaning of the 500 in the table using appropriate units. More than half the students could find the cost of two large and one small coffee using proportional reasoning or values from their work in part 2. Almost half, 41%, could describe the 500 in the table, find the unit prices in part 2, and showed some algebra to find the unit price. 22% of the students met all the demands of the task including solving simultaneous equations to find the unit price. 20% of the students scored no points on this task. 93% of the students with the students with this score attempted the task.

Algebra Copyright © 2009 by Noyce Foundation All right reserved.
101
Coffee Points Understandings Misunderstandings
0 93% of the students with this score attempted the task.
Students had difficulty describing the 500. 13% put price in cents but did not describe what was purchased. 10% read the number of coffees incorrectly from the scale.
1 Students could describe the meaning of the 500 in the table.
Students had difficulty finding the cost represented by the empty box. 10% of the students did not attempt this part of the task. 15% gave answers with no supporting work. Other answers vary because of responses in part 2.
3 Students could describe the 500 and find the value represented in the empty box in the table.
Students struggled with finding the unit prices in part 2. 13% did not attempt part 2 or did work but never arrived at an answer. 10% showed no work on part 2.
4 Students could describe the 500, do some work in part 2 and use the result to answer part 3.
Students struggled with using algebra to find the unit prices. Most students used guess and check. Some students attempted to use estimation from the other values in the table. Some students ignored one of the two scales when attempting to find the scale value. Some students made or used an incorrect equation, such as x + y = 6. Some put the information into 1 equation, such as 3x + 2y –550= 2x + 4y – 680, which makes it impossible to eliminate one of the variables and solve.
7 Students could read and interpret a value in the table, use proportional reasoning or substitution to find the value of an empty box in the table, write equations from the information in the table, and solve the simultaneous equations to find the unit prices for large and small coffees.

Algebra Copyright © 2009 by Noyce Foundation All right reserved.
102
Implications for Instruction Too often students learn short cuts that allow them to get correct answers relying on their arithmetic skills without learning the higher mathematics. They are rewarded for solutions rather than for progressing in their mathematical thinking. Students need to see good reasons to make the effort to leave behind what is comfortable to learn new skills and ideas. Students need to see reasons for letting go of guess and check and applying their algebraic skills to solving problems. Students need to have frequent opportunities to apply their skills in context to see the usefulness of the procedures being practiced in the textbook. It does a student no good to know a particular procedure, if the student doesn’t know when to apply it in a practical situation. Students didn’t know how to use equations or see a purpose for writing equations to help them find the unit price in this task. Students who attempted to write equations either used only one, which didn’t help to eliminate a variable, or combined unlike terms to get an equation that was untrue for their second equation. Students have not developed “algebraic” instincts about what type of information or algebraic equations would help them in a problem-solving situation. Ideas for Action Research A model for designing a lesson to help students let go of calculating an making the effort to learn new mathematics can be seen in the eighth grade TIMMS videos, Japanese Lesson 2: Algebraic Inequalities. This would be a good video to view with colleagues and then discuss how the principles might be applied in designing a follow up lesson for this task. The lesson starts with the teacher posing a problem for the class. The teachers starts by saying that while they have been working on calculations for the last few days, today the lesson is about thinking. So the lesson today will be a bit more challenging. The problem: You need to buy 10 cakes for dinner. Some cakes cost 230 yen. Other cakes cost 200 yen. You cannot spend more than 2100. The teacher then talks about the context to make sure everyone understands the context. “Which cakes are most tasty? Which cakes do you want to buy the most of? How many do you need to buy in all?” So the purpose is to find out what is the most tasty cakes that you can buy and stay within you budget, making sure that everyone in the family gets a cake. Students work the task and then prepare for class discussion. Most students use a guess and check method. So this is the solution shared first. The student describes the process. “First, I found out the cost of 10 tasty cakes, but that was too much. Then I found the cost of 9 tasty cakes which was lower than 2100 yen, but I needed to add 1 cake at 200 yen. So that cost too much. Then I tried 8 cakes. I would need to keep reducing by 1 tasty cake until I got a solution that would work. I didn’t get a final solution, because I ran out of time. The teacher has probably purposively chosen someone with a slow method to show the inefficiency of this method. Next the teacher and another student share more efficient strategies for solving the problem. The teacher explains a method examining differences. First the cost of 10 tasty cakes is 2300 yen, which is over by 200 yen. The difference between tasty cakes and the other cakes is only 30 yen. So, obviously more than one cake of the cheaper price will need to be purchased to
Algebra Copyright © 2009 by Noyce Foundation All right reserved.
103
cover the 200 yen gap. Students figure out that the gap will need 7 of the cheaper cakes to make up the difference. A student in the class then shares a strategy using an inequality. The student first sets the tasty cakes = x. So the amount of the other cake would be (10 – x). The inequality would then be 230x + 200(x-10) ≤ 2100. The class then discusses the solution. The purpose of letting the class solve the problem with their familiar solution strategy of guess and check first is to help them become grounded in the context and meaning of the solution. They are then ready to process other strategies and compare how the methods are similar. The teacher now makes the unusual move, from our cultural perspective, of discussing the good qualities of the student’s solution. The teacher points out using guess and check you need to do a lot of calculation, but with this method, using an inequality, the answer comes out quickly. Finally, the teacher poses a follow up question with the prompt to “try on” the new strategy. This encourages students to make an effort and see a purpose in using the new mathematics.


![· Web viewH 2-group were improved significantly on total ADAS-cog score and word recall task score (one of the sub-scores in the ADAS-cognitive score) [5].Considering that more](https://static.fdocuments.us/doc/165x107/5e3398e09c719608fe7c7f90/web-view-h-2-group-were-improved-significantly-on-total-adas-cog-score-and-word.jpg)


