Copyright is owned by the Author of the thesis. Permission ... · in stationary cultures and one...
339
Copyright is owned by the Author of the thesis. Permission is given for a copy to be downloaded by an individual for the purpose of research and private study only. The thesis may not be reproduced elsewhere without the permission of the Author.
Transcript of Copyright is owned by the Author of the thesis. Permission ... · in stationary cultures and one...

Copyright is owned by the Author of the thesis. Permission is given for a copy to be downloaded by an individual for the purpose of research and private study only. The thesis may not be reproduced elsewhere without the permission of the Author.

Comparative Enzyme Studies of Microsporum canis
and Microsporum cookei
in Relation to their Pathogenicity and Diversity.
A thesis presented i n partial fu lfi l lment of the requi rement for
the degree of Doctor of Phi losophy in Microbiology at Massey
University
Mukoma Francis Simpanya
1994

i i
ABSTRACT
I nfections by dermatophytes can be contracted from animals, humans, soil or contaminated fomites. In the genus Microsporum, some species e.g. M. canis are commonly associated with cats and dogs which act as an important reservoir for human infections. Others, e.g. M. cookei are n o n path o g e n ic and fou nd i n t h e soi l . The p rese nt stud ies have i nvestigated the incidence of these ecologically contrasting species on cats, dogs and in the soil, their enzyme expression, and enzyme types as identified by proteinase inhibito rs , gelat in/S DS-PAGE and multi locus e nzyme e lectrophoresis , and have led to an investigat ion of thei r phenotyp ic variatio n . The pri mary ai m was to attempt to detect differences in enzyme production which might be related to mechanisms of pathogenicity of M. canis.
Isolation procedures employed were the hairbrush technique for small animals and the keratin-baiting technique for soil with samples being cultured on S DA containing antibiotics. Soil samples revealed 1 9 fungal g e nera, t h ree being of keratinolytic fungi , representing 50% of total i solations. Trichophyton species were the most common (39% samples) but M. cookei was isolated from 6.8%.
Fungi i so lated fro m cats and dogs rep resented 20 g enera, with the predominant isolates being keratinolytic fungi (51 .9% of total samples). Cats were the major carriers of kerat i nolytic fungi ( Chrysosporium, Microsporum and Trichophyton). M. canis was frequently isolated (1 8.5% of cats) and its d istribut ion had a seasonal variation , with a peak appearing in May-June.
All isolates of M. canis were of the "-" mating type. M. cookei isolates were of bo th the "+" and "-" m at i n g types , but "+" types were predominant.
Biochemical assays showed that M. canis produced higher proteinase and keratin ase activities in shake cultures than in stationary cultures. E lastase act ivity was g reater i n stat ionary cu ltu res . M. cookei's protei nase and keratinase activit ies were lower but again greater i n shake cu ltures. There was no detectable keratinase activi ty in stationary cultures of M. cookei, and no significant difference in e lastinolytic activity

i i i
between s hake and stat ionary cultu res . G rowth i n s hake cu lt u re produces the "pseudo-parasitic" morphology which mimics that found in i nfectio n , t h e refore, the d iffe r ing enzyme express ion of the two Microsporum species may be a reflection of their differi ng ecological roles.
Characterisation of the enzymes with chemical inhibitors revealed that M. canis and M. cookei produced serine protei nases, but on ly M. canis produced cysteine and probably aspartic and metallo-proteinases. The serine and cysteine proteinases are considered likely to be of particular significance in the pathogenesis of M. canis infections.
Using substrata copolymerised gel electrophoresis (gelatin \S DS-PAGE), shake and stat ionary cu ltures were ag ai n compared for e nzyme expression. Among the six different Mr proteinases (1 22 K Da, 64 K Da, 62 K Da, 44 K Da, 36 K Da, and 28 K Da) e xpressed by M. canis, three ( 1 22 K Da, 62 K Da and 28 K Da) were found to be more highly expressed i n shake cu ltures. I n contrast, M. cooke risolates e xpressed seven d ifferent proteinases (67 K Da, 64 K Da, 63 K Da, 62 K Da, 54 K Da, 52 K Da, and 42 K Da), of which two (67 K Da, 64 K Da) were expressed only i n stationary cultures and one (52 K Da) although expressed i n shake cultures was more high ly expressed in stationary cultures. Possibly the high and low Mr proteinases expressed by M. canis are more important i n its pathogenicity than the middle range proteinases also detected in M. cooke i.
Multilocus enzyme electrophoresis using starch gels and examining eight e nzymes, showed M. canis to be phenotypically more diverse than M. cookei as measure d by the norm al ised S hannon-Wiener diversity statistic. M. canis showed a substantial with in population variabi l ity (84.9%) by geographical reg ion , with a moderate level (2 1 .7%) of i nterpopulation d ifferentiation. Cluster analysis confi rmed this diversity and also revealed a possible grouping of isolates from clinical infections, and based on the accumulated data of these studies, EST phenotype 9 although present in a few carrier isolates was commonly associated with isolates from clinical cases and perhaps deserves further investigation.

iv
ACKNOWLEDGEMENT
I extend my sincere thanks to my sponsors, the New Zealand Ministry of
Foreign Affai rs and Trade fo r the scholarship and the Department of Microbiology and Genetics for the opportunity of joining the Department and for providing the faci lities for this study.
I am indebted to my supervisors, Dr. M. Baxter and Assoc. Prof. B.D.W. Jarvis for their encouragement and constructive suggestions during my
work. I extend special thanks to my chief supervisor, Dr. M. Baxter for his pat ience duri ng the writ ing of my thes is . My thanks to the Equine
Laboratory for the use of some of thei r starch gel apparatus and to Dr. S . G aneshanandam fo r the statistical advice and usefu l d iscussions regarding population theory with Prof. D. Penny and Associate Professor E . A Terzaghi and J. Pal mer for the discu ssions on proteolytic enzymes.
My thanks also to al l my friends for all the help during this study.
My thanks to R� Tucker and P. Hocquard for all the technical advice and assistance in the construction of the starch gel apparatus, M. Pickering for her help during the screening stage of the isozymes and C. Fenton for
freeze-drying of the fungal isolates. Further thanks to Mss. D. Salisbury and F. Mouat in the Microbiology and Genetics "Kitchen". My thanks also to Lyn Dome and her staff at the photographic unit for the photographic
assistance.
I extend my personal thanks to my supervisor, Dr. M. Baxter and his wife for al l the i r assistance towards my fami ly when they arrived i n New Zealand. Many thanks also to Professor T.J. Brown and his wife , G reer
for al l the k ind help to my wife and my two chi ldre n , Mukoma and
Chitundu.
Finally, I thank my wife, Connie most sincerely for the love and for being there for me and for looking after our two chi ldren during the whole time of this study. I thank my chi ldren for their patience. I should not forget my
late grandmother and grandfather for their loving care.

V
TABLE OF CONTENTS
Page
Abstract . . . . . . . . . . . . . .. . . . . . . . . . . . . . . . . . . . . . . . . . . . . . . . . . . . . . . . . . . . . . . . . . . . . . . . . . . . . . . . . . . . . . . . . . . . . . . . . . . . . . . . . . . . . . . . i i Acknowledgements . . . . . . . . . . . . . . . . . . . . . . . . . . . . . . . . . . . . . . . . . . . . .. . . . . . . . . . . . . . . . . . . .. . . . . . . . . .. . . . . . . . . . . . . . . . iv List of Tables . . . . . . . . . . . . . . . . . . . . . . . . . . . . . . . . .. . . . . . . . . . . . . . . . . . . . . . . . . . . . . . . . . . . . . . . .. . . . . . . . . .. . . .. . . . . . . . . . . . . . xi List of Figures . . . . . . . . . . . . . . . . . . . . . . . . . . . . . . . . . . . . . . . . . . . . . . . . . . . . . . . . . . . . . . . . . . . . . . . . . . . . . . . . . . . . . . . . . . . . . . . . . . xvi List of Plates . . . . . . . . . . . . . . . . . . . . . . . . . . . . . . . . . . . . . . . . . . . . . . .. . . . . . . . . . . . . . . . . . . . . . . . . . . . . . . . . . . . . . . . . . . . .. . . . . . . . . xx List of Abbreviations . . . . . . . . . . . . . . . . . . . . . . . . . . . . . . . . . . . . . . . . . . . . . . . . . . . . . . . . . . . . . .. . . . . . . . . . . . . . . . . . . . . . . . . . xxi
Preface ..... ........................................................... . ............................................. 1
CHAPTER 1 . 1NTRODUCTION- LITERATURE REVIEW
1 . 1 Dermatophytes .. ....... . .... ........................................... ................................ 5
1 . 1 . 1 The Anamorphic States - Classification and ldentification . . . . . . . . . . . . . . . . . . . . . . . . . . . . . . . . . . . . . . . . . . . . . . . . . . . . . . . . . . . . . . . . . . . . . . . . . . .. . . . . . . . . . 5
1 . 1 .2 Current Concepts of the Anamorphic State . . . . . . . . . . . . . . . . . . . . . . . . . . . . . . . . . . . . 1 0 1 . 1 .3 M. can is and M. cookei ........................... . . ................... ... . . . .... .... ... .. 1 3
1 . 1 .4 The Teleomorphic States .................. ....... .............. ..... . . . .... . . ..... . . . .. 1 6 1 . 1 .4. 1 Techniques for Mating Studies ..... ........... ............... . . . . . .... ... 2 1
1 .2 Ecological Groupings and Sources of lnfection ..... .................... . . . ...... .... 23 1 .2 . 1 Geophiles . . . . . . . . ....... . . . ........... . ........ . . ......... .................. ... . . ..... ...... . . . . 23 1 .2.2 Zoophi les . . . ... ...... ..... . . . . .... ... . ...... . . . . ... ...... . . .... �································-26
1 .2.3 Anthropophi les . ........... ................ . ............ ........... . ...... ... . ....... ... . . . . . . 28
1 .3 Sampling Techniques for Dermatophytes ..... . . ..... . ...... . . . .... . . .. . . ... . . . . . . . . . . . . 32 1 .3.1 The Keratin-baiting Technique ..... . . . ..... ... ............ ....... ......... . . . . ... . . . . 32
1 .3.2 The Hairbrush Technique . . . . ...... . . . . . . . . . . ... . . ... . . ..... . . . . . . . . . . . .... . . . . . ... . . . . . 35
1 .3.3 Sampling of Clinical Material.. . . . . . . . . ... . . . . . . . . ... . ....... . . . . . . ...... . . . . . .... ... . . 35 1 . 4 Colonisation of Keratin by Dermatophytes ... . . . . ... . . . . . .. . . . . . . .... . . . . ..... ... . . .. . . 37
1 . 4. 1 Colonisation in vivo .. . . ..... . . . . . .... . ...... . ... . . . . ...... . .... . . ..... . . . ... . ... . . . . . . . . . . . 37
1 .4. 1 . 1 Hair . ........ ... . .... . . . . . ... . ... ... . . ....... . .... . ... . . ..... . . . . . . . ... . ... .... . ... . . ... . 37
1 .4. 1 .2 S kin . . . ..... . . . . . . . . ... . . . . . ... ...... . ....... . . ... . . . . . ... . . . ... . ... . . ... . . . . . . . .... . . .. 38
1 .4. 1 .3 Nails . ... . ..... . . . ... . . . ... . . .... . ... . . . . . ... ..... ... ...... .... . . . . . . . ... . . . . . . ... . ... . . 38 1 .4.2 Colonisation in in vitro ...... . . . ....... ..... ...... . .... . . . . ... . . . . . . . . . . . ... . . . . ... ... . .... 38
1 .4.2 .1 Hair . . . . . . . . . . . . . . . . . . . . . . . . . . . . . . . . . . . . . . . . . . . . . . . . . . . . . . . .. . . . . . . . . . . . . . . . . . . .. . . . . . . . . 38

vi
TABLE OF CONTENTS Contd. Page
1 .4.2.2 Skin ................. . ....... . . ... . ... ... . .. . . .... . . .......... .......... . ............... 39
1 .4.2.3 Nails . ..... . . . .... ... . ......... . ..... ....... ..................... . . .................... . 40 1 .5 Proteolytic Enzymes of Dermatophytes ...... .......... . . . ....... . ...... ................. 41
1 .5.1 Role in the Colonisation Process .......... ........................ ................ . 41
1 .5.2 Laboratory Production of Dermatophytic Enzymes ........................................................................................ 43 1 .5.2.1 Media and Incubation . . . . . . . . . . . . . . . . . . . . . . . . . . . . . . . . . . . . . . . . . . . . . . . . . . . . . . . . . 43 1 .5.2.2 Stationary and Agitated Cultures . . . . . .... . . . . . . . ....................... .44 1 .5.2.3 Hydrogen ion Concentration (pH) .... . . .... ............... . ...... ...... .44
1 .5.2.4 Oxygen and Carbon dioxide Tensions ........................ ....... 44 1 .5.2.5 Fungal Strain .............. . .. .......... ... ........................................ 45
1 .6 Enzyme Analysis ........................... .. .... ... ............... . ............................... . 46 1 .6.1 Clean-up Procedures . . ...... ... .. . . ..... . . . . . . .. � . . . . . . . . . . . . . ..... . . . . .... ... ... .... . . . . 46 1 .6.2 Polyacrylamide Gel Electrophoresis . . .......... .................... .. ............. 47 1 .6.3 SOS Gels ................................................................................... . . . . 48 1 .6.4 Substrata Copolymerised Gels ...................................................... . 48 1 .6.5 Staining and Destaining Proteinase Gels ....................................... 49 1 .6.6 Isozyme (Multilocus Enzyme) Electrophoresis ..................... .......... 50
1 .6.7 Histochemical Enzyme Staining ..................................................... 51
1 .7 Applications of E nzyme Analysis Techniques . . . . . . . . . . . . . . . . . . . . . . . . . . . . . . . . . . . . . . . . 53 1 . 7. 1 Biochemical Assays . . . . . . . . . . . . . .. . .. . . . . . . . . .. . . . . . . . . . . .. . . . . . . . . . . . . . . . . . . . . . . . . . . . . . . . 53 1 .7.2 Substrata Copolymerised Gels ....... ............... ................................. 55
1 .7.3 Isozyme (Multilocus Enzyme) Electrophoresis ............................... 56 1 .7.4 Methods of Genetic Analysis using Isozyme Data ......................... 59
CHAPTER 2. MATERIALS AND METHODS
2.1 Mycological Techniques . . . . . . . . . . . . . . . . . . . . . . . . . . . . . . . . . . . . . . . . . . . . . . . . . . . . . . . . . . . . . . . . . . . . . . . . . 61 2 . 1 . 1 Principal Media .. ............................................................................. 61 2.1 .2 Isolation of Keratinophilic Fungi from Soil . . . ...... . ... . . . ................... ... 63
2. 1 .2. 1 Collection of Samples ................ . ..................... ......... . . ..... ... 63 2. 1 .2.2 The Keratin-baiting Technique ............... ............................ 63

vii
TABLE OF CONTENTS Contd. Page
2. 1 .3 Isolation of Keratinophi lic Fungi
from Cats and Dogs .... . .... . .. ... . ..... . ... ... . . .... .. ................................... 64
2. 1 .3.1 The Hairbrush Technique .... . . . ..... . ..... . ... . . . . .. .. . . .. .............. . . . 64
2. 1 .3.2 Other Sources . . . . . ....... . .... . ... . ....... . . ... ... .. . . ...... . . ... .. . ......... . ... 65
2. 1 .4 ldentification ........ .. .. : . . . . . . . . . . . . . . . . . . . . . . . . . . . . . . . . . . . . . . . . . . . . . . . . . . . . . . . . . . . . . . . . . . . . . . 65 2 . 1 .5 Determination of Mating Type ....... .... . . . . . . . . .. . . ..... ... .... . . ................... 65
2. 1 .5.1 Strains ....... . . .. . . . . . . . .. . .. . . . . . . . . . ... . ... . . .. . . ... . . . .. ... .. . . . ... . . . .......... . . . 65
2. 1 .5.2 Culture Media . .... . . . . . . . . . . . . . . .. . ........... ... . . . . . . . . . ... . . ................. .. 66
2. 1 .5.3 Determination of Mating Type using the
Stockdale Technique .. . . .. .... ... . . . ... . . . .. ...... . .. .... .... . ... ............ 66 2.1 .6 Maintenance of Cultures ... ......... ...... . ... .. . . . . .. . . . ............................... 66
2. 1 .6. 1 Subcultures ...... . . . . ...... ...... ... . . ... ... .. . . . . . ........... . .. ............... . . . 66 2. 1 .6.2 Water Cultures .. . . .. . ... . . . . . . . .... . ... . . . · . . . .. . .. . .. . . . ... ..... . . ...... ... ..... . 67 2 . 1 .6.3 Lyophilisation ..... ....... .......... . . . . . ........ ...... ....... ......... .......... ... 67
2.1 . 7 Proteinase Production in Broth Cultures . . . ... . . ...... .......................... 67
2. 1 .7. 1 Shake and Stationary Cultures . . .... . . . . . ... . .... ........................ 67
2. 1 .7.2 Estimation of Oxygen Concentration
in Cultures . ......... ............. . ... ... . . . . . . . . . . . ... . . . .... . . . ..... ............... 68 2.2 Biochemical Assays for Proteolytic Enzymes . . ....... . ... ....... . . . . ... . . . . .. . . . . . . .. 69
2.2. 1 Gelatin-Agar Plate Method ............ .... ... . . . .. ........... ........... ... ............ 69 2.2.2 Azocollytic Assay . ........... ....... . ......... . . . . . . ........ .... ......... .................... 70
2.2.3 Elastinolytic Assay ........ .................... ...... ........... ............................. 70
2.2.4 Keratinase Assay ...... . . ....................... ............. ............................... 72
2.2.5 Characterisation of Microsporum Enzymes .................... ................ 72 2.3 Proteinase Assays using SDS-Substrate
Copolymerised Gels ....... ....... .................................................................. 7 4 2.3. 1 Reagents and Solutions ................... .............................................. 7 4 2.3.2 Preparation of Gels ..... ..... ....... ...... ...... ........................................... 77 2.3.3 Sample Preparation and Electrophoresis ....................................... 79
2.3.4 Developing the Gel. . . . . . . . . . . . . . . . . . . . . . . . . . . . . . . . . . . . . . . . . . . . . . . . . . . . . . . . . . . . . . . . . . . . . . . . . . 79
2.3.5 Gel Scanning .................................................................................. 80

viii
TABLE OF CONTENTS Contd. Page
2.3.6 Gel Photography .. ... . . . . . . . . .. . .......... . .. . ... . ................... . ... ................ ... 80
2.4 Multilocus Enzyme Electrophoresis Using Starch Gels .... ... ................... 81
2 .4. 1 Preparation of Mycelial Homogenates ............ .......... ..................... 81
2 .4.2 Enzyme Extraction . ............. . ... . ..... ... . ................................... ......... . 81
2 .4.3 Enzyme Selection ............. ...... ... .. . ............................................ ...... 81
2.4.4 Starch Gel Apparatus ...................................................... ............... 82
2.4.4.1 Preparation of Gels . . . .. . . .. . . .. .. . . . ....... . .......... . . . . . ... ..... . ... . . . . ... 82 2.4.4.2 Loading of Samples onto Gels . . .................... ..... ................ 83
2.4.5 Electrophoresis . . . .. . .. . . . . ........ ........ . . .... ............................................. 84
2.4.5. 1 Electrophoretic Buffers . . ... . ... . . . .... ...... ... . . . .. ... ... .. .. . ....... . . . .... 86
2 .4.6 Slicing and Stain ing ....... . ..... ........ ................................................... 88 2 .4. 7 Gel Fixation .................................................................................... 92 2 .4.8 Safety Precautions . . . . . . . . . . . . . . . . . . . . . . . . . . . . . . . : . . . . . . . . . . . . . . . . . . . . . . . . . . . . . . . . . . . . . . . . . 92
2.5 Statistical Analyses ........... ........... ... ................................. . . ..................... 93 2 .5. 1 Phenotypic Diversity ....................................................................... 93
2.5.2 Apportionment of Diversity .. . ... . . ... . . . ... . .. . . .... ... ....... ................ ......... 94 2 .5.3 Phenotypic Identity ............................................................. . ........ ... 95 2.5.4 Estimation of Phenotypic simi larity
using the Cluster Method .......................... .................. .. . . .. ............. 95
CHAPTER 3. RESULTS
3.1 Keratinophilic Fungi from Soil . . ................. .............................................. 96
3.1 . 1 Frequency and Distribution of Genera ............................... . . . . ... ..... 96 3.1 .2 Keratinolytic Species ................... . ......... . .................. . . . . . . ..... .... . . . .... 98
. 3.2 Keratinophilic Fungi from Cats and Dogs .. . . . . . . . . . . . . . . . . . . . . . . .. . . . . . . . . . . . . . . . . . . . 1 04
3.2. 1 Fungi Isolated using the Hairbrush Technique ......... ... . . ...... . .... .... 1 04 3.2.2 Keratinolytic Species ......................................................... . .......... 1 07 3.2.3 Bimonthly Distribution of M. canis ............ ......... . .... ... ... . . . . . . . . . . ...... 1 09
3.3 Determination of Mating Types of Microsporum Isolates using A. simii and N. otae ......................... ........ ........ . .......... . . . ....... . . ...... 1 1 1

ix
TABLE OF CONTENTS Contd. Page
3.3.1 M. can is ........................................................................................ 1 1 1 3.3.2 M. cookei ...................................................................................... 1 1 4
3.4 Assays of Proteolytic Enzymes Produced by M. canis
and M. cookei ........................................................................................ 1 1 8 3.4.1 Gelatin Hydrolysis ........ ...................................... ............ .............. 1 1 8 3.4.2 Biochemical Assays with M. canis ................................. . .............. 1 21
3.4.2. 1 Comparison of Overall Enzyme Expression
of M. canis lsolates ................................ .. . . ...................... 1 26
3.4.2.2 Comparison of Enzyme activities of M. canis Isolates using Scattergrams .......................... .................. 1 28
3.4.3 Biochemical Assays with M. cookei ............ .................................. 1 38 3.4.3.1 Comparison of Overall Enzyme Expression
of M. cookei Isolates ................. · ....................................... 1 40 3.4.3.2 Comparison of Enzyme activities of M. cookei
Isolates using Scattergrams ............................................ 1 41 3.4.4 Estimation of Oxygen Concentration in Cultures .......................... 1 44
3.4.5 Characterisation of Microsporum Proteolytic Enzymes ....... . ........ 1 45
3.4.5. 1 M. canis ..................................................................................... 1 45
3.4.5.2 M. cookei ................................................................................... 1 48
3.5 Analysis of Proteinases by SDS-Substrate Copolymerised Gels ......... 1 51 3.5.1 Gelatinases of M. canis ...... . ........ . . .................................. . . .... . . ..... 1 51 3.5.2 Gel Scanning ................................... ............................................. 1 51
3.5. 1 . 1 M. canis from Clinical Cases Grown in Shake
Culture ...................................................... ....................... 1 53 3.5. 1 .2 M. canis from Carriers Grown in Shake
Culture ........... . ............ .............................. .............. . . ....... 1 54
3.5. 1 .3 M. canis from Clinical Cases Grown i n Stationary
Culture ........................................................................ ..... 1 55
3.5. 1 .4 M. canis from Carriers Grown in Stationary Culture ......... 1 57
3.5. 1 .5 Comparison of Culture Methods ................... ........ ............ 1 58
3.5.2 Gelatinases of M. cookei.. . . . ........ .......... . . ............... .... .................. 1 59

X
TABLE OF CONTENTS Contd. Page
3.5.2.1 M. cookei Grown in Shake Culture . . . . . . . . . . . . . . . . . . . . .. . . . . ..... .. . . 1 61 3.5.2.2 M. cookei Grown in Stationary Culture . . . . . . . . . . . . . .... ......... .. . 1 62
3.5.2.3 Comparison of Culture Methods . . . . .. . .. . . .... . . . . . .... .. . ... ......... 1 63 3.5.3 Elastases Detected in M. canis and
M. cookei Fi ltrates ..... . . . . . . .. . . . . . . .... . . . . .. . . . . . .. ... . . . . . . ... . . . . ... . ..... . .... ..... 1 64
3.6 Multilocus Enzyme Electrophoresis . ...... . . . . . . ... . . .. . ... ... ... . ...... .......... ..... .. 1 65
3.6. 1 Basic Data . . . . . . . . . . . . . . . . . . . . . . . . . . . . . . . . . . . . . . . . . . . . . . . . . . . . . . . . . . . . . . . . . . . . . . . . . . . . . . . . . . . . 1 65 3.6.2 Phenotypic Diversity . . . . . . . . . . . .. . . . . .. . . . . . . . . . . . . . . . . . . . . . . . . . . . . . . . . . . . . . . . . . . . . . . . . . . 1 78
3.6.2. 1 Overall Diversity . . . . . . . . . . . . . . . . . . . . . . . . . . . . . . . . . . . . . . . . . . . . . . . . . . . . . . . . . . . . . . . 1 79 3.6.2.2 Diversity of Microsporum spp. from Clinical Cases,
Carriers and Soi l . . . . . .. . . . ... . . . . . . . . . . .... . . . . .... . . .. . . . . . . ... ........ . . ... . 1 80 3.6.2.3 Diversity of M. canis Isolated from Humans and Cats . . . . . . 1 81 3.6.2.4 Diversity of M. can is between Regions .. . . . . . . . . . . . . . . . . . . . . . . . . . . 1 82 3.6.2.5 Apportionment of Diversity . . . . . . . . . . . . . . . . . . . . . . . . . . . . . . . . . . . . . . . . . . . . . . . 1 83 3.6.2.6 Diversity among M. cookei"+" and "-" Mating Strains .. .. . . 1 84
3.6.3 Phenotypic Identity .............. . . . . . .... . . ..... . . . . . ... . . . . . . . .. . .. ...... .... . ........ . . 1 85
3.6.3. 1 Relatedness Between the species . . . . . .. . ........ . ... .... . .... ... ... 1 85 3.6.3.2 Related ne ss of M. canis from the Three Regions . . ... ..... . . 1 87
3.6.4 Estimation of Phenotypic Similarity using the Cluster
Method ........ ........ ............ . . . . . . . . . .... ... . . . . . . . . . . . . .. . ... . . ... . .. . .... ... . .... . . . ... 1 87
CHAPTER 4. DISCUSSION ... . ..... . .... . ...... ....... . . . . ... . ... . . ... . .. . . ... ... . ... . . ..... ..... ... . 1 93
CONCLUSION . .... ... ..... ...... .......... ....... .... ... ....... . ... . ... . . . . . ..... . . .. ... .. ........ .. ........ 223
APPENDIX A .............................................................. � ......... .......................... 226
APPENDIX B .................................................................................................. 229 APPENDIX C ....... ... ...... . . ....... . ..... ............ ....... . . ..... . . ..... .... .... .... . .. ... . ............ .. 232
APPENDIX 0 .. .. ...... ..................... . ....... . .............. ........... .. . ... . .... ........... ......... . 234
REFERENCES ............ .................................................................................. . 236

xi
LIST OFT ABLES
Page
1 -1 . Classification of dermatophytes . ........ . . ........ . . . ......... ..................... ..... 9 1 -2: The principal members of the genera
Epidermophyton and Microsporum . . ................................. . . . . ........... 1 1
1 -3. Members of the genus Trichophyton ................................................ 1 2 1 -4: Trichophyton species with a known
teleomorphic state ............................................................................ 1 9
1 -5: Microsporum species with a known
teleomorphic state ................... ......................................................... 20
1 -6. Geophilic dermatophytes ....................... .......................................... 25
1 -7 : Geographical distribution of geophilic dermatophytes · and host preference ............ .. . . ............................................... . . . ....... 25
1 -8: Zoophilic dermatophytes ............. ...... ...... � ... .... . . . . .................. . . ......... 27 1 -9: Anthropophilic dermatophytes .................................... . . . ............ ....... 30
2-1 : Inhibitor concentrations ...... . . .......................................... : . . . . . . . . . . . . . . . . . 73 2-2: Recipes for gel Preparation using
SDS-Discontinuous buffer system ............ ........................ ........ ....... 78 2-3: Ust of enzymes, abbreviations and
enzyme commission (E.C.) code ................................... .................. 82
2-4: Buffers used for the continuous buffer system .. .... .................. ...... ... 86
2-5: Buffers used for the discontinuous buffer system .......... .................. 88
2-6: Substrates, buffers and dyes used in the "chemical
detection" method for EST and LAP ................. . ......................... ..... 90 2-7: Substrates, buffers and dyes used in the electron
transfer dye method for G6P and MDH ... . . . . . . . . ... . . .... . ....... ... ..... ..... . .. 91 2-8: Substrates, buffers and dyes used in the enzyme-linked
method for PEP and GPI. . . . . . . .. . . . . . . . . . . . . . . . . . . . . . . . . . . . . . . . . . . . . . . . . . . . . . . . . . . . . . . . . . 9 1
3-1 : Soil samples yielding keratinophi lic fungi in culture . .... ..... . . . .. . . . . . . ... . 96 3-2: Fungal genera isolated from 236 soil samples
by the keratin-baiting.technique .. ... . . . ......... . . . . ... . . . . . . . . . . ... ............. .. . . . 97
xii
LIST OF T ABLES Contd. Page
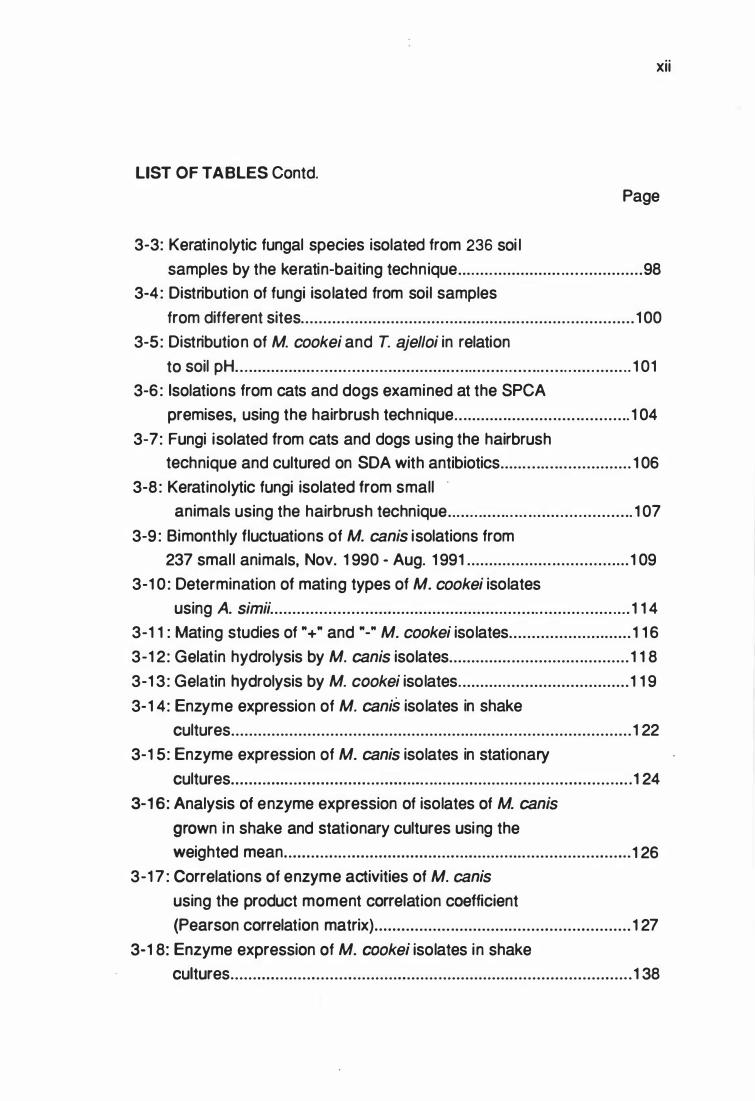
3-3: Keratinolytic fungal species isolated from 236 soi l samples by the keratin-baiting technique ....................... .... .............. 98
3-4: Distribution of fungi isolated from soil samples
from different sites ................................ ........................... ............... 1 00
3-5: Distribution of M. c ook e i and T. aje lloi in relation
to soil pH .. ................ . ...... ........ . .......................... . . ............ ..... ....... . . 1 01 3-6 : lsolations from cats and dogs examined at the SPCA
premises, using the hairbrush technique . . . ........ ........... ..... ............ 1 04
3-7: Fungi isolated from cats and dogs using the hairbrush technique and cultured on SDA with antibiotics ............................. 1 06
3-8: Keratinolytic fungi isolated from small animals using the hairbrush technique . . .... . ....... .. . . . . ..... . . . . ............ 1 07
3-9 : Bimonthly fluctuations of M. canis isolations from 237 smal l animals, Nov. 1 990 - Aug. 1 991 . . . . . . . . . . . . . . . . . . . . . . . . . . . . . . . . . . . . 1 09
3-1 0 : Determination of mating types of M. c ook e i isolates using A. simii ............................................................ ......... . ...... . . . . 1 1 4
3-1 1 : Mating studies of "+" and "-" M. c ook e iisolates ........................... 1 1 6
3-1 2: Gelatin hydrolysis by M. canis isolates ............................. ........... 1 1 8
3-1 3 : Gelatin hydrolysis by M. co ok e i isolates ...................................... 1 1 9
3-1 4: Enzyme expression of M. canis isolates in shake cultures ......................................................................................... 1 22
3-1 5: Enzyme expression of M. canis isolates in stationary
cultures ................................................................. ................... .... . 1 24
3-16: Analysis of enzyme expression of isolates of M. canis
grown in shake and stationary cultures using the weighted mean .............. ................................... . .... ....................... 1 26
3-1 7 : Correlations of enzyme activities of M. canis
using the product moment correlation coefficient (Pearson correlation matrix) ................. ........................................ 1 27
3-1 8: Enzyme expression of M. cook e i isolates in shake cultures .............................................. ........................................... 1 38

xiii
LIST OF T ABLES Contd. Page
3-1 9 : Enzyme expression of M. cookei isolates in stationary
cultures .... ......... . . . .. � . ... .... ........ . . . ..... ... .... ........... ...... ...... ..... ....... ... . 1 39
3-20 : Analysis of enzyme expression of isolates of
M. cookei grown in shake and stationary cultures using the weighted mean . .. .... . ......... ... . . . . . . ...... . .. . . . . . . . . . .. . .. . . . .. . . . . . . . 1 40
3-21 : Correlations of enzyme activities of M. cookei
using the product moment correlation coefficient
(Pearson correlation matrix) .................. ....... . . .... . . . .... ... ... .. ..... .... . . 1 41 3-22: Oxygen concentration in shake and stationary
cultures ...... . ... . ....... . . . ... ......... . . . ....... .. . . .. : . . . . . . . . . . . . . . . . . . . . . . . . . . . . . . . . . . . . . . . 1 44 3-23: Effect of inhibitors on M. canis crude filtrate activity .. . . . . . . . .. . . .... . . . 1 45
3-24: Effect of inhibitors on M. cookei crude filtrate activity ................ .. 1 48 3-25: Proteinases of M. canis from clinical cases grown in shake
culture, as detected by gelatin/SDS-PAGE. ......... ........................ . 1 53 3-26 : Proteinases of M. canis from carriers grown in shake
culture, as detected by gelatin/SDS-PAGE. ......... ... . .................. .. 1 54 3-27: Proteinases of M. canis from clinical cases grown in
stationary culture, as detected by gelatin/SDS-PAGE. .............. .. 1 55 3-28: Proteinases of M. canis from carriers grown in stationary
culture, as detected by gelatin/SDS-PAGE. ....................... ... . ... . . . 1 57
3-29: Comparison of shake and stationary cultures of 50
M. canis from clinical cases and carriers ...................................... 1 58 3-30: Significance levels for different Mr enzymes between
shake and stationary cultures of clinical and carrier
isolates of M. canis ....................................................................... 1 59 3-31 : Proteinases of M. cookei grown in shake culture, as
detected by gelatin/SDS-PAGE .................................................... 1 6 1 3-32: Proteinases of M. cookei grown i n stationary culture,
as detected by gelatin/SDS-PAGE. . . .......... .................................... 1 62

xiv
LIST OF T ABLES Contd. Page
3-33: Proteinases detected in shake and stationary cultures of
M. cookei .......... .. . ....... . . ................ .......... ......... ........ ..................... 1 63
3-34: Comparison of electromorphs of 72 Microsporum
isolates and 2 Diheterospora isolates .. ................ ..... ...... . ............ 1 70 3-35: Comparison of electrophoretic phenotypes of
Microsporum and Diheterospora spp .. . . . ... . ...... . . . . . ..... . .......... ...... . 1 72 3-36: Phenotypic diversity of eight enzyme systems of
Microsporum and Diheterospora spp ........... ... ........ .. ... ....... ........... 1 79
3-37: Phenotypic diversity in isolates of Microsporum spp.
isolated from clin ical cases, carriers and soils . ... . ........................ 1 80 3-38: Phenotypic diversity of isolates of M. canis spp.
isolated from humans and cats ................................ ........... ... ...... 1 81 3-39: Mean phenotypic diversity in isolates of M. can is
isolated from different geographical regions ................................ 1 82 3-40: Phenotypic diversity of M. canis within and
between Auckland, Palmerston North and Wellington for
each enzyme system .................................................................... 1 84 3-41 : Phenotypic diversity in "+" and "-" mating strains of
M. cookei ....................................................................................... 1 85 3-42: Estimation of the degree of similarity between
the populations of Microsporum spp. and Diheterospora
using Hedrick's identity measure (/) ............................................. 1 86 3-43: Estimation of the degree of simi larity between the
geographical regions using Hedrick's identity measure (/) .......... . . 1 87
3-44: Electromorph profi les of 76 isolates of Microsporum and Diheterospora . . . . . . . . . . . .. . . . . . . . . . . . . . . . . . . . . . . . . . . . . . . . . . . . . . . . . . . . . . . . . . . . . . . . . . . . 1 88
4-1 : C lassification of the eight enzymes ................................................ 21 5

XV
LIST OF FIGURES.
Page
1 -1 : Principal microscopic structures used in identifying dermatophyte species . . . . . . . . . . . . . . . . . . . . .. . . . . . . . . . . . . . . . . . . . . . . . . . .. 6
2-1 : Loading of samples on starch gel. 1 , Whatman N23 filter paper soaked with fungal extract and placed vertically at the origin. 2, Forceps. 3, Gel is cut (origin) 6cm from the
cathode. 4, 2-3mm spacing between each wick . . . . . . . . . . . . . . . . . . . . . . . . . . . . . 85 2-2: A layer of thin polyethene (Glad Wrap TM) is placed
over the gel leaving at least 1 -2cm at each end . . . . . . . . . . . . . . . . . . . . . . . . . . . . . 85 2-3: Preparation of gel for electrophoresis.
1 , Plastic buffer dish is filled 2/3 full with
electrode buffer solution. 2, Platinum electrodes are placed in the buffer. 3, Absorbent wick
(Handiwipe) is placed in the buffer solution and
firmly placed onto the surface of the gel. 4, The gel mould is raised about 6.4cm using a wooden block placed beneath the glass plate . . . . . . . . . . . . . . . . . . . .. . . . . . . . . . . . . . . . . . . . . . . . . 85
3-1 : Keratin-baiting technique using sheep wool for isolation of keratinophilic fungi.. . . . . . . . . . . . . . . . . . . . . . . . . . . . . . . . . . . . . . . . . . . . . . . . . . . . . . 99
3-2: Spontaneous cleistothecium development on soil
by T. ajelloi ..................................................................................... 99 3-3: Distibution of M. cookei in relation to soil pH . . . . . . . . .. . . . . . . . . . . . . . . . . . . . . . . . 1 02 3-4: Distibution of r. ajelloi in relation to soi l pH ... . . . . . . . . . . . . . . . . . . . . .. . . . . . . . . . . 1 03 3-5: The plastic Nu-brush used for screening carrier animals . . .. . . . . . . . . . . . 1 05
3-6: Growth of M. canis from a Nu-brush tested cat. . . . . . . . . . . . . . . . . . . . . . . . . . . . . . 1 05
3-7: Bimonthly distribution of M. canis ......... ........................... ............... 1 1 0
3-8 : Zone with cleistothecia formed between A. simii "+" (MY03684) and "-" (MY03784) and stimulated growth
containing some cleistothecial in itials between
A. simii "+" (MY03684) and M. canis (PN1 1 ) . . . . . . . . . . . . . . . . . . .. . . . . . . . . . . . . 1 1 2

xvi
LIST OF FIGURES Contd. Page
3-9: A cross between the tester strain N. otae "+" (RV42487)
and M. canis (PNOS)(upper colony) on SDA (1/8) agar . . . . . . . . . . . . . . . . 1 1 2
3-1 0 : Cleistothecia of N. otae produced by crossing M. canis (PN05) with tester strain N. otae "+" (RV42487) (magnification x200) . . . . . . . . . . . . . . . . . . . . . . . . . . . . . . . . . . . . . . . . . . . . . . . . . . . . . . . . . . . . . . . . . . . . . 1 1 3
3-1 1 : Peridial hyphae of cleistothecia produced by crossing M. canis (PN05) with tester strain N. otae "+" (RV42487) (magnification x500) . . . . . . . . . . . . . . . . . . . . . . . . . . . . . . . . .. . . . . . . . . . . . . . . . . . . . . . . . . . . . . . . . . . . . 1 1 3
3-1 2 : Zone with cleistothecia formed between A. simii "+"
(MY03684) and "-" (MY03784) and stimulated growth containing some cleistothecial initials between A. simii "+" (MY03684) and M. cookei (H223) . . . . . . . . . . . . . . . . . . . . . . . . . . . . . . . . . . . . . . . . . . . . . . . . 1 1 5
3-1 3 : Crossing between "+" (A39) and "-" (H21 9) strains of
M. cookei on SDA (1 /1 0) agar . . . . . . . . . . . . . . . . . . . . . . . . . . . . . . . . . . . . . . . . . . . . . . . . . . . . . . 1 1 5 3-1 4 : Cleistothecia of N. cajetani produced by crossing "+"
and "-" strains of M. cookei (magnification x200) . . . . . . . . . . . . . . . . . . . . . . . . . 1 1 7 3-1 5: Peridial hyphae produced by crossing "+" and "-" strains
of M. cookei (magnification x500) . . . . . . . . . . . . . . . . . . . . . . . . . . . . . . . . . . . . . . . . . . . . . . . . . 1 1 7 3-1 6 : Hydrolysis of gelatin by M. canis (PN26) using the gelatin
plate method . . . . . . . . . . . . . . . . . . . . . . . . . . . . . . . . . . . . . . . . . . . . . . . . . . . . . . . . . . . . . .. . . . . . . . . . . . . . . . . . . 1 20 3-1 7 : Hydrolysis of gelatin by M. cookei (H223) using the gelatin
plate method . . . . . . . . . . . . . . . . . . . . . . . . . . . . . . . . . . . . . . . . . . . . . . . . . . . .. . . . . . . . . . . .. . . . . . . . . . . . . . . . . 1 20
3-1 8 : Proteinase (azocollytic) (PUmr1 ) expression in shake and stationary cultures of M. canis isolates . .. . . . . . . . . . . . . . . . . .. . . . . . . . . . . . . . 1 29
3-1 9 : Proteinase (azocollytic) (PUmr1 ) expression in shake cultures of M. canis isolates from clinical cases and carriers ......................................................................................... 1 30
3-20: Proteinase (azocollytic) (PUmr 1 ) expression in stationary cultures of M. canis isolates from clinical
cases and carriers . . . . . .. . . . . . . . . . . . . . . . . . . . . . . . . . . . . . . . . . . . . . . . . . . . . . . . . . . . . . . . . . . . . . . . . . 1 31

xvii
LIST OF FIGURES Contd. Page
3-21 : E lastase (J..l9mr1) expression in shake and stationary cultures of M. canis isolates ......................................................... 1 32
3-22: E lastase (JJ.gmr1) expression in shake cultures of M. canis isolates from clinical cases and carriers ........................ 1 33
3-23: E lastase (JJ.gmr1) expression in stationary cultures of
M. canis isolates from clinical cases and carriers ........................ 1 34 3-24: Keratinase (KUmr 1 ) expression in shake and stationary
cultures of M. canis isolates ......... ................................................ 1 35
3-25: Keratinase (KUmr 1) expression in shake cultures of M. canis isolates from clinical cases and carriers ........................ 1 36
3-26: Keratinase (KUmr1 ) expression in stationary cultures ot" M. can is isolates from clinical cases and carriers . . . . ...... .......... 1 37
3-27: Proteinase (azocollytic) (PUmr 1 ) expression in shake and stationary cultures of M. cookei isolates ................................ 1 42
3-28: E lastase (JJ.gmr1) expression in shake and stationary cultures of M. cookei isolates ..... ........................... ....................... 1 43
3-29: Inhibition of proteinase (azocollytic) activity in M. canis
filtrate by various inhibitors ........................................................... 1 46 3-30: Inhibition of e lastase activity in M. canis
fi ltrate by various inhibitors ................... ........................................ 1 47
3-31 : Inhibition of proteinase (azocollytic) activity in M. cookei filtrate by various inhibitors ........... . . . ....................... ...................... 1 49
3-32: Inhibition of e lastase activity in M. cookei
fi ltrate by various inhibitors .......................... .-. . . . . . . . . . . . . . . . . . . . . . . . . . . . . . . . 1 50 3-33: 1 2% gelatin/SDS-PAGE of continuous shake culture
fi ltrates of M. canis isolates ........................... ............................... 1 52 3-34: 1 0% gelatin/SDS-PAGE of stationary culture filtrates
of M. can is isolates ....................................................................... 1 52 3-35: 1 2% gelatin/SDS-PAGE of continuous shake culture
fi ltrates of M. cookei isolates ........................................... ............. 1 60

xviii
LIST OF FIGU RES Contd. Page
3-36 : 1 0% gelatin/SDS-PAGE of stationary culture filtrates of M. cookei isolates . . . . . . . . . . . . . . . . . . . . . . . . . . . . . . . . . . . . . .. . . . . . . . . . . . . . . . . . . . . . . . . . . . . . . 1 60
3-37: Electromorph profi les of catalase (CAT) . . . . . . . . . . . . . . . . . . . . . . . . . . . . . . . . . . . . . . 1 66
3-38: Electromorph profi les of esterase (EST) . . . . . . . . . . . . . . . . . . . . . . . . . . . . . . . . . . . . . . 1 66
3-39: Electromorph profi les of glucose-6-phosphate dehydrogenase (G6P) . . . . . . . . . . . . . . . . . . . . .. . . . . . . . . . . . . . . . . . . . . . . . . . . . . . . . . . . . . . . . . . . . . 1 67
3-40: Electromorph profiles of glucose-6-phosphate
isomerase (GPI) . . . . . . . . . . . . . . . . . . . . . . . . . . . . . . . . . . . . . . . . . . . . . . . . . . . . . . . . . . . . . . . . . . . . . . . . . . . 1 67 3-41 : Electromorph profiles of leucine aminopeptidase (LAP) . . . . . . . . . . . . . . 1 68 3-42: Electromorph profi les of malate dehydrogenase (MDH) . . . . . . . . . . . . . . 1 68
3-43: Electromorph profi les of peptidase (PEP) . . . . . . . . . . . . . . . . . .. . . . . . . . . . . . . . . . . . 1 69
3-44: Electromorph profi les of peroxidase (PER) . . . . . . . . . . . . .. . . . . . . . . . . . . . . . . . . . . 1 69 3-45: Summary of isozyme phenotypes of catalase and
esterase ....................................................................................... 1 75
3-46: Summary of isozyme phenotypes of glucose-6-phosphate
dehydrogenase, glucose-6-phosphate isomerase and leucine aminopeptidase . . . . . . . . . . . . . . . . . . . . . . . . . . . . . . . . . . . . . . . . . . . . . . . . . . . . . . . . . . . . . . . . 1 76
3-47: Summary of isozyme phenotypes of malate dehydrogenase,
peptidase and peroxidase . . . . . . . . . . . . . . . . . . . . . . . . . . . . . . . . . . . . . . . . . . . . . . . . . . . . . . . . .. . . 1 77 3-48: Cluster analysis performed on the results of isozyme
electrophoresis in relation to isolate. (S, Source, PN,
Palmerston North ; AK, Auckland; WG, Wellington) Clusters 1 -4, M. cookei; Cluster 5-7, M. canis; Cluster 8, Diheterospora ......... 1 91
3-49: Cluster analysis performed on the results of isozyme
electrophoresis. (S, Source; I , Infection (-/+)) Clusters 1 -4, M. cookei; Clusters 5-7, M. can is; Clusters 8, Diheterospora .. . . .. 1 92

xix
LIST OF FIGURES Contd. Page
LIST OF PLATES
1 - 1 : Colony of M. canis on SDA with fluffy growth
after 2 weeks at 25°C ............................................... ........... . . . ........ 1 4 1 -2 : Reverse with golden yellow pigmentation ......................... ............... 1 4 1 -3: M. canis, spindle shaped, echinulated and pointed
macroconidia with microconidia { magnification x400) . . .................. 1 4 1 -4: Colony of M. cookei on SDA with granular
texture after two weeks at 25°C ..................................................... 1 5 1 -5 : Reverse with deep brown pigmentation . . ......................................... 1 5 1 -6 : M. cookei, spindle shaped, echinulated and less
pointed macroconidia with numerous microconidia { magnification x400) ....................................................................... 1 5

LIST OF ABBREVIATIONS
3A9EC = 3-amino-9-ethylcarbazole BPB = Bromophenol blue CAT = Catalase DDW = Double distilled water DFM = Dimethyl formamide DW = Distilled water E-64 = L-trans-epoxysuccinyl leucylamido (4-guanidino)-butane
EC = Enzyme Commission
EST = Esterase Fast blue B = o-dianisidine dihydrochloride
G6P = Glucose-6-phosphate dehydrogenase G6PDH = Glucose-6-phosphate dehydrogenase GPI = Glucose-6-phosphate isomerase IAA = Iodoacetic acid
ITM = Prince Leopold Institute for Tropical Medicine
IUBNC = International Union of Biochemistry LAP = Leucine ami no peptidase
MOH = Malate Dehydrogenase Mr = Molecular weight
MTT = Methyl thiazolyl tetrazolium NAD = �-Nicotinamide adenine dinucleotide
NADP = Nicotinamide adenine dinucleotide phosphate
NBT = Nitre blue tetrazolium
PAGE = Polyacrylamide gel electrophoresis
pCMB = p-Chloromecuric acid a1 -P = a-1 -proteinase
PEPS = Pepstatin
PEP = Peptidase
PER = Peroxidase
PMS = Phenazine methosulphate
PMSF = phenylmethylsulfonyl fluoride
XX

LIST OF ABBREVIATIONS Contd.
PT = 1 , 1 0-phenanthroline SOS = Sodium dodecyl sulfate SOW = Sterile distilled water
SGE = Starch gel e lectrophoresis SPCA = Society for the Prevention of Cruelty to Anima ls TCA = Trichloroacetic acid TEMEO = Tetramethyl ethylenediamine TRIS = Tris[hydroxymethyl]aminomethane
xxi
1
PREFACE
Medical mycology can be said to have originated with the demonstration by Agostino Bassi in 1 835 of the re lationship between a disease of s i lkwo rms known as muscard i n e and its causal age nt , a fungus , Beauvaria bassiana (Utz, 1 981 ) . This disease had threatened to destroy the s i lk i ndustry in France and Italy (Aje l lo, 1 977). But after Bassi's
discoveries, other early work was concentrated on the superficial fungal diseases of man.
Robert Remak in 1 837 observed spores and hyphae in crusts recovered from a child suffe ring from favus and late r published accou nts of the fungus in hair shafts obtained from the patient (Howard, 1 983). He also successfu lly reproduced the d isease by se lf-i nocu lation . I n 1 845, he
cu ltivated and named the aetio logical agent, Achorion schoenleinii, during h is work in his mentor Professor Schoenlein's clinic. The fungus is now more commonly known as Trichophyton schoenleinii.
Although Remak was the first to associate a microorganism with human d isease, the studies of David Gruby made a g reater contribution to
m edical mycology (Ajel lo , 1 974; Howard , 1 983). Between 1 841 and 1 844, Gruby re leased several publications which described the main pathogens causing ringworm and also i ndependently described the fungal nature of favus (Wilson and Plunkett, 1 97 4 ). In 1 843, he published
an account of scalp ri ngworm caused by a fungus which he named
Microsporum audouini (on the basis of the in vivo g rowth pattern) , in
honour of a colleague, Victor Audouin. His work also included studies of e ndothrix trichophytosis and thrush, a fungal disease of the mouth caused by Candida albicans.
A n other who contributed a g reat deal to t h e deve lopment of o u r k nowledge o f t h e ri ngworm fungi o r dermatophytes was Raymond Sabouraud. Sabouraud, in 1 892 started issuing numerous reports which
cu lm i nated i n the publ icatio n of "Les Teignes" (Sabouraud, 1 9 1 0 ) . Sabouraud was able, through the techniques of pure culture , which he
i nt roduced i nto medical mycology , to demonstrate the p lurality of d e rm atophytes. He p laced these fungi i nto fou r genera : Achorion,

2
Epidermophyton, Microsporum and Trichophyton (Sabouraud, 1 9 1 0 ,
cited by Ajello, 1 968; Seelinger, 1 988).
Sabouraud had realised the complex manner in which these fungi grow
i n culture , with successive cultu res taken from the parent stock often showing variation. This capacity for variation can render dermatophytes
very difficult to identify and resulted in great difficu lties in devising a uniform, internationally accepted classification (Ajello, 1 962).
The fo llowing years saw i ncomplete and inaccurate reporting because
diagnosis was not based on sound mycological techniques but on small
variations in clinical appearance of lesions or slight differences in colonial
morphology. The natural h istory of the fungus was unknown or ignored
(Wilson and Plunkett, 1 974; Howard, 1 983). Due to numerous misleading reports, several hundred "new species" were described and named as human pathogens. Dodge ( 1 935) in his monograph even described 1 1 8 dermatophyte species, placed in 9 genera (Baxter and Rush-Munro ,
1 980b). This confusion , which hindered clinicians in classifying human d isease on a myco log ical basis , forced them to adopt a c l in icalanatomical or topographical categorisation.
I n 1 934, Emmons developed and outli ned in extensive detai l a strict
botanical classification based on accepted ru les of nomenclature and using fungal morphology in vitro, which avoided classification systems based on clinical appearance. He placed the dermatophyte species into
t h re e g e n e ra, Epidermophyton, Microsporum and Trichophyton,
e mbraci ng 1 8 species (Emmons , 1 934). Th is was g e ne ra l ly we l l accepted by mycologists and clinicians alike (Ainsworth, 1 986).
The dermatophytes can be included in an ecological group known as the
keratinophilic fungi i.e. fungi with an affinity for keratin. Such fungi may
m e re ly use kerat in as a surface fo r g rowth. I n other cases s imple
mechanical penetration of the substrata may be achieved. But some
i ncluding the dermatophytes and a number of dermatophyte-like fungi have a marked ability to enzymatically digest keratin and can be termed
keratinolytic fungi. The keratinolytic fungi comprise the dermatophytes
and certain other fungi such as Chrysosporium spp . .

3
The use of Vanbreuseghem's (1 952) hair-baiting technique has enabled
the detection and iso lation of soi l-borne (geophi lic) non- pathogenic,
ke rat i n o lyt ic f u n g i . N otab l e a m o n g st t h e s e are Trichophyton
(Keratinomyces) ajelloi (Vanbreuseghem, 1 952) Ajello, 1 968, T. terrestre Durie and Frey, 1 957 and M. cookei Ajello, 1 959. All these geophi l ic species, with regard to morphology, sexual behaviour (Campbell, 1 988) and antigenicity (Mackenzie, 1 988) are dermatophytic. The only factor
differentiating them from true dermatophytes is their i nability to cause disease in man and animals.
The dermatophytes in the broadest sense can be divided i nto three eco log ica l g ro u p s , z o o p h i l e s ( m a m m a l i a n and av i a n h o st s) ; anthropophi les (human hosts) and geophiles, which for the most part degrade keratinous material, e.g. skin, hai r, hooves, horns, feathers, i n the soi l. Of the zoophi les at least ten species are recognised, three of which are of real i mportance to man, name ly ; Microsporum canis,
Trichophyton mentagrophytes (and its varieties) and T. verrucosum. Of the three, Microsporum canis is the most important epizoonotic fungal
pathogen, causing a severe public health problem on a world-wide scale.
Besides its impact on human health, there are also social and economic
considerations as a result of its infections. For example, ringworm of the scalp is (wrong ly) considered to be a social stigma (English, 1 972} . I n
New Zealand, the most susceptible age of infection is up to 15 years but
the impact of loss of school days on school-going children has not been documented (Mycoses Newsletter, CDCNZ, 1 992} . In addition to human
suffe ri ng, the economic cost of medical consu ltatio n and drugs for
treatment is not known.
M. canis is responsible for a polymorphism of scalp and skin i nfections i n both humans and an imals. Its abi l ity to produce enzymes has been
implicated in the pathogenesis of skin infections of the host organisms, in
cou ntering host defense mechanisms and for providing its nutritional
needs. lt has been suggested that extracel lular enzymes i nvolved i n
pathogenesis include keratinases, proteinases, e lastases, peptidases,
aminopeptidases, catalases and peroxidases (Ernst, 1 989).
In contrast to M. canis, the soil inhabiting dermatophyte, M. cookei is of
little medical importance. 1t is morphologically rather simi lar to M. canis

4
and also has a world-wide distribution. Although it may be isolated from animals, clinical disease is not observed (Rees, 1 967). Even though tinea
corporis caused by M. cookei has been reported in humans (Frey, 1 971 ),
the fungus must be considered a non-pathogen.
Accepted therapeutic measures alone do not appear to have altered mate rial ly the frequency and course of M. canis i nfect ion i n m ost com m un it ies . A n i ncrease i n our knowledge of the biolog ical and biochemical properties of a pathogen compared to a nonpathogen could suggest ways of controlling and treating infections. The relatively small
number of effective antifungal agents reflects to a large extent the fact
that many aspects of fungal physiology and viru lence are not wel l unde rstood ( E rn st , 1 989) . The dete rm inat ion of re lative sizes and
numbers of, for example, proteinases expressed could suggest possible mechanisms of pathogenicity i nvolving certain of the e nzymes and t h e refore ways of maki ng d rugs and/or vacci nes for contro l l i ng dermatophyte pathogens.
The main purpose of the work to be reported in this thesis was to study and compare aspects of the ecology and biochemical variabil ity of M.
canis, a pathogen and M. cookei, a nonpathogen and to i nvestigate certain e nzymes produced by these fungi e.g. kerati nases, proteinases
and e lastases which have been impl icated i n the pathogenesis of disease. Furthermore , genetic studies of these species are practically non existent. The genetics of the group is not well characterised and
there is a lack of suitable methods and scoreable markers for assaying
variability in natural populations. Thus an investigation of enzyme marker systems, especial ly for enzymes implicated in pathogenicity, could be
useful in determJning phenotypic or genetic relationships among strains.

CHAPTER 1
INTRODUCTION - LITERATURE REVIEW
1 .1 DERMATOPHYTES.
In culture dermatophyte morphology, for purposes of nomenclature, can be divided i nto two states on the basis of stage in the life cycle, the anamorphic and the te leomorphic states. The anamorph is the state
where asexual o r so matic reproduction occurs and has a disti nct m o rphology . The te leomorph , on the othe r hand, i s t h e sexual ly
reproductive ("perfect") state, morpholog ically (and/or karyo logically)
d ifferentiated from the anamorph (De Vroey and Hennebert, 1 982) . A
workab le c lass i ficat ion of de rmatophytes i s best bas e d on the macroscopic and microscopic morphology of the asexual state in culture and the E m mons ( 1 934) classificat ion syste m emphasises t hese
characteristics.
1 .1 .1 The Anamorphic States - Classification and Identification.
The microscopic appearance of the various species shows a range of
vegetative structures and spores (conidia) . v iz . , larg e m u lt iseptate
macroconidia, s ingle-celled microconidia with typical a rrangement on hyphae, ch lamydospores, spirals, antler-shaped hyphae (chandeliers) ,
nodular organs, pectinate organs and racquet hyphae (Emmons, 1 934; Ajello, 1 966) (Fig. 1 -1 ).

6
Fig.1-1 : Principal microscopic structures used· in identifying dematophyte species.

macroconidia of Microsporum
macroconidia of Epidermophyton
microconidia in grape-like bunches (en grappe)
macroconidia of Trichophyton
microconidia along sides of vegetative hyphae

7
In additi on, some physio log ical characte rist ics based on nutritional requirements (Stockdale , 1 953a, 1 953b ; G eorg and Camp, 1 957a ; Phi lpot, 1 977b; Ajello, 1 966), such as vitamin deficiency can be used to
help to identify some dermatophytes.
Most dermatophyte colonies develop forms and pigmentation which can allow a presumptive identification of that dermatophyte species. Colony appearance of a fungus depe nds o n t h e med ium used b u t fo r comparative purposes, Sabouraud dextrose agar (SDA) mediu m i s conventionally used to obtain colonies which can be compared to others
reported in the literature (Ajello, 1 966).
Aje l lo (1 966) l ists five important co lony characteristics to look for i n presumptive identification of a dermatophyte cu lture when it i s one to
three weeks old :
1 . rate of growth
2. general topography (flat, heaped, regularly or i rregularly folded)
3. texture (yeast-like, glabrous, powdery, granular, velvety or cottony)
4. surface pigmentation
5. reverse pigmentation
Based on the above crite ria, particu larly on differences i n con id ia l morphology, dermatophyte species can be classified into three genera
within the Fungi Imperfecti (or Deuteromycotina) namely; Epidermophyton, Microsporum, and Trichophyton (Emmons, 1 934). The studies of Cole and Samson (1 979) have shown that the ontogeny of the holothallic con idia of Microsporum and Trichophyton is essentially the
same. Their on ly difference is the macroconidial cell-wall thickness and
presence of ech inulations in Microsporum species which are absent in
Trichophyton species (Ajello,l977; McGinnis, 1 980).
However, there has been some controversy i n the broad classification of some dermatophytes. Benedek ( 1 948) fe lt that the genus Achorion should have been retained by Emmons (1 934) as was Epidermophyton

8
simply because of its "established usage" and that Emmon's proposal
cannot be considered a natural classification. The system proposed by Vanbreuseghem (1 977) and Vanbreuseghem et al. , (1 978), distinguished
the genera Epidermophyton, Microsporum, Trichophyton, Microides and Keratinomyces. Aje l lo ( 1 982) rejected Van b reuseg hem's g e nus Microides based on the similarity in morphology of M. interdigitalis to T.
mentagrophytes. He proposed that M. interdigitalis should be considered as a variety of T. mentagrophytes, to be known as T. mentagrophytes
var. interdigitale. (Em mons (1 934) considered T. interdigitale to be a
synonym of T. mentagrophytes).
One particularly controversial genus is Keratinomyces. This genus, with
its species K. ajelloi, was established by Vanbreuseghem (1 952b) but was modified by Ajello in 1 968 to T. ajelloi due to the earlier inadequate
treatment of the genus by not providing essential facts that differentiate
Keratinomyces from the genus Trichophyton. An important reason for the t ransfer was the observat ion that K. ajelloi appare ntly p roduces microconidia (Georg et al. , 1959b). The transfer was further supported by the fact that K. ajelloi produced cleistothecia of the genus Arthroderma (d i scussed u n d e r Sect ion 1 . 1 .4) , i n wh ich the se xual states of
Trichophyton were classified (Dawson and Gentles, 1 961 ) .
However, antigenic studies have shown that T. ajelloi has little simi larity to Trichophyton species, emphasing the need to retain its o rig i nal designation. Addit ional ly K. ajelloi has th ick smooth cell walls whi le
Trichophyton spec ie s have t h i n wa l l s (Vanbreuseg hem, 1 952b ; Vanbreuseghem, 1 977; Vanbreuseghem et al. , 1 978; Mackenzie, 1 988).
There are also disagreements of the species concept in certain groups,
for example, Vanbreuseghem et al. , ( 1 978) separated Microsporum langeroni (Vanbreuseg hem, 1 951 ) and M. rivalieri (Vanbre useghem,
1 963a) from the classic M. audouinii Gruby, 1 843, a move which has not been favoured by several American and European workers.

9
The principal classification systems of dermatophytes, compared to that
of Sabouraud is presented below in Table 1 - 1 .
Tab le 1 -1 : Classification of dermatophytes.
Sabouraud
1 . Epidermophyton Lang, 1 879
2. Microsporum Gruby, 1 843
3. Achorion Remak, 1 845
4. Trichophyton
Malmsten, 1 845 .endothrix
.ectothrix megaspore
.ectothrix micro ides
5. Unknown
Vanbreuseghem et al.
Epidermophyton
Microsporum
(+Achorion gypseum) Trichophyton
(-A. gypseum)
Trichophyton
Trichophyton
Microides,
Keratinomyces
Em mons, Ajello et al.
Epidermophyton
Microsporum
(+A gypseum) Trichophyton
(-A. gypseum)
Trichophyton
Trichophyton
Trichophyton
Trichophyton
(- = excluding A. gypseum; + = i ncluding A. gypseum) Modified from Vanbreuseghem et al. , 1 978
B es ides t h e t raditional mycological criteria of identification , other tech n iques appl ied more recently have been based on analysis of
s e ro logical a nt ig ens ( Ph i l pot , 1 978b) , com parison of DNA base
compositions (Davidson et al. , 1 980 ; Davidson and Mackenzie, 1 984), fatty acid composition (Jones and Noble, 1 981 ) and enzyme isoelectric focusing (Jeffries, 1 982; Jeffries et al. , 1 984). Such studies and others have supported the differentiation of morphologically and physiologically s im i lar species e .g . M. canis, M. equinum and M. distortum and T.
kuryangei and T. megninii (Jeffr ies, 1 982 ; Jeffr ies et al. , 1 984) .
Radiolabelled DNA hybridization techniques e mployed by Davidson and
M acke nz ie ( 1 9 84) as· a taxono m ic too l , su pported t h e p re s e nt

1 0
mycological grouping of dermatophytes based on the limited number of species examined.
Additional recent developments include the use of electrophoretic protein patterns (discussed under Section 1 .8.2) used in the study of M. canis and reported to be able to distinguish between genetically similar strains of M. canis (Tucker and Noble, 1 992) . Also, Mochizuki et al., ( 1 990) used
m itochondrial DNA restrict ion analysis to investigate the taxonomical relationship between T. interdigitale ( T. mentagrophytes var. interdigitale)
and other members of the T. mentagrophytes complex (discussed under
Section 1 . 1 .4).
1 .1 .2 Current Concepts of the Anamorphic State.
On the basis of anamorph morphology, 2 species of Epidermophyton,
approximately 1 8 species of Microsporum (Table 1 -2) and 25 species of Trichophyton (Table 1 -3) are considered valid members of these genera
The main features distinguishing the three dermatophyte genera are :
Epidermophyton
The genus is characterised by large macroconidia which are thin-walled, multicellular, club-shaped and clustered in bunches. Microco nidia are not produced. The g enus'
features are based on E.floccosum (Emmons, 1 934).
Microsporum
The genus produces both micro- and macroconidia.
Macroconidia are multiseptate, with a thin or thick
echi nu late ce l l wall (Krempi-Lamprecht, 1 986) , spindle
shaped and may be numerous or scarce. However, the e ssential d ist i ng u ish i ng feature of th i s g e n u s is the
echinulations of the macroconidial cell wall. The thickness
of the ce l l wal l and shape varies dependi n g o n the species. Microconidia are pyriform, about 2-3J.1m. The type
species is M.audouinii Gruby, 1 843.

1 1
Table 1 -2: The principal members of the genera Epidermophyton and Microsporum.
Epidermophyton Sabouraud, 1 91 0
E. noccosum (Harz, 1 870) Langeron & Milochevitch, 1 930
E. stockdaleae Prochacki
& Englehardt-Zasada, 1 97 4
Microsporum Gruby, 1 843
M. amazonicum Moraes, Borelli
& Feo, 1 967 M. audouinii Gruby, 1 843 M. boul/ardii Dominik & Majchrowicz, 1 965
M. canis Bodin, 1 902 M. cookei Ajello, 1 959 M. equinum (Bodin , 1 898) Guegen, 1 904 M. distortum Di Menna & Marples, 1 954
M. ferrugineum Ota, 1 921
M. fulvum Uriburu, 1 909 M. gallinae (Megnin, 1 881 ) Grigorakis, 1 929 M. gypseum (Bodin , 1 907)
Guiart & Grigorakis, 1 928
M. magellanicum Coretta & Piontelli, 1 977
M. nanum Fuentes, 1 956 M. persicolor (Sabouraud
1 91 0) Guiart & Grigorakis, 1 928 M. praecox Rivalieri , 1 954
M. racemosum
Borelli , 1 965
M. ripariae Hubalek & Rush-Munro , 1 973
M. vanbreuseghemii Georg, Ajello, Friedman
& Brinkman, 1 962
Modified from Ajello (1 968, 1 974), Vanbreuseghem et al. (1 978),
Howard (1 983) and Rippon (1 985)
Trichophyton
This genus produces smooth wal led macroconidia and
microconidia. Macroconidia are thi n walled and cigarshaped. Microconidia may be pyriform 2-3�m or irregular
in form. Some species rarely produce macroconidia. The
type species is T.tonsurans Malmsten, 1 845.

Table 1 -3: Members of the genus Trichophyton+ (Malmsten, 1 845).
T. ajelloi (Vanbreuseghem, 1 952)
Ajello, 1 968 T. concentricum Blanchard, 1 895
T. equinum (Matruchot & Dassonvile, 1 898) Gedoelst, 1 902 T. flavesens Padhye
& Carmichael 1 971 T. georgiae Varsavsky
& Ajello 1 964 T. gloriae Ajello, 1 967a T. gourvilii Catanei, 1 933 T. longifusus (Fiorian
& Galgoczy, 1 964) Ajello, 1 968 T. mariatti Ajello & Cheng,
1 967 T. megninii Blanchard, 1 896 T. mentagrophytes (Robin,
1 853) Blanchard, 1 896
var. interdigitale
Priestley, 1 91 7
var. erinacei Smith
& Marples, 1 963
var. quinckeanum (Zopf,-?)
Macleod & Muende, 1 940
T. phaseoliforme Borelli
& Feo, 1 966
T. rubrum (Castellani,
1 91 0) Sabouraud, 1 91 1 T. schoenleinii (Lebert,
1 845) Langeroni & Milochevitch, 1 930
T. simii (Pinoy, 1 91 2)
Stockdale, Mackenzie
& Austwick, 1 965 · T. soudanense Joyeux, 1 91 2 T. terrestre Ourie & Frey, 1 957
T. tonsurans Malmsten,
1 845 T. vanbreuseghemii
Rioux, Jarry & Juminer, 1 964 T. verrucosum Bodin,
1 902
T. violaceum Bodin,
1 902
T. yaoundei Cochet & Doby-Dubois, 1 957
1 2
+ Various authors differ in their treatment of certain of the species.
Modified from Ajello (1 968, 1 974), Vanbreuseghem et al. (1 978), Howard
( 1 983) and Rippon (1 985)

1 3
1 .1 .3 M. canis and M. cookei.
The species selected for the present comparative investigations were the two most frequently encountered Microsporum species, M. canis, a very
com mon zoophi l ic and pathogenic dermatophyte and M. cookei, a common geophi lic, non-pathogenic, dermatophyte.
Colonies on SDA and Microscopic Characteristics.
M. canis grows fai rly rapidly, producing a cottony fluffy mycel ium with bright ye llow pigment in the peripheral growth (Fig.1 -2). The reverse is golden yellow (Fig. 1 -3), which is very characteristic for M. canis.
Macrocon id ia are many , large and t h ic k wal led , sp ind le -shaped
terminating in a distinct knob and echinulated (Fig . 1 -4), 8-20x40-1 50J.Lm, with 2-1 5 septa. Microconidia normally scarce, clavate, sessi le or borne on short pedicels laterally on the hyphae.
M. cookei grows rapidly and is flat and spreading, with a powdery surface which is buff or dark tan (Fig.1 -5). The reverse is deep red-brown (Fig. 1 -6).
Macroconidia are oval to el l ipsoidal , thick walled and echinulated, 1 0-
1 5x31 -50J.Lm with 2-8 septa. Microconid ia are obvate and produced abundantly (Fig . 1 -7).

1 4
Plate 1 -1 : Colony of M. canis on SDA with fluffy g rowth after 2 weeks at
25°C.
Plate 1 -2: Reverse with golden yellow pigmentation.
Plate 1-3: M. canis Spindle shaped, echinulated and pointed
macroconidia, and microconidia (magnification x400).


1 5
P late 1 -4: Colony of M. cookei on SDA with granular texture after two weeks at 25°C.
P late 1 -5: Reverse with deep red-brown pigmentation.
Plate 1 -6 : M. cookei Spindle shaped, echinulated and less pointed
macroconidia and numerous microconidia (magnification x400).


1 6
1 .1 .4 The Teleomorphic States.
The existence of a sexual phase i n the growth cycle of dermatophytes
was first reported by Nannizzi in 1 927. He described the perfect stage of a strain of Microsporum (Sabouraudites) gypseum (Bodin) Guiart and
Grigorakis, 1 928, when he obtained cleistothecia with ascospores by cu ltivating M. gypseum on soil baited with feathers (Griffin, 1 960b; de
Vries, 1 962). He named the fungus Gymnoascus gypseus (Griffin, 1 960c;
Howard, 1 983). His work was discredited by Langeron and Milochevitch (1 930) and other workers in the field on the grounds that the soil and
feathers used were not steri l ised. However, Nannizzi's work was later confi rmed by Griffin (1 960a, 1 960c) and Stockdale (1 961 ) and at the
sametime Dawson and Gentles (1 961 ) demonstrated the existence of a sexual stage of Trichophyton terrestre Durie and Frey, which they named Arthroderma quadrifidum.
Since then the perfect states of a number of dermatophytes have been discovered and this has resulted in some changes to the classification of these fungi (Ajello, 1 97 4, 1 977; Vanbreuseghem, 1 977; Takashio, 1 979). All are members of the subdivision Ascomycotina which includes all fungi that after nuclear fusion and chromosomal reduction, proceed to form
asci and ascospores. They belong to the Class Plectomycetes, Order
Onygenales of Alexopoulos and Mims, 1 979.
The production of asci occurs i nside an ascocarp (cleistothecium or gymnothecium, as proposed by Padhye and Carmichael, 1 971 ). The wall (peridium) of the cleistothecium is composed of loosely interwoven, thin
wal led, l ight coloured hyphae , which is characteristic of the fam i ly
Gymnoascaceae.
I n the genus Arthroderma Berkeley, 1 860 the outer cells of the
peridial hyphae are short and markedly swollen at each
end, appearing constricted in the middle. The swel l ing may be symmetrical or mostly on the outward side of the
curved hyphae . The swe l l i ngs are th ick-wal led and markedly spiny, while the short i ntervening constricted
portion is thin walled, smooth and inconspicuous (Padhye
and Carmichael, 1 971 ).

The second genus Nannizzia (Stockdale, 1 961 ) is characterised by
the peridial hyphae being branched in a verticil late manner
and composed of thick-walled, aseptate, hyaline cells with
o n e o r m o re sym metr ical co n st rict ions . T h e re are n u merous free ends and various appendages - ri ng , st raig ht o r loosely co i l ed hyphae and spiral hyphae (Stockdale, 1 961 ) .
1 7
lt has been proposed that the two genera should be unifi ed into one g e n u s : Arthroderma Berke ley, 1 860 because the m o rp h o log ical
differences are not significant to warrant a new genus (Vanbreuseghem
et al. , 1 978; Weitman et al. , 1 986). But Stockdale ( 1 961 ) had argued that
the branching pattern of Arthroderma is consistently dichotomous and never verticil late while Nannizzia is commonly vertici l late, sometimes dichotomous and rare ly unci nate. Stockdale ( 1 961 ) considers these differences of generic significance while McGinnis (1 980) and Weitzman et al. ( 1 986) regard them as of l itt le sig nificance. Another important difference which McGinnis ( 1 980) and Weitman et al. ( 1 986) overlook is the fact that cross-mating between the two genera has never been
reported to occur.
Mating studies have led to the discovery of the perfect states of a number
of dermatophyte species. Some of the anamorphic states have been
found to represent a complex of species, e .g. the M. gypseum-fulvum complex, the T. terrestre complex and the T. mentagrophytes complex.
The M. gypseum-fulvum complex represents three sexual dermatophyte species, namely, Nannizzia incurvata (Stockdale, 1 961 ), N. gypsea and N. fulva (Stockdale, 1 963).
S im i larly , the T. terrestre complex repre sents three sexual states, Arthroderma quadrifidum, A. insingulare, and A. lenticularum (Padhye and Carmichael , 1 968, 1 972). Both A. quadrifidum and A. insingulare have been iso lated from soi l , animal hai r and feathers as T. terrestre
(Marples and Smith, 1 962b; Marples, 1 965; Beneke and Rogers, 1 980).
The T. mentagrophytes complex represents two sexual dermatophyte
species , Arthroderma vanbreuseghemii (Takashio, 1 973b) and A.

1 8
benhamia e (Aj e l l o and C h e n g , 1 967 ) . T. mentagrophytes var.
interdigitale, one of the most prevalent species and of great public health importance, is an i mperfect species rese mbling morphologically the
con idial state of A. vanbreuseghemii. Mitocho ndrial D NA restrict ion enzyme mapping has shown that the restriction profi les of strains of T. mentagrophytes var. interdigitale and A. vanbreuseghemii are identical (Mochizuki, et al. , 1 990), reinforcing a l inkage of the two species, as postulated from its morphology (Watanabe and Hironaga, 1 98 1 ). T. mentagrophytes var. interdigitale is therefore considered a member of
the T. mentagrophytes complex.
Takashio ( 1 973a, 1 973b, 1 974, 1 977, 1 979) and Vanbreuseghem and
Takashio ( 1 981 ) have suggested that the species A. benhamiae can be
divided into two races, one Americana-European and one African, with two varieties, var. caviae and var. erinacei respectively. The variety
erinacei has two mating types : the "+" corresponding to T. erinacei
(Padhye and Carmichael, 1 968) or T. mentagrophytes var. erinacei (Smith and Marples, 1 963). The "-" species was isolated from the African hedgehog (Collinge et al., 1 974) . A. benhamiae var. caviae has only the
"-" mating type.
To date, 1 1 conidial species of Trichophyton (Arthroderma, Table 1 -4) and 1 0 species of Microsporum (Nannizzia, Table 1 -5) are known to
reproduce sexually (De Vroey, personal communication).

Table 1-4: Trichophyton species with a known teleomorphic
state.
Teleomorph
· Arthroderma Berkeley, 1 860
A. curreyi Berkeley, 1 860
A. tuberculatum Kuehn, 1 960 A. benhamiae Ajello
& Cheng, 1 967 A. ciferrii Varsavsky
& Ajello, 1 964
A. flavescens Rees, 1 967 A. gertleri Bohme, 1 967 A. gloriae Ajello, 1 967a A. insingulare Padhye
& Carmichael , 1 972
A. lenticularum Pore, Tsao
& Plunkett, 1 965 A. quadrifidum Dawson
& Gentles, 1 961
A. simii Stockdale, Mackenzie
& Austwick, 1 965 A. uncinatum Dawson
& Gentles, 1 961
A. vanbreuseghemii
Takashio, 1 973
Anamorph
Trichophyton Malmsten, 1 845 Not named
Not named
T. mentagrophytes var. mentagrophytes T. georgiae
T. flavescens
T. vanbreuseghemii T. gloriae T. terrestre
T. terrestre
T. terrestre
T. simii
T. (K.) ajelloi
T. mentagrophytes
var. interdigitale
(some)
1 9
Modified from Ajello (1 968, 1 974), Vanbreuseghem et al. (1 978), Howard ( 1 983) and De Vroey (personal communication).

Table 1 -5: Microsporum species with a known teleomorphic state.
Teleomorph
Nannizzia Stockdale, 1 961
N. borellii Padhye & Ajello, 1 975 N. cajetani Ajello, 1 961
N. fulva Stockdale, 1 963 N. grubyia Georg, Ajello,
Friedman & Brinkman, 1 962 N. gypsea Stockdale, 1 963 N. incurvata Stockdale, 1 961 N. obtusa Dawson & Gentles, 1 961
N. otae Hasegawa & Usui, 1 975
N. persicolor Stockdale, 1 967
N. racemosa Rush-Munro, Smith
& Borelli, 1 970 N. corniculata Takashio & De Vroey,
1 982 N. cookie/la De Clercq, 1 983
Anamorph
Microsporum Gruby,
1 843 M. amazonicum M. cookei
M. fulvum
M. vanbreuseghemii
M. gypseum M. gypseum M. nanum
M. canis
M. persicolor
M. racemosum
M. boullardii
not named
20
Modified from Ajel lo ( 1 968, 1 974) , Vanbreuseghem et al. ( 1 978),
Howard (1 983), De Vroey (personal communication).

21
1 .1 .4.1 Techniques for Mating Studies.
All dermatophyte species with a known sexual stage are heterothallic.
Matings of compatible strains of the same dermatophyte species are able to produce ascocarps containing ascospores which usually develop in
approximately one month. The appropriate in vitro techniques have made
the identification of dermatophytes more accurate and reliable (Rebell
and Taplin, 1 978).
I n the early stud ies on sexual reproduct ion in dermatophytes the substrata used was either sterilised or unsterilised soil with keratin, such as hair or feathers sprinkled on top (Stockdale, 1 981 ). Dawson et al.
( 1 964) studyi ng species of Arthroderma and Nannizzia, found that steri lised soi l was unsatisfactory, whi le unsteri l ised soil spri nkled with
horse mane or tai l ha i r is ve ry sat isfactory i n sti mu lat ing sexual
reproduction among the dermatophytes. Human hair was found to be a
poor keratin bait in mating studies.
Although one can obtain cleistothecia of dermatophytes on soil, it is not a satisfactory medium for mating studies because the keratin becomes colonised by hyphae, making i t difficult to observe the reaction between t h e two colo n i e s . Mat ing i s i n h i b i ted on m edia co ntai n i ng h ig h
concentrations of nutrients supporting good vegetative g rowth (Davidson and Unestam, 1 974). De Vroey (1 964) devised a niger-seed medium
which supported cleistothecium formation by M. gypseum. Weitzman and Silva-Hunter (1 967a) formulated an oatmeal agar with salts and with or without tomato paste, of the following composition: MgS04.7H20 1 g ,
KH2P04 O .Sg , NaN03 1 g , Baby oatmeal 1 0g , agar 1 0g i n 1 000ml
distilled water. Takashio (1 969, 1 970, 1 973a) used a di luted Sabouraud's
dextrose agar with salts: dext rose 2g, neopeptone (or peptone) 1 g, MgS04. 7H20 1 g , KH2P04 1 g , agar 20g in 1 OOOm l d ist i l led water. Another medium used for mating studies is that of Takashio ·et al. ( 1 976) composed of ground Guizzotia abyssinica seeds 7.5g, MgS04.7H2o 1 g, KH2P04 1g , agar 20g in 1 000ml distilled water.
The fi rst observation of "sexual stimulation" as opposed to true mating
betwee n d i fferent dermatophyte s pecies was made fo l lowing the
· discovery of A. simii, the perfect state of T. simii (Stockdale et al. , 1 968). ·

22
A mating type can be revealed by the proliferation of white fluffy hyphae, often with the formation of ascocarp initials, which occur when a different
dermatophyte species of unknown mati ng type makes contact with A.
simii of t he opposite mat ing type (Rebe l l and Tapl i n , 1 978) . This tech nique has significantly increased our abi lity to determine mating
types.
Difficulties in obtaining perfect states may be due to the predominance or
existence of on ly one mati ng type, (the o n ly exception is A. curreyi Berkeley ( 1 860) in which only the sexual form is isolated). Alternatively, the tester strains ("+" and "-") may be in an unfavourable state, since
reactivity decreases after mai ntenance on conventional media. The
mating of opposite strains must be carried out on a medium favourable
for mating. Other environmental factors such as temperature must also be taken into account for each species (Dawson et al. , 1 964).
Once fertile cleistothecia have been obtained, single ascospore culturing can be p e rformed especia l ly for fu rt he·r mat i ng stud ies and for
taxonomical purposes (Weitzman et a/, 1 964a, 1 964b; Takashio, 1 981 ) .
Dermatophyte colonies started from sing le spores produce a uniform and consistent appearance which is important for identification (Ajel lo, 1 966) and the technique can also be used to rejuvenate degenerating sexual
strains (Takashio, 1 981 ).
To obtain ascospores from an ascus, the standard technique has been the use of a dissecti ng De Fonbrune micromanipu lator (Weitzman ,
1 964a, 1 964b; Rebell and Taplin, 1 978). Another technique is a manual
method i ntroduced by Weitzman (1 964a) which employs a fine needle to
isolate a mature cleistothecium, after fi rst rol ling it on a 4% solid agar surface to remove conidia, soil particles or hair depending on the medium
used for mating. The cleaned cleistotheciu.m can be transferred to a second agar plate where it is crushed i n a loopful of sterile water. Mature ascospores as determined by microscopic examination are subcultured
before or after germination (Re bell and Taplin, 1 978).

23
1 .2 ECOLOGICAL GROUPINGS AND SOURCES OF INFECTION.
The dermatophytes have been divided by Georg ( 1 959) i nto th ree ecological groups: geophiles, zoophiles and anth ropophi les. P robably
some of these fungal pathogens in evolving from their natural habitat in the soil, have developed host specificity, resulting in these three g roups.
Individual dermatophytes differ considerably in thei r host range and importance as agents of disease in man and animals. The differences in host specificity has been attributed to the differences in keratin of the hosts (Rippon, 1 982).
Geophi les are primari ly soil-inhabiting and only rarely encountered as agents of ringworm, with the exception of M. gypseum.
Zoophiles are essentially animal pathogens, although they may cause infection in humans.
Anthropophiles are restricted to man, very rarely infecting animals.
1 .2.1 Geophiles
Geophi les exist as saprophytes i n the soi l and have the abi l ity to
compet i t ive ly co l o n ise kerat inous s ubst rates successfu l ly . The i r d istribut ion appears to re late to the dist ribution o f avai lable keratin
(Marples, 1 965; Mantovani, 1 978; De Vroey, 1 984). But the distribution is
also inf luenced by the pH of the soil and generally they prefer a near
neutral pH (Bohme and Ziegler, 1 969).
A few geophi les do have the additional capacity to cause ringworm in some s pecies of animals, including man. These dermatophytes are generally contracted directly from soil containing a high number of spores and are only rarely transmitted from man to man or lower animals to man (Ajello, 1 974; De Vroey, 1 984). For example, M. nanum, which causes ri ngwo rm i n an i m als , especia l ly p igs , i s main ly associated with
surroundings hav ing pigs (Baxte r, 1 969; De Vroey, 1 984; Connote, 1 990). The proof for its geophi lic existence was provided by observation
of macroconidia in soi l by Ajello et al. (1 964), since it is wel l known that these spores are not formed on infected animals.

24
But the principle vi rulent geophilic dermatophytes are members of the M.
gypseum-fulvum complex. This complex has been well documented as a
pathogen in man and animals. According to Georg (1 960), soil isolates of
M. gypseum compared to animal isolates have a low pathogenicity and
only very vi rulent strains are able to establish i nfection. Alternatively, strains of low infectivity may increase in virulence after "passage" through
a host of low resistance. Of the three dermatophyte strains, pathogenicity studies with laboratory animals have shown N. fulva to be the least pathogenic, while no notable differences have been observed with N. gypsea and N. incurvata (Weitzman et al. , 1 967b; Gordon et al. , 1 967).
The distribution of the M. gypseum-fulvum complex is world-wide (Ajello,
1 953; Londero and Ramos, 1 985; Durie and Frey, 1 962; Marples, 1 965).
The T. terrestre complex is considered to be non-pathogenic (Howard, 1 983} , although human i nfections by T. terrestre have been reported (Marples and Smith, 1 960} and experimental animal infections have also
been successfully induced (Bakerspigel, 1 974b).
Other geophi lic dermatophytes include M. cookei and T. ajelloi which are
non-pathogenic. M. cookei is a geophi le with a global distribution , often
isolated from soil and also from rodents and other animals not showing any clinical symptoms of ringworm (Ajello, 1 959}. Human infections by M.
cookei have rarely been reported (Lundell, 1 965; Frey, 1 971 } .
T. ajelloi is commonly found in colder climates but is sporadic i n hot climates (Marples, 1 965) , possibly because higher temperature inhibits
its g rowth. The fungus has been found to be more often associated with acid soi ls than with alkaline soils (Marples, 1 965}.
Other l ess common geophilic dermatophytes are included in Table 1 -6
and their distribution and pathogenicity noted in Table 1 -7.

Table 1 -6: Geophilic dermatophytes.
Microsporum amazonicum M. boullardii
M. cookei M. fulvum
M. gypseum M. nanum
M. persicolor
M. racemosum
M. ripariae M. vanbreuseghemii
Trichophyton ajelloi T. georgiae T. gloriae
T. longifusus
T. phaseoliforme
T. simii
T. terrestre
T. vanbreuseghemii
Table 1 -7: Geographical distribution of geophilic dermatophytes and
host preference.
Species Geographical distribution
M. amazonicum Brazil
Pathogenicity
none
25
M. ripariae Central Europe bird (Riparia riparia)
guinea pigs and
humans M. vanbreuseghemii
T. vanbreuseghemii M. boullardii
T. georgiae
T. gloriae T. longifusus
T. phaseoliforme
World wide?
World wide
Africa
World wide North America Europe
World wide?
Malabar squirrel, dog and humans
humans
none
none none none
none

26
Infective propagules originating from saprobic sources can be transmitted
di rectly or i ndirectly, and are referred to as saprobic-parasitic (S-P)
infections by De Vroey, 1 984, 1985. This mode of infection is com mon for M. gypseum, where the source of most infections in man and animals is the soil (Ajello et al. , 1 966). In chi ldren facial ringworm by M. gypseum can follow recreational exposure to soi l-born propagules of this fungus
(De Vroey, 1 985). Occupational exposure is i l lustrated by reported cases
i n gardeners (De Vroey, 1 985) and small epidemics observed in , for example, cucumber growers (Aisop and Prior, 1 961 ; Gentles, 1 962). The
m acro- and m icrocon idia, ascospores and other propagu l e s are produced during the saprophytic growth of dermatophytes on keratin in soil or other biotopes (e.g. birds nests in the case of M. ripariae) (De
Vroey, 1 984) and it is these which form the potential inoculum.
1 .2.2 Zoophiles Zoophi l ic species are basically animal pathogens, often with a si ngle preferred animal host or very limited host range, outside which they are
found i n e xcept iona l c i rcumstances ( E n g l i s h , 1 972 ) . Zoo p h i l ic dermatophytes rare ly g row active ly as saprophytes but survive i n a
dormant state on contaminated materials of animal origin.
M. canis, T. venvcosum and T. mentagrophytes are common agents of
ringworm in animals but are also frequent ly associated with human i nfection. The amount of literature on human infections due to the three dermatophytes is enough evidence of their human affinity. Of the three,
M. canis is the best documented (e.g . Marples, 1 956 ; Klokke and de Vries, 1 963; Gentles et al. , 1 965; Baxter, 1 973). This is mainly because it
causes a lot of scalp ringworm in chi ldren (English, 1 972) . M. canis
commonly infects pet animals and especially cats and dogs which shed i nfective particles i nto the domestic e nvironment and contact with this resu lts in fami l ia l i nfections (De Vroey, 1 985) . Li ke other types of
ringworm, young children particularly in the age range 5 - 1 4 years are more susceptible to infection than adults. Similarly, kittens and puppies are more susceptible to ringworm than adult animals (Philpot, 1 9na). M. canis i s also known to cause ringworm i n 'horses, monkeys, apes,
chinchillas (Vanbreuseghem et al. , 1 978).
· Another dermatophyte species closely related to M. canis is M. distortum, known to cause ringworm infections in monkeys, dogs and cats. lt has

27
been reported to occur mainly from New Zealand (di Menna and Marples,
1 954; Marples and Smith, 1 962a) , Australia and the U n ited States
(Vanbreuseghem et al. , 1 978). lt is now regarded as a variety of M.
can is.
T. verrucosum, on the other hand, is a common cause of tinea in cattle. lt
has also bee n reported in donkeys, dogs, goats, sheep and horses (Beneke and Rogers, 1 980). Close contact by man with infected animals and their fomites leads to contracting the fungus. lt is also generally accepted that in countries with cold winters where housing of the animals
is required, the incidence of T. verrucosum rises in both animals and humans at that time of the year (Eng lish, 1 972) . Cattle breeders and veterinarians, occasionally suffer from ti neas due to T. verrucosum. T.
verrucosum is main ly an agent of inflammatory skin and scalp lesions
(kerion).
Members of the T. mentagrophytes complex (with the exception of T. mentagrophytes var. interdigitale) are transmitted from wild rodents and the prevalence of human infections due to this fungus is known to be higher in rural areas where there is a reservoir of rodents e .g . North Ame rica and Europe (Georg, 1 956 ; Gent les and O'Su l l ivan, 1 957 ; Kaben, 1 967). T. mentagrophytes has occasionally been isolated from the soi l (Baxte r, 1 966 ; Padhye and Carmichae l , 1 968) where it can
survive for several months.
· Other i mportant zoophi lic dermatophytes are included in Table 1 -8.
Table 1 -8: Zoophi lic dermatophytes.
Microsporum canis
var. distortum
M. gallinae
M. persicolor
M. equinum
Trichophyton equinum
var equinum var autotrophicum
T. f/avescens
T. mentagrophytes
var. erinacei
var. quinckeanum var. mentagrophytes
T. verrucosum var. verrucosum

28
1 .2.3 Anthropophlles
Anthropophi lic species are primarily adapted for parasitism of man, but some species occasionally cause ringworm in animals. For example, T.
rubrum has been reported to have caused an infection in a dog (Kaplan and Gump, 1 958 ; Georg, 1 960).
Anthropophi lic dermatophytes are mai nly associated with community
J ivi ng . S ince transm ission is man to man, contract ing the disease therefore requires human contact. The spread of anthropophi les is more
common i n communities l ike schools, barracks, prisons and the family
(Philpot, 1 977a; Rippon, 1 982b). In concentrated communities, the use of faci lities such as shower-rooms and common headgear leads to rapid spread of infection.
Four of the Microsporum species, according to Vanbreuseghem, can be d i st i n g u i s h ed fro m each oth e r o n c l i n ica l , ep id e m i o log ical and mycological grounds : M. audouinii, M. langeronii, M. rivalierii and M.
ferrugineum. M. langeronii Vanbreuseghem, 1 950, 1 963a and 1 963b has
been separated from the classic M. audouinii by its geographic region
(restricted to Central Africa) and un like M. audouinii can cause tinea corporis ( ri ngworm of the glabrous skin ) and can be i nocu lated to
produce experimental lesions in guinea pigs.
Of the anthropophilic Trichophyton species T. rubrum is a very common
cause of t inea unguium, cruris, and pedis (Marples, 1 959; De Vroey,
1 985; Rippon, 1 982b, 1 985). T. rubrum very rarely invades hair in vivo.
The distribution of T. rubrum is g lobal, cutting across all populations and ethn ic g roups (Rippon , 1 985; De Vroey, 1 985). lt is a dermatophyte beco m i n g more prevalent among u rban populat ions, especially i n
developed countries, due mainly to the "modern" way of life such as the wearing of occlusive shoes, which maintain heat and humidity (Philpot,
1 977a). lt is also able to adapt to its environment in a way other species can not emu late (Eng l ish , 1 980) . I n I ndia, T. rubrum causes t inea
corporis i n women and .ti nea cru ris i n men due to the sari (worn by
. women around the waist) and the dhobie (loin cloth) worn by men, both of which are tight-fitting (Rippon, 1 982a, 1 985).

29
T. rubrum is also known to cause chronic forms of infections and it has been suggested that the amino acid composition of the perspiration may
predispose individuals to ch ronic infection . Certain amino acids are conside red as " i nduce rs" of T. rubrum infections ( Rippon 1 982a) . Pushkare nko and Pushkarenko ( 1 969) i n the i r investigations found patients with ch ronic T. rubrum had a h igher than normal content of
leucine, lysi ne, asparagine and h istidi ne i n their sweat. Rippon and Scherr (1 959) were able to induce arthroconidia formation in T. rubrum at
32°C a n d 37°C wi th a m ed i u m conta i n i ng a h i g h a m i n o acid
concentration.
T. mentagrophytes var. interdigitale, a member of the T. mentagrophytes
complex, is essentially a cause of tinea pedis and tinea cruris, and does not invade hair in vivo (De Vroey, 1 988). The infection of the skin of the
foot usually originates in the interdigital clefts, sometimes spreading to the soles and dorsum and occasionally the ankles and leg and ultimately to the toenai ls , resulting i n t inea unguium (Baxter and Rush-Munro, 1 980).
E. floccosum, the only pathogenic species in this genus is a common
cause of t inea pedis and tinea cruris (eczema marginatum of Hebrae)
affecting i nguinal areas, particularly in males, although some infections do occur in females (Vanbreuseghem et al. , 1 978; Rippon, 1 982; Baxter and Rush-Munro , 1 980; Howard, 1 983). Sometimes it is also responsible
for tinea unguium infections. But E.floccosum is not known to invade hair (Vanbreuseghem et al. , 1 978).
Anthropophilic dermatophytes of l imited geographical distribution (apart from M. audouinii var audouiniJ) are included in Table 1 -9. Humans are the common host. lt should be noted that a number of other species have been described but are of very limited distribution (Tanaka et al., 1 992).

Table 1 -9 : Anthropophi lic dermatophytes.
Epidermophyton floccosum Microsporum audouinii var. langeronii
var. rivalierii
M. ferrugineum
Trichophyton concentricum T. gourvilii
T. kuryangei T. megninii
T. mentagrophytes var. interdigitale
T. rubrum
T. schoenleinii
T. soudanense
T. tonsurans
T. violaceum
T. yaoundei
30
Anthropophi l ic dermatophytes are commonly transmitted by infective
propagules origi nating from active lesions to another i ndividual. This mode of transmission has been called the parasitic - parasitic (P-P) mode of infection by De Vroey, 1 984, 1 985. This transmission can be di rect or e lse indirect through an intermediary item such as hairbrushes, combs, c l ot h e s , t o w e l s a n d bedd i n g ( Mackenz i e , 1 96 1 ) o r e v e n f ro m
contaminated furniture or dressing rooms. In addition, transmission can
occur from carriage of pathogenic dermatophytes on "normal" human
scalps or "healthy" animals (Gentles and O'Sullivan, 1 957; Baxter, 1 973).
I n the case of "carri ers". "carriage" could be of e i ther o r both of p ropagu les derived from i nfected an i mals or propagules fro m the saprobic g rowth of the fungus (Mariat and Adan-Campos, 1 967).
The environmental occurence of dermatophytes is well documented.
I nd i rect t ransmission through the e nv i ronment for all types of tinea
i nfections can be acquired by contact with a significant inoculum. Such
t ransm i s s i o n has often bee n re p o rted t o p lay a p ro m i nent ro l e (Mackenzie , 1 961 ; Uscavage and Kral, 1 961 ; D e Vroey, 1 984; Midgley and Clayton , 1 972) . Using various i nd i rect sampl ing techn iques, a
number of authors h ave demonstrated the presence of pathogenic
31
d e rmatop hytes in t h e e n v i ro n m e nt ( e . g . G e nt le s ' "ve lvetpad" ,
Mackenzie's "hairbrush" and "gauze pad" methods and Mariat's "carpetsquare technique"). Examples of dermatophyte species isolated i nclude
M. audouinii (Friedman et al. , 1 960), T. tonsurans (Mackenzie, 1 961 ), M.
canis (Uscavage and Kral, 1 961 ; Smith, 1 982) and T. mentagrophytes (Aiteras and Lehrer, 1 980) , all of which must have been derived from fomites contaminated from active infections.

32
1 .3 SAMPLING TECHNIQUES FOR DERMATOPHVTES.
1 .3.1 The Keratin-baiting Technique.
Fungi from different ecological groups require different sampling methods and isolation techniques (Baxter and l l lston, 1 977, 1 980; Hussein, 1 987) .
Prophetically, Sabouraud ( 1 91 0) expressed an opinion that the soil may represent a continuous and i nexhaustible reservoir of dermatophytes
bei ng a natu ral habitat for their saprophytic l ife. The early fai lure to
recognise the existence of soil keratinophilic fungi was due to a lack of an
isolation technique fo r these fungi. The introduction of the hai rbait ing tech n ique by Vanbreuseg hem in 1 952 led the way to many othe r investigations. The technique has firmly established the source of some
i nfect ions, but on ly for some dermatophytes, such as those by M.
gypseum (Gentles, 1 962).
Vanb reuseghem's method was essentially ·that which Nannizzi used
when he reported the discovery of a sexual stage of Microsporum gypseum i n 1 927 (Gentles, 1 962). The technique has now become a standard method for isolation of keratinophi lic fungi from the soil (Durie
and Frey, 1 957 ; Aje l lo , 1 959 ; Marp les, 1 965; Chmel et al. , 1 972 ;
Bakerspigel, 1 974b; Caretta et al. , 1 990).
Chmel (1 972) considers fungi such as dermatophytes to have started as ·
sapro phytes o n dead decayi ng parts o f p lants o r oth e r o rgan ic substances . L itte r, t he refore, was and is the mai n res e rvo i r for
keratinophilic fungi. Gordon ( 1 953) demonstrated by di rect visualisation that M. gypseum existed in the soil in the form of spores (macroconidia}. The same has also been demonstrated for M. nanum (Ajello et al. , 1 964), M. cookei, T. .ajelloi and T. te"estre (Usunov, 1 966) .
Soil litter according to Satchel! ( 1 974) is composed of dead plant material unattached to a l iving plant and of animal "manures" which may be present on the soil surface. This definition includes organic m aterial originating from plants or animals, such as leaves, branches, animal hair,
feathers, feacal material or dead tissue.

33
Since fungal communities exist in different forms in the environment, and
because of the wide range of litter components, different methods for
sampling and processing of the soil for different fungal groups are used.
The aim of an investigation and the type of litter are important i n the choice of sampl i ng procedures. In the case of kerat inophi l ic fungi , surface sam pl ing seems to be prefe rred. Some investigators before collecting the soil removed the top layer and then representative samples
were scooped from the lower layers of soil (Chmel et al. , 1 972; Lee , 1 979). Marples (1 965) collected the surface soils while Roy et al. (1 972)
collected from the top 1 Omm layer.
Sub-sampling may be necessary as it may not be possible to process the
entire sample. The size of the sub-sample is variable , as there is no
recommended standard amount or method. This may further reduce the chances of isolating keratinophi lic fungi from the soi l . Marples ( 1 965)
used soi l sub-samples of approxi mately 50g per Petri d ish without replications, but most authors do not give an indication of the quantity of soi l used (Orr, 1 969; Chmel et al. , 1 972; Ajeilo and Alpert, 1 972; Chmel et al. , 1 972; Roy et al. , 1 972; Carreta, 1 990).
The soil is usually processed on the day of collection, but some workers
have stored their samples at a temperature of 0-4°C for varying periods. Some have ref rige rated the i r samples at -20°C, argu ing that ce l l
multiplication wi l l be slowed down. However, very few studies have been conducted on the effect of low temperatu res on the death rate of soi l
m icroorgan isms (Parki nson et al. , 1 97 1 ) . Sti l l other workers have attempted to keep their samples at the same temperature at which they
were sampled, but this poses practical difficulties.
At present there is no clear-cut information on a permissible storage time
fo r d i ffe rent so i ls , but accordi ng to Parkinson et al. ( 1 971 ) , " most
investigators tend to have a practical outlook on this problem". Somerville and Marples ( 1 967) stored unenriched soil samples in plastic bags at
laboratory temperature for 1 1 months before reprocessing. They found that storage alone did not significantly affect recovery rate at least of M. gypseum.
Marples ( 1 965} processed soil samples immediately following collection.
But Some rv i l le and Marp les ( 1 967) , i nvestigat ing an e n richment

34
technique in which steri lised cowhorn was incorporated with the bulk soil
sample, stored their enriched samples for 1 4 days before processing to isolate keratinophi lic fungi . They found that this selectively increased subsequent recovery of M. gypseum compared to the controls originati ng
from the same sampling sites that were processed immediately.
Rebel l and Tapl in (1 978) consider the enrichment technique probably
favours some keratinophi l ic fungi more than others and can therefore lead to a false impression of the balance of keratinophi l ic fungi initial ly
present in the soil.
Bakerspige l (1 953) found that many fungi remain viable in sterilised soil
for 1 to 4 years. Loam soil was the most satisfactory and was far superior to Sabouraud's agar for storage of some fungi e.g. E. floccosum.
Whi le the technique for the isolation of keratinophi lic fungi has remained largely the same, there are variations in the use of the baiting material. Chicken feathers, sheep's wool (Baxter, 1 969), human hai r (Marples,
1 965; Ajel lo et al. , 1 966) , horse hair (Somervil le and Marples, 1 967;
Chmel et al. , 1 972; Bakerspigel, 1 974), hedgehog quill , guinea pig hair (Marples, 1 965; Somervil le and Marples, 1 967) or a mixture of human and horse hair and chicken feathers (Carreta et al. , 1 990) have all been
used. According to Otcenasek (1 978), differences in host specificity in spontaneous i nfections may be due to differences in the affinity of the
dermatophytes for the various kinds of keratin. Keratin substances in the
feathers of bi rds and hair of animals are known to be different in their
biochemical composition , e.g. in their content of nicotinic acid, cystine,
arg inine, and tryptophane (Bogaty, 1 969). The classical work of Georg and Camp ( 1 957a) , e xpanded by Ph i lpot (1 977b) and Shadomy and
Ph i lpot ( 1 980) a lso demonstrated that some dermatophytes of the
Trichophyton and Microsporum ge n e ra have specif ic n utr it i o nal requirements. Whether differences in affinity for keratin bait "in vitro" is
related to p refe rential stimulat ion of d ermatophytes with a specific nutritional requirement present in the type of hair provided is not known.

35
1 .3.2 The Hairbrush Technique.
Sampling of animal coats which may carry kerati nophi lic fungi is usual ly based on a modificat ion of Mackenzie 's ( 1 96 1 , 1 963) " hai rbrush
technique". This technique has been used for studying the carrier state of both an i mals and humans for kerati noph i l ic fungi ( Rosenthal and Wapnick, 1 963; Connole, 1 965; lve , 1 966; Midgley and Clayton, 1 972; Yamamoto and Kagawa, 1 986).
The animals are brushed over the back, shou lders, sides, hindquarters
and legs and the brushes transported to the laboratory in brown paper (Connole, 1 965) or plastic bags (Baxter, 1 973; Katoh et al. , 1 990). The
brushes are pressed into a suitable medium.
Gent les et al. ( 1 965) , Baxter ( 1 973) and Katoh et al. ( 1 990) have successfully used the technique for isolation of keratinophi lic fungi from
cats and dogs. After use the brushes are sterilised in 0. 1 % chlorhexidine
("Hibitane") solution. Connole ( 1 965) i m mersed the brushes for 30 minutes while Baxter (1 973) immersed them for 24 hours before cleaning with soap and running hot water. Any residual hair was then picked off with forceps.
The brushes with hair samples are normally cu ltured the same day. If
sto rage of samples i s necessary, t hey can be kept at laborato ry
temperature unti l the next day.
1 .3.3 Sampling of Clinical Material.
If a Wood's lamp (an u ltraviolent light which e mits light at 360nm) is
avai lab le , hai r may fi rst be exami ned in a darkened roo m before
sampling. Hair i nfected by some species of Microsporum particu larly M.
canis, even when no clinical symptoms are apparent, emit a g reenish yellow fluorescence (Georg, 1 959; Vanbreuseghem et al. , 1 978; Ajel lo et al. , 1 966; Baxter and Rush-Munro, 1 980 ; Howard, 1 983). However, the Wood's lamp is of no value for hairs parasitised by Trichophyton species which do not produce fluorescence, except T. schoenleinii i nfected hairs
which may emit a dul l greenish fluorescence (Vanbreuseghem et al. , 1 978 ; H oward , 1 983) . E. floccosum never i nvades h a i r i n vivo

36
(Vabreuseghem et al., 1 978), while infected skin scales and nails do not
f luoresce. For such cases Wood's lamp is of little value in detecti ng
i nfection. Medicaments, artificial fibres and natural secretions also can
obscure true fluorescence.
However, mycologically positive hair for M. canis have been reported in the USA and UK as not producing fluorescence (Baxter and Rush-Munro ,
1 980). Ajello et al. (1 966) have also reported hairs from animals infected with M. gypseum do not produce fluorescence.
For suspected cases of skin or hair i nfection , d i rect m icroscopy can provide a fi rst i ndication of infection. lt al lows di rect examination for
fungal elements, septate hyphae and spores . To clear the keratin and
expose the fungal e lements, 1 0-20% KOH is used (Georg, 1 959 ; Ajello et
al. , 1 966 ; Vanbreuseg hem et al. , 1 978 ; Rippon, 1 982b) , althoug h chlorallactophenol can also be used alone o r with a dye. Microscopical
examination is made using a low intensity light source to ensure a good
contrast between the fungus and the keratinous material.
Fungi from infected materials can then be isolated using SDA containing penici llin/streptomycin or chloramphenicol and actidione incubated in the dark at 25-30°C (Georg, 1 959; Ajello et al. , 1 966). The incubation period
generally varies from 1 to 4 weeks on SDA medium.

37
1 .4 COLONISATION OF KERATIN BY DERMATOPHYTES.
1 .4.1 Colonisation in vivo.
The dermatophyte species within the three genera Epidermophyton, Microsporum and Trichophyton differ in their pathogenicity in vivo. While
all species invade the stratum corneum of the epidermis and the foll icu lar ostium of hairs, different species vary wide ly in their capacity to invade hai r and nai l (Lachapel le and A rm ijo, 1 983) . The reasons for th is observed tissue specificity are unknown, but are thought to be related to
specific nutritional requirements or the enzyme production of individual
organisms (Bulmer and Fromtling, 1 983).
1 .4.1 .1 Hair.
Spores on the epidermis germinate and penetrate into the hair fol licle, descending first in the root sheath area and then invading the hair proper by pushing between the overlapping cuticle cel ls to ente r the cortex.
Mycelial invasion is oriented towards the hair bulb. The invading hyphae
do not enter livi ng tissue and the zone of active growth is the newly
differentiated, o r differentiating keratin. U nder certain ci rcumstances, some can even extend and grow in the deeper tissues which are without
keratin. According to Pinetti ( 1 962), invasion of deeper tissues is not as a
resu lt of active penetration but of passive transportation. But studies by Aje llo et al. , (1 985) of histopatho log ical material suggested pressure
exerted by mycel ial g rowth with in the hair fo l l ic les led to myce lial
filaments and hyphal clumps escaping into the dermis.
The type of ha ir i nvasion p roduced by i nd ividual species can be determined by di rect microscopy. The pattern of invasion can be either endothrix (spores i nside the hai r e .g. T. rubrum) or ectothrix (spores
i nside and outside the hair e .g . T. mentagrophytes, M. canis). Further differentiation can be based on the size of the spores ("large" e.g. T. verrucosum or "small" e.g. M. canis). In "favic-type" hair invasion due to T. schoenleinii the i nfected hair contains branched hyphae and empty spaces appeari ng as l ines of a ir bubbles where the mycel ium has degenerated. Fat droplets are commonly present (Beare et al. , 1 968).

38
1 .4.1 .2 Skin.
The presence of dermatophytes in the horny layer of the epidermis
provokes two types of pathological lesions: scales and vesicles. The
morpho logical appearance of dermatophytes is commonly as long septate and branched hyphae, and arthrospores in various numbers. These later lie more or less paral lel to the surface of the epidermis. At
maturity they round up and appear as chains of beads. The scaling produced is a result of the activity of enzymes produced by the fung i
(Cruickshank and Trotter, 1 956).
1 .4.1 .3 Nails.
C o m m o n ly de rmatophytes i nvade the nai l- bed, wh ich becomes hyperkeratotic, and the inferior part of the nail plate. Dermatophytes tend
to be orientated at random in hyponychial keratin , but lie parallel to the
surface in the nai l plate. Long septate and branched h yphae , with
arthrospores, are the main microscopic features found in dermatophytic
nai l infections.
1 .4.2 Colonisation in vitro
1 .4.2.1 Hair.
Colo n i sation of hair in vitro i s qu ite un l ike that occuri ng in vivo.
V a n b re u s eg h e m ( 1 952a) a n d E ng l i s h ( 1 963) e x p e ri m e nta l l y demonstrated in vitro the stages by which detached hair is attacked by
keratinolytic fungi. The stages have been summarised by Barlow and
Chattaway ( 1 955) : 1 . cuticle l i ft ing 2. cortical erosio n 3 . perforating
organs and 4. colonisation of the medulla.
(a) Cuticle lifting.
The fungal mycelium gives rise to lateral branches which form branched fronds of mycelium, the "eroding mycelium" which forces its way beneath
adjacent ove r lapp i ng sca le s . At t h e same t i m e , hyphae g row long itudinal ly along the hair, producing lateral branches at intervals,
which eventually grow round the hair following the edges of the scales.

39
(b) Cortical erosion.
Here there is a continuation of the fronds produced, to form new fronds of mycelium below the original ones. The new fronds are seen lying at the
bottom of sharply marked troughs, deeper than those created by cuticle
lifti ng fronds and are especially characteristic of T. rubrum. M. canis, unlike some other dermatophytes, produces overwhelmingly thick fronds, forming masses of eroding mycelium many cells in depth.
(c) Perforating organs.
At this stage, a perforating organ (Vanbreuseghem, 1 949) made up of a column of short, wide cel ls, the lowest one cone-shaped, penetrates tangentially and radially into the hair and often projects backwards. This
organ is said to arise from one or more hyphae of short, wide cells which arch over the perforating organ and lie along the hair at either side of it, giving the appearance of a handle ("anse" Vanbreuseghem, 1 952a).
(d) Colonisation of medulla.
The last phase, the colonisation of the medulla, by longitudinally growing
hyphae, takes place by hyphae forming in the hair. Growth is more rapid in the medulla than in the cortex, probably due to the softer keratin in the medulla (Rothman, 1 953) and its less compact cellular structure.
Raub itschek ( 1 957, 1 96 1 ) co nf i rmed Van breuseghem's ( 1 952a)
observations of the perforating organs of dermatophytes invading hair
and thereby o btain ing nourishment. Raubitschek ( 1 961 ) , however, argued against production of keratinolytic enzymes by dermatophytes in order to obtain nourishment. He postulated that dermatophytes obtained
nourishment from the non-ke rat inous material , thus destroying the framework of the structure while leaving the keratin molecules intact. But
this theory has not been widely accepted.
1 .4.2.2 Skin.
In vitro studies on skin invasion by dermatophytes have employed stratum corneum stripped by adhesive tape or cyanoacrylate contact

40
cement. Stratum corneum comprises dead ce l ls produced during the process of exfoliation and dermatophytes in lesions remain confined to it.
Aljabre et al. ( 1 992) used the adhesive tape method to strip stratum corneum and found that the pattern of growth of T. mentagrophytes on the strips followed a cycle, first the germination of arthroconidia, forming
germ tubes and then penetration of the stratum corneum, followed by
formation of hyphae. These stages were considered to be important in
pathogenicity, the intra- and extracel lular location of the dermatophyte impling its ability to utilise components of both the intra- and extracellular environments by some diffusible product.
1 .4.2.3 Nails.
Studies by Raubitschek ( 1 957) Raubitschek and Maoz ( 1 957) using
nai ls, demonstrated true invasion of the nail plate in continuous shake
cu lture with T. tonsurans, T. rubrum and T. mentagrophytes. All the dermatophytes produced nail invasions similar to clinical infections, with the formation of hyphae and arthrospores. In a number of places on the
nail, single hyphae were observed enter:ing the nail plate through breaks
in the surface.
Thus both in vitro and in vivo studies of the colon isation of keratin indicate that dermatophytic invasion involves the use of both mechanical pressure e .g. the perforating organs in vitro, and enzymatic digestion.

41
1 .5 PROTEOLYTIC ENZYMES OF DERMATOPHYTES.
1 .5.1 Role In the Colonisation Process.
Althoug h a number of researchers fol lowed Davidson and G regory
(1 934) in supposing that dermatophytic hyphae and such modifications as perforating organs invade and penetrate by means of enzymes, early workers experienced considerable difficu lty in iso lati ng keratinolytic enzymes from fungal cultures grown on laboratory media (English, 1 963).
However, it was known that with some fungi causing soft rots in plants,
the enzyme pectinase was secreted in vivo on host plants and not in vitro using laboratory media. lt was strongly be lieved that both perforating organs and eroding mycelium in vitro functioned by means of enzymes in addit ion to mechanical pressure, duri ng both radial and longitudinal
penetration. Engl ish ( 1 963) observed that in old u ndisturbed s lide cultures, she could not find cells lying free, suggesting that the hair was
not merely disintegrated by the mechanical action of the fungus, but digested as wel l . Biochemical evidence had earlier been provided by
D a n i e l s ( 1 953) who had ident i f ied accu mulated amino acids as
degradation products of keratin in broth culture.
Furthermore, in dermatophyte infections of the skin , the fungus remains confi ned to the stratum corneum, whi le the pathological changes are
produced i n the deepe r layers of the epidermis and in the dermis
(Pi llsbury et al. , 1 956). This suggests that the pathological reactions are mediated by some diffusible product(s) of the fungus or the interaction of the fungus with the stratum corneum (Minocha et al. , 1 972) . That dermatophytes produce a number of enzymes which may be involved in
the overall interaction has been demonstrated a number of times.
Tate ( 1 929) using acetone dried enzyme powders, was able to detect
protease, catalase, ke rat inase, l ipase , u rease , i nvertase , lactase, maltase and d iastase activity i n representatives of the main g roups of dermatophytes. In 1 954, Chattaway et al. , carried out some enzyme studies on M.canis, using crushed mycelium, and were able to detect
oxidase, phosphatase and diastase activity, in part confi rmi ng Tate's ( 1 929) observation. lt was not until 1 963, when Chattaway et al. , using a
l ab oratory b roth med i u m , were ab le to i so late peptidases f ro m

42
dermatophytes. Late r, Rippon ( 1 968) also iso lated an extrace l lu lar
c o l l ag e n ase e n zyme f rom T. sch oenleinii. T h i s e n z y m e was demonstrated to have general proteolytic and collagenase activity. Studies by Cruickshank and Trotter ( 1 956) using culture filtrate from T. mentagrophytes and T. rubrum found the fi ltrate affected the epidermal
dermal bonds resulting in separation of the epidermis from the dermis. This finding means that proteolytic enzymes diffusing from the fungus
loosen the epidermal attachment, resulting in vesicles.
Fo l lowing the above successes, many researchers have reported
isolating enzymes from different dermatophytes using varying types of synthetic media (Vu et al. , 1 968, 1 969 ; Rippon and Garber, 1 969 ;
Minocha et al. , 1 972 ; Sanyal et al. , 1 985; Apodaca and McKerrow, 1 989a, 1 989b, 1 990) . The exoce l lu lar enzymes have been found to
hydrolyse proteins such as azoalbumin , casein, e lastin , collagen and
keratin.
Self synthesised enzymes may serve fungi · in a number of ways. They
may enhance survival in tissues by chemically or physically altering the
i mmediate environment, or they may act di rectly by digesting host proteins, thus providing a source of nutrition. The pathogenic potential of a fungal agent may depend on its ability to produce enzymes. In turn
variations in enzymatic potential of a fungus may be responsible for differences in the pathogenic effects of various strains (Waldorf, 1 986).
Stud ies by R i ppon and Varadi ( 1 968) fo u nd ce rtai n st ra i n s o f
Microsporum and Trichophyton species produced enzymes which were
able to solubilise the keratin and related fibrous proteins found in skin, hair, claws and hoof. Keratin, elastin and collagen make up 25% of the body weight of mammals (Wood and Bladon, 1 985). The role of enzymes as virulence factors has also been inferred as they are often found in the tissues of infected animals (Rippon, 1 968, 1 975). lt has been suggested that they may play a role of breaking down part of the infected tissue(s).
Other studies by Rippon (1 967), Rippon et al. , (1 971 ) have suggested
that differences in virulence of mating types may be related to differences
i n the i r abi lity to produce e xtrace l lu lar enzymes such as e lastase .
Experimental results have given conflicting results, so that more studies are needed to test the hypothesis (Kwon-Chung, 1 974; Stockdale, 1 981 ).

43
1 .5.2 Laboratory Production of Dermatophytic Enzymes.
Some of t h e factors wh ich i nf l u e n ce enzy m e product i o n by a dermatophyte unde r laboratory condit ions i nc lude, med ium, p H , i ncubation period and tempe rature , size of inocu lum, type of cu lture (stationary or agitated) and the strain of the fungus.
1 .5.2.1 Media and Incubation.
Main ly synthetic substrates in both the solid (Rippon, 1 967; Weitzman et al. , 1 971 ; Hopsu-Havu et al. , 1 972) and the l iquid state (Naval and
Nickerson, 1 959; Weary et al. , 1 965; Chattaway et al. , 1 963; O'Sul livan and Mathison, 1 971 ; Asahi et al. , 1 985; Apodaca and McKerrow, 1 989a,
1 989b, 1 990) have been used to study enzyme production. One problem
with enzyme production studies is that there is no standard medium and
the refore comparison between studies is di fficu lt and u n re l iable. However, the most commonly used has been Sabouraud's broth.
In general , enzyme production studies using synthetic media tend to i nclude a carbohydrate source (commonly g lucose) and a nitrogen source (e .g . peptone) , which can a lso support the g rowth of the de rmatophyte i ndepe ndently. Some dermatophytes are u nable to assimilate some nitrogen compounds from synthetic media without the addition of one or more growth substances (Stockdale , 1 953a). Some
example medium constituents in addition to Sabouraud's broth that have been employed for studies of exocellular enzymes include MgS04.7H20, KH2P04, K2HP04 and thiamine-HCL with an addition of either e lastin or
keratin (Meevootisom and Niederpruem, 1 979), glucose-peptone broth (Sanyal et al. , 1 985) , horse hair, g lucose, MgS04, thiamine , pyridoxine
and i nos i to l (Vu et al. , 1 968 ) , MgS04, KH2P04, FeS04.7H20 , ZnS04. 7H20 and unsterilised keratin (Grzywnowicz et al. , 1 989).
Other factors which wi l l affect enzyme production are temperature and period of incubation . Kotrajaras ( 1 965) incubated cultures at 32°C and assayed for enzyme activity for 4 weeks at 1 week intervals with a skin epidermal separation assay. He found that maximum enzyme production
was duri ng the fourth week. Meevootisom and N iederpruem ( 1 979)

44
incubated T. rubrum at 25°C and found maximum enzyme production to
be at 3 weeks, using a proteinase activity assay.
But there is very little information on the effect of different temperatures on enzyme production. Most workers use a temperature range of 25-
370C.
1 .5.2.2 Stationary and Agitated Cultures.
Studies by Raubitschek (1 955) and Evron-Maoz and Raubitschek ( 1 960) demonstrated that the conti nuous shake cu lture method produces a constant amount of growth from a given inoculum. This method, which is
usefu l fo r e nzyme studi es , makes the fungus p roduce hyphae,
arthrospores and chlamydospores resembling the parasitic life phase of the fungi found in scales, hai r and nails (Raubitschek, 1 955). This growth
type is referred to as "pseudo-parasitic" (Evron-Maoz and Raubitschek, 1 960). Stationary culture on the other hand, produces mostly macro- and microconidia as found in the saprophytic· phase of dermatophytes.
However, most authors studying enzyme production have used either
shake or stationary cu ltures only. Most workers have not provided any reason(s) for the choice of the culture method.
1 .5.2.3 Hydrogen ion Concentration (pH).
The dermatophytes are not exacting in their pH requirements, with a pH
range of 4-1 0 being compatible with the g rowth of most species. The optimum pH is slightly lower than pH 7.0 (Stockdale, 1 953a). Most media tend to have the pH adjusted before use. A study by Weary and Canby
(1 969) using T. schoenleinii and T. rubrum in broth culture but separated
from radioactive wool by a semi-permeable membrane found that the
optimum pH for keratinolytic activity was between 7-8.
1 .5.2.4 Oxygen and Carbon dioxide Tensions.
The growth of fungi, like other organisms, is influenced by environment.
Variations in external conditions can affect rate of growth and can bring
about d i ffe rences i n type of g rowt h . Some fungi produce atypical
st ruct u res resemb l i ng yeast when subme rged in l iqu id med ium .

45
According to Smith ( 1 938), in culture flasks with a greater active surface re lative to the plugged open ing , analyses of air drawn from f lasks
containing actively g rowing moulds have shown that there must be a very
rapid removal of carbon dioxide and intake of fresh air.
However, l i t t le h as been d o ne to study such facto rs as oxyge n requ i rement. But i n g eneral dermatophytes g row wel l under aerobic conditions. Some studies by Giblett and Henry ( 1 950) found the growth
of Microsporum was inhibited at certain oxygen concentrations, while M. audouinii and M. canis showed no growth i n 40% and 60% carbon dioxide respective ly. I n addit ion, the effect of different flask sizes is
unknown , although most workers have reported usi ng 250ml flasks
(Meevootisom and N iederpruem, 1 979 ; Hel lmich and Schauz, 1 988 ;
Okeke and Muller, 1 991 ).
1 .5.2.5 Fungal Strain.
Rippon (1 967) carried out studies on elastase enzyme production using various dermatophyte species. H e assayed for elastase activity by
demonstrating ability to clear 1 % particulate elastin suspended in nutrient agar. He found that of the 1 8 strains of T. mentagrophytes tested, four
originati ng from patients with marked or severe inflammatory infection
had elastase activity. Simi larly, in further studies with three strains of M. fulvum (N. fulva), two isolates from patients with inflammatory ringworm
had e lastase activity. The one strain from a non-inflammatory infection
had no e lastase activity. He confi rmed the observations by assaying
cultures g rown in tryptose-yeast-g lucose broth using an orcein-elastin method.
Later, 21 N. fulva isolates i ncluding the three from ringworm infections were mated with their opposite mating types. 1 2 strains of the "-" mating type were found to be elastase negative while nine "+" mating types were positive.

46
1 .6 ENZYME ANALYSIS.
Physico-chemical techniques in use for enzyme work can be divided into
(1 ) conventional chromatography, such as gel fi ltration and ion-exchange
(2 ) h i g h p e rforma nce l i qu id c h r o m atog rap hy ( H P LC) and (3 ) electrophoresis. The last named is the one chosen for the p resent
studies.
Use of an electrophoretic method simultaneously exploits differences in
molecular size and charge for purposes of fractionation (Chrambach and Rodbard, 1 971 ) and is a widely used technique for characterisation of purified proteins (Scopes, 1 987). Earlier electrophoretic techniques using
supports such as paper and other ce l lu lose-based materials did not achieve desired protei n reso lut ions, s i nce separation re l ies on an
approximate charge/size ratio of a protein (Scopes, 1 987), the use of such supports resulted in some proteins moving together as one peak.
However, s pecia l ly h igh resolution was achieved i n the m ethod of Ornste in ( 1 964) with disc e lectrophoresis employing a synthetic ge l
medium, a cross-l inked polyacrylamide, in which a carefu lly designed system of discontinuous buffers was used (Arcus, 1 970). Although disc
electrophoresis is still used, it has been largely replaced by slab gels, on which several samples can be ru n at the same t i me with d i rect
comparison of mobi l ity (Scopes, 1 987 ; Osterman, 1 984; See and Jackowski, 1 989). Polyacrylamide gel ( PAGE) electrophoresis can also be carried out at ooc as wel l as at higher temperatures (Chrambach and
Rodbard , 1 971 ) , and the e lectrophoretic method causes no protein
damage (Arcus, 1 970) . The method is therefore applicable to enzymes (Nish ihara et al. , 1 967; Apodaca and McKerrow, 1 989a, 1 989b and
1 990) . Thi n-slab gel e lectrophoresis using polyacrylamide has been developed extensively in recent years . The advantage of a thin ge l
(�1 mm) is that less heat is produced per cm2 of gel surface for a given applied voltage (Scopes, 1 987).
1 .6.1 Clean-up Procedures.
A cru d e enz y m e extract from a fu nga l cu l ture u sual ly contai n s
contaminants such as fungal cells and carbohydrates. So that a clean up

47
step to remove most of the contaminants is required. Purifying a crude
enzyme fi ltrate improves the activity of the enzyme. The three techniques common ly e m ployed are ( 1 ) neut ra l salt and/o r o rgan ic so lvent concentration (2) centrifugation and (3) u ltrafiltration.
Precipitation by addition of neutral salts such as ammonium sulphate is
probably the most commonly used for fractionating proteins ( Harris and Angal, 1 989) , although protein precipitation by water miscible solvents such as ethanol or acetone has been used since the early days of protein
purification (Scopes, 1 987). The principal effect of organic solvents is reduction of water activity (Scopes, 1 987). Although these techniques are suitab le for many applications, precipitative and so lve nt extract ion procedures are apt to be denaturing because of the phase changes
common to these techniques (Biatt, 1 971 ).
1 .6.2 Polyacrylamide Gel Electrophoresis.
This involves running the sample in a buffer at a pH where the proteins
remain stab le i n their native form and makes use of diffe re nces i n charges and size between different proteins (Scopes, 1 987; Dunn, 1 989).
Although the buffer may depend o n the nature of the proteins, it is generally i n the pH range of 7 - 9, where most proteins are negatively charged and thus move towards the anode (Scopes, 1 987) at the bottom of the ge l i n the th in slab ge l apparatus. If basic protei ns are being
analysed a lower pH can be employed.
Pore size variabi lity is achieved by use of variable concentrations of polyacry lamide according to the size of molecules to be separated
(Chrambach and Rodbard, 1 971 ; Scopes, 1 987). Two variat ions are
possible : variation in total acrylamide content and variation i n cross-linker percentage (N,N1 -methylene bisacrylamide). An increase of e ither one
reduces the pore size, slowing larger molecules. The ratio of cross-tinker is 1 part to between 20-50 parts of monomer. Generally, gels of 7-1 5% are used. The polymerisation process is i nitiated with freshly prepared
am monium persulphate ( 1 . 5-2mM) i n the presence of N , N , N 1 , N 1 _ tetramethyl ethylenediamine (0.05-0. 1 % voVvol TEMED), as a catalyst. This method i s more efficient than the a lternative of UV - activated
. polymerisation with riboflavin (Osterman , 1 984 ; Scopes, 1 987; Dunn, 1 989).

48
Electrophoresis can also be carried out in starch gel medium, but this is less popular compared to polyacrylamide. However, it is specially useful
when detecting enzymic activity for indexing allelic variation of species after electrophoresis (Selander et al., 1 986; Murphy et al. , 1 990), and will
be discussed in Section 1 .8.6.
1 .6.3 SOS Gels.
The anionic dete rgent , sodium dodecyl su lphate (SOS) , is a very effective solubi lising agent for a wide range of proteins. lt masks the
i ntrinsic charge of the polypeptide chain , making net charge per unit
approximately constant ( Reyno lds and Tanford, 1 970 ; Weber et al. ,
1 972). Therefore electrophoretic separation now depends on molecular
radius, which is roughly equal to molecular size and occurs by molecular s i eving th rough the ge l . Th is i s commonly known as SOS- PAG E (po lyacry lam ide ge l e lectrophores is in sod ium dodecyl su lphate) (Chrambach and Rodbard, 1 971 ; Osterman, 1 984; Scopes, 1 987; See and Jackowski , 1 989) and is the most commonly used method for al l types of proteins.
For optimal reaction with SOS, a 3-5 minutes incubation in 2-5% w/v SOS
in the presence of 2-mercaptoethenol or dithiothreitol to cleave disulphide
bonds is a common practice (Weber et al. , 1 972) . The most used buffer
system i s that of Laemml i ( 1 970) based on the discontinuous buffer syst e m o f O rnste i n ( 1 964 ) . The buffe rs a re m ad e of d i ffe ri n g
concentration of Tris/HCL for the resolving and stacking ge ls. The
advantage of this system is that it concentrates sample p roteins i nto
sharp bands (or zones) before being resolved (Ounn, 1 989).
1 .6.4 Substrate Copolymerlsed Gels.
The substrata copo lymerised g e l techn ique is performed using a
modification of Laemmli's (1 970) procedure with a non-substrata stacking gel. Substrata copolymerised gels are used to localize enzyme activity by molecular weight. These gels differ from the standard SOS-Laemmli gels
in two ways, viz. , (a) the gels are made by incorporating the protein
substrata of interest within the polymerised acrylamide matrix and (b) the

49
sample is mixed with a higher concentration of SOS to which is added 1 or 2% sucrose and bromophenol blue as a tracking dye (Heussen and
Dawdle , 1 980 ; Asahi et al. , 1 985) . In the sample buffer, no reducing
agents such as 2-mercaptoethanol and dithiothreitol are included. Also the protein sample is not boi led as th is wou ld render the enzymes inactive. However, standard polypeptides of known molecu lar weight are boiled for approximately five minutes and run on the same gel as the
protein sample. This method therefore al lows detection of proteinases and the determination of their molecular weight.
The most commonly used substrata to detect proteinases is gelatin, first introduced by Heussen and Dawdle, 1 980. The gelatin is dissolved in hot
water and added to the resolving gel mixture before pouring into the gel
apparatus to allow it to polymerise.
After electrophoresis, the SOS can be removed to allow the enzymes to
renature by washing the gel in the nonionic detergent triton X-1 00 for 2 hours (Heussen and Dawdle, 1 980; Lacks and Springhorn, 1 980; Asahi et al. , 1 985). The gel can then be incubated in a suitable buffer to allow
bre akdown of t he ge lat in by the enzyme(s) . After 1 2 to 24 hours
incubation, enzymes can be denatured using 50% trichloroacetic acid
(TCA).
1 .6.5 Staining and Destaining Proteinase Gels.
At the end of electrophoresis, the protein band must be visualised. This
involves staining with any organic dye that binds to the protein (Scopes, 1 987). Fixing of proteins on the gel by denaturation also removes nonprotein which may interfere with staining procedures (Harris, 1 989). The
common fixatives are either methanoVacetic acid/water (3:1 :6) (Heussen and Dawdle, 1 980) , or a protein precipitant, TCA or perchloric acid at 5-1 5% concentration (Scopes, 1 987).
Dyes commonly used for stain ing are coomassie bri l l iant blue R-250 (CBB- R), coomassie bri l l iant blue G-250 (CBB-G) (Tal et al. , 1 985) , amide black (Heussen and Dawdle, 1 980) and nigrosine (Scopes, 1 987) . These stains are u sed pri ncipally due to their sensitivity of detecting
small amounts of p rote ins and their un iform staining with all protein

50
types. The staining time depends on the thickness of the gels, hence the popular use of thin (s1 mm) gels.
For substrata copolymerised gels, the staining procedure is performed as for denatured proteins except that sample proteins containing proteolytic
"species" appear as clear bands on a coomassie stained background after destaining. The l imitation with polyacry lamide-ge lat in ge ls for analysing crude samples is that, some proteinases may be irreversibly denatured by the SOS p resent in the po lyacrylamide ge ls o r have different pH optima. The · other limitation of the gelatin/SDS-PAGE is that
only proteinases of relatively high activity can be investigated, and there is the potential that proteins of identical size cannot be separated in this
system. Notwithstanding the above, this technique gives the best and s harpest resolut ion and clearest zones re lative to other methods
(Scopes, 1 987).
1 .6.6 1sozyme (Multllocus Enzyme) Electrophoresis.
The term "isoenzyme" (Markert and Mol ler, 1 959) refers to different
molecular forms of enzymes with a common ability to digest a particular substrata but which differ in electrophoretic mobility. Allozymes (Prakash et al. , 1 969) on the other hand, are a subset of isozymes which are
variants of polypeptides produced by different allelic alternatives of the same genetic locus, which differ in e lectrophoretic mobi lity. Isozyme
(mu ltilocus) e lectrophoresis relies on indexing allelic variation in sets of
randomly selected structural genes of the chromosomal genome, which provides a basis for overal l levels of single- and multi-locus genotypic variation in populations (Selander et al. , 1 986).
The use of a starch gel as a support medium for separation of serum protei ns was fi rst i ntroduced by Smithies in 1 955. The small pore size allows the retardation of large molecules which had not been achieved wi th ot h e r s u p p o rt m ate r ia l s . Th is was latte r fo l l owed by the demonstration that enzymes could be visualised directly on starch gels
when stained with specific h istochemical stains (Hunter and Markert, 1 957).
The isozyme technique i nvolves boi li ng hydrolysed starch in a buffer,
removing ai r bubbles and allowing the starch to cool thereby forming a
51
ge l . The ratio of starch to buffer can be varied to alter the size of the pores. The pore size produces the sieving effect in the gel , therefore separation can be achieved both on size and charge. There are two types of buffe r systems, conti n uous and d isconti nuous . For both systems, various mixtures of buffer ions are used to achieve better
resolution.
There are two forms of starch gel electrophoresis (SGE) : (1 ) horizontal
and (2) vertical. For horizontal SGE, a poured gel is allowed to cool in a gel mould without further preparation. The advantage of a horizontal gel
is that it can be cut to obtain slices which can be stained for different enzymes. Vertical gels, on the other hand, are poured into a double sided
mould having a "gel comb" as in SOS-PAGE, to make the gel wells for holding tissue extracts (Brewer, 1 970; Murphy et al. , 1 990). In general, vertical gels require more starch and larger tissue e xtracts and allow
fewer samples to be run per ge l and therefore are uneconomical. A
possible disadvantage with horizontal gels is electrodecantation, whereby high molecular weight (Mr) enzymes drop to the bottom of the gel which
may make s l ices from upper reg ions of horizontal gels i nferior or inadequate for resolving these proteins. However, horizontal gels are the most widely used (Murphy et al. , 1 990). Horizontal gels were chosen for
this study.
1 .6.7 Histochemical Enzyme Staining.
A way of determining the distance enzyme components travel through a starch gel is by use of specific enzyme-staining techniques (Vallejos,
1 983; Scopes, 1 987; Murphy et al. , 1 990). The use of such techniques is
restricted to non-denaturing conditions. This is done without fixing the protein zones, but the reagents should be able to diffuse in the gel. The reagents used for stain ing i nclude substrates on which the e nzyme reacts and which can be detected by a dye or substances able to fluoresce at 340nm (Murphy et al. , 1 990).
The available detection mechanisms are (1 ) production of a purple colour
(formazan) by reduction of n itre blue tetrazol ium (NBT) o r a methyl
thiazolyl tetrazolium (MTT), using as i ntermediate an electron acceptor . phenazine methosulphate (PMS) or a redox indicator 2,6-dichlorophenol

52
indophenol (DCPIP) which undergoes a colour change upon oxidation,
(2) nonfluorescence of �nicotinamide adenine dinucleotide (NAD) which
is formed from fluorescent NADH, (3) fluorescence of
methylumbelliferone, (4) fast diazo dyes and (5) an oxidised form of odianisidine dihydroch loride produci ng an insoluble brown precipitate (Murphy et al. , 1 990) . Many stains a lso contain requ isite molecu les,
cofactors and coupling enzymes.

53
1 .7 APPLICATIONS OF ENZYME ANALYSIS TECHNIQUES.
The difficu lty i n us ing in vitro bioche mical assays to i nvest igate pathogenicity and virulence is that pathogenicity occurs and is measured on ly in vivo, where the microbe grows under different n utritional and
environmental conditions from those provided in laboratory cultures. Like
any other biological property, pathogenicity is determined by both the microbe genome and environmental conditions (Smith, 1 984). Therefore
e i ther because of a phenotypic change or se lect ion of types , a
pathogenic m icrobe in vitro may n ot produce al l determi n ants of pathogenicity that are found in vivo during infection. In short, organisms grown in vitro culture may be deficient in virulence determinants (Smith, 1 984, 1 989). However, Mahan et al. , (1 993) have developed a genetic system, termed in vivo expression technology ( IVET), which depends on the induction of genes in the host, the idea being that some of the genes
may encode products highly expressed in the host which are required for the infection process, including previously unidentified virulence factors. This system is based on the bacterium Salmonella typhimurium. No doubt the application of IVET will be investigated for fungi in the future.
1 .7.1 Biochemical Assays.
An u nderlyi ng aim of b ioche mical assays i s the determinat ion of quantitative variations i n e .g . proteo lytic and/or e lastolytic e nzyme
production which may be responsible for differences in virulence between strains. Such assays have been widely used. Some of the common
substrates for screening i nclude hide powder-azure (azocoll) (Depiazzi and Richards, 1 979 ; Stewart, 1 979; Rippon, 1 982; Gadasi and Kobiler,
1 983), casein (McConnel l , 1 950 ; Nakamura, 1 959 ; Stewart, 1 979) ,
fibrinogen (Stewart, 1 979), e lastin ( Rippon, 1 967; Rippon and Varadi, 1 968; Rippon and Garber, 1 969; Rippon and Soo Hoo, 1 971 ; Cheung and Maniotis, 1 973; Mil ler, 1 974; Stewart, 1 979; Schultz et al., 1 982), egg albumin (Minocha et al., 1 972) and gelatin (McConnell, 1 950; Baxter, 1 968).
Studies by Minocha et al. ( 1 972) using egg albumin as a substrata to
correlate proteolytic enzyme production to virulence demonstrated that stra ins of zooph i l ic T. mentagrophytes obtained from lesions with

54
markedly severe i nflammation produced a higher amount of proteolytic enzymes than strains from less inflammatory lesions. Simi lar results for
T. mentagrophytes were obtained by Rippo n and Garber ( 1 969) .
Addi.tional studies with eighteen isolates of T. mentagrophytes i ndicated a s imi lar association with e lastase activity and i nflammation (Rippon , 1 967, 1 982a).
In an earlier survey of pathogenic fungi for elastase activity as a possible i ndicator of pathogenicity conducted by Rippon and Varadi (1 968), the authors found differences which corre lated with mat ing types among
isolates of N. fulva. All their seven "+" isolates were positive for elastase activity and all eleven "-" strains were negative. Thus it was suggested
that there may be a correlation not only between elastase activity and
inflammation but also between mating type and virulence.
Vanbreuseghem (Gordon, 1 981 ) questioned the use in the above studies of a member of the M. gypseum complex, a g eophile with a frequent contact with man but rare ly p roduci ng les ions . M. canis can be considered a species which may better provide some explanation(s) on
whether diffe rences in vi ru lence of mati ng types might be related to differences in their abi lity to produce extracelluar enzymes. However, the disadvantage with M. canis i s the predominance of the "-" mating type
w i th a l m ost a c o m plete abse nce of t h e "+" m at i n g typ e . T h e
predominance o f t h e "-" mat ing type from both carrie rs and cl inical
material has been suggested to be due to a selective advantage of the "-" over the "+" mating types in its actual pathogenicity (Weitzman et al. , 1 978).
Other experimental studies of this aspect have given conflicting results
(Weitzman et al. , 1 967; Gordon et al. , 1 967; Weitzman et al. 1 971 ; Kwon
Chung , 1 97 1 ) . The experimental animal studies by Weitzman et al. ( 1 967) and G o rdon et al. ( 1 967) with the three species of the M. gypseum complex had shown that N. fulva was less virulent than either N. gypsea or N. incurvata. These results are essentially in agreement with those of Aippon and Garber (1 969) except that Weitzman et al. and Gordon et al. (1 967) found no significant differences in virulence between mating types of any o f the three species when tested i n both rabbits and g u inea pigs, but the associat ion of e lastase product ion with more inflammatory infections irrespective of species i nvolved was confirmed.

55
The production of elastase by bacteria is also known to be of significant
clinical importance (Werb et al. , 1 982). A correlation between elastinolytic
activity and virulence of bacteria in the skin was demonstrated by Stewart
(1 979), using the bacterium Bacteriodes nodosus causing foot rot, an
ulcerative and erosive inflammation in sheep and cattle. The presence of elastinolytic activity correlated with the severity of infection in the sheep
from which the organisms were cultured (Stewart, 1 979; Werb et al. ,
1 982). Also Depiazzi and Richards (1 979) using hide powder-azure were
able to differentiate between foot-rot and foot-scald strains on the basis of their relative rate of decline in proteolytic activity over a period of time. The proteolytic activity of the foot-scald strains declined at a much faster rate than foot-rot strains, a findi ng which was confirmed by Stewart
(1 979) with the elastin-agar test. Pseudomonas aeruginoscis ability to produce an elastase enzyme is reported to be an important factor in the pathogenesis of infections by this organism. lt is responsible for severe skin infections in burned and immune-compromised hosts (Werb et al. , 1 982).
1 .7.2 Substrate Copolymerised Gels.
Copolymerised gels using gelatin as a substrata to detect proteinases
has been widely used (Unkeless et al. , 1 974; Granelli-Pipemo and Reich, 1 978; Heussen and Dowdle, 1 980). This method is capable of revealing the number and identity of catalytical ly active "species" appearing i n
proteolytic react ions and can b e used for impure systems (GranelliPipemo and Reich, 1 978).
The technique is applicable to a broad spectrum of proteolytic events. For instance, Heussen and Dowdle (1 980) employed SDS-copolymerised
plasminogen and gelatin substrates to detect plasminogen activators. They fou n d the techn ique was u seful i n di scri m i nat i ng between plasminogen activators of different types. Simi larly, Hanaoka et al.
(1 979), employed SOS-PAGE without a substrata in the gel, and eluted
different proteins of the Hela cell nucle i . Gadasi and Kobiler ( 1 983) investigated the effect of amoebic proteolytic enzymes on baby hamster kidney (BHK) cell proteins using SOS-PAGE. They found the enzymes
· . were able to digest the proteins participating in the attachment of the BHK cells to the substrata consequently causing detachment of the cells.

56
Other studies by Tzeng et al. (1 983} and McKerrow et al. (1 985} of
elastino lytic proteinases secreted by Schistosoma mansoni which may
contribute to its virulence, were able to purify extracts and determine the proteolytic enzymes by using ge latin substrata gels. In anothe r study employing gelatin copolymerised gels, Keene et al. (1 986} determined a
number of proteinases secreted by Entamoeba histolytica which probably contribute to its pathogenicity. They found that lysate showed significant
proteolytic activity between Mr 50 000 - 70 000.
A more recent study by Reed et al. ( 1 989} using a combination of isozyme and substrata gel techniques found that isozyme patterns of cl i n ical iso lates of E. histolytica correlated with a specific putative vi rulence factor, that is, a neutral thiol proteinase enzyme. They found that o n ly pathogenic strai ns of E. histolytica degraded ge lat in i n
substrata ge ls . A prote inase e nzyme with a poss ib le ro le i n the pathogenicity o f E. histolytica i n symptomatic pat ients was further supported by the presence of ci rculating antibodies to E. histolytica in infected hosts.
Other studies by Apodaca and McKerrow (1 989a, 1 989b and 1 990} using copolymerised substrata gels (gelat in and e last in} i nvestigated the
expression and regulation of proteinases of T. rubrum using different N and C sources for culturing. They found that a high molecular weight
enzyme of >200 KDa was expressed in all their culture conditions, while
a 71 KDa Mr was expressed in a N-depleted medium. Other proteolytic "species" of 1 24 KDa and 27 KDa were secreted i n su lfur-depleted
cultures.
1 .7.3 1sozyme (Multllocus Enzyme) Electrophoresis.
The taxonomy of dermatophytes has posed major difficulties due in part to polymorphism, where successive cultures from the parent stock show
variation (Ajello, 1 962b} and to pleomorphism and inconsistent or lack of sporulation. A n umber of methods, i ncluding morphological features, physiological tests (Georg and Camp, 1 957a; Philpot, 1 9nb; Shadomy and Philpot, 1 980), serological typing (Philpot, 1 978b; Mackenzie, 1 988)
. and serotyping using monoclonal antibodies (Polonelli et al., 1 986) have

57
been used to characterise dermatophyte strains i n systematics and epidemiology. However, these detect phenotypic variation difficult to
relate to allelic variation at specific gene loci.
DNA hybridization which provides estimates of total nucleotide sequence divergence has been used in dermatophyte taxonomy to a l imited extent (Davidson et al. , 1 980, Davidson and Mackenzie, 1 984) . However, according to Selander et al. (1 986), this method has large experimental error associated with DNA hybridization and the technique is not very
sensitive in detecting genetic relationships of closely related strains. The results obtained between different laboratories or replicates within the same laboratory tend to vary, and in practice DNA hybridization provides
information on the degree of simi larity of a set of strains to one or a few
reference strains rather than a complete matrix of coefficients of genetic relatedness between all pairs of strains.
The value of isozyme e lectrophoresis in popu lation genetics is that electromorphs (mobility variants) provide indirect information about DNA (Chang et al. , 1 962; Avise, 1 975) and the segregating proteins which
usually differ by at least one amino acid can be directly equated with al le les (a lternate fo rms of a gene) (Avise , 1 975; Crawford, 1 983; Selander et al. , 1 986) . Despite a certain number of l imitations , the equation between phenotype and genotype remains reasonably wel ldefined for isozymes, especially when contrasted with the situation for morphology and secondary chemistry (Crawford, 1 983).
Studies based on Entamoeba histolytica trophozoite isozyme patterns from asymptomatic and symptomatic human cases all over the world have demonstrated that nonpathogenic species of amoebae found in the intestine of man have a distinctive isozyme pattern distinguishable from pathoge n ic species ( M i re l m a n , 1 987) . The isozyme patte rns of hexokinase and phosphoglucomutase, whose bands migrate d ifferently
in the two cases , can be used as markers to distinguish b etween
pathogenic and nonpathogenic strains (Sargeaunt, 1 987). Gharbia and Shah ( 1 990) fou nd the e lectrophoretic migration of 2-oxog lutarate reductase (OG R) alone a rel iable m arker to differentiate species of Fusobacterium, and glutamate dehydrogenase and OGR mig ratio n
differentiated al l the Fusobacterium species except F. varium and F. mortiterum.

58
An important observation made using isozyme analysis of Escherichia coli and Shigella species derived from different sources was that very closely related bacteria may show very different disease types and/or
host speci ficit ies (Se lander and Musser, 1 990) . These studies of subspecific structure have identified several species in which clones vary markedly i n host associat ion, disease specificity and vi rulence. The i mplication of this finding is that comparative molecular studies of strains
differing in pathogenicity would contribute information of significance to
an understanding of fungal pathogenesis.
Cruickshank (1 990), using pectic isozymes as a taxonomical criterion for
Rhizoctonia, found co rre lat i o n s betwee n i sozyme patterns and
anastomosis groups and their subgroups recognised by morphology and pathology. Oudemans and Coffey ( 1 991 ) compared 3 morphologically distinct species of Phytophthora, P. cambivora, P. cinnamoni, and P. cactorum using isozyme analysis and found that the 3 species were clearly separated, and each further subdivided into electrophoretic types.
A n a na lys is of m i toch o nd ria l D NA rest rict i on f rag m e nt l e ngth polymorphism of selected strains from each isozyme group was found to support the isozyme data (Mill is et al. , 1 991 ).
Studies of dermatophytes by Jones and Noble (1 981 ) and Tucker and Noble ( 1 990) using PAGE and i sozymes revealed species specific
protein patterns which allowed some species to be recognised despite
morphological variation. Additional studies of M. canis and M. distortum showed the two specie s were i nd ist ingu ishable and that M. can is
apparently had little genetic diversity. They suggested a clonal origi n of
M. canis spread_ via pet animals or perhaps the involvement of some
aspect of pathogenicity as revealed by the protein patterns shared by clinical strains.
Despite the great potential of isozyme technology, this method like others before it has certain l im itations and problems. The major problem
according to Achtman and Plaschke ( 1 986) is that results of another laboratory can be repeated only by using identical methods on the same selected reference strains. Additionally, the resolution obtained within
. any g roup of m icroorganisms seems to be so lely a function of the

59
number of enzymes examined. This method reveals more and more subdivisions as more enzymes are examined. Although this provides
extra information and the additional subdivisions do not affect the branch of the genetic tree, the numerous "twigs and leaves" may obscure the
primary structure from non-specialists.
1 .7.4 Methods of Genetic Analysis using Isozyme Data.
Among the advantages of the electrophoretic technique is that it can provide not only taxonomical information of a species but also indicate genetic similarities and variation within the species and between species,
including information on variance in pathogenicity among isolates (May et al. , 1 979; Cochrane et al. , 1 989 ; Selander and Musser, 1 990) . Other
advantages over conventional systematic criteria, such as morphology, are objectivity (Crawford, 1 983), since the enumeration of alle les and their frequencies are objective determinations based on the mobi lity of bands on gels. Further, there is the constancy of genic characters, i .e .
the amount of genetic information, which depends on the number of loci examined and electrophoretic techniques are known to yield precise data on genetic contents of organisms (Avise, 1 975) .
For isozyme data, there are two frequently used methods of analys is depending on whether the genetics of the banding patterns are known. In the case where i t is known, for each enzyme, distinctive mobility variants
are designated as electromorphs and numbered in order of decreasing
rate of anodal mig ration. Electromorphs of an enzyme are equated with
alleles at corresponding structural gene loci, and absence of enzyme is attributed to a nu l l allele. Distinctive profi les of electromorphs at the
e nzyme loci co r respo nd i ng to u n iq u e mu lt i locus g enotypes are designated as electrophoretic types (ETs).
Genetic diversity can then be calculated as h = 1 - Lx;2[n/(n-1 )] where xi is the frequency of the llh allele at the locus, n is the number of isolates or ETs in the sample, and n/(n-1 ) is a correction for bias in small samples
(Nei, 1 978).
Genetic distance (D) between pairs of isolates or ETs can be expressed
. by one of several coefficients. Most authors calculate genetic distance

60
between pairs of isolates as the proportion of loci at which dissimi lar alleles occur i .e. , the proportion of mismatches (Selander et al., 1 986).
From a matrix of coefficients of genetic distance, various multivariate statistical methods may be used to represent overall relatedness among isolates or ETs.
However, when the genetics of the banding patterns are not known,
phenotypic variation can be measured by number of bands per isolate and frequency of occurence (iso lates with a g iven "band" per total number of isolates). The frequency of phenotypes can then be calculated for each population . From such data, the Shannon-Wiener diversity measure can be calculated for each enzyme system with the formula H =
- l: pi log2 pi where H is phenotypic diversity and pi is the frequency of the ith phenotype in the population (Lewontin , 1 972 ; Gaur et al. , 1 981 ;
Magurran, 1 988).
Phenotypic relatedness between pairs of isolates has been expressed by
most authors using the normalised percent disagreement (PTC). From the matrix of PTC a number of multivariate statistical methods may be used to represent overall phenotypic s imi larity among isolates. The
com mon ly used m et hod to t ransform PTC data i nto a s im i larity
phenogram is the unweighted pair group method of averaging (UPGMA) (Sneath and Sokal, 1 973).

CHAPTER 2
MATERIALS AND METHODS.
2.1 MYCOLOGICAL TECHNIQUES.
2.1 .1 Principal Media.
(a) Sabouraud Dextrose Agar (SDA) (Oxoid)
Mycological peptone Dextrose Agar Distilled water (DW)
pH adjusted to 5.6
(b) Sabouraud with Antibiotics.
1 0g 40g 1 5g
1 000ml
Sabouraud's medium as above, with chloramphenicol 50mg/1 Oml 95% ethanol and cycloheximide SOOmg/1 Oml acetone. Both were added after the medium had been heated to boi ling and cooled down to about 45°C
just before distributing i nto bottles or tubes prior to autoclaving.
(c) Sabouraud Broth.
Neopeptone (Difco) Dextrose DW
1 0g 20g
1 000ml
(d) "Takashio" Medium (Diluted Sabouraud).
This has the same components as SDA but is based on 2% dextrose (Georg, 1 959; Vanbreuseghem, 1 978), less peptone and is enriched with 0.1 % salts. The composition of "Takashio" medium used in this study was:
61

1 /8
Dilution
Neopeptone (Difco) 1 .25g
Dextrose 2.50g
MgS04.1H20 1 .0g
KH2P04 1 .0g
Agar 20.0g
DW 1 000ml
(e) Oat-meal Salt Agar.
MgS04.1H20 0. 1 g
KH2P04 0.5g
NaN03 1 .0g Oat-meal 1 0.0g Agar 1 0.0g Water 1 000ml
pH was adjusted to 5.6 before autoclaving.
(f) Guizotia abyssinica (Niger seed) Agar with Salts.
G round G. abyssinica
MgS04.1H20 KH2P04 Agar
DW
7.5g 1 .0g
1 .0g
20.0g
1 000ml
62
1 /1 0
Dilution
1 .0g 2.0g 1 .0g
1 .0g 20.0g 1 000ml
G. abyssinica seeds were ground in a coffee grinder, transferred to a 1 L
Erlenmeyer flask and 500ml water was added. The suspension was
heated in a boi l ing water bath for 30 min . , the g round seed filtered through a cheese cloth and the extract adjusted to 500ml with distilled water. Agar and the salts were added and the medium boiled to dissolve the agar.
All media were autoclaved at 1 20°C for 20min.

63
2.1 .2 1solation of Keratinophilic Fungi from Soil.
2.1 .2.1 Collection of Soil Samples.
A total of 236 su rface soi ls we re co l lected from d i fferent sites i n Palmerston North between 7.90 and 4.91 . The soil samples were from areas which can be placed into five groups, namely ; (a) recreatio nal
parks (b) school g rounds (c) animal paddocks (d) wasteland (within
residential areas) and (e) roadsides.
The surface debris was cleared and the soi l up to about 1 Ocm deep scooped into a plastic bag to an amount between 1 50-200g. The location of the site was noted at the time of collection. The bags were taken to the
laboratory for processing. If the samples could not be processed the same day, they were stored at 4°C until the next day.
The pH of 200 soils was measured by placing 1 Og of soil in 50ml of double distil led water (DOW) in a 1 25ml Erlenmeyer flask. The soil was swirled and allowed to settle for 5 to 1 0 min. before measuring the pH using an Orion Research Digital lonalyser pH meter (Watson Victor Ltd. ,
New Zealand).
2.1 .2.2 The Keratin-baiting Technique.
Each sample of soil was mixed wel l in the bag and s maller duplicate
samples, approximately 50g each, were placed into empty sterile Petri dishes and baited with sterilised natural wool , cut into small pieces.
One Petri dish was moistened with 5-1 Oml of sterile distilled water (SOW)
o n ly and the second with SOW contai n i ng antibiotics act id ione (cycloheximide) 500mg/ml and chloramphenicol 50mg/ml.
All baited samples were incubated at 25°C in the dark and moistened at
intervals of 3-4 days to prevent the soil from drying. The plates were inspected daily for up to 5 weeks before being discarded.
The presence of kerati nophi l ic fungi was confi rmed by low power . m icroscopic e xa mi nation and frag m e nts of co lon ised woo l we re

64
i nocu lated onto slopes of SDA contain ing antibiotics . These were incubated for 2 weeks at 25°C.
The term "keratinophilic" in this part of the study is defined as applying to those fungi able to grow on and be isolated from the keratin bait by
culturing on SDA with antibiotics.
2.1 .3 Isolation of Keratinophilic Fungi from cats and Dogs.
2.1 .3.1 The Hairbrush Technique.
A total of 1 65 cats and 53 dogs from the Society for the Prevention of
Cruelty to Animals (SPCA) premises, Palmerston North were sampled between 1 1 .90 and 9.91 . Further hairbrushes were obtained from two veterinary clinics located in Palmerston North.
The animals were sampled with a plastic brush (Fig.3-6) (Nu-brush NQ2, Consol idated Plastics Ltd . , Auckland) · over the back, shou lders , hindquarters, legs and tai l . After brushing the animal, each brush was
kept in a separate plastic bag and returned to the laboratory.
The brushes were inoculated the same day on SDA contain ing antibiotics
by pressing the bristles i nto the medium. When necessary, hairs were
picked off with a sterile loop (bent at an angle of 45°) and inoculated into the agar surface. The plates were incubated at 25°C in the dark for up to
3 weeks. The term "keratinophilic" in this part of the study is defined as
applying to those fungi able to be isolated from the brush samples by
culturing on SDA with antibiotics.
The used brushes were steri lised by immersing i n 0. 1 o/o chlorhexidine
("Hibitane" - I.C. I . (New Zealand) Ltd., Wellington) solution for 24 hours before cleaning with hot water. Any residual hairs were picked off by forceps. After drying the brushes, they were further steri lised under
ultraviolet (U.V.) light for 30 minutes and placed in new plastic bags until
required for reuse.
Occasionally brushes were checked for the effediveness of the cleaning
. · process in destroying fungal fragments and other microorganisms on the

65
brushes by inoculating steri l ised brushes onto SDA. All gave negative
results.
2.1 .3.2 Other Sources.
In addition to isolates obtained by the hairbrush technique, 22 cultures of M. canis obtained from clinical cases were submitted from the Faculty of Veterinary Sciences, Massey University.
2.1 .4 Identification.
I n general, keratinophi lic fungi were identified on the basis of their colonial and microscopic morphology on SDA. Identification of fungi by
microscopic examination was based on the morphological characteristics
of macro- and microconidia and the appearance of the mycelium.
After the primary cultures of M. canis and M. cookei were isolated, they were subcultured onto "Takashio" medium ·( 1 /1 0) , to stimulate increased production of macro- and microconidia for confirmation of identification.
The texts consulted for the identification of the fungi reported in this study i ncluded Alexopoulos and Mims ( 1 9 79) , Barnett and Hunter ( 1 972) ,
Barren ( 1 968), Carmicheal (1 962), Evans and Richardson (1 989), Rebell and Taplin (1 978) and Rook et al. , (1 968).
2.1 .5 Determination of Mating Type.
2.1 .5.1 Strains.
A. simii "+" (MY036.84) and "-" (MY037.84) tester strains were obtained from the New Zealand Communicable Disease Centre (NZCDC) and N. otae "+" ( RV42487) and "-" (RV42488) from the Mycology Laboratory,
Prince Leopold Institute for Tropical Medicine, Belgium. The mating type of the two N. otae tester strains was assigned on the basis of their
reaction with "+" or "-" A. simii strains.

66
2.1 .5.2 Culture Media.
Three different media were tested for mating studies, namely; oatmeal
salt agar (Weitzman and Si lva-Hunter, 1 967) , G. abyssinica with salts agar (Takashio and De Vroey, 1 976) and "Takashio" medium ( 1 /8 and
1 /1 0) (Takashio , 1 970). M. canis reacted better on 1 /8 while M. cookei isolates reacted better on 1 /1 0 "Takashio" medium. These two media were therefore used in al l the mating studies with the two Microsporum
species.
2.1 .5.3 Determination of Mating Type using the Stockdale
Technique.
Isolates of M. canis and M. cookei were paired about 1 cm apart with the tester strains of A. simii "+" and "-". The mating type was assigned based
on the hyphal stimulation obtained between the Microsporum isolates
and either "+" or "-" A. simii. The incubation period was between 3 to 5 weeks.
Mating type of the M. canis isolates was confirmed by pairing with the tester strains of N. otae. M. cookei isolates designated '+' and "-" were paired with each other using all possible combinations.
2.1 .6 Maintenance of Cultures.
Three methods were used for maintaining cultures:
2.1 .6.1 Subcultures.
The isolates were maintained on slopes of "Takashio" medium ( 1 \1 0) in universals and stored in the dark at room temperature . The y were
subcultured approximately every 3 months. Almost all the cultures were ab le to be mai ntained morpholog ical ly stable. Before the m at ing e xp e ri m e nts and ot h e r stud i e s , i so lates were rejuven ated by
subculturing.

67
2.1 .6.2 Water Cultures (Castellani, 1 963).
The isolates were subcultured on slopes of "Takashio" medium ( 1 /1 0) to
increase spore production. After 2 weeks the cu lture was flooded with
4ml SOW. The water was pipetted rapidly to dislodge the spores, but
care take n not to disrupt the agar su rface . The suspension was
transferred to a bijou bottle, capped and sealed with parafi lm (American
National Can.) . Storage was at 4°C.
2.1 .6.3 Lyophilisation. ·
Microsporum isolates to be lyophil ised were subcultured on "Takashio"
medium (1/1 0) in Petri dishes. Five vials for lyophilisation were prepared.
20% steri le skim-milk (0.2ml) was introduced into each steri le freeze
drying vial plus a labelled piece of paper identifying the isolate by a code
and the fungal suspension i ntroduced. The vials were closed with a
cotton plug and placed in a vacuum machine (Edwards High Vacuum,
Gee. W. Wilton & Co Ltd. , Auckland) under 0.1 torr for 6 hours (to
remove the water from the milk). After 6 hours, secondary freezing was
for another 2 hours and the vials sealed under vacuum.
The lyophi lised samples were randomly checked for viabi lity soon after
freeze-drying and after 6 to 1 0 months. The cultures were stored at 4°C.
2.1 .7 Proteinase Production In Broth Cultures.
2.1 .7.1 Shake and Stationary Cultures.
Cultures for proteinase e nzyme p roduction were g rown i n steri le
Sabouraud broth . The medium was dispensed in 1 OOml amounts into
250ml Erlenmeyer flasks for shake cultures and in 50ml amounts in
300ml bottles for stationary cultures before sterilising.
Spore suspensions were prepared as for water cultures (Section 2. 1 .6.2).
1 OOJ!I of well agitated suspension was the standard inoculum for 1 OOml of
l iquid broth and 50J.tl for 50ml broth. The inoculated broth media were
. i ncubated at 25°C (±0.5) in the dark for 2 weeks. The shake cultures
were incubated on a continuous orbital shaker at 1 40 rpm�

68
2.1 .7.2 Estimation of Oxygen Concentration In Cultures.
The oxygen concentration in 2 weeks shake and stationary cultures was
measured using a calibration method following the protocol described by
Chick (personal communication, 1 993).
The method for calibrating the oxygen electrode involved a procedure
using the reaction between sodium dithionate and dissolved oxygen
which goes virtually to completion.
5ml of liquid broth equilibrated with air at 25°C was added to the reaction
vessel. The oxygen probe was inserted into the reaction vessel and the
stirrer turned on. The chart recorder pen (Sekonic; SS-250F) connected
to an oxygen monitor (VS I model 53) was set to 98% full scale deflection.
When a steady trace was obtained, about a "pinch" of sodium dithionate
was added and the electrode probe replaced. After a few minutes a new
steady trace was obtai ned wh ich corresponded to a zero oxygen
concentration.
The process was repeated for uninoculated culture broth.
The calibrations for both DDW and culture broth were very similar. Since
the oxygen in water equil ibrated with air at 25°C is 0.258JJ.moles mr 1 , the
concentration of oxygen in culture broth equilibrated with air at 25°C was
taken as 0.258JJ.moles mr 1 .
The concentration of oxygen in the test broth was therefore taken as:
0.258 x the vol. of sa!11)1e x chart divisions sa!11)1e ---------------J.lfllOieS of oxygen.
chart divisions control

69
2.2 BIOCHEMICAL ASSA VS FOR PROTEOLYTIC ENZYMES.
2.2.1 Gelatin-Agar Plate Method.
The method of Frazier ( 1 926) was used to screen relative proteinase liberation by isolates.
Reagents.
Solution A.
5g sodium chloride, 0.5g potassium dihydrogen phosphate and 1 .5
dipotassium hydrogen phosphate were dissolved in 1 OOml distilled water.
Solution B.
4g gelatin and 0.05g dextrose dissolved in 400ml distilled water plus Sml 0.8% nutrient broth (Difco).
The two solutions were mixed together and heated. 3% agar was added and the pH adjusted to 7.0 before autoclaving.
Medium at 25mVplate was dispensed by a Petrimat (Struers, Denmark). Duplicate plates were inoculated for each isolate and i ncubated at 25°C
for 7 days.
After 7 days incubation the plates were flooded with 5 ml of a solution of 1 5g mercuric ch loride dissolved in 20ml HCI (cone.) and 1 OOml water. The mercuric chloride was left for 1 5 min. to precipitate the undigested gelatin. A clear zone around the colony appeared surrounded by a cloudy
precipitate of undigested gelatin. The remaining mercuric chloride was washed from the plate with water.

70
2.2.2 Azocollytlc Assay.
Estimation of proteolytic activity (protei nase) using azocoll was a
modification of the method of Waiter (1 984) and Sarath et al. ( 1 989).
Release of dye from 250J.LI of 2% azocol l (cowhide with a red dye attached) s uspended in 50mM Tris/HCI , pH 8 .0 , was tested with duplicate aliquots of each Microsporum i solates. Preliminary studies with some earl i e r o btai ned strai ns had i nd icated that the assay was reproducible between the different experimental trials. Fungal mycelium and spores were separated by centrifugation from Sabouraud broth cultures at 1 3000 rpm for 7.5 min .. 1 50J.LI of the supernatant was added
to the azocoll suspension to start the reaction. A reagent blank with 250J.LI azocoll and 1 50J.LI 50mM Tris/HCI buffer, pH 8.0 instead of broth was
included to monitor if the substrata was "bleeding". A blank consisted of
50mM Tris/HCI buffer, pH 8.0 and 1 50J.LI of boi led broth.
Incubation was at 37°C in a shaking wat�r bath for 60 min. for both M. canis and M. cookei. After incubation the reaction was stopped with
1 .2 m l of 1 0% tr ich lo roacetic acid ( TCA) which precipitated the unhydrolysed protein. The reaction mixture was left for 5 min. to ensure complete precipitation and the tubes centrifuged at 1 3000 rpm for 7.5 m in . to pe l let the u ndigested prote i n . The absorbance (A) of the s u p e rnatant was read at 520 n m u s i n g a S h i m adzu U V- 1 60A spectrophotometer. For this method, proteolytic activity was defined
according to Waiter ( 1 984), where one unit is the amount of e nzyme
which catalyses the release of azo dye equal to 0 .001 m in-1 with the catalytic concentration (proteinase units) in the sample being (1 o3to.2 x Al t)PU mr1 .
2.2.3 Elastinolytic Assay.
The method of Lowry et al. (1 951 ) was used for protein estimation. The
final colour is produced as a result of (a) biuret reduction of protein with copper ions i n alkali and (b) reduction of the phosphomolybdic reagent by
the tyrosine and tryptophan present in the biuret protein.

71
Reagents.
1 . Reagent A, 2% Na2C03 in 0.1 M NaOH.
2. Reagent 8, 0.5% CuS04.5H20 in potassium (or sodium) tartrate.
3. Reagent C, alkaline copper solution - mix 50ml of reagent A with 1 m l of reagent 8 (prepared fresh).
4. Reagent 0, Folin-Ciocalteau reagent (Merck, 61 00 Darmstadt). 30ml Folin solution diluted with 60ml DDW, prepared just before use.
Assay.
The method of Gazzinel l i and Pe l legrino ( 1 964) was used to assay protein degradation by e lastase e nzymes. E lastino lytic activity was determined i n duplicate by incubating 1 50�1 of the supernatant from a
centrifuged Sabouraud broth culture with 200mg/ml of e lastin (Sigma) suspended in SOmM Tris/HCL, pH 8.0. The assay was at 37°C in a water bath for 60 min .. A blank reagent consisted of 2ml elastin with 1 50�1 of
SOmM HCL.
After incubation, the reaction was stopped by adding 3ml ice-cold distilled
water and the mixture centrifuged at 30000 rpm for 20 minutes at room temperature.
Colour Reaction.
For the colour reaction, 1 .0ml of supernatant was mixed with 1 .0ml of
reagent C and left for 1 0 min. at room temperature. A negative colour
blank reagent was 1 .0ml of water. A positive colour reagent consisted of 1 .0ml of O.SM tyrosine dissolved in 0.2M HCL
The colour was developed by adding 1 00�1 of the Fol in-Ciocalteau
reagent D . The mixture was left for a min imum of 30 m i n. at roo m
tempe rature for t h e colour t o deve lop. Absorbancy represent ing solubilised e lastin was measured at 660nm and expressed as �g mr 1 .
Calibrat ion was carried out using 1 .0�g/ml to 20.0�g/ml samples of
tyrosine .
. Preliminary studies had indicated reproducibility of the assay.

72
2.2.4 Keratlnase Assay.
Keratin degradation was assayed in duplicate fol lowing the method of Apodaca and McKerrow (1 989a. 1 989b, 1 990) using kerat in azu re (S igma) , a dyed wool product . 1 OOJ.LI of the supe rnatant fro m a centrifuged Sabouraud broth culture was incubated at 37°C with Smg of keratin suspended in 50mM Tris/HCL buffer, pH 8.0 for 72h .. The final reaction volume was 1 ml. After incubation, the reaction was stopped by
immersing the tubes in ice-cold water for 1 0 min .. The tubes were spun i n
a microfuge fo r 1 0 m inutes at 1 3000 rpm . The deg radat ion was measured by determining the A595 of the supernatant using a Shimadzu UV-1 60A spectrophotometer. A change of 0.01 As95 units per hour was equal to 1 unit of keratinase activity (KU mr1 ) .
2.2.5 Characterisation of Microsporum Enzymes.
Fungal culture filtrates of M. canis (WG09) and M. cookei (H21 9) were used for inhibition studies. First a range of inhibitor concentrations were tested to arrive at an optimal inhibitory concentration for each. Stock solutions of the inhibitors were dissolved i n the solvents listed in Table
2-1 .
1 , 1 0-phe nanthrol ine (PT), pepstatin (PEP) and L-trans-epoxysuccinyl leucy lam ido (4-g uan id ino ) -butan e ( E-64) were stored at -20°C ; phenylmethylsu lfonyl fluoride (PMSF), ethylenediaminetetraacetate (EDTA), p-chloromercuric acid (pCMB) and a-1 -proteinase (a1 -P) at 4°C.
Iodoacetic acid (IAA) was prepared fresh just before the experiment.

Inhibitor
a1 -P
PMSF PT EDTA pCMB E-64 IAA PEP
Table 2-1 : Inhibitor concentrations.
Solvent /Buffer
Concentration
M.canis M. cookei
0.1 M P04 buffer 0.2mM 0.4mM O.SM NaCI, pH 7.5
ethanol 1 00J.Lgmr1 1 00J.Lgmr1
methanol 20mM 20mM DW 20J.LM 1 0J.LM 0.2M NaOH/HCL 1 J..LM 1 J..LM DW 0.01 mM 0.02mM DW 20mM 20mM methanol 1 .0mM 1 .0mM
73
For inhibition assays, the appropriate inhibitor was pre-incubated with 1 50J.LI of culture filtrate for 20 minutes at 25°C. To start the readion, the substrata was added to the assay mixture. The readion was carried out at 37°C for 1 hour. An equal volume of the solvent for each i nhibitor
alone was also tested with the culture broth without substrata. Inhibition
was calcu lated re lat ive to the so lve nt controls after est imat ing absorbancy at 520nm for azocoll and 660nm for elastin.

2.3 PROTEINASE ASSAYS USING 505-SUBSTRATE
COPOL YMERISED GELS.
74
The general proteinase and e lastase activity of shake and stationary cu lture fi ltrates (from Sabouraud broth cultu res) were assayed using sodium dodecyl sulphate-polyacrylamide gel e lectrophoresis. The gels
were copolymerised with e ither ge lati n for proteinases or e lastin for e lastases. This allowed the determination of the number of proteolytic and e lastino lytic "species" present i n the fi ltrate. This procedure is
sensitive enough to deteCt proteinases of less than 1 OJ.LI of unconcentrated medium or lysate (Banda et al. , 1 987).
Several pre lim inary determinations were made using resolving gels
containing 1 0%, 1 1 % and 1 2% acrylamide (see Table 2-2) for both shake and stationary filtrates. 1 0% and 1 2% gave reasonably good resolutions of proteolytic and elastolytic enzymes for both.
2.3.1 Reagents and Solutions.
(a) Acrylamide Solutions.
(i) Resolving gel
Acrylamide 30g Methylene bis acrylamide 1 g Distilled water (DW) 1 OOml
(ii) Stacking gel
Acrylamide 30g Methylene bis acrylamide 1 .6g DW 1 00ml
The acrylamide solutions were prepared by adding the acrylamide to 70m l of DW and sti rring to d issolve. Methylene bis acrylamide was
dissolved in this solution and the whole made up to 1 OOml with DW.

75
(b) Buffer Solutions.
(i) Lower gel buffer (1 .5M Tris-HCL, pH 8.8, 0.4% SOS)
Tris 1 8. 1 5g
DW 70ml
Adjust with HCL to pH 8.8
1 0% SOS solution 4.0ml
DW to 1 00ml
(ii) Upper Gel Buffer (O.SM Tris-HCI, pH 6.8, 0.4% SOS)
Tris 6.0g
DW 70ml
Adjust with HCL to pH 6.8
1 0% SOS solution 4.0ml DW to 1 00ml
For both gel buffers, Tris was dissolved in 70ml OW and then adjusted to
the required pH with HCL. 4ml of 1 0% SOS solution was then added and the solution made up to 1 OOml. These buffers are 4x the normal working concentration.
(iii) Reservoir (Running) Buffer (pH 8.3)
Tris
G lycine 1 0% SOS solution DW
6.07g
28.8g
20ml 2000ml
No adjustment of pH is required for the buffer (to maintain optimal ion concentration for electrophoresis).
(iv) Initiator (1 0% ammonium persulphate)
Ammonium persulphate 0.1 g DW 1 ml
A fresh solution was prepared daily.

(v) Sample buffer
Sucrose SOS Bromophenol blue (BPB) 0.5M Tris-HCL, pH 6.8
1 g 2.5g
0.005g 1 00ml
76
The chemicals were dissolved in 50ml, 0.5M Tris-HCL, pH 6.8 and then
made up to 1 OOml.
(vi) Buffer for Standards (Molecular weight markers)
DW 4.0ml 0.5M Tris-HCL, pH 6.8 1 .0ml Glycerol O.Bml 1 0% (w/v) SOS 1 .6ml �mercaptoethanol 0.4nil 0. 1 % (w/v) Bromophenol blue 0.2ml
(c) Stain stock (1% Coomassle Blue R-250)
Coomassie blue R-250 DW
2.0g
to 200ml
Stain (0. 1 25% Coomassie Blue R-250, 50% methanol, 1 Oo/o acetic
acid) :
Coomassie Blue R-250 Methanol
Acetic acid
DW
62.5ml stain stock 250ml
50 m I
500ml
After dissolving the dye in DW, the solution was filtered before use.

n
2.3.2 Preparation of Gels.
(a) Resolving gel.
Soluble elastin (Elastin Products) and ge latin (Sigma, Bovine skin : type B) were each dissolved i n water at a concentration of 0 . 1 % which i n
prel iminary runs was found to give optimum enzyme zones on the gel when stained. This is approximately 5x the normal working concentration. In the case of gelatin , dissolving was assisted by heating for 45 seconds
in a microwave.
For gels of 1 0% and 1 2% acrylamide, the stock solutions stored at 4°C
were mixed in a 250ml Erlenmeyer flask as in Table 2-2. After adding all
the chemical solutions, the flask was swirled to evenly mix the chemicals but at the same t ime avoiding formation of air bubbles. The mixing ensured even polymerisation. The yet unpolymerised acrylamide solution
was poured i nto the mould (approxi mate ly 25mi/O . 75m m thick ge l , P roteanRI I X I Ce l l Apparatus, Bio-Rad) using a 5ml pipette. Bubble formation i nside the ge l was avoided duri ng pouring. The acrylamide
column was overlayed carefu l ly with DW, to prevent d i rect contact
between unpolymerised gel and the air, to create anaerobic conditions to
allow complete polymerisation. Polymerisation took about 45 min . .
(b) Stacking gel.
Before use, the Laemmli (1 970) stacking gel around a 1 5 well comb was prepared. The solutions were mixed as in Table 2-2. The DW on the resolvi ng gel was decanted and 1 ml of unpolymerised stacking gel
poured on top and rocked several times to remove any water still on top
of the resolving ge l. This al lowed the stacking gel to adhere to the
resolvi ng gel. Fresh stacking gel solution was then added to fil l the remaining upper surface. A comb was pushed (to cast the wells) between the plates i nto the stacking gel and left to polymerise for about 20 minutes.
After polymerisation, the comb was removed, the wells rinsed with water and the apparatus assembled ready for running.

Table 2-2: Recipes for gel preparation using SOS-Discontinuous buffer system.
Resolving gel (pH 8.8)
Final Acrylamide cone"
Lower Tris buffer, pH 8.8
Upper Tris buffer, pH 6.8
Acrylamide
Distilled water 0. 1 % Gelatin or Elastin Ammonium persulphate2
TEMED3
Total Volume (Approx.)
1 . Methylene bls Acrylamide
30% Acrylamide 1 % bis Acrylamide 1
7% 1 0%
ml ml
1 0.00 1 0.00
9.40 1 3.40 20.60 1 2.60
4.00 4.00. 0.20 0.20 0.02 0.02
40.00 40.00
2. Fresh 1 0% solution in double distilled water
3. N ,N ,N 1 ,N 1 - Tetramethylethylenediamine
1 2%
ml 1 0.00
1 6.05 9.90
4.00 0.20 0.02
40.00
Stacking gel (pH 6.8)
30% Acrylamide
1 .6% bis Acrylamide 1
4%
ml
2.50
1 .30
6. 1 5
0.05 0.01
1 0.00
-....J CD

79
2.3.3 Sample Preparation and Electrophoresis.
Culture fi ltrate was separated from mycelium by centrifugation at 1 3000
rpm for 5 min . at 4°C. A 75JJ.I aliquot of fi ltrate was mixed with 25JJ.I sample buffer (3:1 ratio}. Aliquots of 20J.LI were loaded for the gelatinase
assay, and 60JJ.I for the elastase assay, using a Hamilton micro-syringe
(Hami lton Company, Reno , Nevada 8951 0} . I n it ial ly, several well loadings of the diluted culture filtrate were tried ranging from 5JJ.I to 80JJ.I.
Of these, 20JJ.I gave the opt imum band intensity and resolution fo r
gelatinase and 60JJ.I for elastases. The micro-syringe was rinsed in tank (reservoir} buffer in between each loading. The gels were run at 4°C to reduce e nzyme i nte ract ion with the substrata , m i n i m ise enzyme denaturation and al low more accurate separation by molecular weight. The gels were run at 20mA/gel. The bromophenol b lue (BPB} i n the
sample and standard buffers allowed the progress of electrophoresis to
be monitored. Electrophoresis was performed until the dye reached about 1 to 1 .5cm from the bottom (between 4 to 4.5 hours}.
Trypsin positive controls (1 OJJ.I of 0.001 mg/ml di luted 1 to 250JJ.I with sample buffer} were included on the gelatin/50S-PAGE runs. Elastase (type I from porcine pacrease; Sigma} positive controls were i ncluded on
the elastin/50S-PAGE runs.
2.3.4 Developing the Gel.
After e le ct rophoresis was com plete, the proteins were al lowed to
renature by removing the S OS. This was accomplished by soaking in 2 .5% (w/v) triton X-1 00 with gent le shaki ng for 60 mi n . at roo m
temperature.
The gel was then ri nsed with 50mM Tris-HCL, pH 8.0 buffer and incubated in fresh buffer with gentle shaking overnight. At the e nd of incubation the gel was fixed in 1 OOml of 50% TCA for 60 min .. After fixi ng , TCA was rem oved using a vacuum aspi rator. The aspirator
facilitated the change of solutions with minimal contact with the gel. The gel was then stained using 1 OOml of coomassie blue R-250 solution for
60 min .. Excess stain was removed with a mixture of 45% (v/v) methanol, 1 0% (v/v) acetic acid and water for 20 min .. At the end of destaining the

80
gel was transferred into disti l led water. The areas containing enzymes
showed as clear zones against a blue background.
2.3.5 Gel Scanning.
A gel scanner model 1 31 2 ( ISCO, Inc. , Box 5347, Lincoln, Nebraska 68505, USA) was used on automatic mode (a dual beam mode using a
reference wavelength outside the major absorbance region for colour
stained gels). Automatic mode provided improved sensitivity, with the ability to ignore variations (e.g. changes in thickness and cracks)
Operating conditions were:
Sl i t apertu re 0 . 1 5mm x 3.3mm l inear scan n i ng mode ; scan speed
1 50cm/hr; wavelength f i lter 580nm ; sensitivity 0.2 ; ca l ibration 4 .5 ; coarse adjustment 6 or 7 and rise time 2.5 seconds.
Gel scanning was performed on:
(i) A coomassie blue stained column only.
( i i ) Trypsin columns for the fi rst ge ls for both shake and stationary
culture fi ltrates. ( i i i ) The columns representing different Microsporum isolates (normally
1 0 isolates per SOS-PAGE).
2.3.6 Gel Photography.
For a permanent record, the gels were photographed on an i lluminated
opal-white screen. The gels were positioned in place with care to avoid
breakage and to avoid trapping air bubbles. All coomassie blue R-250 stained gels were photographed using a standard procedure after i nitial i nvestigation for opt imum contrast. The film used was Tech/Pan, black
and white.

2.4 MUL TILOCUS ENZYME ELECTROPHORESIS USING STARCH
GELS.
2.4.1 Preparation of Mycelial Homogenates.
81
The mycelial growth was separated from the liquid broth using Whatman N111 fi lter paper. The operation was conducted at 4°C in a cold room. For enzyme ext ract ion the myce l ium was t ransferred to a mortar and i mmediately f roze n with l iquid n it rogen. The f rozen mycel ium was crushed to a fi ne powder with a pestle and the homogenate subdivided into approximately 1 .5g quantities and placed in eppendorf tubes. These were stored at -70°C u nt i l requ i red for e lect rophores is . At th is
temperature, the homogenates could be stored for up to 1 month without
significant loss of enzyme activity.
2.4.2 Enzyme Extraction.
The enzymes were extracted from the homogenate by adding SOOJ.LI buffer (SOmM Tris-HCL, pH 7. 1 ) (Micales et al. , 1 986) to the 1 .5g quantities of freeze-dried material before thawing (500J.LI sample buffer was found to not di lute the enzyme extract below detection level). The
samples were allowed to thaw at room temperature, and the mycel ial debris separated by centrifugation at 1 3000 rpm for 5 min. at 4°C.
2.4.3 Enzyme Selection. .
Initially using a few extracts of both M. canis and M. cookei, 28 different enzymes (see appendix C) were tested for their ease of detection and the suitabi lity of buffers. Eight e nzyme systems were final ly chosen. These screening experiments helped i n determining the active enzyme
systems in the two species and the buffers which provided optimal
resolution for each enzyme system. The remaining e nzyme systems were difficult to demonstrate with satisfaction , either because of poor stain ing or because of difficulty in finding suitable buffers.
The enzymes selected, their names, symbols and Enzyme Commission
( E C ) n u mb e rs as recom m e nded by t h e I nternat i o na l U n i o n o f Biochemistry ( IUBNC, 1 984) are listed i n Table 2.3.

Table 2-3: List of enzymes, abbreviations and enzyme
commission (E.C.) code.
Enzyme Symbol EC Number
1 . Catalase CAT 1 . 1 1 . 1 .6
2. Esterase EST 3. 1 . 1 .-
3. Glucose-6-phosphate
dehydrogenase G6P 1 . 1 . 1 .49
4. Glucose-6-phosphate
isomerase GPI 5.3. 1 .9
5. Leucine aminopeptidase LAP 3.4 .1 1 . 1
6. Malate Dehydrogenase MOH 1 . 1 . 1 .37
7. Peptidase PEP 3.4.- -8. Peroxidase PER 1 . 1 1 . 1 .7
2.4.4 Starch Gel Apparatus.
82
The starch gel apparatus was locally constructed equipment. lt consisted of a cooling platform made of aluminium raised to the level of the buffer
trays (height =6.4cm) using a block put at the bottom of the aluminium cooler. The platform contained convoluted pipes through which cooled
water at 4°C was pumped using a multiTemp thermostatic circulator (LKB
B ro m ma) . Th is p rov ided co nt i nuous coo l i n g of t h e g e l d u ri ng
electrophoresis of the enzymes. The equipment was operated at room temperature.
2.4.4.1 Preparation of Gels.
The starch gels used in this study were al l at 1 2% and were prepared with 36g of refined starch (Starch Art Carp, Box 268, Smithvil le, Texas 78957) per 300ml buffer. The starch was weighed and placed i n a 1 L
Buchner flask to which 90ml of the gel buffer was added along the side of

83
the flask. The suspension was vigorously swirled until the mixture was
free of lumps and swirled continuously to prevent the starch from settling
down. The remaining gel buffer was meanwhile heated to boi ling in a
500ml Erlenmeyer flask using a microwave. The gel buffer was heated for 3 or 3.5 min .. The boiling gel buffer was fi rst swirled to release steam
and then rapidly poured i nto the Buchner flask containing the starch suspension. The hot starch suspension was vigorously swirled u nti l it
was evenly mixed. The suspension was heated in a microwave for 30 or
40 seconds to d issolve the starch . The starch solut ion was then degassed for about 20 to 30 seconds to remove air bubbles, using a
vacuum water aspirator. A rubber stopper with one glass tube was tightly placed into the mouth of the flask and the vacuum hose attached to the tube. A finger t ip covered the side opening of the Buchner flask, so
controll ing the operation of the vacuum. Vacuum was applied unti l all small bubbles were removed from the starch solution and large bubbles
distributed un iform ly in the mixture . The vacuum was then released slowly to stop the formation of further air bubbles.
The solution was poured onto a mould in the centre and into the corners and then gently rotated on the bench to spread the starch evenly over the mould. The moulds were made from glass with perspex for the ridges (dimension 1 3cm x 26cm x 0.6cm). Air bubbles were removed before the
starch solidified. The mould containing the starch was left for 60 min. on the aluminium platform cooler. After 60 min. cooling, the starch gel was ready for runn i ng. Al l the moulds were "washed" inside with a cloth
moistened with 2% (v/v) dichlorodimethyl silane in carbon tetrachloride to
prevent the gel sticking to the bottom of the mould. Although some
authors (Murphy et al. , 1 990) recommend storing the gels at 4°C for next
day use, it was found that fresh gels made and used the same day gave
the best results.
2.4.4.2 Loading of Samples onto Gels.
An origin was cut using a scalpel blade and ruler across the width of the gel approximately 6cm from the cathode edge . The o rig in was cut
perpendicular to the gel surface and reached the bottom of the gel. The
cathodal part of the gel was partially separated from the origin to facilitate
placement of wicks soaked in the sample fluid.

84
Small filter paper wicks cut from Whatman N113 fi lter paper were used in this study (Fig.2-1 ). The size of the rectangular wicks were approximately
5-7 x 1 0-1 5 mm.
The wicks were soaked with 70�1 (except fo r ru ns using g lucose
phosphate isomerase, which was 50�1) of soluble fungal extract and placed vertically at the origin with the wick reaching the gel bottom. The samples were spaced with 2-3mm between each wick. A maximum of 1 2
wicks representing 1 0 different isolate samples, a positive control and a tracking dye were able to be loaded on one gel. The isolates chosen as positive contro ls acted as "standards" allowing comparison between different gels while the tracking dye was for monitoring the progress of
the electrophoresis. The composition of the tracking dye was amaranth 0.01 g, coomassie blue G 0.01 g dissolved in 2.5ml of ethanol and brought
up to 7.5ml with DW.
2.4.5 Electrophoresis.
After loading the samples, the 2 pieces of the gel (cathodal and anodal parts) were pushed together for a firm contact to allow free movement of the electrode buffer. E lectrophoresis was accomplished by passing
current through the gel using 2 electrode buffers wicked onto the gel surface with an absorbent , d isposable c loths (Handiwipe , Wettex,
Sweden) placed in the buffer trays (Fig.2-3). The cloths were thoroughly
washed after use by soaking overn ight and dried before reuse. The cloths were folded in 3 layers and the leading edge placed on the surface of the gel ensuring good contact between the cloth and the gel. The gel was then covered with thin plastic (Glad Wrap TM, Auckland) to prevent the gel from drying (Fig.2-2). The wires from the DC power supply were
inserted into each electrode buffer tray, with the cathode closest to the gel o rigi n . When power was switched on ge l voltage and current
adjustments were made to the required levels (Table 2-4 and 2-5). Periodic checks were made during electrophoresis and readjustments made when necessary. After 30 min. of electrophoresis, the current was turned off and the wicks removed. The gels were cooled by circulating
cold water at 4°C throughout the time of the electrophoretic run.

85
Fig.2-1 : Loading of samples on starch geL 1 , Whatman N°3 filter paper soaked with fungal extract and
placed vertically at the origin. 2, forceps. 3, gel is cut (origin) 6cm from the cathode. 4, 2-3mm spacing between each wick.
Fig.2-2: a layer of thin polyethene (Glad Wrap TM) is placed over the gel leaving at least 1 -2cm at each end.
Fig.2-3: Preparation of gel for electrophoresis.
1 , Plastic buffer dish is filled 2/3 full with electrode buffer
solution. 2, Platinum electrodes are placed in the buffer. 3,
Absorbent wick (Handiwipe) is placed in the buffer solution and
firmly placed to the surface of the gel. 4, The gel mould is raised
about 6.4cm using a wooden block placed beneath the g lass plate.

2
3
1

2.4.5.1 Electrophoretic Buffers.
Two procedures were employed during electrophoresis: (a) Continuous buffer electrophoresis or (b) Discontinuous buffer or multiphasic electrophoresis.
86
For all enzyme electrophoresis runs, fresh electrode and gel buffers were used.
(a) Continuous buffer system.
This uses the same buffer ions in the support matrix and the e lectrode bridge compartments, but at different concentrations. The continuous
buffer systems were of two types, namely Tris [hydroxymethyl]amino methane (BDH) (Tri s )-cit rate and Trisphosphate, at different concentrations.
Table 2-4: Buffers used for the continuous 'buffer system.
Enzyme Electrode buffer Gel buffer Run (V)
CAT Tris-citrate (pH 6.3) Tris-citrate (pH 6. 7) 8.24g Tris, 7.78g 0.73g Tris, 0.63g 200 citric acid monohydrate, citric acid monohydrate , 1 litre DDW, pH 1 litre DDW, pH adjusted with NaOH adjusted with NaOH
EST Tris-citrate (pH 7.0) Tris-citrate (pH 7.0)
1 6.35g Tris, 7.78g e lectrode buffer 1 50
citric acid monohydrate, di luted 1 :1 5
1 litre DDW, pH
adjusted with NaOH

87
Table 2-4 contd.
GPI Tris-citrate (pH 8.0) Tris-citrate (pH 8.0) 8.24g Tris, 7. 78g electrode buffer 1 30
citric acid monohydrate, di luted 1 :29
1 litre DDW, pH adjusted with NaOH
LAP Tris-citrate (pH 6.3) Tris-citrate (pH 6. 7)
27g Tris, 1 8.07g 0.97g Tris, 0.63g
citric acid monohydrate, citric acid monohydrate, 1 litre DDW, pH 1 litre DDW, pH 200 adjusted with NaOH adjusted with NaOH
MOH Tris-citrate (pH 6.3) Tris-citrate (pH 6. 7) 8.24g Tris, 7.78g o. 73g Tris, 0.63g citric acid monohydrate, citric acid monohydrate, 1 litre DDW, pH 1 litre DDW, pH 200 adjusted with NaOH adjusted with NaOH
PEP Tris-NaH2P04 (pH 7.4) Tris-citrate (pH 7.4) 1 2. 1 1 g Tris, 1 5.60g 1 :20 dilution of 200 NaH2P04, 1 litre DDW electrode buffer pH adjusted with NaOH

88
(b) Discontinuous buffer system.
This uses different buffer ions in the support matrix and electrode bridge compartments (Table 2-5).
Table 2-5: Buffers used for the discontinuous buffer system.
Enzyme Electrode buffer Gel buffer Run(mA}
G6P Borate (pH 8.5} Tris-EDTA (pH 8.5} 1 8.55g boric acid 4.6g Tris, 0.09g EDTA 1 litre DDW, pH 1 litre DDW, pH 40 adjusted with NaOH adjusted with 0.4M
citric acid monohydrate
PER Borate (pH 8.5} Tris-EDTA (pH 8.5} 1 8.55g boric acid 4.6g Tris, 0.09g EDTA 1 litre DDW, pH 1 litre DDW, pH 40 adjusted with NaOH adjusted with 0.4M
citric acid monohydrate
2.4.6 Slicing and Staining.
At the end of the electrophoresis, a piece of gel on the dye marker front
was cut away as an identifying mark and to indicate the dye front. The .
gel was then transferred to a plexiglass mould with 3mm ridges to slice
the gel i nto 2 pieces. The slicing wire, held tight between 2 ends of a
metal holder, was rested on the ridges and the slicer g lided through the gel gently at a constant speed. A downward pressu re was applied to
prevent raising the wire and to keep it taught.
At t he e nd of the sl icing., the two gels were peeled off and p laced in
staining trays.

89
Enzyme activity staining allowed the location of specific enzymes to be
revealed.
The sta in ing chemicals we re weig hed i nto label led 50ml or 1 OOml Erlenmeyer flasks as the gel was still running. When electrophoresis was
complete, the staining components were mixed together in a 1 50ml flask
and poured over the gel in the staining tray. The tray was shaken gently to allow maximum contact of the gel slice with the staining solution. The tray was then placed in the dark in an incubation room at 37°C on a shaker unti l the bands appeared. The incubation periods were different fo r the various e nzymes. I ncubat ion was i n the dark (except for
peroxidase and catalase) as the tetrazol ium dyes and the diazonium salts are sensitive to light (Vallejos, 1 983). The staining was stopped by discarding the staining solution followed by two to three washes with
water.
Since no one stain ing method can be used for al l the e nzymes, 3 different staining methods were used as listed in Tables 2-6, 2-7 and 2-8.
(a) Substrates, buffers and dyes used in the "chemical detection" method for EST arid LAP (Tables 2-6).
(b) Substrates, buffers and dyes used i n the Electron t ransfer dye
method for G6P and MOH (Table 2-7). (c) Substrates, buffers and dyes used in the Enzyme-linked method for
PEP and GPI (Table 2-8).

90
Table 2-6 : Substrates , buffe rs and dyes u sed i n the "ch e mica l detection" method for EST and LAP.
Enzyme Substrata compound
EST a-naphthyl acetate 40mg/4ml in 2ml, 50% acetone
LAP L -leucine-f}-naphthyl
amide hydrochloride, 1 OOJ.LI of 1 Omg/ml in
50% acetone
CA-ri hydrogen peroxide (33J.LV1 OOml)
PERii hydrogen peroxide (0.3%)
Buffer & salt
0.05M sodium phosphate pH 6.5 ( 1 OOml)
0.1 M potassium
phosphate, pH7.0 (50ml)
0.1 M MgCL2 (1 ml)
Dye
Fast blue B 50mg
Black K
30mg/ml
50:50 mix of
2% K3[Fe (CN)6]
2% FeCL3 1 % pyrogallol
( i ) The g e l s l ice was i ncubated fo r 1 5 m i n . i n 1 OO m l s o l u ti o n contain ing hydrogen peroxide. At the e nd of the incubation the solution was poured off and the gel rinsed with water and immersed in potassium ferricyanide/ferric chloride mixture unti l clear zones
appeared against a blue background. ( i i ) The g e l s l ice was i ncubated i n 1 % pyrogal lo l for 60 sec. , the
solutio n was d rained and the gel sprayed with 0 .3% (v/v) of
hydrogen peroxide and left for approximately 5-1 0 min. for the
enzyme zones to appear.

91
Table 2-7: Substrates, buffers and dyes used in the e lectron transfer dye method for G6P and MOH.
Enzyme Substrata Buffer Salt Coenzyme Dye compound (0.2M Tris/HCL)
Dehydrogenases:
G6P glucose-6-phosphate 50 m I, 0. 1 M NADP NBT
disodium hydrate pH 8.0 MgCL2 1 0 1 5mg/ml
(1 00mg) (1 ml) mg/ml PMS 5mglml
MOH 1 M DL -malic acid 1 00ml, 0.1 M NAD MTT 20mg
adjusted to pH 7.5 pH 7.5 MgCL2 30mg PMS 4mg with 1 OM NaOH (5ml)
MTT = Methyl thiazolyl tetrazolium; PMS = Phenazine methosulphate
NADP = Nicotinamide adenine dinucleotide phosphate ; NBT = Nitro blue tetrazolium; NAD = �-Nicotinamide adenine dinucleotide
Table 2-8: Substrates, buffers and dyes used in the enzyme-linked method for PEP and GP I.
Enzyme Substrata compound Buffer & salt Dye & coupling enzyme
PEP Peptide (8mg) 0.05M sodium 3A9EC Peroxidase (20mg) phosphate, pH 6.5 1 0mg/3ml Snake venom (1 Omg) (1 00ml) i n DMF
0. 1 M MgCL2 (0.5ml)
GPI 0-fructose-6-phosphate 0.2M Tris-HCL NBT 5mglml
40mg; G6PDH (3.8J.d) pH 7.0 PMS 5mg/ml
NAD (20mg/2ml) 0.1 M MgCL2 (5ml)
DFM = dimethyl formamide; 3A9EC = 3-amino-9-ethylcarbazole

92
2.4.7 Gel Fixation.
After staining and stopping the enzyme reaction, the gels were fixed i n 1 OOml of "wash".
The composition of the 2 fixatives were : (a) "Alcohol Gel Wash" (Sici liano and Shaw, 1 976)
Ethanol 1 OOOml Acetic acid 400ml Glycerine 200ml Water BOOm I
Total 2400ml
(b) Glycerine and Water (Vallejos, 1 983} Glycerine Water
Total
500ml 500ml
1 000ml
The "alcohol gel wash" fixative fixed the enzyme zone stains, toughened the gels and bleached out the background better than g lacial/methyl alcohol/water (5:5 :1 ) m ixture and 50% ethanol. The g lycerine/water
fixative was used for catalase and peroxidase isozymes. This fixative is only good at preserving the colour of the enzyme zones but does not toughen the gel. Following fixation, permanent records of the gels were
made on 35mm film (Kodak, T-MAX 1 00).
2.4.8 Safety Precautions.
Since the majority of the chemicals used for both SOS-PAGE and starch ge l e lect ro p h o res is a re very dang e rous and some a re potent ial carcinogens, care was taken when handling the chemicals. A weighing balance was placed in a fume cupboard for weighing and in all cases a face mask (Dust and Mist Respirators, Gerson, Middleboro, Mass-02346)
a.nd disposable gloves were worn.

93
2.5 Statistical Analyses.
The data concerning the fungal isolates from the soil and small animals was analysed for significant differences between the means using a t-test by SAS (SAS Institute Inc. , 1 988).
The data for enzyme expression by M. canis and M. cookei isolates for the two treatments (cont inuous shake and stationary cultu re) were
compared by the weighted mean using the inverse of the standard error (SE). This was performed using the statistical package, SAS (SAS Institute I nc. , 1 988) . The trends i n expression of the three enzymes (proteinase , elastase and keratinase) were analysed by the product moment correlation coefficient (Pearson corre lation matrix) using the statistical package, SYSTAT (Wilkinson, 1 989).
Phenotypic variation using isozyme data between isolates of the two species M. canis and M. cookei and i solates from the three reg ions (Auckland, Palmerston North and Wel l ington) was calculated as the
number of bands observed and frequency of occurence ( number of isolates with a given "band" per total number of isolates.
When calculating phenotype frequency, single-banded isozymes will give same percentages for e lectromorphs using R.f. values and phenotype
frequency. However, for multi-banded isozymes the R.f. values only allow to i nd icate the re lative mobi l ity but are not useful for calculating phenotype frequencies of the isozymes (Gaur et al. , 1 981 ; Hamrick et al. , 1 986)
2.5.1 Phenotypic Diversity.
Calcu lat ions of phenotypic d ivers ity was by the Shann o n-Wiener information measure (H = - L pi I n p1) (Lewontin, 1 972; Gaur, Ughtwardt
and Hamrick, 1 981 ; Vil leneuve et al. , 1 989 ; Magurran, 1 988; Grandtner and Fortin, 1 989 ; Anagnostakis, 1 992), using frequencies of isozymes, and normalised by H = H/Hmax (Sheldon, 1 969), in which H is the usual Shannon-Wiener diversity. measure over phenotypes, and Hmax is ln(N), the maximum diversity for the sample of size N and was performed by
the statistical package SAS (SAS Institute Inc., 1 988).

i·
94
Shannon and Wiener independently derived the function which has become known as the Shannon measure of diversity (Magurran, 1 988).
The log to the base 2 (=log2) is often used in calculating Shannon
Wiener diversity measures, although any log base may be adopted. The
log2 was used in th is study in part to al low comparison with other reported studies in the literature, since it is more widely used.
2.5.2 Apportionment of Diversity.
Total diversity (Hr) .of ' the M. canis isolates from Auckland, Palmerston N o rt h and We l l i ngton was appo rt ioned by calculat ing t he m ean phenotypic diversity for each region (sub-population) for each of the four enzyme systems from which the overall mean was calculated for the
within population diversity.
This allows to subdivide total phenotypic diversity (Hr) i nto diversity within populations (Hs) and diversity among populations (Dsr) using the the method of Nei (1 975) :
where :
Hr = calcu lated b y obta i n i ng t h e we ig hted average
phenotypic frequencies over all populations (H = -l: Pi log2 Pi) (refer 2.5. 1 )
Hs = the weighted ave rage over al l populat ions of the value H (-l: Pi log2 Pi) for each population
Dsr = obtained by subtraction
Differentiation among populations can be calculated as:
where Gsr can vary between o (Hs = Hr) and 1 (Hs=O, that is the
population is fixed for different phenotypes).
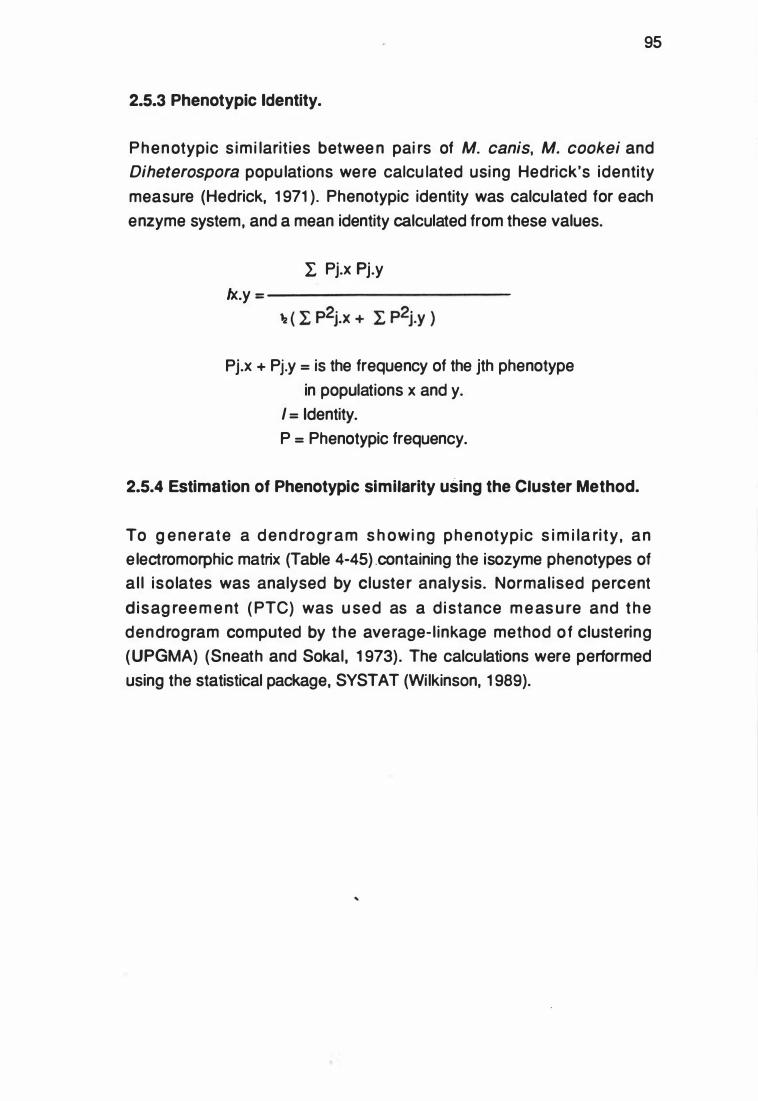
95
2.5.3 Phenotypic Identity.
Phenotypic s im i larit ies betwee n pai rs of M. canis, M. cookei and Diheterospora popu lations were calcu lated using Hedrick's identity
measure (Hedrick, 1 971 ) . Phenotypic identity was calcu lated for each
enzyme system, and a mean identity calculated from these values.
l: Pj.x Pj.y
lx.y =-----------
Pj.x + Pj.y = is the frequency of the jth phenotype
in populations x and y. I = Identity. P = Phenotypic frequency.
2.5.4 Estimation of Phenotypic similarity using the Cluster Method.
To g e ne rate a d e n d rogram s h owi ng phenotypic s i m i la ri ty , an e lectromorphic matrix (Table 4-45) .containing the isozyme phenotypes of a l l isolates was analysed by cluster analysis. Normalised percent
d isag ree m e nt ( PTC) was u sed as a d istance m e as u re and the dendrogram computed by the ave rage- l inkage method o f clustering (UPGMA) (Sneath and Sokal, 1 973). The calcu lations were performed using the statistical package, SYSTAT (Wilkinson, 1 989).

96
CHAPTER 3
RESULTS
3.1 KERATINOPHILIC FUNGI FROM SOIL.
3.1 .1 Frequency and Distribution of Genera.
Of the 236 soi ls sampled , the total numbe r of samples y ie ld ing keratinophilic fungi in culture on SOA with antibiotics following use of the keratin-baiting technique is shown in Table 3-1 . The application of the term "keratinophilic" is defined in methods Section 2. 1 .2.2.
Table 3-1 : Soil samples yielding keratinophilic fungi in culture. (n=236)
Growth *
Antibiotic SOW solution
1 37
58. 1 % 1 74
73.7%
*
Culture
No growth *
Antibiotic SOW solution
99 41 .9%
62
26.3%
= actidione & chloramphenicol.
Total positive samples
1 68
71 .2%
Of the soi ls collected from different sites, 2 1 0 (89%) showed fungal
colonisation by d i rect m icroscopy of the baits but only 1 68 (71 .2o/o)
produced fungal growth after portions of the bait were transferred to SDA with antibiotics. Culture of baits from soils moistened with antibiotic
solution produced 1 37 fungi and those moistened with water only, 1 74.
Table 3-2 shows the fungal genera isolated from both treatments.

97
Table 3-2: Fungal genera isolated from 236 soil samples by the keratin-baiting technique.
N11 isolations
Treatmenf Group •
Genus Anti b. I sol. Water I sol. soltn rate only rate
(%) (%)
Cephalosporium 0 0.0 5 2. 1 Chrysosporium + 2 0.8 5 2.1 Conidiobolus 0 0.0 1 0.4 Cladosporium 1 0.4 0 0.0 Cunninghamella 34 1 4.4 1 1 4.7 Diheterospora 1 1 4.7 "' 39 1 6.5 Fusarium 1 9 8.0 31 1 3. 1 Geotrichum 3 1 .3 0 0.0 Gliocladium 60 25.4 32 1 3.6 Microsporum + 1 1 4.7 1 2 5. 1 Mucor 1 0.4 0 0.0 Paecilomyces 35 1 4.8 65 27.5 Penicillium 5 2.1 8 3.4 Rhizopus 1 0.4 0 0.0 Scopulariopsis 1 0.4 1 0.4 Trichoderma 1 2 5. 1 1 2 5.1 Trichophyton + 28 1 1 .9 n 32.6 Trichothecium 1 0.4 1 0.4 Verticillium 1 1 4.7 9 3.8
lsol = isolation ; antib soltn = antibiotic solution. *
the two treatments were replicates for each sample.
+ = regarded as true keratinolytic spp.

98
Comparison of the two treatments showed no significant differences
(P�0.05) in isolation rates of fungi. A total of 1 9 genera were isolated, 1 7
from antibiotic treated samples and 1 5 from the water only treatment.
Isolation rates i n the two groups are shown i n Table 3-2 . Of the 1 9 genera, the most abundantly distributed at the five sites (Table 3-3) were Cunninghamella, Diheterospora, Fusarium (except at river/roadsides},
Gliocladium, Paecilomyces, Trichoderma and Trichophyton spp . . The other genera including Microsporum and Chrysosporium spp. were in very low numbers or absent. Fusarium spp. were more common in areas of high human activity, such as recreational parks, cleared areas and
schools.
3.1 .2 Keratinolytic Species.
The species o f t he t ru e ly ke rat ino lyt ic g e nera Chrysosporium,
Microsporum and Trichophyton isolated from the soils are shown in Table 3-4. T. ajelloi was by far the most frequent (Fig. 3-4).
Table 3-3: Keratinolytic fungal species isolated from 236 soil
samples by the keratin-baiting technique.
Treatment group Species Antibiotic I sol. Water I sol.
Solution rate only rate (%) (%)
Microsporum cookei 8 3.4 8 3.4 M.gypseum complex 3 1 .3 4 1 .7
Trichophyton ajelloi 27 1 1 .4 74 31 .4
T.terrestre 1 0.4 3 1 .3 Chrysosporium spp. 2 0.8 5 2. 1
lsol = isolation; Pos = Positive
N11 Pos. samples in 236
1 6 5
90
4 7
Keratinolytic fungal species were analysed separately by a t-test. There was no significant difference (�0.05) in isolation rates between the two
treatment groups.

99
Fig .3.1 : Keratin-baiting technique using sheep wool for the isolation of keratinophilic fungi.
Fig.3.2 : Spontaneous cleistothecium development on soi l by T. ajelloi.


i ... .. .. ,;. ,
Table 3-4: Distribution of fungi isolated from soil samples from different sites.
Total number of soil samples from each site (in brackets)
Genus Parks % Cleared % School % Paddocks % River/Road % Sites with % N2 Pos.
areas grounds side no details samples
(75) (44) (28) (24) (29) (36) in 236
Cephalosporium 3 4.0 1 2 .3 0 0 . 0 1 4.2 0 0 .0 0 0.0 5
Chrysosporium + 0 0.0 4 9 . 1 0 0.0 1 4.2 0 0.0 2 5.6 5
Conidiobolus 0 0.0 1 2.3 0 0 .0 0 0.0 0 0.0 0 0.0
Cladosporium 0 0.0 1 2 .3 0 0 .0 0 0.0 0 0 . 0 0 0.0 1
Cunninghamella 1 4 1 8.7 1 0 22.7 8 28.6 3 1 2.5 4 1 3 .8 0 0.0 39
Diheterospora 1 5 20.0 1 4 3 1 .8 3 1 0.7 9 37.5 6 20.7 0 0.0 47
Fusarium 24 32.0 1 1 25.0 6 2 1 .4 4 1 6.7 2 6.9 0 0 .0 47
Geotrichum 0 0.0 3 6.8 0 0.0 0 0.0 0 0 .0 0 0 .0 3
Gliocladium 22 29.3 28 63.6 8 28.6 9 37.5 1 0 34.5 0 0.0 77
Microsporum + 7 9.3 5 1 1 .4 3 1 0 .7 0 0.0 1 3.4 4 1 1 . 1 21
Mucor 1 1 .3 0 0 . 0 0 0.0 0 0.0 0 0.0 0 0.0 1
Paecilomyces 36 48.0 1 7 38.6 1 4 50.0 8 33.3 1 3 44.8 0 0.0 88
Penicillium 7 9.3 2 4 . 5 1 3.6 2 8.3 1 3.4 0 0.0 1 3
Rhizopus 0 0 . 0 0 0 .0 0 0.0 0 0.0 1 3.4 0 0.0 1 Scopulariopsis 2 2.7 0 0 . 0 0 0 . 0 0 0.0 0 0 . 0 0 0.0 2
Trichoderma 9 1 2. 0 4 9. 1 3 1 0.7 4 1 6.7 4 1 3.8 0 0.0 24
Trichophyton + 20 26.7 1 8 40.9 9 32. 1 1 5 62.5 8 27.6 24 66.7 94
Trichothecium 0 0.0 1 2.3 0 0.0 0 0.0 1 3.4 0 0.0 2
Verticillium 6 8.0 5 1 1 .4 3 1 0 .7 0 0.0 2 6.9 2 5.6 1 8 _.. 0 0
Pos = postive

1 01
An analysis of the isolation rates of M. cookei and T. ajelloi in relation to
the pH of the soil indicated that most isolations were from soi ls of pH 5. 1 -
7.0.
Table 3-5: Distribution of M. cookei and T. ajelloi in relation to soi l pH (200 samples).
Soil M. cookei % Isolates T. ajelloi % Isolates pH NO NO
4.1 - 5.0 0 0.0 7 1 0.3 5. 1 - 6.0 6 46.2 32 47.1 6. 1 - 7.0 7 53.8 25 36.8 7. 1 - 8.0 0 0.0 2 2.9 8. 1 - 8.5 0 0.0 2 2.9
1 3 68


Fig.3-3: Distibution of M. cookei in relation to soil pH (200 samples).
A
(A= pH4. 1 -5.0, B= pH5.1 -6.0, C= pH6.1 -7.0,
D= pH7. 1 -8.0, E= pH8. 1 -8.5)
8 c pH
D E
1 02

-� 0 -
Fig.3-4 : Distibution of T. ajelloi in relation to soil pH (200 samples).
(A= pH4. 1 -5.0, 8= pH5. 1 -6.0, C= pH6.1 -7.0, D= pH7. 1 -8.0, E= pH8. 1 -8.5)
E
1 03

1 04
3.2 KERATINOPHILIC FUNGI FROM CATS AND DOGS.
3.2.1 Fungi Isolated using the Hairbrush Technique.
During the investigation of kerati nophi lic fungi from cats and dogs, the an imals were sampled by the hai rbrush technique and the samples
cultured on SDA incorporating antibiotics to suppress non-keratinophi lic fungi (Section 2 . 1 .3. 1 ). Fungi isolated from the hair of the animals and able to grow on SDA with antibiotics were considered keratinophilic. The
principal source of samples was the SPCA pre mises in Palmerston
North.
Table 3-6: lsolations from cats and dogs examined at the SPCA premises, using the hairbrush technique.
N!! Samples 0/o N11 of
Source Examined positive positive clinical for fungi cases
Cats 1 78 1 05 59.0 2 Dogs 59 32 54.2 0
Total: 237 137 57.8 2

/ 0 5
Fig.3-5: The plastic Nu-brush used for screening carrier animals.
Fig.3-6: Growth of M. canis from a Nu-brush tested cat.


Table 3-7: Fungi isolated from cats and dogs using the hairbrush technique and cultured on SDA with antibiotics.
Genus Cats I sol. ( 1 78) rate
(%)
Alternaria 1 1 6.2
Anixiopsis 1 0.6
Arthroderma + 1 0.6
Aspergillus 7 3.9
Beauveria 8 4.5
Cephalosporum 0 0.0 Chrysosporium + 42 23.6 Cladosporium 1 6 9.0
Diheterospora 2 1 . 1 Geotrichum 0 0.0 "Graphium" 1 0.6 Microsporum + 37 20.8 Mucor 2 1 . 1 Paecilomyces 3 1 .7 Penicillium 21 1 1 .8 Rhizopus 1 0.6 Scopulariopsis 0 0.0 Trichoderma 1 1 6.2 Trichophyton + 26 1 4.6
Trichosporon 1 0.6 Trichothecium 1 0.6 Yeasts 3 1 .7
+ = regarded as keratinolytic
Dogs (59)
6 0 1 6 2
1 1 4 8
0
2 0 3
0 1 4 0 1 1
3
1
0 4
I sol. rate (%)
1 0.2 0.0 1 .7
1 0.2
3.4
1 .7 23.7 1 3.6
0.0
3.4
0.0
5. 1
0.0
1 .7 6.8 0.0 1 .7
1 .7
5.1
1 .7
0.0
6.8
Total (237)
1 7 1
2 1 3 1 0
1
56 24
2 2 1
40 2
4 25
1 1
1 2
29
2
1
7
1 06
I sol. rate
(%)
7.2 0.4 0.8 5.5
4.2
0.4 23.6 1 0. 1
0.8
0.8 0.4
1 6.9
0.8 1 .7
1 0.6 0.4 0.4
5.1
1 2.2
0.8 0.4
3.0
The number of different genera isolated was 1 7 ( 1 8 +"Graphium") and 1 5 from cats and dogs respectively with a total of 20 (21 +"Graphium")
genera iso lated from both an imals (Table 3-7) . The fungus termed "Graphium" was identified on the basis of i ts s imi larity to Petriella as
described by Barron (1 968).

1 07
lsolations from cats were predominantly those considered keratinolytic
fu ng i , with Chrysosporium, Microsporum and Trichophyton spp.
representi ng 23.6%, 20.8% and 1 4.6% respectively. The predominant
kerati no lyt ic fungus from dogs was Chrysosporium (23.7%) with Microsporum and Trichophyton each with 5. 1 %. The other fungi common
on cats were Cladosporium (9%) and Penicillium (1 1 .8%) while Alternaria and Aspergillus each with 1 0 .2% and Cladosporium ( 1 3 .6%) were common on dogs.
A t-test performed by the · statistical package SAS (SAS Institute I nc. ,
1 988) showed a significant difference (PS0.05) between the two animals as carriers of fungi, cats being the more important reservoir.
3.2.2 Keratinolytic Species.
Overall , keratinolytic fungi were more common than other fungi with Chrysosporium at 23.6%, Microsporum 1 6.9% and Trichophyton 1 2.2%. Penicillium (f0.6%) and Cladosporium (1 o·. 1 %) we re the o n ly non-keratinolytic fungi common on both cats and dogs.
Table 3-8: Keratinolytic fungi isolated from small animals using the hairbrush technique.
Species Cats lsol. Dogs I sol. Total I sol. (1 78) rate (59) rate (237) rate
(%) (%) (%)
Microsporum canis 33 1 8.5 3 5.1 36 1 5.2 M.cookei 1 0.6 0 0.0 1 0.4 Trichophyton ajelloi 6 3.4 0 0.0 6 2.5 T.mentagrophytes 7 3.9 0 0.0 7 3.0 T.terrestre 1 8 1 0. 1 3 5.1 21 8.9
Arthroderma curreyi 1 0.6 1 1 .7 2 0.8
Chrysosporium spp. 42 23.6 1 3 23.7 55 23.2
The Microsporum spp. comprised mainly the pathogenic M. canis, while Trichophyton spp. were predominantly the nonpathogenic T. terrestre.

1 08
Cats were a common source of M. canis. lsolations of T. terrestre were
more frequent from cats than from dogs but Chrysosporium spp. were
equally prevalent on both animals.
There was still a significant difference (P�0.05) between cats and dogs as carriers of keratinolytic fungi, with cats being the favoured host.
The SPCA premises was a good source of M. canis, 33 isolates being obtained from 1 78 cats examined (1 8.5%) and 3 from 59 dogs (5. 1 %). T. mentagrophytes was isolated from 3.9% of the cats. Although the brush
technique is not used as a quantitative test, 6 of the 1 78 cats examined at the SPCA, produced a large number of colonies of M. canis on culture,
indicating that their coats were heavily contaminated with fungal spores.
On close examination, two of these were found to have clinical disease
(Table 3-6). Six small rugs of blanket used in the cages for cats were
also sampled. One of the rugs produced a positive M. canis isolate using the brush technique.
I n addition to the iso lates of M. canis obtai ned above, a further 25
hairbrush samples yielding 6 isolates of M. canis were obtained from veterinary cl inics and 1 4 M. canis pure cultures were received from Wellington and Auckland. All isolates are listed in appendix A.

1 09
3.2.3 Bimonthly Distribution of M. canis.
The bimonthly distribution of M. canis isolations from cats and dogs was compared with the average b imonth ly rainfal l , average bimonthly
temperature and average bimonthly humidity. lt can be noted from Table
3-9 and Fig.3-7 that over a ten month period the distribution of M. canis
i n small animals peaked in May-June. The relative average bimonthly humidity for the two months was the highest relative humidity recorded
for the year.
Table 3-9: Bimonthly fluctuations of M. canis isolations from 237 small
animals, Nov. 1 990 - Aug. 1 991 .
Month a M. can is 0/o
November-December 01 0.4 January-February 01 0.4 March-April 06 2.5 May-June 27 1 1 .4 July-August 01 0.4
a: Nov-Dec. , 1 990; Jan-Aug. , 1 991
Rainfall (mm)
2.46 4.44 3. 1 8
2.68 3.09
Temp.
(oC)
1 5.6 1 7.5 1 4.9
9.9
9.2
RH%
76 78 79
87.5
86.5
Comparing the data using statistical analysis, the correlation coefficient (r) between the bimonthly distribution of M. canis in small animals and
those of the meteorological factors were calcu lated using the statistical package, SYSTAT (Wilkinson, 1 989) . The distribution of M. canis was
positive ly corre lated with relative h u midity ( r = 0.621 ) which was
significant at the 1 0% significance level. However, the distribution of M.
canis was negative ly correlated with temperature (r = -0.508), bUt was not significant. Therefore , relative humidity and temperature can be
i nterpreted to have an effect on M. canis distribution, which increases with i ncrease d re lat ive h u m idity and d ecreases with i ncreased
temperature.

Fig.3-7: Bimonthly distribution of M. canis.
1�-----------------------------------------------------------------------------------------------------------------------------�
U) ·-
c as 1 0
� .... 0 c 0
·--as -0 en 5 -
01�------,-------------------------�--------------------�--------------------�--------------------��-----� N-0 J-F M-A
Months M-J J-A
1 1 0

1 1 1
3.3 DET ERMINATION OF MATING TYPES O F MICROSPORUM
ISOLATES USING A. S/M/1 AND N. OTAE.
3.3.1 M. canis
The mating type of all M. canis i solates as determined by A.simii "+"
(MY036.84) and "-" (MY037.84) and the tester strains, N. otae "+" (RV42487) and "-" (RV42488) was found to be "-".

1 1 2
Fig .3-8 : Zone with cleistothecia formed between A. simii "+" (MY03684)
and "-" (MY03784) and stimulated growth containing some cleistothecial initials between A. simii "+" (MY03684) and M. canis (PN1 1 ).
Fig.3-9 : A cross between the tester strain N. otae "+" (RV 42487) and
M. canis (PNOS) on SDA ( 1/8) agar.


1 1 3
Fig.3-1 0 : Cleistothecia of N. otae produced by crossing M. canis (PNOS)
with tester strain N. otae "+" (RV42487) (magnification x200).
Fig.3-1 1 : Peridial hyphae of cleistothecia produced by crossing M. canis (PNOS) with tester strain N. otae "+" (RV42487) (magnification
xSOO).


3.3.2 M. cookei.
The mating types of the M. cookei isolates are shown in table 3-1 0.
Table 3-10 : Determination of mating types of M. cookei isolates using A. simii.
Isolate Result of pairing A.simii (+) A.simii(-)
HOB
H30 A32
533 A39 A81 A1 07 A1 25
+
+ +
+ + +
A1 52 +
H 1 53 H 1 54 A1 55
H 1 73 H 1 92
H21 9
H223
+
+
H228 +
C551 +
+
+
+
+
+ +
+
+ = stimulated growth; - = no stimulated growth
Mating type
+
+
+
+
+ +
+
1 1 4

1 1 5
Fig.3-1 2: Zone with cleistothecia formed between A. simii "+" (MY03684) and "-" (MY03784) and stimulated growth containing some cleistothecial initials between A. simii "+" (MY03684) and
M. cookei (H223).
Fig.3-1 3: Crossing between (A39} "+" and (H21 9} "-" strains of M. cookei
on SDA ( 1 /1 0} agar.


1 1 6
Of the 72 crosses between "+" and "-" isolates, four were very fertile, 1 4
were moderate ly ferti le , 31 were weak reactors and the rest we re infertile. Table 3-1 1 summarises the degree of fertility between "+" and "-"
mating types.
Table 3-1 1 : Mating studies of "+" and "-" M. cookei isolates.
(-)Isolates
HOB H30 A32
A39 A81 A1 07 A1 52
H 1 54 H1 73
H 1 92
H228 C551
(+) Isolates
S33 A1 25 H1 53
+ + + ++ ++ + +
+ + +
++ + +
+ ++
+ + ++ + +++ + + +
Number of Cleistothecia +++ = >50
++ = 1 0 - 50
+ = <1 0 - = no cleistothecia
A1 55
++
+
++
++
H21 9 H223
+ ++ + ++ + +
+++ +++
+ ++ ++ + + ++ ++ +
+ +
+ + + +++

1 1 7
Fig.3-1 4: Cleistothecia of N. cajetani produced by crossing "+" and "-" strains of M. cookei (magnification x200)
Fig.3-1 5 : Peridial hyphae produced by crossing "+" and "-" strains of M.
cookei (magnification x500).


i!•
1 1 8
3.4 ASSA VS OF PROTEOLYTIC ENZYMES PRODUCED BY M. CANIS
AND M. COOKEI.
3.4.1 Gelatin Hydrolysis.
Gelati n hydrolysis was used as an i ndicto r of relative ext racellu lar
enzyme expression by the isolates of M. canis and M. cookei obtained in this study. Measurement of the colony radius and the extent of gelatin hydrolysis away from the colony margin a l lowed an expression of
proteolytic activity as the ratio extent of hydrolysis : colony radius (Baxter, 1 968). Activity among the 52 M. canis isolates tested showed l ittle
variation , rang ing from 1 . 1 - 2.0 (Table 3- 1 2) but the 1 8 M. cookei isolates (Table 3-1 3) showed a greater range (1 .6 - 4.0) . M. cookei H223 had the highest activity of all isolates examined by this technique.
Table 3-12: Gelatin hydrolysis by M. canis isolates.
Isolate Activity Isolate Activity Isolate Activity code (cc/cd) code (cc/cd) code (cc/cd)
PN01 1 .4 PN1 8 1 .8 WG34 1 .5 PN02 1 .6 PN1 9 1 .7 WG35 1 .7 PN03 2.0 PN20 1 .7 NK36 1 .2 PN04 1 .7 PN21 1 .8 PN37 1 .6 PN05 1 .7 PN22 1 .7 PN38 1 .8 PN06 1 .7 PN23 1 .8 PN39A 1 .8 PN07 1 .7 PN24 1 .7 PN39B 1 .7 PN08 1 .8 PN25 1 .3 PN40 1 .8 WG09 1 .7 PN26 1 .5 PN41 1 .7 WG1 0 1 .8 PN27 1 .7 PN42 1 .6 PN1 1 1 .8 PN28 1 .9 PN43 1 .7 PN1 2 1 .8 PN29 1 .5 PN44 1 .4
r

Table 3-1 2 contd.
PN1 3 1 .8 WG30A 1 .5 AK45
PN1 4 1 .4 WG30B 1 .7 AK46
PN1 5 1 .8 WG31 1 .2 AK47
PN1 6 1 .8 WG32 1 .5 AK48
PN1 7 1 .8 WG33 1 .6 AK49
AK50
cc = radius of hydrolysis (cm) ; cd = colony radius (cm)
Nk = source of isolate unknown
Table 3-13: Gelatin hydrolysis by M. cookei isolates.
Isolate Activity Isolate Activity Isolate code (cc/cd) code (cc/cd) code
HOB 2.2 A1 07 2.0 C551 H30 2.5 A1 25 2.6 H21 9 A32 2.2 A1 53 2.4 H223 S33 2.5 H1 54 2.0 H228 A39 2.4 A1 55 2.1 HD32 A81 2.0 H 1 92 1 .9 HD28
cc = radius of hydrolysis (cm) ; cd = colony radius (cm)
1 1 9
2.0 1 .3 1 .4 1 .2
1 . 1 1 .4
Activity
(cc/cd}
2.0 1 .6 4.0 2.4
2.2
2.0

1 20
Fig.3-1 6: Hydrolysis of gelatin by M. canis (PN26) using the gelatin plate method.
Fig.3-1 7: Hydrolysis of gelatin by M. cookei (H223) using the gelatin plate method.

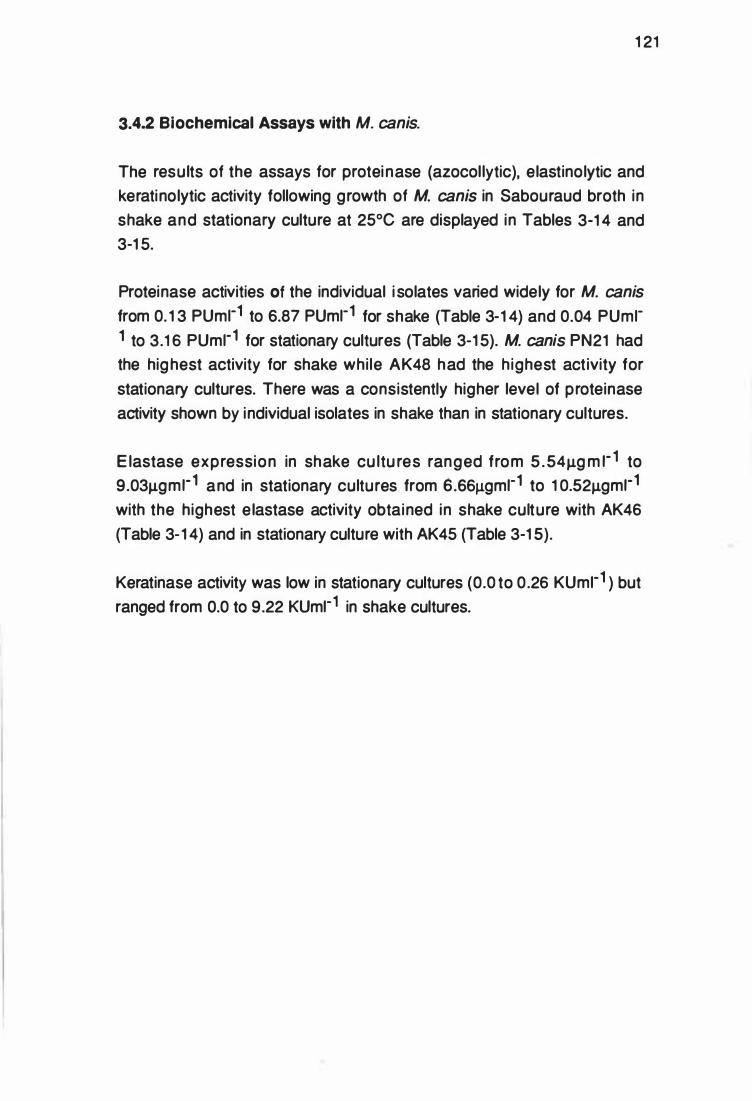
1 21
3.4.2 Biochemical Assays with M. canis.
The results of the assays for protei nase (azocol lytic), elastinolytic and keratinolytic activity following growth of M. canis in Sabouraud broth in shake and stationary culture at 25°C are displayed in Tables 3-1 4 and 3-1 5.
Proteinase activities of the individual i solates varied widely for M. canis
from 0. 1 3 PUmr1 to 6.87 PUmr1 for shake (Table 3-1 4) and 0.04 PUmr 1 to 3.1 6 PUmr1 for stationary cultures (Table 3-1 5). M. canis PN21 had the highest activity for shake whi le AK48 had the highest activity for
stationary cultures. There was a consistently higher level of proteinase activity shown by individual isolates in shake than in stationary cultures.
E lastase expression in shake cu ltu res ranged from 5 .54J.Lg m r1 to 9.03J.Lgmr1 and in stationary cultures from 6.66J.Lgmr1 to 1 0.52J.Lgmr1
with the highest e lastase activity obtained in shake culture with AK46
(Table 3-1 4) and in stationary culture with AK45 (Table 3-1 5).
Keratinase activity was low in stationary cultures (0.0 to 0.26 KUmr 1 ) but ranged from 0.0 to 9.22 KUmr1 in shake cultures.

1 22
Table 3-14 : Enzyme expression of M. canis isolates in shake cultures.
Isolate clinical Shake cultures code cases(+)
carriers Proteinase Elastase Keratinase (-) (±SE) (±SE) (±SE)
PN01 0.88±0.21 7.79±0.07 0.1 1 ±0.03 PN02 1 .25±0.42 8.05±0.21 0.55±0.54 PN03 1 . 1 2±0.29 8.1 5±0.02 0.01 ±0.01 PN04 2.08±0.42 7.92±0. 1 3 0.05±0.01 PN05 + 0.83±0.00 7.80±0.02 0.00±0.00 PN06 + 2.21 ±0.29 6.25±0.08 0.00±0.00 PN07 + 0.1 7±0.08 8.1 0±0.06 0.02±0.00 PN08 + 0.25±0. 1 3 8.91 ±0. 1 3 0.00±0.00 WG09 + 0. 1 3±0.1 3 8.39±0.1 0 0.03±0.03 WG1 0 + 0.21 ±0. 1 3 8.06±0.04 0.01 ±0.01 PN1 1 5.21±0. 1 3 8.03±0.06 0.09±0.04 PN1 2 0.83±0. 1 7 8.27±0.04 0.01 ±0.01 PN1 3 3.75±0.1 7 8.34±0.21 0.02±0.02 PN1 4 2. 1 7±0.50 8.58±0. 1 4 0.09±0.03 PN1 5 5.33±0.58 8.20±0.00 0.00±0.00 PN1 6 1 .29±0.04 8.61 ±0.03 0.01 ±0.01 PN1 7 1 .91±0. 1 7 7.33±0.04 0.1 5±0.1 5 PN1 8 1 .29±0.04 8.44±0.04 0.00±0.00 PN1 9 3.29±0.63 7.06±0.04 0.1 1 ±0.02 PN20 0.92±0.00 8.9 1±0.07 0.08±0.05 PN21 N 6.87±0.96 6.25±0.09 0.1 1 ±0.1 1 PN22 0.00±0.00 7.92±0.1 2 4.39±4.30 PN23 4.58±0.00 6.05±0.04 8.23±8.07 PN24 2.83±1 . 1 6 . 5.79±0.1 3 0.66±0.65 PN25 1 .33±0.00 7.00±0.04 1 . 1 0±1 .08
AK = Auckland; PN = Palmerston North; WG = Well ington
N = unknown ; NA = not applicable

1 23
Table 3-14 contd.
PN26 1 .25±0.08 8.37±0. 1 5 5.38±5.27 PN27 4.29±0.46 6.05±0. 1 3 9.22±9.04 PN28 3.62±0.38 7.09±0.35 1 .98±1 .94
PN29 + 1 .04±0.29 8.70±0.21 5. 1 6±5.06
WG30A + · 1 .46±0.29 7.48±0.01 2.42±2.37
WG30B + 0.75±0.50 6.91 ±0.03 7.68±7.53 WG31 + 3.33±0.1 7 5.71 ±0.1 5 0.00±0.00 WG32 + 1 .25±0.25 6.95±0.05 0.00±0.00 WG33 + 1 .58±0.33 6.31 ±0. 1 2 0.00±0.00 WG34 + 1 .96±0.04 7.02±0. 1 2 6.37±6.24 WG35 + 2.87±0.38 6.88±0.06 1 .21±1 . 1 8 LK36 N 2. 1 2±0.21 6.95±0.06 0.00±0.00 PN37 2.41±0.33 5.54±0.03 0.00±0.00 PN38 2.62±0.54 6.92±0.04 0.00±0.00 PN39A 2.1 7±0.25 6.39±0.03 3.95±3.87 PN39B 1 . 1 2±0.21 7.70±0.22 0.00±0.00 PN40 4.91±0.33 6.39±0.05 0.00±0.00 PN41 2.58±0.42 6.71 ±0.1 0 8.23±8.07 PN42 3.54±0.1 3 6.54±0.04 0.00±0.00 PN43 6.08±0.25 5.92±0.08 0.00±0.00 PN44 + 1 .62±0. 1 3 7.01±0.09 0.00±0.00 AK45 + 1 . 1 2±0.29 7.36±0.25 0.00±0.00 AK46 + 1 .00±0.08 9.03±0. 1 2 0. 1 5±0.03 AK47 + 1 . 1 2±0.21 8.63±0. 1 1 0.07±0.03 AK48 + 1 .75±0.00 8.22±0. 1 5 0.08±0.01 AK49 + 0.38±0.38 6.73±0�1 7 0.00±0.00
AK = Auckland; PN = Palmerston North; WG = Wellington
N = u nknown; NA = not applicable

1 24
Table 3·1 5: Enzyme expression of M. canis isolates in stationary cultures.
Isolate clinical Stationary cultures code cases(+)
carriers Proteinase Elastase Keratinase (-) (±SE) (±SE) (±SE)
PN01 0.58±0.25 8.45±0. 19 0.05±0.00
PN02 · o.63±e.o5 8.61±0.05 0.03±0.02
PN03 0.1 3±0. 1 3 8.56±0.07 0.03±0.03
PN04 0.33±0.09 8.54±0.04 0.08±0.03
PN05 + 0.79±0.21 7.90±0. 1 0 0.1 9±0. 1 2
PN06 + 0.50±0.08 8.1 6±0. 1 3 0.09±0.06
PN07 + 1 .04±0.46 8. 1 8±0.09 0.05±0.00 PN08 + 1 .66±0.08 8.84±0.07 0.02±0.02 WG09 + 1 . 1 7±0.25 9.02±0.01 0. 1 4±0.03 WG1 0 + 0.88±0.05 8.35±0. 1 2 0.03±0.03 PN1 1 0.79±0.21 9.1 3±0.22 0.03±0.03 PN1 2 0.1 7±0.00 8.33±0. 18 0. 1 0±0.1 0 PN1 3 1 .71±0.04 9.27±0.00 0.04±0.03 PN1 4 1 .08±0.33 8.58±0.02 0.05±0.05 PN1 5 0.38±0.38 9.1 1 ±0.48 0.00±0.00 PN1 6 0.38±0.20 9.28±0.34 0. 1 2±0.05 PN1 7 0.00±0.00 9.1 3±0.07 0.00±0.00 PN1 8 0.25±0.25 9.43±0.20 0.01 ±0.01 PN1 9 0.1 3±0. 1 3 9.57±0.34 0.00±0.00 PN20 0.04±0.04 8.80±0.29 0.1 9±0.1 7 PN21 N 1 .1 6±0.58 8.71±0. 1 4 0.04±0.04 PN22 0.50±0.25 8.90±0.09 0.00±0.00 PN23 1 .20±0.1 3 7.90±0. 1 5 0.04±0.02 PN24 1 . 1 2±0.38 6.66±0.08 0.00±0.00
PN25 0.71±0.21 8.91±0.06 0.08±0.06
AK = Auckland; PN = Palmerston North; WG = Wellington
N = unknown; NA = not applicable

1 25
Table 3-15 contd.
PN26 0.58±0.08 9.39±0. 1 1 0.1 1 ±0. 1 1
PN27 0.80±0. 1 3 7.48±0. 13 0.00±0.00
PN28 0.41±0.41 8.93±0.09 0.00±0.00
PN29 + 0.71±0.21 9.78±0.26 0.00±0.00
WG30A + 1 .83±0.50 8.41±0.04 0.00±0.08
WG308 + 0.88±0. 1 3 8.52±0.28 0.08±0.00
WG31 + 1 .04±0. 1 3 7.75±0.09 0.00±0.00
WG32 + 0.88±0. 1 3 8.41 ±0. 1 8 0.07±0.02
WG33 + 1 .04±0.46 7.69±0.07 0 . 1 1 ±0. 1 1
WG34 + 1 .21 ±0.29 8.32±0.23 0.04±0.04
WG35 + 0.88±0.54 8.75±0.02 0.05±0.02 LK36 N 0.45±0.1 3 8.23±0.1 1 0.00±0.00 PN37 0.58±0.42 8.45±0.33 0.09±0.07 PN38 0.63±0.05 7.87±0. 18 0.05±0.04 PN39A 0.09±0.09 8.83±0.09 0.08±0.08 PN398 2.41±0.42 9.34±0.02 0.00±0.00 PN40 2.33±0.33 6.94±0.06 0 . 1 9±0.01 PN41 3.08±0.42 9.23±0.1 0 0.20±0.02 PN42 2.25±0.33 8.31±0.04 0.20±0.03 PN43 1 .92±0.00 7.29±0.00 0.1 9±0.04 PN44 + 1 .62±0.29 9.06±0.04 0.00±0.00 AK45 + 2.58±0.08 1 0.52±0.25 0.00±0.00 AK46 + 1 .96±0.29 9.62±0.23 0.00±0.00 AK47 + 1 .08±0.25 8.98±0.30 0.26±0.04
AK48 + 3. 1 6±0. 1 7 1 0.04±0.1 9 0. 1 7±0.02
AK49 + 1 .71±0.04 1 0.00±0.25 0.00±0.00 AKSO + 0.88±0.21 9.83±0.05 0.00±0.00
AK = Auckland; PN = Palmerston North; WG = Wellington
N = u nknown; NA = not applicable

3.4.2.1 Comparison of Overall Enzyme Expression of M. canis Isolates.
1 26
For differences in the overall enzyme expression by M. canis isolates for the two treatments (continuous shake and stationary culture), they were compared by the weighted mean using the inverse of the standard error
(SE). This was performed using the statistical package, SAS (SAS
Institute Inc. , 1 988).
Table 3-1 6: Analysis of enzyme expression of isolates of M. canis grown
in shake and stationary cultures using the weighted mean.
Enzyme
Proteinase Elastase Keratinase
P-value
0.001 6 0.0001 0.4324
The ove ra l l expre ssion of prote inase activity in shake culture was
significantly (P=0.001 6) more than in stationary culture, while elastase
expression was significantly (P=0.0001 ) more in stationary culture than in s hake cu lture . Keratinase expressio n , however, was not differe nt (P=0.4324) between the two culture methods.

1 27
To investigate any trends in the expression of the three enzymes the
results were also analysed by the product moment correlation coefficient
(Pearson corre lation matrix) using the statistical package , SYSTAT
(Wilkinson , 1 989).
Table 3-17: Correlations of enzyme activities of M. canis using the
product moment correlation coefficient (Pearson correlation matrix).
Shake culture
Proteinase vs elastase keratinase vs proteinase
keratinase vs elastase
Stationary culture
Proteinase vs elastase keratinase vs proteinase keratinase vs elastase
• = significant
r
-0.505
0.031
0.039
0.006 0.068 0.256
Sig. level
•
ns
ns
ns ns ns
Proteinase and elastase activities in shake cultures was significantly
negatively correlated (r = -0.505), i . e . when protei nase expre ssion
i ncreased, e lastase expression decreased and vice versa. The other correlations for both shake and stationary cultures were not significant.

3.4.2.2 Comparison of Enzyme activities of M. canis Isolates using
Scattergrams.
1 28
Enzyme activities of M. canis isolates for the two culture methods and grouped into cli nical (infected) cases and carriers, were also compared
by scatterg rams drawn using Autocard software (ve rsion 1 2} . (see Figs.3-1 8 - 3-26) . This was to compare with other authors who have suggested that isolates from inflammatory cases tend to express higher proteinase levels. The dots on the scatterg rams represent e nzyme activity of individual isolates.

1 29
Fig .3- 1 8 : Protei nase (azocol lytic) (PUmr1 ) expression i n shake and stationary cultures of M. canis isolates.
Although some isolates had simi lar proteinase (azocollytic) activity in the two cu lture methods, there was general ly a higher activity i n shake
culture than stationary culture. (This is a similar observation to that found by g elatin/SDS-PAGE analysis, where a higher number of proteinases
were detected in shake culture than stationary culture).

6.5 f-
6.0 • f-
5.5 -• •
5.0 f- • � - • I 4.5 I--E •
::> 4.0 t-a.. •
'-' • • � 3.5 f-
� ••
·- • • � 3.0 t-0 • • c • • • CD
. 2.5 t- • ••
(I) · · = · • c c 2.0 � • • • ·- • • CD • · · : �
• • e 1 .5 � • a.. · · = · · • • ••
1 .0 - · · : · · • • • •• •
• • • • • • • • • • · : · :
0.5 • • • • � . : · . · • • · = · •
0 f-· : · ·
Shake Stationary

1 30
Fig.3-1 9 : Proteinase (azocollytic) (PUmr 1 ) expression in shake cultures of M. canis isolates from clinical cases and carriers.
In shake culture, i solates from carriers had a higher baseline level (the m in imum activity shown by the iso lates) of prote inase activ ity than
isolates from cl in ical cases. Some isolates from carriers expressed considerably higher proteinase activity than isolates from clinical cases.

6.5 I-
6.0 � •
5.5 � • • 5.0 I- • •
,...... -I 4.5 I-
• E
=> 4.0 � a.. •
'-"' - . . � 3.5 I- • • ·-
� 3.0 I-0 • • c • • •
2.5 � CD • en • • • c 2.0 � c: • •
·-
CD • • +J e 1 .5 � • •
a.. • • • • • 1 .0 • • • • •
I- • • • • • •
0.5 � • • 0
• • • I-
Infected Carriers Shake culture

1 31
Fig .3-20 : Protei nase (azocol lytic) (PUm r 1 ) expression in stationary cultures of M. canis isolates from clin ical cases and carriers.
The proteinase activity was very simi lar for stationary cultures of isolates from clinical cases and carriers.

6.5 �
6.0 �
5.5 �
5.0 � "" -!.... 4.5 � E
� 4.0 f-a.. '--' � 3.5 �
·-
� 3.0 -(.) c Q) 2.5 f-(I) g 2.0 �
·-Q) ... e 1 .5 f-
a..
1 .0 �
0.5 �
0 �
•
•
• • • • •
• • • • • • • • • • • • •
•
• • • • •
• • • • • • • • • • • • • • • • • • • • • • •
Infected Carriers Stationary cultures

1 32
F ig .3-2 1 : E lastase (J.Lg m r 1 ) e xpression i n shake and stationary
cultures of M. canis isolates.
E lastinolytic activity in shake culture was less than in stationary culture. E lastinolytic activity in stationary culture had a higher baseline level of enzyme activity than shake culture and most isolates had elastinolytic activity around 8.5J.Lgmr 1 .

1 1 .0 1-
1 0.5 1- • - 1 0.0 • • I -- • E
9.5 - • • CD
• • • c
• • • ·- • • • m 9.0 1- • • • • e • • • • • • • • • • • � • • • • •
f- 8.5 • • • • - • • • • •
� • • • • • ::t 8.0
· · = · : · - • • • •
c • : . • • •
·- • • • � 7.5 1- • • ·-
• • • >
·- 7.0 • • � 1-0 · · · · · = · • c • • • CD 6.5 1- • m • • c • • •
� 6.0 • • m -c • • G:i •
5.5 1- •
5.0 1-
Shake Stationary

1 33
Fig .3-22: Elastase (J..Lgml-1 } expression i n shake cultures of M. canis
isolates from clinical cases and carriers.
The spread i n elastinolytic activity of 5.5J..Lgmr1 to 9.2J..Lgmr1 was very similar for the two groups of isolates from clinical cases and carriers.

1 1 .0 -
1 0.5 --I - 1 0.0 -E CD 9.5 c �
·-Cl) e 9.0 � • �
• • • •
8.5 • • 0) � • • ::s.. • • • • • • c 8.0 - • • • •
·- • • • ' b 7.5 - • ·-> • • ·-...., 0 7.0 - • • • • • • c • • • • • CD • Cl) 6.5 - • c • •
...., • Cl) c 6.0 - • •
w • • • • 5.5 - •
5.0 -
Infected Carriers Shake cultures ..

1 34
Fig.3-23: Elastase (J.Lgmr 1 ) expression in stationary cultures of M. can isolates from clinical cases and carriers.
E lastinolytic activity of isolates from clinical cases was slightly highe
than isolates from carriers. Most isolates from both clinical cases an carriers had elastinolytic activity between 8.0J.Lgmr1 to 9.5J.Lgmr1 . A fe· iso lates from c l in ical cases had e lasti no lyt ic activ ity of more t ha 9.5J.Lgmr1 .

1 1 .0 .......
1 0.5 - • -I
E 1 0.0 ....... • • • •
Q) 9.5 • • c: - • • • ·-C/J • • • 2 9.0 - • • • • • � • . • : : • C) ·a.5 1- • • • • •
• • • • • • :s.. • • • c: 8.0 -·- • • •
� • •
·::; 7.5 - • ·
- • +J (.) 7.0 -c • Q) • rn 6.5 -c +J C/J c 6.0 -
w 5.5 -
5.0 1-
Infected Carriers Stationary culture

35
Fig.3-24 : Kerat inase (KU mr 1 ) expression i n shake and stationary
cultures of M. canis isolates.
There was very little keratinase activity in stationary culture (see also Fig. 3-34). Activity in shake culture ranged from O.OKUmr1 to 9.2KUmr1 .

9.5 9.0 8.5 8.0 7.5 7.0
- 6 5 - . I E 6.0
:::> � 5.5 -
� 5.0 >
;; 4.5 0 c G) 4.0 (f) c c:
;; 3.5 c L.. G) 3.0 �
2.5 2.0
f-
�
1-
�
�
I-
�
i-
-
-
-
�
-
-
-
-
1 .5 �
1 .0 f-
0.5 -
•
• •
•
•
• •
•
•
•
•
• •
• •
• • • • • • • • • • • . . . . . . . . . . , . . . . . . . . 0 r--····· .. ••••·• ............ •••••• • . . . . . . . ............... .
Shake Stationary

1 36
Fig.3-25: Keratinase (KUmr1) expression in shake cu ltures of M. canis isolates from clinical cases and carriers.
Several isolates from both clin ical cases and carriers grown in shake culture displayed keratinase activity. Activity was scattered over a wide range.

• 9.0 -
8.5 � • •
8.0 1-•
7.5 1- .
7.0 1-
6.5 ....... • ,.._ - 6.0 I 1--E
=> 5.5 � • � • '-"' 5.0 -� · :> 4.5 +J 1- •
(.) c 4.0 1- • CD (I) c 3.5 ..... c
·-+J E 3.0 1-CD
� 2.5 1- •
2.0 1- •
1 .5 1-•
1 .0 1- • •
0.5 1- •
• • • • • • • 0 � ..... . . . . .... . . .. .. . . . . . ...
Infected Carriers Shake cultures

1 37
Fig .3-26 : Keratinase (KUmr1 ) expression in stationary cu ltures of M.
canis isolates from clinical cases and carriers.
Although there was keratinase activity in isolates from both clinical cases and carriers it was much less than that detected in shake culture.

f- • 0.25 �
!---
,...... f--I 0.20 � • • -E !- • • • •
1-� - • � -'-' 0 1 5 -.b " - • ·- f-> ·-..., f- • 0 !- • • c 0. 1 0 r- •
CD f- • • rn 0 .... • • • • c - • ·-..., -E 0.05 - • • • • • Q)
� - • • • f- • • • • f- • f- •
0 � • • • • • • • • • • • • • • •
Infected Carriers Stationary culture

1 38
3.4.3 Biochemical Assays with M. cookei.
Protei nase expression in shake cu lture ranged from 0 .92PUmr1 to
32.09PUmr1 (Table 3-1 8) for 833 and H21 9 respectively. However, for
the rem ai n ing M. cookei isolates protei nase activity was less than 20 PU m r 1 . E lastase activity ranged f ro m 6 .67JJ.gmr 1 fo r H08 to
10.02JJ.Qmr1 for C551 (Table 3-1 8). Keratinase activity varied widely from zero for A81 , A1 07, A1 52 and H 1 54 to 1 0.76JJ.gmr1 for S33 (Table 3-1 8).
Table 3-1 8: Enzyme expression of M. cookei isolates in shake cultures.
Isolate Shake cultures code
Proteinase Elastase Keratinase (±SE) (±SE) (±SE)
H08 1 2.33±0.25 6.67±0.1 5 2.52±2.47 H30 1 1 .00±0.1 7 7.04±0.08 0.00±0.00 A32 3.25±0.42 6.75±0.04 6.59±6.46 S33 0.92±0.09 7.26±0.1 7 1 0.76±1 0.55 A39 1 1 .83±0.00 7.71 ±0.05 9.66±9.47 A81 3.71 ±0.21 7.70±0.04 0.00±0.00 A1 07 2.37±0.38 8.72±0.28 0.00±0.00 A1 25 2.50±0. 1 7 8.99±0.03 3.62±3.55 A1 52 9.25±0.67 7.70±0.1 6 0.00±0.00 A1 53 2.29±0.29 9.67±0.00 5.71 ±5.60 H 1 54 3.25±0.00 8.97±0.09 0.00±0.00 A1 55 1 . 1 7±0.00 8.36±0.24 8.34±8. 1 8 H 1 73 1 .58±0.25 9.70±0.1 4 7.25±7.1 0 H 1 92 5.29±0.63 9. 1 8±0�1 0 2.20±2.1 5 H21 9 32.09±1 .41 8.05±0.04 1 .2 1±1 . 1 8 H223 6.00±0.25 8.07±0.09 2.20±2.1 5 H228 1 4.58±0.08 7. 1 4±0.05 6.26±6.1 3
C551 4.33±0.08 . 1 0.02±0.00 0.33±0.32

1 39
Protei nase activit ies in stat ionary cu lture fo r M. cookei ranged from
o.50PUmr1 to 4.83PUmr1 (Table 3-1 9). This variation was less than that
for shake culture (Table 3-1 8). Elastase activity ranged from 7.76J,Lgmr1
to 1 0.47J,Lgmr1 (Table 3-1 9) which was h igher than in shake culture (Table 3-1 8). There was no keratinase activity observed in stationary
cultures of M. cookei isolates.
Table 3-1 9: Enzyme expression of M. cookei isolates in stationary
cultures.
Isolate Stationary cultures code
Protei nase Elastase Keratinase (±SE) (±SE) (±SE)
H08 2.75±0.50 8.30±0.00 0.00 H30 4.83±0.08 9.50±0.00 0.00 A32 3.87±0.21 9.71 ±0.07 0.00 S33 1 . 1 6±0.34 7.76±0.06 0.00 A39 1 .37±0.29 8.68±0. 1 3 0.00 A81 2.46±0.21 9.09±0 . 1 1 0.00 A1 07 2.50±0.08 9.74±0.30 0.00 A1 25 1 .75±0.00 9.34±0.25 0.00 A1 52 2.04±0. 1 3 1 0.07±0.03 0.00 A1 53 0.96±0.1 3 9.38±0. 1 8 0.00 H 1 54 1 .37±0.04 9.73±0.04 0.00 A1 55 3.00±0.25 1 0.29±0.1 2 0.00 H1 73 1 .87±0. 1 3 9.55±0.00 0.00 H 1 92 0.50±0.08 9.59±0.03 0.00 H21 9 4.58±0.08 9.68±0.04 0.00 H223 4.20±0.1 3 8.90±0. 1 3 0.00 H228 4.33±0.25 8.59±0. 1 1 0.00
C551 1 .79±0.21 . 1 0.47±0.04 0.00

3.4.3.1 Comparison of Overal l Enzyme Expression of M. cookei Isolates.
1 40
For differences in the overall enzyme expression by M. cookei isolates for the two treatments (continuous shake and stationary culture), they were compared in the same way as with M. canis (Section 3.4.2. 1 ) .
Table 3-20: Analysis of enzyme expression of isolates of M. cookei
grown in shake and stationary cultures using the weighted mean.
Enzyme
Proteinase Elastase
P-value
0.01 61 o. 1 3n
The ove ral l expression of p rote inase activity i n shake cu ltu re was
significantly (P=0.01 61 ) more than i n stationary culture, while elastase expression was similar (P=0.1 377) in the two culture methods.

Table 3-21 : Correlations of enzyme activities of M. cookei using the
product moment correlation coefficient (Pearson correlation matrix).
Shake culture
Proteinase vs elastase keratinase vs proteinase
keratinase vs elastase
Stationary culture
Proteinase vs elastase
r
-0.344 -0.204
-0. 1 45
0.01 7
Sig. level
ns ns
ns
ns
1 41
All the three enzymes (Table 3-21 ) were tested for any correlations of
enzyme expression. All were found not significant, implying that the three
enzymes are expressed independently of each other.
3.4.3.2 Comparison of Enzyme activities of M. cookei Isolates using
Scattergrams.
Enzyme activities of M. cookei isolates for the two culture methods were
also compared by scattergrams drawn using Autocard software (version 1 2). (see Figs.3-27 - 3-28).

1 42
Fig .3-27: Proteinase (azocol lytic) (PUmr1 ) expression in shake and stationary cultures of M. cookei isolates.
Proteinase activity was greater in shake culture than in stationary culture.
In stationary culture, activity was less than 5 PUmr1 . In shake culture one isolate showed activity of 32 PUmr 1 .

•
25 ,.......
-I E
20 :::) a..
....._..
� ·- 1 5 > • ·-+I O · c • CD • m • c 1 0 c: •
·-
CD +I e
a.. • 5 • • • • • •
= · • • • • = · ·
• • • • • • • • • •
0 •
Shake Stationary

1 43
Fig.3-28: Elastase (J.lgmr1 ) expression in shake and stationary cultures
of M. cookei isolates.
Elastinolytic activity was very similar in the two cultural methods although
stationary cultures had a slightly higher baseline level of e lastinolytic
activity.

1 2.0 I-
1 1 .5 I-
1 1 .0 -.... I - 1 0.5 -E • •
• Q) c: 1 0.0 I- •
·- • • • • en • • E 9.5 • • • I-� • •
• 9.0 •
� - • • •
• • 8.5 - ·
c: I-·- • • � 8.0 - • • ·-
> ·- • o+J • • • 0 7.5 -c Q) • • en 7.0 - • c o+J • en • c 6.5 -
GJ 6.0 �
5.5 I-
5.0 I-
Shake Stationary

1 44
3.4.4 Estimation of Oxygen Concentration in Cultures.
To determ i n e whether oxyg e n m ight have an effect o n e nzyme expression in the two culture methods, continuous shake and stationary, oxygen content was determined after two weeks of incubation in both
conditions using five M. canis isolates grown in Sabouraud broth and test ing al iquot dupl icates of each cu ltu re , uti l i s ing t h e tec h n ique
described in Section 2. 1 .7.2.
Table 3-22: Oxygen concentration in shake and stationary cultures.
Isolate Oxygen Cone" (J.Lmolesmr 1 ) in broth
Shake Stationary Cultures Cultures
PN01 76 64 PN05 47 65 PN06 78 69 PN08 58 81 .5 WG1 0 84 74
The chi-square test compari ng the two cu lture methods showed no
significant difference (X2 =8.95; P�.05) in oxygen concentration.

1 45
3.4.5 Characterisation of Microsporum Proteolytic Enzymes.
Culture fi ltrate from M. canis (WG09) and M. cookei (H21 9) both had
proteinase (azocollytic) and elastinolytic activities. To characterise the
enzymes, a number of proteinase inhibitors were used to determine the type of enzymes involved (see Section 2.2.5).
3.4.5.1 M. canis.
Table 3-23: Effect of inhibitors on M. canis crude filtrate activity .
• Inhibitors Concentration Inhibition
% relative to solvent controls
Azocol l Elastin
a1 -P 1 OOJ,Lg/ml 52.7 NO PMSF 0.2mM 1 00.0 0.0 PT 20mM a 67.2 EOTA 1 .0mM 1 00.0 39.0
pCMB 20mM 73. 1 5.0 E-64 20J,LM 31 .2 3.2 IAA 0.01 mM 31 .6 0.0 PEPS 1 J,LM 45.4 0.0
a: Increased activity NO = not determined •
see Section 2.2.5 or refer to Fig.3-29 for full names.
For M. canis us ing azoco l l (Table 3-23) , P MSF showed com plete
i nhibition of azocol lytic activity while a1 -Proteinase resulted in 52.7% inhibit ion . EDTA also showed complete i nhibition but a stimulation of
activity was observed with PT. The remain ing inhibitors only showed
partial inhibition. For elastin, inhibition was detected with PT and EOTA,
with the others showing little or no inhibition.

1 46
Fig .3-29 : Inhibition of proteinase (azocol lytic) activity in M. canis filtrate by various inhibitors.
Abbreviations: P M S F = p h e n y l m et h y l s u l fo n y l f l u o r i d e ; P T = 1 I 1 0 -
phenanthroline; EDTA = ethylenediaminetetraacetate ; pCMB =
p-ch l o ro m ecu ri c aci d ; E-64 = L-t ra n s - e p o x y s ucci n y l leucylamido (4-g uanidi no)-butane ; IAA = Iodoacetic acid ;
P E PS = pe pstat i n ; and a 1 - P = a- 1 -p rote i nase . ( 1 I 1 0-phenanthrol ine (PT) gave increased enzyme activity ove r
control - not included on the graph)
PMFS EDTA
100ug/ml 0.2mM 1.0mM 20Mm 20uM 0.01mM 1uM concentration

Fig.3-30 : Inhibition of e lastase activity in M. canis filtrate by various inhibitors.
For abbreviations refer to Fig. 3-29.
PT
PMSF PEPS
0.2mM 20mM 1.0mM 20Mm 20uM 0.01mM 1UM concentration
1 47

1 48
3.4.5.2 M. cookei.
Table 3-24: Effect of inhibitors on M. cookei crude filtrate activity.
Inhibitor Concentration Inhibition
% relative to solvent controls
Azocoll Elastin
a1 -P 1 OOJ.Lg/ml 88.5 NO
PMSF 0.4mM 96.0 0.6 PT 20mM 9.6 76.0 EDTA 1 .0mM 1 6.0 41 .9
pCMB 20mM 0.4 0.0 E-64 1 OJ.LM 0.0 1 .5 IAA 0.02mM 0.0 0.0 PEPS 1 J.1M 3.3 0.0
NO = not determined.
For M. cookei using azocoll (Table 3-24), both P MSF (96%) and a1 -
Proteinase (88.5%) showed strong i nhibition of azocollytic activity. There
was an absence of inhibition with E-64 and IAA. PT, pCMB and PEPS
produced very little inhibition. For elastin, strong inhibition was detected with PT (76%) and EOTA (41 .9%) with the others showing little or no inhibition.

-
E ... c::: 0 0 .... 0 � m res c 2 ... -:a ------
1 49
Fig.3-31 : Inhibition of proteinase (azocollytic) activity in M. cookei fi ltrate by various inhibitors.
For abbreviations refer to Fig. 3-29.
EDTA
pCMB E-64 IAA
20mM 1.0mM 20mM concentration

0 .... ... c:: 0 t) � 0 f. U) as c: 0 ; -Q -C:· c: -
Fig.3-32: Inhibition of elastase activity in M. cookei filtrate by various inhibitors.
For abbreviations refer to Fig. 3-29.
PT
PMSF
0.4mM 1.0mM 20mM 1 0uM 0.02mM concentration
PEPS
1 uM
1 50

3.5 ANALYSIS OF PROTEINASES BY SD5-SUBSTRATE
COPOL YMERISED GELS.
1 51
Following extraction of enzymes from shake and stationary cultures in
Sabouraud broth as described in Section 2.3.3, proteinase expression
(gelatinase and e lastase) was compared by the substrate/SDS-PAGE techniques (Section 2.3). Since the proteins were separated under 50S
denaturing conditions (Section 2.3), the molecular weight (Mr) of each enzyme was estimated from their positions relative to standards of known Mr. The Mr standards (Bio-Rad) in Kilobases (Kb) were ; myosin (200
000), galactosidase ( 1 1 6 250), phosphorylase (97 400), bovine serum
albumin (66 200 ) , hen egg white albumin (45 000) , bovine carbonic anhydrase (31 000), soy trypsin inhibitor (21 500) and lysozyme (1 4 500).
3.5.1 Gelatlnases of M. canis.
The six main protei nase enzymes (gelatinases) which were detected from M. canis iso lates corresponded approximately to MrS of 1 22 KDa, 64 KDa, 62 KDa, 44 KDa, 36 KDa and 28 KDa (Tables 3-25, 3-26, 3-27, 3-28, Figs.3-33, 3-34).
3.5.2 Gel Scanning.
Scanning of stained polyacrylamide gels was done to further confirm the
proteinase bands.

\52
Fig.3-33: A 1 2% gelatin/50S-PAGE of continuous shake culture filtrates · of M. canis isolates.
Lane 1 =PN21 , lane 2=PN22, Lane 3=PN23, Lane 4=PN24,
Lane 5=PN25, Lane 6=PN26, Lane 7=PN27, Lane 8=PN28, Lane 9=PN29, Lane 1 0=PN30A.
Gelatinolysis in the upper part of the electrophoretic tracks may be due to
i ncomplete 50S-inactivation of the enzymes, resulting i n proteolysis d u ri n g e le ct ro p h o re s i s . T h i s was i n s p ite of carry i ng o ut the e lectrophoresis at 4°C to reduce enzyme activity. Gelatino lysis during
electrophoresis in upper part of the gel has also been reported by other
workers (Heussen and Dawdle, 1 980; Apodaca and McKerrow, 1 990).
Fig .3-34: A 1 0% gelatin/50S-PAGE of stationary culture fi ltrates of M. canis isolates.
Lane 1 =PN21 , lane 2=PN22, Lane 3=PN23, Lane 4=PN24,
Lane 5=PN25, Lane 6=PN26, Lane 7=PN27, Lane 8=PN28,
Lane 9=PN29, Lane 1 0=PN30A.

" •
1 2 3 4 5 6 7 8 9 10
1 2 3 4 5 6 7 8 9 10
KO a
_:m
KO a
_122
_36

1 53
3.5.1 .1 M. canis from Clinical Cases Grown In Shake Culture.
Table 3-25: Proteinases of M. canis from clinical cases grown in shake
culture, as detected by gelatin/SDS-PAGE.
Species Isolate Source Proteinase ea. Mr (x1 o3) no
code 1 22 64 62 44 36 28
M. canis PN05 cat + + + +_ + + 6 " PN07 cat + + + + + 5
" PN08 kitten + + + + + + 6 " WG09 cat + + + + + 5 " PN29 cat + + + + + 5 " PN44 dog + + + + + + 6 " PN06 dog + + + + + 5 " WG1 0 human + + + + + + 6 " WG30A human + + 2 " WG30B human + + + + + 5 " WG31 human + + + + + + 6 " WG32 human + + + + + + 6 " WG33 human + + + + + + 6 " WG34 human + + + + + + 6 " WG35 human + + + + + + 6 " AK45 human + + + 3 " AK46 human + + + + 4 " AK47 human + + + 3 " AK48 human + + + + + + 6 " AK49 human + + + 3 " AK50 human + 1
Others RV87 ITM + + 2 " RV88 ITM + + 2 " PN21 blkt + + + + 4 " ? 36 N + + + + + + 6
AK = Auckland; PN = Palmerston North; WG = Wellington
N = unknown ; NA = not applicable

1 54
The proteinases detected in cli nical isolates (Table 3-25) g rown in shake
cultu re ranged from one proteinase (AK50) to six protei n ases (the highest) detected in isolates PN05, PN08, PN44, WG1 0, WG31 ,WG32, WG33, WG34, WG35, AK48 and ?36.
3.5.1 .2 M. canis from Carriers Grown In Shake Culture.
Table 3-26: Proteinases of M. canis from carriers grown in shake
culture, as detected by gelatin/SDS-PAGE.
Species Isolate Source Proteinase ea. Mr (x1 o3) nil
code
1 22 64 62 44 36 28
M. canis PN01 cat + + + + + 5 " PN02 cat + + + + + + 6 " PN03 cat + + + + + + 6 " PN04 cat + + + + + + 6 " PN1 1 cat + + + + + + 6 " PN1 2 cat 6 + + + + + + " PN1 3 cat 6 + + + + + + " PN1 4 cat + + + + + + 6 " PN1 5 cat 5 + + + + + " PN1 6 cat + + + + + + 6 " PN1 7 cat + + + + + + 6 " PN1 8 cat + + + + + + 6 " PN1 9 cat + + + + + + 6 " PN20 cat + + + + + + 6 " PN22 cat 6 + + + + + + " PN23 cat + + + + + 5 " PN24 cat + + + + + + 6 " PN25 cat + + + + + 5 " PN26 cat + + + + + + 6 " PN28 cat + + + + + + 6 " PN37 cat + + + + + + 6

1 55
Table 3-26 contd.
" PN38 cat + + + + 4 " PN39A cat + + + + + 5 " PN39B cat + + + + 4 " PN40 cat + + + + + 5 " PN41 cat + + + + + + 6 " PN42 cat + + + + + + 6 " PN43 cat + + + · + + 5 " PN27 dog + + + + 4
The proteinases (Table 3-26) detected in isolates from carriers g rown i n stationary cultures ranged from fou r protei nases (PN38, P N39B and
PN27) to s ix prote inases ( most iso lates) . The remain i ng iso lates
expressed five proteinases.
3.5.1 .3 M. canis from Clinical Cases Grown in Stationary Culture.
Table 3-27: Proteinases of M. canis from clinical cases grown i n stationary culture, as detected by gelatin/SDS-PAGE.
Species Isolate Source Proteinase ea. Mr (x1 o3) no
code
1 22 64 62 44 36 28
M. canis PN05 cat + + + + 4 " PN07 cat + + + + + 5 " PN08 kitn + + + 3 " WG09 cat + + + 3 " PN29 cat + + 2 " PN44 dog + + + 3 " PN06 dog + + + 3

1 56
Table 3-27 contd.
" WG1 0 human + 1 " WG30A human + + + + 4 " WG308 human + + 2 " WG31 human + + 2 " WG32 human + + + 3 " WG33 human + + + 3 " WG34 human + + + 3 " WG35 human + + 2 " AK45 human + + + 3 " AK46 human + 1 " AK47 human + + 2 " AK48 human + + + 3 " AK49 human + + + 3 " AK50 human + 1
Others RV87 ITM + 1 " RV88 ITM + + + 3 " PN21 blkt + + 2 " ? 36 N + 1
The proteinases detected in isolates from clin ical cases (Table 3-27) grown in stationary cu lture ranged from one proteinase (WG1 0, AK46, AKSO, RV87 and ?36) to five proteinases (PN07). The remaining isolates
expressed either two, three or four proteinases.

1 57
3.5.1 .4 M. canis from Carriers Grown in ,Stationary Culture.
Table 3-28: Proteinases of M. canis from carriers grown in stationary
culture, as detected by gelatin/SDS-PAGE.
Species Isolate Source Proteinase ea. Mr (x1 o3) ng
code 1 22 64 62 44 36 28
M. canis PN01 cat + + + + + 5 " PN02 cat + 1 " PN03 cat + + + + 4 " PN04 cat + + + + + 5 " PN1 1 cat + + + 3 " PN1 2 cat + 1 " PN1 3 cat 1 + " PN1 4 cat 3 + + + " PN1 5 cat 3 + + + " PN1 6 cat 2 + + " PN1 7 cat + + + + 4 " PN1 8 cat 2 + + " PN1 9 cat 3 + + + " PN20 cat = 2 + + " PN22 cat + + + 3 " PN23 cat + + + + 4 " PN24 cat + + + 3 " PN25 cat + + + + 4 " PN26 cat + + + + 4 " PN28 cat + + + + 4 " PN37 cat + + + 3 " PN38 cat + + + 3 " PN39A cat + + + 3 " PN398 cat + 1

1 58
Table 3-28 contd.
" PN40 cat + + + 3 " PN41 cat + + + 3 " PN42 cat + + + 3 " PN43 cat + + + 3 " PN27 dog + + + + 4
The proteinases detected in isolates from carriers grown in stationary culture ranged from one proteinase (PN02, PN1 2, PN1 3 and PN39B) to
five proteinases (PN01 and PN04). The remain ing isolates expressed
either two, three or four proteinases.
3.5.1 .5 Comparison of Culture Methods.
The shake cultures (Tables 3-25, 3-26) of M. canis showed a higher number of proteinase enzymes than the stationary cultures (Tables 3-27,
23-28) . Furthermore , the proteinases from shake cultures gave clearer, well reso lved sharp bands (Fig.3-33) , compared to the ones from the stationary cultures (Fig.3-34) which were difficult to interpret.
Table 3-29: Comparison of shake and stationary cultures of 50 M. canis from clinical cases and carriers.
Mr (x1 03) shake stationary P-value
1 22 42 1 3 0.0001
64 48 34 0.0002
62 44 03 0.0001
44 40 47 0.0377
36 46 42 0. 1 399
28 43 04 0.0001
When the two culture methods are compared using analysis of variance
(ANOVA) , the enzyme expression of Mr5 1 22 KDa, 62 KDa and 28 KDa

1 59
(P=0.0001 ) and 64 KDa (P=0.0002) was significantly g reater in shake
cultu re than stationary culture. The expression of Mrs 44 KDa was marginally greater (P=0.0377) in shake culture compared to stationary
culture while 36 KDa sho"wed no significant difference (P=0.1 399).
When clinical isolates were compared by ANOVA, Mr5 1 22 KDa, 62 KDa and 28 KDa were again significantly more highly expressed (P=0.0001 ).
The other proteinases of Mrs 64 KDa, 44 KDa and 36 KDa were not
highly expressed. The same Mr5 of 1 22 KDa, 62 KDa and 28 KDa were also sign ificantly more highly expressed (P=0.0001 ) in iso lates from
carriers and in addition, 64 KDa Mr (P=0.0008).
Table 3-30: Significance levels for different Mr enzymes between shake and stationary cultures of clinical and carrier isolates of M. canis.
Clinical (21 ) Carriers (29)
Mr (x1 03) shake station. P-value shake station. P-value
1 22 1 6 04 0.0001 26 09 0.0001 64 1 9 1 4 0.0623 29 20 0.0008 62 1 7 01 0.0001 27 02 0.0001 44 1 4 1 9 0.0623 26 28 0.3084 36 1 9 1 6 0.2240 27 26 0.3974
28 1 6 02 0.0001 27 02 0.0001
station. = stationary
3.5.2 Gelatlnases of M. cookei.
The seven main proteinases which were detected from M. cookei isolates
corresponded approximately to Mr5 of 67 KDa, 64 KDa, 63 KDa, 62 KDa, 54 KDa, 52 KDa and 42 KDa (Tables 3-31 , 3-32, Figs. 3-35, 3-36).

1 60
Fig.3-35: A 1 2% gelatin/505-PAGE of continuous shake culture filtrates of M. cookei isolates.
Lane 1 =H08, Lane 2=H21 9, Lane 3=H223, Lane 4=H228, Lane 5=H30, Lane 6=A32, Lane 7=533, Lane 8=A39, Lane 9=A81
Fig .3-36 : A 1 0% gelatin/505-PAGE of stationary culture fi ltrates of M.
cookei isolates.
Lane 1 =H08, Lane 2=H21 9, Lane 3=H223, Lane 4=H228,
Lane 5=H30, Lane 6=A32, Lane 7=533, Lane 8=A39,
Lane 9=A81

1 2 3 4 5 6 7 8 9 KDa
1 2 3 4 5 6 7 8 9
_ 63 --62
-54 -52
KOa
_6� --6362 _ft. -52
--1.2


1 62
The protei nases detected in M. cookei isolates grown in shake culture (Table 3-31 ) ranged from one proteinase (A 1 25) to five proteinases (H30, A32, A 1 07, A1 52, A153 and H 1 54). The remaining isolates expressed
three or four proteinases.
3.5.2.2 M. cookei Grown in Stationary Culture.
Table 3-32: Proteinases of M. cookei grown in stationary culture, as detected by gelatin/SDS-PAGE.
Species Isolate Source Proteinase ea. Mr (x1 o3) no
code 67 64 63 62 54 52 42
M.cookei HOB soil + + + + + + 6 " H30 soil + + + + + + + 7 " A32 soil + + + + + + 6 " S33 soil + + + + 4 " A39 soil + + + + + + 5 " A81 soil + + + + + + 6 " A1 07 soil + + + 3 " A1 25 soi l + + + + 4 " A1 52 soil + + + + + + + 7 " A1 53 soil + + + + + 5 " H 1 54 soil + + + + + 5 " H1 73 soil + + + + + 5 " H 1 92 soil + + + + + 5 " H21 9 soil + + + + 4 " H223 soil + + + + + 5 " H228 soil + + + + + + 6 " C551 cat + + + + + 5
(Other isolates examined:
T. mentagrophytes = 1 80, 45 KDa
Diheterospora 28A = 0 Diheterospora 32H = 1 91 , 1 1 7 KDa)

1 63
The protei nases detected in M. cookei i so lates grown i n stat ionary cu lture (Table 3-32) ranged from three proteinases (A 1 07) to seven proteinases (H30, A1 52). The remaining isolates expressed either four,
five or six proteinases.
3.5.2.3 Comparison of Culture Methods.
In contrast to M. canis, M. cookei showed a h ig her e xp ress ion of
protei nase enzymes in stationary cultures (Table 3-32) than in shake cultures (Table 3-31 ).
Table 3-33: Proteinases detected in shake and stationary cultures of M. cookei.
Mr (x1 03) M. cookei (1 7 isolates)
shake stationary P-value
67 00 07 64 00 07 63 1 6 1 5 0.5595 62 1 5 1 2 0.21 50
54 1 7 1 7 0.0000 52 07 1 5 0.0031 42 14 1 6 0.30 1 4
When the two culture methods are compared by ANOVA, the Mr 52 KDa was significantly more highly expressed (P=0.0031 ) in stationary culture. The Mr 67 KDa and 64 KDa were only expressed in stationary culture.
The remaining Mr5 63 KDa (P=0.5595), 62 KDa (P=0.21 50) and 42 KDa
(P=0.301 4) were n ot significantly diffe rent between the two culture methods.

1 64
3.5.3 Elastases Detected in M. canis and M. cookei Filtrates.
E lastases were detected in shake cu ltu res of M. canis but not i n
stationary cultures. For M. cookei, no elastases were detected in either shake and stationary cultures using elastin/SDS-PAGE. The Mr5 of the two elastases detected in M. canis fi ltrates were 64 KDa and 62 KDa,
common to all isolates.

1 65
3.6 MUL TILOCUS ENZYME ELECTROPHORESIS.
3.6.1 Basic data.
Isozyme banding patterns were recorded according to their relative
mob i l i t ies ( Rf. } , Tab le 3-34. Each band was i nte rpreted as a n electromorph while the isozyme patterns for each enzyme were referred to as phenotypes. For comparing electrophoretic mobilities of the eight enzymes between ge ls the fo l lowing iso lates were used as i nternal standards; HOB for CAT and MOH, H 1 53 for EST, P N 1 3 for LAP and
GPI, H 1 73 for G6P and PER, and PN23 for PEP (Figs.3-45, 3-46, 3-47}.

1 66
Fig.3-37: Electromorph profi les of catalase (CAT) .
Lane 1 =PN1 1 , Lane 2=PN 1 2, Lane 3=PN1 3, Lane 4=PN1 4,
Lane 5=PN1 5, Lane 6=A 1 25, Lane 7=A 1 52, Lane B=A 1 53, Lane 9=A 1 54, Lane 1 O=A 1 55 Lane 1 1 =HOB.
Fig.3-38: Electromorph profi les of esterase (EST).
Lane 1 =PN06, Lane 2=PN07, Lane 3=PN08, Lane 4=WG09,
Lane 5=WG 1 0, Lane 6=A32, Lane 7=533, Lane 8=A39,
Lane 9=A81 , Lane 1 O=A 1 07 Lane 1 1 =H 1 53.

+
0 1 2 3 4- 5 6 7 8 9 10 11
+
1 2 3 4 5 6 7 8 9 10 1 1 '

1 67
Fig.3-39: Electromorph profiles of g lucose-6-phosphate dehydrogenase
(G6P).
Lane 1 =PN21 , Lane 2=PN22, Lane 3=PN23, Lane 4=PN24,
Lane 5=PN25, Lane 6=PN26, Lane 7=RV87, Lane 8=RV88, Lane 9= T. mentagrophytes, Lane 1 O=Paecilomyces Lane 1 0=H1 53, Lane 1 1 =H 1 73 .
Fig.3-40: Electromorph profiles of glucose-6-phosphate isomerase (GPI).
Lane 1 =PN01 , Lane 2=PN02, Lane 3=PN03, Lane 4=PN04,
Lane 5=PN05, Lane 6=H08, Lane 7=H21 9, Lane 8=H223,
Lane 9=H228, Lane 1 0=H30, Lane 1 1 =PN1 3.

0
+
0
. . · · .� ......... :. l .t -
•. v.
· . ;J
1 1
• I
.. 1 0 9 8 7 6
•• • • • •• • •
11 10 9 8 7 6
--5 4 3 2
5 4 3
1
2 1

1 68
Fig.3-41 : Electromorph profi les of leucine aminopeptidase (LAP).
Lane 1 =PN43, Lane 2=PN44, Lane 3=AK45, Lane 4=AK46., Lane 5=AK47, Lane 6=AK48, Lane 7=AK49, Lane 8=AK50, Lane 9=PN1 3.
Fig.3-42: Electromorph profiles of malate dehydrogenase (MOH).
Lane 1 =PN1 6, Lane 2=PN1 7, Lane 3=PN1 8, Lane 4=PN1 9,
Lane 5=PN20, Lane 6=A1 73, Lane 7=H1 92, Lane 8=C551 , Lane 9=AD28, Lane 1 0=HD32 Lane 1 1 =HOB.

+
0
+
0 1 1 10
9 8
9 8
7 6 5 4
7 6 5 4 3
3 2 1
2 1 ..

1 69
Fig.3-43: Electromorph profi les of peptidase (PEP).
Lane 1 =PN27, Lane 2=PN28, Lane 3=PN29, Lane 4=WG30A, Lane 5=WG308, Lane 6=WG31 , Lane 7=WG32, Lane 8=WG33, Lane 9=WG34, Lane 1 0=WG35 Lane 1 1 =PN23.
Fig.3-44: Electromorph profi les of peroxidase (PER).
Lane 1 =PN06, Lane 2=PN07, Lane 3=PN08, Lane 4=WG09,
Lane 5=WG10, Lane 6=A32, Lane 7=533, Lane 8=A39,
Lane 9=A81 , Lane 1 O=A 1 07 Lane 1 1 =H 1 73.

0
o ..
1 1 10 9
1 2 3
8 7 ' ' 6 5 4
4 5 6 7 8
3 2 1
9 1 0 1 1

1 70
(a) Electromorphs.
Each e lectromorph is calculated as a percentage of isolates with the band per total number of isolates. The percentage can be equal to or less
than 1 00%, or 0% for absence of a band (Table 3-34).
Table 3-34: Comparison of e lectromorphs of 72 Microsporum
isolates and 2 Diheterospora isolates.
Enzyme % of isolates with electromorph present. system
M. canis M. cookei Diheterospora * Rt. n=54 n=1 8 n=2
CAT 0.32 0.0 67.0 0.0 0.27 0.0 0.0 1 00.0 0.22 76.0 0.0 0.0
EST + 0.65 96.3 0.0 0.0 0.58 75.9 44.0 0.0 0.49 7.4 0.0 0.0 0.46 0.0 6.0 1 00.0 0.24 0.0 28.0 1 00.0 0.06 0.0 0.0 1 00.0
0. 1 1 0.0 72.0 0.0
G6P 0.51 87.0 1 00.0 0.0
0.42 54.0 6.0 0.0 0.33 0.0 0.0 1 00.0
0.04 1 7.0 0.0 0.0
GPI 0.56 0.0 0.0 1 00.0
0.51 0.0 1 00.0 0.0
0.46 1 00.0 0.0 0.0
- = refers to the electromorph which migrated to the cathode.
The rest of the electromorphs for the isozymes migrated to the anode.

1 71
Table 3-34 Contd.
LAP 0.50 0.0 0.0 1 00.0
0.48 1 00.0 0.0 1 00.0
0.35 0.0 1 00.0 0.0
MOH 0.54 7.4 0.0 0.0
0.49 7.4 0.0 0.0
0.46 1 00.0 0.0 0.0
0.41 0.0 1 00.0 1 00.0
0.36 0.0 0.0 1 00.0
0.27 n.8 0.0 0.0
PEP 0.53 70.0 72.0 0.0 0.43 1 00.0 1 00.0 0.0 0.26 1 5.0 7.0 0.0
PER 0.33 0.0 0.0 1 00.0 0.31 78.0 1 00.0 0.0
Distance migrated by protein • Rf(re lative mobility) = -----------
Distance migrated by dye

1 72
In Table 3-34, when electromorphs are allocated 1 00% this indicates that all iso lates had the same relative mobi lity for that electromorph. For
example, the Rf 0.46 band with M. canis for MOH means that, that MOH
electromorph was present in all isolates. Electromorphs with less than 1 00% means that some isolates lacked the electromorph.
(b) Electrophoretic phenotypes.
Table 3-35: Comparison of electrophoretic phenotypes of
Microsporum and Diheterospora spp . .
Percentage of isolates with phenotype present.
Phenotype M. canis M. cookei Diheterospora n=54 n=1 8 n=2
CAT -
1 24.0 33.0 0.0 2 76.0 0.0 0.0 3 0.0 67.0 0.0 4 0.0 0.0 1 00.0
EST 1 4.0 1 7.0 0.0 2 0.0 1 1 .0 0.0 3 0.0 1 1 .0 0.0 4 0.0 28.0 0.0 5 0.0 22.0 0.0 6 0.0 6.0 0.0 7 0.0 6.0 0.0 8 1 1 .0 0.0 0.0 9 70.0 0.0 0.0
1 0 1 5.0 0.0 0.0
1 1 0.0 0.0 1 00.0

1 73
Table 3-35 Contd.
G6P 1 1 1 .0 0.0 0.0 2 1 7.0 0.0 0.0
3 31 .0 22.0 0.0 4 41 .0 78.0 0.0 5 0.0 0.0 1 00.0
GPI
1 1 00.0 0.0 0.0 2 0.0 1 00.0 0.0 3 0.0 0.0 1 00.0
LAP
1 0.0 1 00.0 0.0 2 1 00.0 0.0 0.0 3 0.0 . 0.0 1 00.0
MOH 1 7.0 0.0 0.0 2 70.0 0.0 0.0 3 22.0 0.0 0.0 4 0.0 1 00.0 0.0 5 0.0 0.0 1 00.0
PEP
1 0.0 0.0 1 00.0 2 26.0 1 1 .0 0.0 3 50.0 56.0 0.0 4 24.0 33.0 0.0 PER
1 22.0 0.0 0.0 2 78.0 1 00.0 0.0
3 0.0 0.0 1 00.0

1 74
The isozyme patterns were referred to as phenotypes. When calculating
phenotypic frequency, the percentage for single-banded isozymes tends to be the same as when the Rf values · of electromorphs are used to calculate the frequency. However, for multi-banded phenotypes, the Rf
values are on ly usefu l to i ndicate relative mobi l ity for the different
electromorphs of an enzyme but are not used for calculating phenotypic frequency. In this study, the calculated frequencies (Section 2.5) (Table 3-35) are based on the phenotypes in Figs.3-45, 3-46, 3-47. In these
figures phenotype 1 for the enzymes CAT, EST, G6P, PEP and PER indicate the absence of enzyme activity e.g. for CAT phenotype 1 , 24%
of M. canis isolates did not show this electromorph. Both M. canis and M. cookei i so lates revealed d i ffe re nt phe notypes whe reas the two Diheterospora iso lates had the same phenotypes for al l the e ight
enzymes.

Fig.3-45: Summary of isozyme phenotypes of catalase and esterase.
* = indicates absence of phenotype.

+
Rf
0.32 0.27 0.22
0
CAT
*
1 2 3 4
1 = M. canis & M. cookei 2 = M. canis 3 = M. cookei 4 = Diheterospora
Rf 0.65 0 . 58 0.49 0 .46
0.24
0.06
0. 1 1
• * -
'
-
1 2 3 4
1 = M. canis & M. cookei 2 to 7 = M. cookei 8 to 1 0 = M. canis 1 1 = Diheterospora
-
5
EST
-
- -
-
-
6 7 8 9 1 0 1 1

3
Fig.3-46: Summary of isozyme phenotypes of glucose-6-phosphate dehydrogenase, glucose-6-phosphate isomerase and leucine aminopeptidase.

+
RI
0.51
0.42
0 .33
0.04 0
G6P
-
-
*
1 2 3 4
1 to 4 = M. canis & M. cookei 5 = Diheterospora
Rf
0.56 0 .51 0.46
-
5
GPI
-
1 2
1 = M. canis 2 = M. cookei
3
3 = Diheterospora
Rf
0.50 0.48
0 .35
LAP
1 2
1 = M. cookei 2 = M. canis
-
3
3 = Diheterospora

1 77
Fig.3-47: Summary of isozyme phenotypes of malate dehydrogenase,
peptidase and peroxidase.
* = indicates absence of phenotype.

+
Rf
0.54 0.49
0 .46 0.4 1
0.36 0.27
0
MOH
--- -
- -
1 2 3
1 to 3 = M. canis 4 = M. cookei 5 = Diheterospora
Rf
0.53
- 0.43
0.26
4 5
PEP
-
-
* -
1 2 3 4
1 = Diheterospora 2 to 4 = M. canis & M. cookei
Rf
0.33 0 .31
PER
* -
1 2 3
1 & 2 = M. canis & M. cookei 3 = Diheterospora

1 78
3.6.2 Phenotypic Diversity.
From the calcu lated f requency data, the Shan non-Wiener diversity measure was calcu lated for each of the e ight enzyme systems as described in Section 2.5. 1 , using the formula:
H = - l: pi Log2 pi
where : H = phenotypic diversity pi = the frequency of the ith phenotype
in the population
The calcu lated Shannon-Wiener diversity values for the eight enzymes
were normalised by H = H/Hmax (Sheldon, 1 969) in which H is the usual Shannon-Wiener diversity measure over phenotypes, and Hmax is ln(N), the maximum diversity for the sample of size N (Section 2.5. 1 ) .

1 79
3.6.2.1 Overall Diversity.
In Table 3-36, the normalised mean phenotypic diversity of M.cookei is
1 1 . 1 1 % less than M. canis. The enzyme systems, GPI and LAP showed no phenotypic diversity for M. canis and M. cookei, while PER enzyme
system showed no phenotypic diversity for M. cookei only. Diheterospora
had no phenotypic diversity for all eight enzymes ..
Table 3-36: Phenotypic diversity of eight enzyme systems of Microsporum and Diheterospora spp . .
Enzyme M. canis M. cookei Diheterospora
system n=54 n=1 8 n=2
CAT 0.400 0.529 0.000 EST 0.657 1 .51 3 0.000 G6P 0.923 0.440 0.000 GPI 0.000 0.000 0.000 LAP 0.000 0.000 0.000 MOH 0.558 0.000 0.000 PEP 0.754 o.n8 0.000 PER 0.383 0.000 0.000
H 0.459 0.408 0.000

3.6.2.2 Diversity of Microsporum spp. from clinical cases, carriers
and soil.
1 80
In Table 3-37, the enzyme systems of CAT, G6P, MDH and PEP from
clinical cases all had a diversity measure of H > 0.5 while EST and PER H was less than 0.5. The isozymes EST, G6P and PEP from carriers had a diversity measure of H > 0.5 and CAT, MOH and PER had H < 0.5.
With isolates from cl inical cases and carriers the m ean diversity was
simi lar but, i n the case of soils (M. cooke1) , there was a lower mean
diversity.
Table 3-37: Phenotypic diversity of isolates of Microsporum spp. isolated from clinical cases, carriers and soils.
Enzyme Clinical Carriers Soils
system n=21 n=29 n=1 8
CAT 0.503 0.350 0.526
EST 0.1 50 0.764 1 .269 G6P 0.998 0.870 0.226 GPI 0.000 0.000 0.000
LAP 0.000 0.000 0.000
MOH 0.598 0.454 0.378
PEP 0.793 0.701 · o.747
PER 0.481 0.350 0.000
H 0.440 0.436 0.393

1 81
3.6.2.3 Diversity of M. canis isolated from Humans and Cats.
Isolates from humans and cats (Table 3-38} had a diversity measure of H > 0.5 for G6P and PEP, with CAT and PER having H < 0.5. GPI and LAP showed no diversity for both humans and cats. The mean diversity was very similar.
Table 3-38: Phenotypic diversity in isolates of M. canis spp. isolated from humans and cats.
Enzyme Humans Cats system n=1 4 n=33
CAT 0.285 0.331 EST 0.208 0.734 G6P 1 .01 6 0.871 GPI 0.000 0.000 LAP 0.000 0.000 MOH 0.652 0.458 PEP 0.849 0.693 PER 0.285 0.331
H 0.41 2 0.427

1 82
3.6.2.4 Diversity of M. canis between regions.
The mean phenotypic diversity for each of the three regions, Palmerston
North, Wellington and Auckland (Table 3-39) , compared to the overall mean phenotypic diversity (Table 3-36, H = 0.463), shows a mi ld degree of inter-regional differentiation. Palmerston North and Auckland isolates
were simi lar while Wellington isolates were different from the other two regions.
Table 3-39: Mean phenotypic diversity in isolates of M. canis isolated from different geographical regions.
Enzyme Palm. Nth Wellington Auckland system n=36 n=09 n=06
CAT 0.352 0.640 0.278 EST 0.725 0.000 0.366 G6P 0.890 0.789 0 .81 3 GPI 0.000 0.000 0.000 LAP 0.000 0.000 0.000 MOH 0.457 0.324 0 .81 3 PEP 0.732 0.640 0 .81 3
PER 0.31 2 0.640 0.278
H 0.434 0.379 0.420

1 83
3.6.2.5 Apportionment of Diversity.
Total diversity (fir) of the M. canis isolates from Auckland, Palmerston
N o rth and We l l i ngton was appo rt ioned by calcu lat ing the m ean phenotypic diversity for each region (sub-population) for each of the four enzyme systems (excluding monomorphic enzymes, Table 4-1 ) fro m which the overall mean was calculated for the within population diversity.
This al lows us to subdivide total phenotypic diversity (/7r) into diversity within populations (Hs) and diversity among populations (DsT) using the
the method of Nei ( 1 975), described in Section 2 .5.2. :
Hr = Hs + DsT
and differentiation among populations is calculated as:
where GsT can vary between 0 (Hs = fir) and 1 (Hs=O, that is the
population is fixed for different phenotypes).

1 84
Table 3-40: Phenotypic dive rsity of M. canis within and between Auckland, Palmerston North and Wel l ington for each
enzyme system.
Enzyme System Hs OsT GsT
EST 0.657 0.364 0.293 0.446
G6P 0.923 0 .831 0.092 0.1 00
MOH 0.558 0.531 0.027 0.048
PEP 0.754 0.728 0.026 0.034
H 0.723 0.61 4 0. 1 09 0. 1 57
All monomorphic enzymes were excluded from the analysis
Hr = Total diversity for the populations
Hs = diversity within populations Osr- diversity among populations Gsr- interpopulation differentiation
The enzymes which were monomorphic (Table 4-1 ) were excluded from
the analysis of interpopulation diversity between the three geographical
reg ions . Table 3-40 demonst rates a considerable variat ion among isozymes for total levels of phenotypic diversity (1-fr), with high diversity
res id ing with in populations (Hs=0 .6 1 4) and a low divers ity among populations (OsT=0. 1 09) . l nterpopulation differentiation was moderate (Gsr-0.1 57).
3.6.2.6 Diversity among M. cookei ''+" and "-" mating strains.
In Table 3-41 , the e nzyme systems CAT, G6P, MOH, LAP and PER
exhibited no diversity for the "+" mating type. EST (H = 1 .431 ) had the
highest phenotypic diversity with G6P and PEP having the same diversity measure of H = 0.644 for the "+" mating type. Simi larly the "-" mating strains had no diversity at three enzyme systems GPI , MOH and PEP. The other five enzyme systems showed variation ranging from H = 0.235
for PER to H = 1 .366 for EST.

Table 3-41 : Phenotypic diversity in "+" and "-" mating strains of M. cookei.
Enzyme (+) (-) system n=06 n=1 2
CAT 0.000 0.292
EST 1 .431 1 .366
G6P 0.644 0.474
GPI 0.000 0.000
MOH 0.000 0.000 PEP 0.644 0.000 LAP 0.000 0.869 PER 0.000 0.235
H 0.340 0.400
For "+" and "-" isolates refer to Table 3-1 0.
1 85
The "+" and "-" (Table 3-41 ) isolates had very similar phenotypic diversity.
3.6.3 Phenotyplc Identity.
3.6.3.1 Relatedness Between the Sepcles.
Phenotypic simi larities between pai rs of the two Microsporum species
and the Diheterospora "contro l" (populations) were calculated using
Hedrick's identity measure (/) . Phenotypic identity was calculated for each enzyme system, and a mean identity calculated from these values
(Section 2.5.3).
l: Pj.x Pj.y
�.y =----------------------------------------------------------
� ( l: P2j.x + l: P2j.y)
Pj.x + Pj.y = is the frequency of the jth phenotype
in populations x and y.

1 86
Table 3-42: Est imation of the degree of sim i larity between the popu lations of Microsporum spp. and Diheterospora
using Hedrick's identity measure (I).
Species M. canis
M. canis 1 .000 M. cookei Diheterospora
M. cookei
0.779 1 .000
Diheterospora
0.000 0.000 1 .000
Values represent the means of the identity values calculated separately for each enzyme system.
Based on Hedrick's identity measure the two Microsporum species can be considered to be closely related, but neither species is closely related
to Diheterospora. (The no identity ( I = 0) i n Table 3-42 could be
i nterpreted to i ndicate a lack of close identity to Microsporum spp. because of the very few isolates of Diheterospora).

1 87
3.6.3.2 Relatedness of M. canis from the Three Regions.
Using Hedrick's identity measure (� . isolates from Palme.rston North are
more closely related to Auckland, as are isolates from Wellington. The Palmerston North and Wellington iso lates have the lowest phenotypic
identity.
Table 3-43: Estimation of the degree of simi larity between the geographical regions using Hedrick's identity measure (�.
Palm. Nth Wellington Auckland
Palm. Nth
1 .000
Wellington
0.794 1 .000
Auckland
0.901 0.874
1 .000
3.6.4 Estimation of phenotypic similarity using the cluster method.
T o g e n e rate a de n d rog ram s h owing p h e n otypic s i m i lar ity, an
e lectromorphic matrix (Table 3-44) containing the isozyme phenotypes of a l l i so lates was analysed by cluste r analysis. Normalised percent
d i sagre em e nt ( PTC) was used as a d istance m easu re and the dendrogram computed by the average-l inkage method o f clustering
(UPGMA) ( Sneath and Sokal, 1 973, Section 2 .5.3). The calculations were performed by the statistical package, SYSTAT (Wilkinson, 1 989).

1 88
Table 3-44: Electromorph profi les pf 76 isolates of Microsporum
and Diheterospora.
Isolate s. lnf. Phenotype N11 for each enzyme system code
CAT EST G6P GPI LAP MOH PEP PER
PN01 cat 2 9 4 1 2 2 3 2
PN02 cat 2 9 4 1 2 2 2 2
PN03 cat 2 9 4 1 2 . 3 3 2
PN04 cat 2 9 4 1 2 2 4 2
PN05 cat + 2 9 4 1 2 2 3 2 PN06 dog + 1 9 4 1 2 2 3 2 PN07 cat + 2 9 4 1 2 2 3 2 PN08 ktn + 2 9 4 1 2 2 2 2 WG09 cat + 2 9 4 1 2 2 3 2 WG1 0 hmn + 2 9 4 1 2 2 3 2 PN 1 1 cat 1 1 0 4 1 2 2 3 1 PN 1 2 cat 2 9 4 1 2 2 3 2 PN 1 3 cat 1 1 1 1 2 2 3 1 PN1 4 cat 2 1 0 4 1 2 3 3 2 PN1 5 cat 2 1 0 4 1 2 3 3 2 PN 1 6 cat 2 1 0 4 1 2 3 4 2 PN 1 7 cat 2 1 0 4 1 2 2 3 1 PN1 8 cat 2 1 1 1 2 3 3 2 PN1 9 cat 1 1 0 4 1 2 2 3 1 PN20 cat 2 1 0 1 1 2 3 3 2 PN21 bkt NA 2 1 0 3 1 2 2 2 2 PN22 cat 2 9 3 1 2 2 4 2 PN23 cat 1 9 2 1 2 2 2 1 PN24 cat 2 9 3 1 2 2 3 2 PN25 cat 2 9 3 1 2 2 3 2 PN26 cat 2 9 3 1 2 2 3 2 RV87 ITM NA 2 8 3 1 2 1 4 2
S = source; lnf = infection; N = unknown ; NA = not applicable;
ITM = tester strains from the Institute for Tropical Medicine;
hmn = human ; bkt = small pieces of blanket (rugs).

1 89
Table 3-44 contd.
RV88 ITM NA 2 8 2 1 2 1 2 2 PN27 dog 2 9 3 1 2 2 2 2 PN28 cat 2 9 2 1 2 2 2 2
PN29 cat + 2 9 1 1 2 3 4 2
WG30A hmn + 1 9 2 1 2 2 2 1
WG308 hmn + 1 9 2 1 2. 2 2 1 WG31 hmn + 2 9 2 1 2 1 2 2 WG32 hmn + 1 9 2 1 2 2 3 1 WG33 hmn + 2 9 3 1 2 2 2 2 WG34 hmn + 1 9 2 1 2 2 3 1 WG35 hmn + 2 9 2 1 2 2 2 2 ?36 ukn N 2 8 3 1 2 2 4 2
PN37 cat 1 9 3 1 2 2 4 2 PN38 cat 2 9 3 1 2 2 3 2 PN39A cat 2 8 3 1 2 2 3 2 PN398 cat 2 8 3 1 2 3 4 2 PN40 cat 2 9 4 1 2 2 3 2 PN41 cat 2 9 4 1 2 2 4 2 PN42 cat 2 9 3 1 2 2 4 2 PN43 cat 2 9 4 1 2 3 3 2 PN44 dog + 2 9 1 1 2 3 3 2 AK45 hmn + 2 8 3 1 2 2 2 2 AK46 hmn + 1 9 3 1 2 2 2 1 AK47 hmn + 1 9 1 1 2 3 4 1 AK48 hmn + 2 9 3 1 2 1 3 2 AK49 hmn + 2 9 4 1 2 3 4 2 AK50 hmn + 1 9 4 1 2 2 4 1 H08 soil 1 4 4 2 1 4 4 2
H30 soil 3 5 3 2 1 4 4 2
A32 soi l 3 2 4 2 1 4 3 2
S33 soil 3 5 4 2 1 4 3 2 A39 soil 1 3 4 2 1 4 4 2

1 90
Table 3-44 contd.
A81 soil 3 1 4 2 1 4 3 2
A1 07 soi l 3 6 3 2 1 4 3 2
A1 25 soil 3 7 4 2 1 4 3 2
A1 52 soil 1 2 4 2 1 4 3 2
A1 53 soil 3 4 4 2 1 . 4 3 2
H 1 54 soil 3 1 3 2 1 4 4 2
A1 55 soil 3 4 4 2 1 4 3 2
H 1 73 soil 3 4 4 2 1 4 2 2
H 1 92 soil 1 4 4 2 1 4 3 2 H21 9 soil 3 5 3 2 1 4 3 2 H223 soil 3 5 4 2 1 4 4 2 H228 soil 1 1 4 2 1 4 4 2 C551 cat 1 3 4 2 1 4 2 2 A028 soi l 4 1 1 5 3 3 5 1 3 H032 soil 4 1 1 5 3 3 5 1 3
Based on the isozyme data in Table 3-44, M. canis showed variation
a m o ng EST, G 6 P , M O H and P E P . G P I and LAP h ad the same
phenotype for al l the M. canis isolates. Simi larly, M. cookei showed variat ion at th ree enzyme system s EST, G6P and PEP but had no variation at GPI, LAP and MOH. For both M. canis and M. cookei at two
enzyme systems CAT and PER some isolates showed the absence of a band.

=ig.3-48: Cluster analysis performed on the results of isozyme
electrophoresis in relation to isolate. (PN,Palmerston North; AK, Auckland; WG, Wellington) Clusters 1 -2, M. cookei; Cluster 3-5, M. canis; Cluster 6, Diheterospora.

I I I I I I I
2al I I I I
:a I I I
I I I I
2bl I I I I
I I I I I I I I I I I I I I I Jal I I I I I I
31 I I I I I I I I I I I I I I I 3bl I I I I I I
Di.stance mot.ric is nonnolixod percent di..:saq.c�etmu:nt avo%agc �inkage method
Source Dist..;ance.s
0.0 �o.o
11154 1----1
1130 I 1--1
Al07 I r----,
H2l9 I f----'
H223
Al55
lll92 I h
11173 I I h I I
A;s3 I I I I J---1 I I I
1\81 I I I I I I I
A32 , I I I I 1-------' I I I
A152 J I I I f--' I
A39 I f--'
CS 51 I I
f--"1 I 1108 I I I
1---' I I H228 I I
1---l S33 I
f--' Al25
M47 ------------------� f--------1
MSO------� I I J-----, I I
wG34 , I I I I 1--------o I I I I
IIG32 j I I I I I h I I I I
wGJO , I I I I I I I I I I I I I
11112J i I I I I I I 1---'1 I 1 1
wGlO J I I I I f--J I I
MH _____ __, I I f--'
PNll ------.., I f--'
PNU, I 1----1 I
Pllll J I I 1----'
Pill 7 ------'
I I ?36 I I
tal I I
I I I I I I I I
tbl I I I I I I
I I I I I I I I I I I
I I I <cl I I I I I I
�I I I I I I I I I I I I I I I I I
I I I I I
I �dl I I I I I I I I I I
·I I I I I I I I I I I I I I I I I I •el I I I I I I I I I I I I I I
IW87 --------l
Pll39 ----'
Pll29 ------,
I h · I I I I
MH ------' I I I f--------1 I I
PNH ----.., I 1 1 I 1·----d 11 I
PNH , I 11 11 I' 1---' 11 11 I
PillS J 11 11 I f.l 11 I
Pll20 ----.., I 11 I I 11
PIU 8 ------1 I 11 1-------' 11
PNH ------' Jl
PNO 1
PN03 J
P!l06 ------, h
Plll2 1 11 I 11
\IG09 i 11 I 11
PN05 i 11 I 11
PNOl 1 11 I 11
PN07 i 11 I 11
IIGlO 1 11 1---'1
ow4n J I PN4l 1 I
PNOC J
I I-I
I I I I I
I h PN37 --� I I
,____, 1 1 PN22 , I I I I
1-----J 11 I P1142 J I I I
f.l
I I I I I I I I I I
MH--� �I I I
f--' I I
Pl/38 , I I !----,1 I
PN25 � J I I I 11 I
PN2C 1 11 I I 11 I PN26 J 11 I
f.l I PN39 ___ __, I f--J
1\KC s -----. I 1----, I PN2l ___ __, I I
I--' WG33 1 I
!----, I P1127 J I I
I I PN02 , I J
1------j I PN08 J I I
1----' l'N28 , I
f----J WG35 J
I I I I I I I I I I I I I I I I I I I I' I I I
I I I
I I I I I I I I I I I I I I I I I I I I I I I I I I I I I I I I I
I WGll ----. f-----J
si I RV81 ------J
--�------------------
I
100.0
f-------1 I I I I I I I I I I I I I I I I
I I I I I I I I I I I I I I I I I I I I I I I I I I
I I I I I I I I
I I I
I I I I
J . AD28 1 61
r-------------------------------1 IID32 J
I I I I

.... . !�' : �;;.- . ·,:
I I I AXSO I I I 1--o I I I NG34 1 I I I I I 1-----1 I I I I I NG32 J I I I I I lo.l h I I I I I · NG30 , I I I I I
. I I I I I I I I I I PN2l -j I I I I I
l l I f------1 I I I I I I NG30 J I I I I I I J----1 I I I I ·uu I I I 1---' I I PN13 I I I 1---' I I PNU 1 I I lbl 1----1 I I I PNll J I I I I I I PN17
I I ?36 I I I 4o. l RV87 I I I I PN39 I I h · I I PN29 I I I I I I AXU I I I I 1--------, I I I PNH I I I f-----, I I I PN14 1 I 1 1 I I � 1 1 I 4b l PNlS J 1 1 I I 1-' I I PN20 I I I I I I I PNll I I I f------1 I I PNH I I I PN43 1 I I I I PN03 J I I I 1------, I I PNO' I I I h I I I PN12 1 I I I I I I I I I NG09 -j I I I I I I I I I PN05 -j I I I I I I I I 4 c l PNOl -j I I I I I I I I I PN07 -j I I I I I I I
4 1 I NGlO -j I I I I � I
f I Jla� � I
I I I I
I I PN04 J I
I h
I I PN37 I I I I 1----. 1 1 I I PN22 1 I I I I I I 1-------J I I I I I PN42 J I ) I I I 1-J I I I Alt48 I I I I f--J I I . PNJI , I
I
I I 1-----11 I 4cll PN2S � " I I 1 1 1 I I . PN24 -1 I I I I I 1 1 I I PH2i J I I I I 1-'
. I . I PNJ9
I I I I I " I I I I
I I I I I I ' I I I I I I I I I I 1 1 I 1 1 I ! 1 1 1-' 1 I I I I I I I I I I I I I I I I I I I I I I I I I I I I I . I . I I I I I I I I I I I I I I I I I I I I . I I I I I I I I I I I I I I I I I I I I I I I I I I I I I I
I f-----J I I
I
I I I I I I I I I I I I I 4• 1 I I I I I I I I I I I I I I
AX45 I 1-----., I
P.N21 I I I--'
WG33 1 �
i'N27 J I I
PN02 , I 1----j
PN08 J I
I I I I I I I
1-----' i'N28 1 I
1-------J WG3S J
I I I I I I I
. I I . I I I I I I
I I I I I I I I I I I I I I I I I I I I I
I I I I I I I I I I I I I I I I I I I I I I I I I I I I I I I I I I I I I I I I I I I I I I I I I I I I I
I WG31 1-------J
s i I
I RV8 8 --------------------------
I . AD2_8 1 ' I
I HD32 J
I I I I I . I I I I I I I I I I I I I I I I
I I I
I I I I I I I I I I I I I I I I I I I I I I I I I I I I I I I I I I I I I I I I I I I I I I

I' . .. �se
li· �J-�· ?:i
average l.inkage method
Source Distances
0 . 0 50 . 0
I Hl54 I J-------, I H30 I I j---,
i l A107 I I 1-----, I H219 I I I 1----' I I H223 I I I A155 I I I I I I Hl92 I I " I I h I I I H173 I I I I I h I I I I I 11153 I I I I I I 2a l 1----' I I I I I I 1181 I I I I I I I I I I I I I A32 , I I I I I I I I---' I I I I
2 1 I 11152 J I I I I I I f--' I I I I A39 I
•. I I f--' I I C551 I I I I j----, I I I HOB I I I I I I---' I I I 2b l H22 8 I I I I f--J I I 533 I I I 1--' I I 11125
- - - - -- - - - - - - - - - - - - - - - - - - - -
I I I I I I I I I I I I I I I 3a l I I I I I I
3 1 I I I I I I I I I I I I I I I 3b l I I I I I I
I I I I I h i I I I I
4b
I I I I I I I
I 4c l I I I I I I
4 I I I I
AKn f----1
AK50 I f----1 I
WG34 1 I I I f----, I I I
WG32 J I I I I h I I I
· WG30 1 I I I I I I I I I I I
PN23 i I I I I I I---' I I I I
WG30 J I I I I 1-----' I I
.AK4 6 I I 1--'
PN13 I 1--'
PN19 1 I f----, I
PNll J I I 1------'
PN17
?36
RV87
PN39 I h ·
PN29 I I I I
AK4 9 I I I f----1 I I
PN16 I f-------, 1
PN14 1 I 1 1 I---' 1 1
PNl5 J 1 1 f-'
PN20 1 1 I PNlB I
I---' I/N44
PN43 1
PN03 J I 1--o
I/N06 I I h i I
PN12 1 1 1 I 1 1
WG09 i 1 1 I 1 1
PN05 i 1 1 I . 1 1
PNOl i 1 1 I 1 1
PN07 i 1 1 I 1 1
WGlO i 1 1 � I
I I I I I I I I I I I I
1 1 I 1 1 I 1 1 1 1 1 1 1 1 1 1 1 1 1 1 1 1 ! I f-'
I - I I I I
I I I I I I I I I I I I I I I I I I I I I
I I -J�H � I I 1 -I I I I I I I I I PN04 J ! I I '
1 0 0 . 0
I I I I I I I I I I I I I I I I I I I I I I I I I
I I I I I
I I I I I I I I I I I I I I I I I I I I I I I I
j ':-,�; r;:· ... . · ... � . ·--..... . �_-- -�- . .• �. • . . ...
I I I

1 92
Fig.3-49: Cluster analysis performed on the results of isozyme electrophoresis. (S, Source; M, mating type (-/+ for M. cooke1) and I, Infection (-/+ for M. canis) ; ITM, tester strain from the
Institute of Tropical Medicine; ukn, source unknown; bkt, "blanket") Clusters 1 -2, M. cookei; Clusters 3-5, M. canis;
Clusters 6, Diheterospora.

OJ.stancc metrl.c l.S nonn.a.iJ.zea percent OJ.sagreemenc average linkage method
M/I Distances
0.0 50.0 100.0
I soil -I f---------, I soil - I I f------1
ll soil - I I f---, I soil - I I I f----l I soil +
I I soil +
I I I I soil + I I I h I I soil - I I I I h I I I I soil + I I I I I 2aJ 1----' I I I I I soil ... I I I I I I I I I I I soil - 1 I I I I I I 1--------' I I I I I soil + J I I I
. 2[ I f---' . I I I I soil + .I I I • I--' I I cat + ,I I I 1---> I I I soil + I I I I I 1--------' I I I 2bj soil + I I I I f---1 I "I soil + I I I f---' I I soil +
-------------------- I I I hmn + I I I I 1------> I I I I hmn + I I I I I I 1------> I I I I I I hmn + 1 I I I I I I I I f---------, I I I I I I I I hmn + J I I I I I I I I Jal h I I I I I I I I hmn + 1 I I I I I I I I I I .. I -I I I I I I I I I I cat - 1 I I I I I I I I
3[ . I 1--------' I I I I I I I 1. I hmn + J I. I I I I I I I I � I I I I I I I hmn + I I I I I I )----J I I I I cat I I I I I f---l I I I I cat I I I I 3bl f---------, I I I I I cat - J I I I I I I I I I I cat · I I
I I I uk.n I I I I I ••I itm N I I I I I I cat I I I h I I . I cat + I I I I I I I I I I hmn + I .I I. I I I 1------> I I I I I cat I 11 I I I I f---------l I l l I I I I cat - 1 I 11 11 I I I I 1--------' 11 11 I I I 4b[ cat - J 11 11 I I I I f-' 11 I I I I cat I 11 I I I I I 1 1 I I I I cat I 11 I I I I :--------' 11 I I I I dog + 11 I I I f-' I I I cat - 1 I I I I I I I I cat - J I I I I f---, I I I I dog + L I I I I I hi I I I I I cat - 1 Ill I I I I I I Ill I I I I I cat + 1 Ill I I I I I I Ill I I I I I cat + 1 Ill I I I I I I Ill I I I I 4c J cat - , Ill I I I I I I I " I ll j· I I I I I cat ... , Il l I .I -I I I I I Ill I I I I
•I I hmn + 1 Ill I I I I I I 1--------' I I I I I I I I cat - J 11 I I I I
I I cat - J w I I I I
I h I I i I· I cat I I I I I I I f---, I I I I I I I cat - 1 I I I I· I I I I I 1--------' I I I I I I I I cat - J I I I I I ·I I I f-..1 I I I I_
I I hmn + I I I I I I I I--' I I I I I I cat - 1 I I I I I I I" f---------l I I I I I I 4dl cat - 1 11 I I I I I I I 11 I I I I I I cat - 1 11 I I I I I I I 11 I I I I I I cat - J 11 I I I I I I f-' I I I I I I cat I I I I I f---' I I I I hmn + I I I I I f---, I I I I I bkt N I I I I I I f---' I I I I hmn + 1 I I I I I f---------, I I I I I dog - J I I I I I 4el I I I I I I cat - 1 I I I I I I f----1 I I I I I ktn + J I I I I I I � I I I I cat - 1 I I I I I 1--------' I I" I I I hmn + J I I I
f---' I I h.-no + I I
SI I I itm N I
----------------- - -- I I 30il I
61 I I soil I

I r--l I
. I I I I r----1 I I I I I I I I I I I 1 I
I r--l I I I l--...j I
r--l I I I I rl I I 1 1 I I 1 1
I I 1 1 I I 1 1 I I 1 1 I I I I I I I I r--l I I I
I I rl I I I I I I I I I ·I I I I I I I l--...j I I I I '-I I I I fi I I I 1 1 I I I 1 1 I I I I l l I I I I l l I ' I ' I I l l I I . I I l l . I I I I l l I I I I l l I I I I l l I I I I l l I I I I l l I I I I l l I I I I l l I I I 1 4 I I I "I I I l..--.l I I I I I I I I rl I 1 1 I 1 1 I 1 1 I I 1 1 I I 1 1 I I 1 1 rl I 1 1 1 1 I 1 1 1 1 I l l 1 1 I 1 1 I I l l I I I L..--..J I I " I I I I I '-I
I
I I I
� I
r--1 I I I I r----1 I I I ' I I I I I I I I I I I I I I ··
I I I I I I I I L-J I I I I
t �OE I I �
t10C I - - - - - - - - - - - - - - - - - - - -
N
+
r +
l -
r +
l -
r -l +
N
+
r -I � -I � -
l -
+
r -
l -
c -
r -
� + I � + I � -I � + I � + I l -
+
r -
l -
+
r -
l -
+
+
H
r -
+
r +
� -I • l +
r +
W�1
""'" UW\(
··�
""'�
... �
.6op
UW\(
<'!q
\1\11\(
... �
... ,
... ,
... ,
... , UW\(
... ,
... ,
... , ":1'0:> ... , UW\( "''"' ... , ... , ... , ... , .6op
... ,
... , · !iop
.. ,
... ,
... , · ��:)
.... , U1lftl
... ,
... , 1lr"'!
"'(ft
":1'0:>
... , ,.� ... , UW\( UW\( ... , """!
"""'
I I > I
I I I I I I I I I I I • •
I I I I I I I
I I I I I I I Pt
.I I I I I I I I
I I I I I
· I I
I I I I I I I I • I I I I I I I "• I I I I I I I I I I I I I I I I I I I I I I I I I
I I I I I I I I I I I I I l qt I I I I I I I I I I I I I I I I I
I I I I I 1 .. • I I I I I
I I I I l qt I I I I I I I
I I I I I I
"I
I . 1 £ I I I I I I l •t I I I

M/I Dis tances
o . o 5 0 . 0 1 0 0 . 0
I soil -I I soil - I I f--'1
l l soil - I I 1-----, I soil - I I f----!
soil +
I soil + I I soil + I I h . I soil - I I I h I I I soil + I I I I
2 a l 1---' I I I I .soil + I I I I I I I I soil - , I I I
I I I I I I I soil + J I I I
. 2 1 I 1--' . I I I soil + . I I • 1--' I I cat + I I I r---, ' I I I soil + I I I I I I I I 2b l soil + I I I I 1----1 I I soil + I I I 1--' I I soil +
- - - - - - - - -- - - - - - - - - - -
I I hmn + I I 1------o I I hmn + I I I 1------o I I I hmn + , I I I I I I I I I I hmn + J I I I I I 3a l h I I I I I hmn + , I I I I I I I - I . I I I I I I I c a t - 1 I I I I I
3 1 . I I I I I I 1 . I hmn + J I. I I I I I I I f-1 I I I I I I hmn + I I I I I 1----1 I I I I I cat I I I I I I f--1 I I I I I cat I I I I I 3b l I I I I I I cat - J I I I I I I I I I I f cat I - I I
I I I ukn I I I I I I I h i itm N I I I I I I cat I I I h I I I cat + I I I I I I I I I I hmn + I . I I . I I I 1--1 1 1 I I I cae I 1 1 I I I I I l l I I I I cat . - , 1 1 1 1 I I I I 1 1 1 1 I I I 4bl cat - J 1 1 1 1 I I I f-1 1 1 I I I cat I 1 1 I I I I 1 1 I I I cat I 1 1 I I I 1 1 I I I dog . + 1 1 I I y I I I cat - , I I I I I I I I cat - J I I I I 1----o I I I I dog + I I I I h I I I I cat - , 1 1 · I I I I 1 1 I I I cat + 1 1 1 I I I I 1 1 I I I cat + 1 1 1 I I I I 1 1 I I 4 c l cat - 1 1 1 I I I I ' I I I I I I cat + 1 1 1 - I I
' I I I 1 1 I I 4 1 I hmn + 1 1 1 I I
I I I I I

1 93
CHAPTER 4
DISCUSSION
The Soil as a Natural Reservoir of Pathogenic Fungi.
Central to the study and control of mycotic diseases is the acquisition and uti l isation of knowledge con cerni ng the natural habitat of the
aetiologic agents (Ajello, 1 980) . Such information is of great value i n determining the prevalence of pathogenic fungi in the environment in any
particular area. lt allows the delineation of endemic regions, the tracing
and discovering of the point of outbreaks, and the development of control measures. Fresh isolates for taxonomic, genetic and other studies should
always be obtained.
During the present study, the investigation of the soil was by the hairbaiting technique (Vanbreuseghem, 1 952b) which selectively allows the
growth of keratinophil ic fungi at the expense of other soil fung i . The studies were particu larly aimed at the isolation of M. cookei, a nonpathogenic geophi le morphologically similar to M. canis, for comparative enzyme and epidemiological studies. A total of 1 6 isolations of M. cookei was achieved from the 236 soil samples examined. Using the Stockdale
technique and all possible mating combinations, five of the isolates were
found to be of the "-" mating type, and 1 1 were of the "+" mating type.
The "-" mating types were not fertile with each other and neither were any of the "+" mati ng types. Padhye and Carmichael ( 1 971 ) also found
predominantly M. cookei of the "+" mating type and that ferti lity in M.
cookei, just like in A. uncinatum is not an all-or-none phenomenon, there were both strong and weak reactors existing in nature.
All the keratinolytic fungi isolated in this study are usually considered as
non-pathogens, with the except ion of the M. gypseum complex. M.
gypseum has been reported to .cause infections in man, cats, dogs and
horses (Vanbreuseghem et al. , 1 978 ; Demange et al. , 1 992). For the period 1 987 to 1 992, M. gypseum isolations in New Zealand have been
reported to range from 1 :0% to 1 .8% of the total dermatophytes from skin

1 94
samples and was the on ly geophilic dermatophyte i solated (Mycoses Newsletter, CDCNZ, 1 991 to 1 992). However, M. gypseum was very rare
in the soi ls sampled, even though some of the soi ls came from paddocks and school g rounds. This is a s imi lar observation to that made by Marples ( 1 965) in her study of New Zealand soi ls. Marples suggested that the general absence of M. gypseum could be due to competition for the keratin bait by T. ajelloi, which is more prevalent in New Zealand
soi ls.
Since T. ajelloi was the most frequently isolated keratinolytic fungus, its
distribution in relation to soil pH was assessed and M. cookei i ncluded for comparison. Both were most often found in soils within the pH range of
5 . 1 to 7.0 (83.8%, T. ajelloi and all M. cookei iso lates). Other workers have found T. ajelloi to be widely distributed in the environment, and it is
a true soi l i nhabitant, l ike Ctenomyces serratus (Pugh, 1 964) . Marples
(1 965) proposed that T. ajelloi 's distribution was re lated to the soi l pH and temperatu re, being found in alkaline soils and cool to temperate climates. The distribution of keratinolytic fungi in general however, seems
to be affected by the distribution and availability of keratinous substrates
in the environment (Bohme and Ziegler, 1 969 ; De Vroey, 1 984). For instance, Arthroderma curreyi survives in the close vicinity of keratinous substrates (Baxter, 1 969). In this study, A. curreyi was isolated from the
hair of a cat and a dog.
T h e re w e re n o i s o l at i o n s of any a nt h ro p o p h i l ic n o r zooph i l i c
dermatophytes from soi l , although T. mentagrophytes has been isolated from the soil by other workers (Lurie and Borok, 1 955; Baxter, 1 969). The
apparent absence of anthropophilic and zoophi lic fungi in soil has been
suggested to be due to their inherent inabi l ity to survive in such an
environment (Ajello and Cheng, 1 967). For example, studies by Grin and
Ozegovic (1 963) demonstrated that anthropophiles and zoophi les which are highly adapted to a parasitic life on the keratinous structures of man and animals were lysed by a variety of microorganisms when placed in
the soil. M. gypseum, T. ajelloi and T. terrestre were resistant to lysis.
lt was observed that the use of "ke rati n-in-contact with soil" (Griffin ,
1 960b) produced a characteristic fungal f lora. The enviro nment of

1 95
"keratin-i n-contact with soi l" was fi rst occupied by highly competitive saprophytic fungi with the abi l ity to use the less complex nutrient
substrates. Moulds such as Fusarium and Penicillium and a number of
the Mucorales, which are fast growing and nutritionally less exacting, are good examples (English, 1 965) . Besides the above fungi, others which
appeared as part of the soi l environ ment can be regarded as less
competitive saprophytic fungi, able to utilise the most resistant part of the substrata . The keratinolytic fung i such as M. cookei, M. gypseum, T.
ajelloi and T. te"estre isolated in this study are very characteristic of this
g roup. Other studies conducted in Australasia on the isolation of keratinophilic fungi from the soil have reported similar types of fungi, for example Chrysosporium, Cladosporium, Diheterospora, Fusarium, Gliocladium, Microsporum, Mucor, Paecilomyces, Penicillium,
Trichophyton and Verticillium (Ajello and Alpert, 1 972 ; Marchisio et al. , 1 991 ; Soon, 1 991 ).
The rare i so lations of e . g . Cladosporium, Rhizopus, Mucor and
Trichothecium were possibly of litt le significance as "keratinophi lic". Perhaps the defi nit ion of "ke rat inophi l ic" used here was too broad. However, some of these rarely encountered genera e.g. Scopulariopsis, do have some ability to digest keratin (Baxter, 1 968, English, 1 965) and
may be known "opportunistic" nail and skin invaders (Evans and Gentles,
1 985).
A lthough the primary ai m of the keratin-baiting technique was to isolate
keratinolytic spp. , for the purposes of this discussion, some comments on the isolation of other potentially pathogenic fungi will now be included, as
most of the fungi causing human infections are acquired from the e nvironment and the soi l is a known source of most of the pathogenic
fungi (Dei Cas and Vemes, 1 986). In the broad studies reported here, it was fou n d that kerat inoph i les (Sect ion 3. 1 ) i n g eneral were very abundant i n soi ls. I n particular, Cunninghamella, Diheterospora,
Fusarium, Gliocladium and Paecilomyces (Table 3-2) were very frequently isolated. Many of these mou lds found i n the soi l have a com mon biological role as agents of decomposition of the foliage and
dead material of plants (Male, 1 990), as we l l as the destruction of
keratinous substrates. The acquisition of infections by man caused by

1 96
these species can therefore be considered as an "accident" as these fungi do not need to colon ise man or other animals for their survival.
Even without caus ing disease they are able to survive in the soi l indefinitely.
S o me of the fu ng i i solated have been reported as pathogens i n
compromised patients in New Zealand, particularly the genera Fusarium and Paecilomyces (CDCNZ, 1 991 , 1 992). Fusarium spp. were most
common in soils from recreational parks but had a similar frequency in soils from cleared areas and school grounds. Paecilomyces, on the other hand, was more prevalent in soils from school grounds, roadsides and
recreational parks. Soil therefore, can be considered a potential source of infections by the fungus. In contrast, another genus often associated with i nfections of comprom ised patients, Aspergillus, was not found in the
soils sampled by the hair baiting technique. A study by Griffin (1 960b) in Australia also reported that Aspergillus was extremely scarce from the soils he surveyed.
O n e s peci es i so lated fro m so i l and meet i n g t h e defi n it i on of "keratinophile" used here was Conidiobolus coronatus (Entomophthora
coronatus). C. coronatus usually occurs as a saprophyte on plant debris.
A d isease (entomophthoromycosis) caused by the fungus is more com mon in tropical and subtropical areas of the world (King, 1 979; Costa et al. , 1 991 ). At the moment, there is no known report of the infection in
New Zealand. The only other report of this fungus in this part of the world
is by G riffin ( 1 960b) from a soil sample in Australia, although Baxter
(personal commu nication) has noted it a number of times on keratin
baits.
Small Animal Reservoirs of Potentially Pathogenic Fungi.
Studies by Marples ( 1 956) and many others world-wide have provided
evidence over the years that cats and dogs are a major reservoir of
human i nfections caused by M. canis. For th is study therefore, the
i nvestigation of the status of animals for potential ly pathogenic fungi , particularly M. canis was confined to cats and dogs.

1 97
In the study, 1 8.5% of cats and 5. 1 % of dogs were either carriers of or where infected with M. canis. Simi lar results have been reported from
other i nvestigations of small animals as carriers of keratinophi lic fungi, e.g. 36% of cats and 7.5% of dogs were found to be positive for M. canis by Baxter (1 973). Zaror et al. (1 985) in Chile reported 88.46% of cats and 7.93% of dogs positive for M. canis, while Kaplan and lvens (1 961 ) in the
United States found 29.5% of cats and 1 2.8% of dogs positive for M.
canis. A t-test performed by SAS (SAS Institute I nc. , 1 988) showed a
significant difference (Ps:0.05) between the two animals as carriers of M.
canis (and other fungi), cats being the favoured host.
The present study and other studies over the years (Marples, 1 956, 1 959; Smith et al. , 1 969; Baxter, 1 973; Woodgyer, 1 977; Carman et al.,
1 979) h ighl ight the importance of cats as reservoirs of M. canis in New Zealand. The cat is considered by some investigators to be the natural host of this fungus (Male et al. , 1 980).
The M. canis isolates in this study were all of the "-" mating type. Studies
from other parts of the world have also reported only the "-" mating type isolated from either actual infections or carriers (Weitzman and Padhye,
1 978). Whether this is due to a "high virulence" (or selective advantage) of the "-" mating type in infecting the host is not clear. Kwon-Chung ( 1 974) suggested that the "-" mat i ng type may have a selective
advantage over the "+" mating type in actual pathogenicity. However, the factors favouring the "-" mating type were not defined.
If the hypothesis of Person (1 968; cited by Dei Cas and Vernes, 1 986),
regarding parasitism is evoked to explain this observation it is possible to imagine the existence of "specific genetic i nterrelationships" between
genes in the host governing resistance to the parasite and genes in the
parasite which govern its vi ru lence to the host. According ly, selection may favour mutations in the host which place the parasite, in this case
the "+" mating type, at a disadvantage. The selective pressure may have
lead to the "-" mating type becoming progressively more vi ru lent as a
result of selection of genes of greater virulence.
Most isolations from cats examined by the hair brush technique were of
kerat inolytic fungi (Table 3-7). Among these Chrysosporium spp. were

1 98
t h e m ost com m o n , f o l l owed by Microsporum spp . and last l y ,
Trichophyton spp . . Chrysosporium spp. �ere also very common on dogs. Its pathogenicity sti l l remains uncertain (Chabasse et al. , 1 989). Of the Microsporum spp., M. canis constituted the majority of the isolates, with on ly a s ingle iso late of the geoph i le M. cookei from a cat. Of the
Trichophyton spp . , T. terrestre was the m o st f requent , w i th T. mentagrophytes var. mentagrophytes as the second most common. T. ajelloi was infrequent and there were two isolates of Arthroderma curreyi.
Other fungi of medical i mportance which were isolated from cats and
dogs were Alternaria, Aspergillus, Cladosporium, Mucor, Penicillium and
Paecilomyces. As has been sai d , t h e se can be respons ib le fo r opportunistic infections especially in debilitated and compromised hosts. Some of the fung i , such as Alternaria and Cladosporium are also
responsible for rhinitis, asthma and extrinsic al lergic alveolitis. These
fungi are both common in air by day in dry weather (Lacey, 1 990).
The high incidence of M. canis of 1 8.5% on cats and 5. 1 % on dogs with
and without clinical symptoms emphasizes the potential for the presence of the fungus i n the home environment. In New Zealand, females get infected by M. canis more than males (CDCNZ, 1 992) possibly because they tend to make more frequent close contact with cats. La Touche (1 955) and McAieer ( 1 980) in their studies found that the major factor i n the spread of tinea was the opportunity o f di rect contact with animals
which were either carriers or infected. Children were the most susceptible
to i nfection and acquired the infection through d i rect contact with the
an i mals. Th is situation leads to transmission of the parasite to other members of the family resulting in intrafami lial infections (Lunder, 1 992),
particularly of siblings and mothers.
The other mode of t ransmission to man is i nd i rect through i nfective
propagules originating from active lesions of infected animals which enter
the human environment, through contact with contaminated fomites such as furniture, clothing and floors� (Male , 1 980; De Vroey, 1 984). This is
well i l lustrated in this study by the isolation of M. canis from a "blanket" used for cats. Infected hair and scales are known to remain infective for
months, in one case they stayed viable for 1� years (Male, 1 980). In New

1 99
Zealand, studies by Smith et al. ( 1 969) have shown that zooph i l ic species, with the exception of M. canis, are of less importance to human
populations. This has lead to the suggestion by some authors (Smith et
al. , 1 969 ; Baxter, 1 973 ; CDCNZ, 1 991 , 1 992) that the dynamics of human infections caused by M. canis in New Zealand tends to reflect the incidence of infections in the feline populations. This is well i l lustrated by the corresponding h igh incidence of M. canis i nfections i n humans
compared to other dermatophytes reported from CDCNZ. Over the years 1 987 to 1 992, M. canis was by far t h e m ost f requent zooph i l i c
dermatophyte isolated.
The lack of isolation of M. canis directly from the soi l in this and other studies (Hill , 1 959; Georg, 1 959; Marchisio et al. , 1 991 ) suggests that M.
canis has lost its ability for saprophytic life in the soi l.
In summary, the inter human, human-animal and human-environment
relationships constitute the prime factors that can explain the presence or the absence of infection (Mantovani, 1 982). The increasing number of pet
ani mals such as cats and dogs means a frequent source of infective part icles i n the home environment and therefore the creation of a
permanent source of exposure.
Dermatophytes and other disease-produci ng fu ngi depend o n a favou rable envi ronment for their conti nued existence as pathogens. However, the environment is continuously changing and the reaction of the fungus determines its ability to survive. The environment can be
studied at two levels, that of the substrata with which the pathogen is in
contact and, at a b roader leve l , changes i n the substrata and/or envi ronment which allow dispersal of the fungus to occur (English, 1 980}.
The seasonal distribution of M. canis isolations from animals in this study
was 22.2% for the "summer" from November to April and 77.8% for the
"winter" months. lsolations were compared to the average meteorological
readings (Table 3-9) using statistical analysis. There was a strong
positive correlation between M. canis and re lative humidity, the higher the relative humidity, the more isolations being made. But there was a
negative correlation between M. canis and temperature. This has been

200
interpreted to mean that relative humidity and temperature have an effect on the seasonal distribution of M. canis, since there was an increase in M. canis with decreasing temperatures and increasing relative humidity.
Other studies (Marples, 1 951 ; Smith et al. , 1 969; McAieer, 1 980) have also reported an i ncrease of M. canis in the fe l ine population in winter. The increase in clinical cases of human ringworm at this time has been
attributed to an increase in the kitten population. Kittens are born at the end of December and January, and sometimes in April and early May (Smith et al. , 1 969). The young animals, which are more susceptible to
i nfect io n , t h e refore beco me m o re abundant at the t i m e s w h e n temperatures are cool and seem to favour the spread of the fungus from animal to animal. In this study M .canis distribution peaked in May-June, t hus a com bi nat ion of the an imal ( kitte n) reservoi r and opti m u m temperature for spread of the fungus could be postulated.

201
Biochemical Assays.
The biochemical assays performed in this study were primarily aimed at determining if relative enzyme activity as revealed by a comparison of the co llected M. canis and M. cookei strains might serve as an indicator of
virulence. The underlying assumption made in determining enzymatic activity by biochemical assays is that the quantitative variation i n for
example, proteo lytic and/or e last inolyt ic activity is responsible for differences in virulence between strains (Gadasi .and Kobiler, 1 983; Eakin et al. , 1 993). The identification of such vi ru lence factors has been dependent on, and l imited by, the abi l ity to mimic host envi ronmental factors in the laboratory. lt is to be hoped that the expression of most vi ru lence factors is regulated by environmental conditions in vitro that
presumably reflect similar cues present in the host tissue.
E nzymes as viru le nce factors are hypothesized to act (a) when the pathogen comes i nto contact with the target cells and/or (b) at a distance as diffusible soluble product(s) of the pathogen, which may enhance its
survival i n tissues by chemically o r physical ly altering the immediate
environment, or by directly digesting host proteins.
The gelatin plate hydrolysis used in this study as a general i ndicator of proteinase expression by the Microsporum i solates, was not of much diagnostic value i n relation to the concept of pathogenicity. The values
obtained expressing relative proteolytic activity for M. canis isolates from
clinical cases and carriers were very similar (see Table 3-1 2). Indeed, the
non-path ogen ic M. cookei showed much h igher activity. Thus th is measure could just i ndicate that M. cookei i s better able to uti l ise
proteinaceous substrates in vitro.
One factor which can influence expression of enzymes is the method of culture. In the case of dermatophytes, shake cultures are useful for such
studies as the fungus produces hyphae and arthrospores resembling the
paras i t ic l i fe phase of t h e f u n g i fou nd i n scales, hai r and nai ls
(Raubitschek, 1 955) . Th is is the g rowth type referred to as "pseudo
parasitic" (Evron-Maoz and Raubitschek, 1 960). Stationary culture on the
othe r hand, produces hyphae and macro- and microconidia as found in

202
the saprophytic phase of dermatophytes, i n which quite different factors could be involved in keratin breakdown.
The enzyme assays for proteinase (using azocoll) and elastase (using
elastin powder) had a good reproducibi lity, but keratinase (using dyed wool) had large variations from one assay to another. This may be due to the uneven content of the dye in wool. Nevertheless, this problem was part ly overcome by the statistical methods e mployed. The weighted mean for the three enzymes was employed for comparison based on the
contrasting treatments of shake and stationary culture. Proteinase activity for M. canis isolates as a group for each treatment showed a very highly significant (P = 0.001 6) difference in expression in shake compared to
stationary cultures (Table 3-1 4, 3-1 5; Fig .3- 1 8). Elastase activity on the
othe r hand was very significantly higher (P = 0 .0001 ) in stationary than shake cultures (Table 3-1 4, 3-1 5; Fig.3-21 ) . This suggests that although elastase may be produced during infection it is not equally as important as proteolytic activity during pathogenesis. But there was no significant difference (P = 0.4324) observed for keratinase production between the shake and stationary cultures.
The correlation coefficient (" of M. canis in shake cultures for proteinase and e lastase expression were significantly negatively correlated (r = -
0.505). This may mean that when the expression of one increases the other enzyme decreases. lt should be noted, however that correlation does not necessari ly mean causality. The corre lations for the other
e nzymes (kerati nase and proteinase; keratinase and elastase) were
i nsig nificantly very low (Table 3-1 7). In statio nary cu ltures, keratinase
and proteinase ( r = 0.068) were very weakly correlated and so were
p rote i nase and e l astase expressions ( r = 0 .006) , both were n ot
significant. For M. cookei shake cultures, all the correlations (proteinase
and e lastase (r = -0.344) ; keratinase and proteinase (r = -0.204) and keratinase and elastase (r = -0. 1 45)) were negative and non significant.
Therefore, there was no coordinated relationship in the expression of the
three enzymes.
Proteolytic activities of the individual isolates varied widely for M. canis.
Nevertheless, for stationary cultures, isolates from clinical cases had a
sl ightly higher basel i ne proteinase activity compared to isolates from

203
carriers (Fig .3-20). For all the isolates, there was also a consistently
higher expression of proteinase activity in shake cultures than stationary cultures. These observations also emphasized the differences in enzyme expression between the two growth phases, "pseudo-parasitic" and
saprophytic. Similar results have been reported for differences in enzyme expression between the mycelial (saprophytic) and yeast (parasitic) phases of Paracoccidioides brasiliensis (Bedoya-Escobar et al. , 1 993). The proteinase-elasti nolytic activity was high in the mycelial phase and
absent in the yeast phase.
The expression of e lastinolytic activity of M. canis was detected in both isolates from clinical cases and carriers. For stationary cultures, isolates from clinical cases had a slightly higher baseline elastase activity than the carriers (Fig.3-22). Overall and in contrast to proteinase production,
the isolates showed a significantly lower expression of elastases in shake cultu re as discussed above. This result is again in good agreement with Bedoya-Escobar et al. (1 993) . The reduced expression of e lastase i n shake culture may mean that elastases probably do not play as critical a
role as proteinases i n the pathogenesis of dermatophytoses caused by M. canis. Other workers (Denning et al. , 1 993) have also expressed doubts about the importance of elastase as a viru lence factor. In stained histological sections of invasive pulmonary aspergillosis, they found no disruption of elastin in the immediate proximity to hyphae (Denning et al.,
1 992) . However, th is hypothesis requi res further in vitro and in vivo
stu d i e s such as use of ce l l mono lay e rs and an imal i n ocu lat ion
experiments.
For keratinase production, some isolates showed higher expression i n
shake culture than in stationary cu lture ( Fig.3-24). But there was n o significant difference between the two series. This may seem to support the h ypothesis of O 'Sul l ivan and Math ison ( 1 971 ) that keratolysis
probably does not play a critical role once the mycelium is established i n the epidermis. Additionally there was no significant levels of keratinase
detectable in cultures of most isolates and keratin assays had a poor
reproducibi l ity. Other authors have reported simi lar observations and
suggested a restricted substrata specificity as a possible reason, or the
removal of some accessory proteins capable of splitting disulfide bonds
present in keratinized proteins (Sanyal et al. , 1 985; Kunert, 1 992). This

204
theory has been partly supported by Kunert's studies which seemed to
suggest that proteolytic enzymes are more active in the presence of reducing agents and of sulphite in particu lar. He has proposed the reduction of su l fide as the reason , s i nce the reduction of 20% of disulphide bonds resulted in enhanced wool hydrolysis.
The resu lts with M. cookei fo r prote i nase expre ssion was a lso sign ificantly higher (P = 0.01 6 1 ) in shake than in stationary cultures. Nevertheless, the resu lts of these enzyme assays did not compare well
with gelatin/50S-PAGE, unlike those with M. canis. Shake cultures which showed high proteolytic activity using enzyme assays produced fewer
protei nase bands on gelatin/50S-PAGE. On the other hand, stationary cultures with low proteolytic activity produced more proteinase bands compared to shake cultures. But elastase expression was statistically
(P=0. 1 377) simi lar between the two treatments. For keratinase, there was a complete lack of expression of this enzyme in stationary culture .
lt shou ld be noted that in this study, the capacity of a dermatophyte to
produce enzymes (proteinase, elastase and keratinase) was estimated under controlled conditions of laboratory culture . lt is quite likely that
some strains may be able to produce greater or lesser quantities of the enzyme(s) under the growth conditions avai lable on the skin of a patient. For e xample, some workers have reported leucyl-am inopeptidase, proteinase and keratinase activity of some strains of dermatophytes are markedly enhanced when they are grown on keratin in vitro as compared
to the activity demonstrated during growth on ordinary media (Male and
Holubar, 1 968). Gadasi and Kobi ler ( 1 983) demonstrated significant
differences in content of proteolytic enzymes in Entamoeba histolytica
trophozoites of two strains known to d iffe r i n the i r v i ru lence , but
jifferences were dependent on the substrata used to demonstrate them.
=or i nstance, differences were fou nd with azocoll and azocasein as ;ubstrates, probably attributable to specific e nzymes e.g. collagenase
Nhich recognises azocol l but not azocasein , as azocol l is a collagen
;ubstrate with an azo dye attached to it. The bond between collagen and
he azo dye is also recognised by other proteolytic enzymes (Moore , ! 969).
·hus the difficu lty i n us ing biochemical assays in vitro to corre late
1athogenicity is that pathogenicity occurs only in vivo, under nutritional

205
and environmental conditions which may be different from those provided i n laboratory cu ltu res. For th is reason , Mahan et al. , ( 1 993) have developed a genetic system, termed i(l vivo expression technology (IVET), that does not rely on reproduction of the environmental signals but depends on the induction of genes in the host. This technique uses an avirulent Salmonella strain which lacks purA. Functional copies from
other bacteria jo ined to lacZ (a gene that m akes an enzyme easily detectable by a colour assay) are cut and i nserted in front of the two
gene combination to make DNA constructs. These are transformed into
mutant bacteria lacking purA and used to i nfect mice. Some of the bacteria that survive after a few days in mice are considered to contain host specific Salmonella gene fragments which allowed them to survive i n the host.
Similarly, dermatophytes may not express some of the virulent genes in
vitro and may only be turned on in vivo. Some enzyme assays therefore
m ay be useful on ly in as far as they al low the detection of enzyme
p roduct ion by an o rgan ism, but may not necessari ly re late to the organism's ability to cause disease.
Characterisation of Proteinase Enzymes using Inhibitors.
The fi rst indication for mu ltiple proteinases in both M. canis and M. cookei filtrates came from the use of specific inhibitors. For both M. canis
(Table 3-23) and M. cookei (Tab le 3-24), there was i nh ibit i o n of
azocollytic activity by a1 -proteinase and phenylmethylsulfonyl fluoride (PMSF) inhibitors, i ndicating the presence of serine-catalysed proteinase
activity. Proteinases from other dermatophytes have also been reported
to be sensitive especially to PMSF and a1 -Proteinase (Meevootisom and N iederpruem, 1 979; Sanyal et al. , 1 985; Asahi et al. , 1 985). The production of a serine proteinase by M. canis has also been reported by
Takiuchi et al. ( 1 982, 1 984). They est imated it to be a 45 000-Mr proteinase. The antiserum raised against it cross-reacted with material in the culture fi ltrates of M. gypseum, T. mentagrophytes and T. rubrum. This result means that structurally simi lar proteinases may be expressed
by some or most of the dermatophytes. A simi lar finding was reported for
e last i no lytic se ri ne p rotei nase f rom Aspergillus flavus w hich had
antibodies immunologically related to A. fumigatus (Kolattukudy et al. ,

206
1 993). These f ind ings together emphasize that structural ly s imi lar
enzymes may be expressed by closely related species.
M. canis culture filtrate had no sensitivity to 1 , 1 0-phenanthroline (PT) but to ethylenediaminetetraacetate (EDTA), while M. cookei was only slightly
inhibited by the two metallo-proteinase inhibitors (see Table 3-24; Fig.3-
31 ). In fact, M. canis fi ltrate increased in activity in the presence of PT.
The opposite effects of EDTA and PT may be attributed to an activation
or a stabilisation of some members of other enzyme classes (seri ne, cystei ne or aspartic) by metal ions (Dunn , 1 989) . That is why the
diagnosis of metallo-proteinases is best determined on their i nsensitivity to the three other classes of inhibitors plus the observation of inhibition
by the chelating agent. At present it is not clear why increased M. canis enzyme activity was observed with PT, as this did not occur with EDTA.
Studies with cysteine inhibitors showed i nhibition of azocollytic activity of M. canis and n ot M. cookei using th ree different cysteine i nhibitors (Tables 3-23, 3-24). There was significant inhibition by ,r ch loromercuribenzoic acid (pCMB) (73. 1 %) whi le the other cysteine i nhibitors, L-trans-epoxysuccinyl leucylamido (4-guanidino)-butane (E-64)
and iodoacetic acid ( IAA) showed less i nhib ition (31 .2% and 31 .6%
respectively). This suggested the presence of a cysteine proteinase(s) in M. canis fi ltrate. Chattaway et al. (1 956, 1 963) reported strong inhibition
of peptidases of T. verrucosum var discoides and M. canis by pCMB and
65% i nhibition of e ndogenous respi ration i n M. canis using IAA. The
production of cysteine proteinase by a Micropsorum spp. has also been
reported by Roberts and Doetsch (1 967), although the fungus was not
identified to a species level. In addition, M. fulvum (Nannizzia fulva) has
been reported to produce a cysteine elasti nolytic proteinase which was inhibited by pCMB, urea and IAA (Werb et al. , 1 982). However, there is
no information on the structural similarity of the cysteine proteinases from different dermatophytes.
Some inhibition was observed with M. canis filtrate with pepstatin , which
suggested aspartic proteinase(s) . However, there was no inhibition by
pCMB, IAA, E64 and pepstatin with M. cookei f i ltrate, i ndicating an
absence of extracellular cysteine and aspartic enzymes.

207
From the data presented in th is study, it is suggested that M. canis produces one o r more serine prote i nase {s), one or more cystei ne proteinase(s) and possibly an aspartic proteinase(s). M. cookei produces
o n ly serine p rote inase (s). M. canis, therefore, expressed a range of proteinase types, all which have been implicated in the pathogenicity of a
wide range of microorganisms, including Trypanosoma, Aspergillus and Serratia. However, purification and characterisation of the enzymes with t h e used m et hods and addit iona l o nes wou ld fu rt h e r def ine the p rotei nases p roduced especial ly by M. canis and whethe r E DTA i nh ibition was due to the presence of a metallo-protei nase (s). The presence of more than one type of proteinase has been reported in a
number of other species with at least two and sometimes three types of
proteinases produced. Multiple forms ( isoforms) of a proteinase of the same activity but of different Mr have been reported to be produced by the same organism (North, 1 982).
Inh ibition of M. canis and M. cookei elastase enzyme(s) occurred only with the two chelating agents, EDTA and PT. There was no inhibition of the e lastase(s) by the three other classes of inhibitors (Table 3-23, 3-24). Therefore, both M. canis and M. cookei express only metallo-elastinolytic
p rotei nase (s) . Th is fi nd ing is supported by the fact that microbial e lastases are u sually metal lo-proteinases (Mckerrow et al. , 1 985).
Nevertheless, the function of fungal elastases is not well known, although one of their characteristics is a broad substrata specificity. They have the abi lity to degrade fibronectin, laminin, gamma g lobulins, a1 P1 keratin and type IV collagen (Apodaca and Mckerrow, 1 990). Elastin is thus only one substrata elastase enzymes can degrade.
C haracterisat ion of prote inases and e lastases would allow rational design of synthetic chemotherapeutic agents. For example, synthetic
peptidase inhibitors have been reported to lyse T. cruzi trypomastigotes
in vitro.

208
Multiple Proteinase Expression.
Extracellular enzyme expression in stationary and shake cultures was determined using Sabouraud broth as medium. Although there were some variations i n the number of enzymes expressed by the different
isolates under the same treatment, in general, six proteinases of different molecular weights (Mr) were detected with M. canis (1 22 KDa, 64 KDa, 62 KDa, 44 KDa, 36 KDa, and 28 KDa). Of these, Mr 122 KDa, 62 KDa and 28 KDa were very highly expressed (P=0.0001 ) in shake but not in stationary cu ltures. To determine i f the degree of aeration might be
i nvolved in these differences of enzyme expression, the oxygen content of the Sabouraud broth was measured in the two cultural methods. There was no significant difference (X2 =8.95; P�.05) in oxygen concentration of Sabouraud broth in the two cultural methods.
The proteinases of Mr 64 KDa, 44 KDa, and 36 KDa, expressed in both shake and stationary cultures, can be considered to be constitutively expressed s i nce they are expressed i n both the saprophytic and
"pseudo-parasitic" forms. The Mr 64 KDa protei nase was more highly expressed i n shake cu lture, thus th is proteinase may be expressed
constitutively at low levels and only peaks when i nduced by a change in
morphology, from the saprophytic to the parasitic form.
In contrast, those proteinases of Mr 1 22 KDa, 62 KDa, and 28 KDa could
well be induced by a change in morphology from saprophytic to parasitic
form. lt is suggested that the additional proteinases produced in shake culture may play a critical role in the pathogenicity of M. canis.
These proteinases may possibly be the ones which provoke inflammatory responses. Studies by Minocha et al. (1 972) have shown a correlation of
high proteolytic activity and the more acute inflammatory infections of T.
mentagrophytes. When kerato lysis i s considered as disti nct f rom
proteolysis o f the less hardened epidermal proteins, keratolysis probably p lays a less crit ical ro le once the m yce l i um is establ ished i n the epidermis (O'Sull ivan and Mathison , 1 971 ) . Maeda and Molla (1 989),
studying the ro l e of p rotei nases in the pathogenicity of bacterial
pathogens, i ncluding Serratia marcescens 56 KDa, 60 KDa, and 73 KDa
protei nases and Pseudomonas aeruginosa alkaline protei nase and

209
e lastase (and also a prote inase fro m Aspergillus melleus), have suggested the i nvolvement of the activation of the Hageman factor and/or
prekal likrein of the complement system resulting in enhanced vascular permeability. All the proteinases are reported to degrade
i mmunoglobul ins l ike lgG and lgA and cause destruction of structural
matrices like fibronectin. The bacterial proteinases are also reported to i nactivate in vitro the complement system , e.g. C3 and CS in human serum.
Takiuchi et al. (1 982, 1 984) using stationary culture, detected a 45 KOa extracellular proteinase using SOS-PAGE of M. canis filtrates. This may
correspond to the 44 KOa detected in this study. Studies by O'Sullivan and Math ison ( 1 9 7 1 ) us i ng shake c u l tu res fou nd that M. canis
synthesized a complex of proteolytic enzymes with pH optima at pH 6.6,
8.0, and 9.5 to 1 0.0. Production of multiple proteinases has also been
repo rted i n o t h e r d e rmato phyte s , s u c h as T. rubrum a n d T. mentagrophytes (Meevootisom and Niederpruem, 1 979 ; Sanyal et al. , 1 985; Asahi et al. , 1 985; Apodaca and McKerrow, 1 989a, 1 989b, 1 990).
A common class of proteinases reported from a wide range of pathogenic
organisms which have been subjected to detai led characterisation are
seri ne-proteinases (North , 1 982). Most of the seri ne proteinases are generally of a low Mr, in a range of 1 8.5 to 35 KOa and usually around 25 KDa, although larger enzymes have also been reported (North, 1 982). The proteinase of Mr 28 KOa expressed by M. canis is within th is Mr range. Assuming serine proteinases are critical in fungal pathogenesis, their small size would allow them to diffuse into the lower epidermis, and
dermis to cause inflammation. This view is supported by Minocha et al.
(1 972) who observed dermo-epidermal separation and spongiosis when fungal extracts were injected intradermally into excised human skin. They suggested that the changes were due to proteolytic enzymes. Peptidases
and aminopeptidases identified in the present studies with starch gels
probably cleave the peptides generated by proteinases into amino acids.
Daniels (1 953) had demonstrated an accumulation of amino acids when
M. canis was cultured on human hair as a nutrient source.
With the elastin/50S-PAGE, two elastase enzymes were detected having
the same MrS as two proteinases (64 KDa and 62 KOa). This finding

21 0
suggests that the two e nzymes have a substrata specificity for both g e lat in and e last in . A si mi lar resu lt was reported by Apodaca and McKerrow (1 990) for T. rubrum.
H owever, postu lated roles for secreted proteinases do not prove their
association with virulence. The detection of the enzymatic activity in most
pathogenic microorganisms, including fungi, has been obtained in vitro, so that the role of these enzymes in vivo remains hypothetical. The detection of serine proteinase(s) in infected tissues (Oigerts et al., 1 979;
Backer et al. , 1 988; Reichard et al. , 1 990 ; Gessner and Mortensen , 1 990) on ly provides c ircumstantial evidence that they m ay play a pathogenic ro le . Further evidence fo r re levance in vivo m u st b e
demonstrated b y showing that the putative determinant is biolog ically
effective in animal tests by protecting animals against the disease with antibodies to it and by showing that strains lacking it are less virulent (Smith, 1 988) . Studies of Pumell and Martin (1 971 ) and Purnell ( 1 978)
were among t h e earl i e r ones to suggest an associat ion between v i rulence and the enzyme alkaline phosphatase. Mutants defective i n alkal ine phophastase were found aviru lent compared to the wild-type.
T h e v i ru lence was assayed by the m orbidity of mice i nocu lated i ntravenously. A separate study by Grappel and Blank (1 972) found that both active and i nactivated keratinases were able to elicit delayed type cutaneous hypersensitivity reactions i n g uinea pigs. In addition the a
globulin fraction of sera contained an inhibitor of the keratinases. The
i mpl ication of these findings is that kerati nases and othe r enzymes produced during infection may play a role in the invasiveness of the
fungus and in hypersensitivity reactions associated with dermatophytosis.
Curson (1 978) reported simi lar findings for two phospholipases produced by amebae. What is required is in vivo confirmation of the role of these
enzymes i n pathogenicity.
Studies on the importance of transformation to a parasitic morphology by
dermatophytes were carried out by Rippon and Scherr ( 1 959). They
i nduced two dermatophytes, T. rubrum and M. audouinii both in vitro and in vivo to ass u m e a yeast morpho logy consistent with d i m o rphic pathogenic fungi. This alteration resulted in increased pathogenicity as
m a n ifested by the i nvasio n of deep t i ssue . H owever, it was not
i nvestigated whether there was an associated i ncrease in enzyme

21 1
expression, especially of proteinases. I n studies by Medoff et al. ( 1 986)
and Maresca and Kobayashi ( 1 989) on Histoplasma capsulatum, a
dimorphic fungus which requires -SH compounds to transform from the mycelial (saprophytic) to yeast (parasitic) phase, it was shown that in the presence of an -SH blocking agent (p-chloromercuryphenylsulfonic acid, PCMS) which i n h ibits the formatio n of the yeast phase, the fungus remains in the mycelial form and is non-pathogenic. However, there were no differences i n virulence of normal and PCMS treated yeast cells in mice (Medoff et al. , 1 987). This finding has provided direct evidence that
t ransformation of Histoplasma to yeast is a necessary prerequisite for
i nfect ion . Fu rt h e rmore, in the early stages of infection there i s an i ncreased expression of heat shock proteins (hsp), thought to play a role
i n therrnoadaptation, along with the acquisition of the capacity to invade.
S ince dermatophytes require a morphological change from conidial to
hyphal for i nfection, increased proteinase expression would probably occur in vivo, as observed in this study. These changes would allow the adaptation of the dermatophyte and initiation of infection of their host. But
further studies are needed to provide unequivocal evidence for the role of e nzymes i n the v i ru lence of the dermatophytes. A suggested l ine of
i nvestigation wou ld be to develop an in vitro epidermal keratinocyte cu lture. Th is wou ld al low additional studies o n whether the h igh ly expressed proteinases detected in the "pseudo-parasitic" morphology are
i mportant in pathogenicity as defined by their cytopathic effect(s) on cell monolayers. This could be a pre liminary study leading towards further studies to confi rm the role of protei nases as viru lence determinants in e xperimental animals. Another method could be the use of mutants
defective in some or all of the usually highly expressed proteinases.
I n contrast to M. canis, M. cookei, a nonpathogen, expressed seven
different Mr proteinases (67 KDa, 64 KDa, 63 KDa, 62 KDa, 54 KDa, 52
KDa, and 42 KDa) in stationary cultures. Shake culture had five different Mr proteinases of 63 KDa, 62 KDa, 54 KDa, 52 KDa and 42 KDa. The e nzyme expression detected for M. canis and M. cookei m ay be a
function of their natural ecological roles. The proteinases for M. cookei
were very close in Mr compared to those of M. canis which ranged from
1 22 KDa to 28 KDa. The h igher Mr proteinases expressed by M. canis
may be those i nvolved in infection and digestion of keratin. Apodaca and

2 1 2
McKerrow ( 1 989a, 1 989b, 1 990) had also found high Mr proteinases to be very good at degrading keratin and elastin. However the abi lity of M. cookei to e xpress a range of protei nases may mean that its lack ,of
pathogenicity may be due to other factors, such as inability to tolerate high temperatures (weak thermotolerance, Lorincz and Sun, 1 963) as compared to M. canis. Some s u bcutaneous mycoses , such as sporotrichosis and chromoblastomycosis are known to be sensitive to increase in temperature, which influences their deep fungus pathology (Dei Cas and Vernes, 1 986).
Baxter ( 1 968) compared non-pathogenic T. ajelloi, "trained" to grow at 35°C to others maintained at 25°C for their ability to infect guinea pigs.
Only strains able to grow at 35°C were able to produce low grade scaling
with slight erythematous reaction within five days but this only lasted for eight days. This i l lustrates that the abi lity to grow at or near the host's
ski n temperature can be an important factor in the pathogenicity of a
microorganism.
According to S myth ( 1 972), the "ideal" parasite must be capable of (a)
recog n i s i n g i ts habitat to a l low t h e metabo l ic and m o rphologic transformations which characterise the parasitic stage to occur, (b) fixing and maintain i ng its posit ion , (c) adapt ing to the physicochemical condit ions of the host, (d) us ing most nutrient materials at a leve l generally permitting host survival, (e) "mimicking" the antigens of the host to min i mise host i m mune reaction and f inal ly (f) synchro n is i ng its
development with the host.
Simi larly, when pathogenicity is defined as an expression of a two component system, the host-parasite relat ionship, such a defin ition emphasizes the host as an environment for the parasite (Garber, 1 956).
Pathogenicity therefore, with respect to the parasite, is the capacity to
use the host e nvironment as a g rowth medi um and to overcome the
defence mechanisms of the host (Garber, 1 956). With dermatophytes i n general and M. canis and M. cookei i n particular, nutritional inhibition is
less likely because of the avai lable keratinised tissue for g rowth. This
means that host defence mechanisms may be a more important factor.
For example, host factors affect ing t he host-parasite relationship in
dermatophyte i nfections include the effect of higher temperature and

21 3
long-chain unsaturated fatty acids secreted by sebaceous g lands after
puberty, which have fungistatic and/or fungicidal properties (Hajini et al. ,
1 970; Dei Cas and Vernes, 1 986; EI-Naghy et al. , 1 990). Other methods which may offer a selective advantage to the host include inhibition by
seri ne protei nase i nh i bito rs (serpi n s ) of e xogenous p rote i n ases
postulated to act as virulence factors produced by infectious agents upon
infection (Hi l l and Hastie, 1 987), althoug h these serpin i nh ibitors are known to be inactivated by certain proteinases as well (Maeda and Molla, 1 989)

2 1 4
Phenotypic ("Genetic") Variabil ity of Microsporum Species.
Molecu lar genetic studies of Microsporum spp. and its re latives are practically non-existent. Among the reasons are (a) the genetics of the group is not well characterised and (b) there is a lack of suitable methods and scoreable markers for assayi ng g e net ic variabi l i ty i n natu ral
popu lati ons. Th is has made research o n both pathoge nicity and epidemiology of M. canis and other dermatophytes more challenging.
For this study multi locus enzyme electrophoresis was used for indexing alle lic variation among the different iso lates. Isozyme analysis offers a
re latively independent and selectively neut ral means of identify ing popu lation leve ls of genetic variation (Ayala, 1 984; Milchelmore and Hulbert, 1 987). However, genetic analysis of variation requires Mendelian
ratio studies on parents and segregating generations (Sigh and Jain, 1 971 ; Ayala, 1 984). Although the sexual states of M. canis and M. cookei
are known , difficu lt ies i n producing fert i le ascospores {Padhye and Carmichael, 1 971 ; Takashio, 1 981 ) has meant that the genetic basis for the e lectrophoretic banding patterns are as yet not known. Because it
has not yet been demonstrated that the phenotypes observed on gels for the genus Mic;osporum represent alle lic forms as isozymes coded by part icu lar loci , t he obse rved patte rns have bee n refe rred to as phenotypes.
The use of gel e lectrophoresis to measure genetic variation is subject to several potential sources of bias. One important difficulty is that not al l allelic variation is detectable by electrophoresis, that is, enzymes with the same electrophoretic mobilities may have different amino acid sequences
{Lewontin and Hubby, 1 966a). Therefore, the amount of genetic variation
tends to be u nd erestimated ( Ramshaw et al. , 1 979; Ayala, 1 984) ,
although it is not yet possible to indicate by how much. Furthermore, only structural genes coding soluble proteins can be studied while regulatory genes or genes coding for non-soluble proteins may not be detectable (Ayala, 1 975) . Another obstacle is that a lthough protocols exist for detection of over 57 specific enzymes in diverse eukaryotes (Vallejos,
1 983), fewer than fifteen enzyme systems are usually found to be useful
i n any o ne spec ies , and most stud ies h ave e m ployed far fewer
(Mi lchelmore and Hulbert, 1 987).

21 5
S i nce t h e re was no pri o r knowledg e of detectable i sozymes of
Microsporum spp. , prel iminary studies were focused on screening 28 different enzymes. Eight were found to be su itable (Table 2-3). All the
enzymes i n Table 2-3 gave we l l resolved isozyme patterns with the
exception of EST and G6P. EST and G6P produced isozyme patterns
which needed particular care in i nte rpretation and determination of electromorphs.
The eight enzyme systems for the Microsporum -spp. examined can be classified into two groups (a) po lymorphic and (b) monomorphic. An enzyme is considered polymorphic i f a protein exhibited more than one
e lectromorph or isofo rm. Monomorphic prote i ns d id not show any variation within the same species. Using the above criteria the eight enzyme systems were divided as shown in Table 4-1 .
Table 4-1 : Classification of the eight enzymes.
Polymorphic
A).
1 . MOH 2. PEP
B) 3. EST
4. G6P
See Table 2-3 for abbreviations.
Monomorphic
1 . GPI
2. LAP
3. CAT 4. PER
The enzymes i n (A) were detected in al l isolates, while in (B) there was
absence of enzyme activity i n a few iso lates. Of the eight enzyme
systems, 50% were polymorphic for M. canis, and 37.5% for M. cookei.
T h e M O H e n z y m e s y st e m was p o l y m o r p h i c i n M. canis, b u t monomorphic i n M. cookei.
In addition to the eight enzymes, g lutamate dehydrogenase, although
detected i n both Microsporum spp. , was not i ncluded i n th is study
because its relative mobi lity (Rf) for both spp. was the same. Alkaline
phosphatase activity proved difficu lt to resolve for both spp. even after

21 6
t ria ls u sing seven diffe re nt buffe rs (see appendix D) . Reddy and Thre lke ld ( 1 971 ) also reported to have tried unsuccessful ly to resolve
acid phosphatase i nto clear isozyme bands i n Neurospora. Acid
phosphatase i n this study, was only visualised from the extracts of Diheterospora species. Diaphorase and superoxide dismutase were very poorly stained and the migration patterns were not readable.
A number of reasons may be advanced to explain the lack of enzyme activity for the remaining enzymes. One explanation could be that the enzymes are not synthesized by the fungi examined in this study, or the
levels of enzyme production were too low to be detected. Another, perhaps more plausible, reason would be the use of electrophoretic or
staining buffers which may denature or inactivate the enzyme(s).
The enzymes of CAT, LAP, PER and GPI did not show e lectrophoretic
variation between isolates within the same species but showed variation between species. These four enzyme systems, showed o ne band per isolate (Figs.3-37, 3-40, 3-41 , 3-44, 3-45, 3-46, 3-47), consistent with a haploid organism with a single locus. For the remaining enzyme systems, both M. canis and M. cookei exhibited some u nusual biochemical
features. For MOH, PEP, EST and G6P one, two or three additional
bands were observed in diffe rent iso lates. For a few isolates MOH
exhibited four bands. This observed banding pattern suggested that there are mu ltiple copies of the loci producing different isozymes. S imi lar
observations have been reported in other haploid fungi ( Kurjeza and
Garber, 1 973; Spieth, 1 975; Leuchtmann and Clay, 1 990). Leuchtmann and C lay ( 1 9 90) suggested that mu lt ip le copies may resu lt f ro m
heterokaryosis o r aneuploidy. I n Avena populations, genome duplications have been suggested to be a significant factor in the evolution of enzyme
diversity (Sigh and Jain, 1 971 ) . Mutations in the duplicated loci may then
provide a source of genetic diversity comparable with diploid species with
more than one allele (Kurjeza and Garber, 1 973). The complex banding pattern of EST may be due to either multiple copies of the locus with different isozymes or lack of substrata specificity leading to detection of
several bands in the isolates (Nealson and Garber, 1 967; Reddy and
Thre lke ld, 1 971 ) . According to Reddy and Thre lkeld (1 972), esterases
form a complex family of enzymes whose precise classification is made
difficult through overlapping substrate specificities. M. cookei exhibited a
more complex banding pattern with EST than M. canis (Fig.3-38, 3-45).

21 7
Of the triple bands detected i n G6P, the middle band was less wel l
resolved, appearing diffuse (Fig .3-39). The band near the origin did not
m igrate very far from the o rigin by the end of the electrophoretic run. Some isolates showed absence of enzyme activity with G6P, which is
unexpected for an enzyme i nvolved in the glycolytic pathway. A possible explanation could be the inabi lity of the isozymes to recognise artificial substrates, or a low level of G6P enzyme production by the isolates. The
other enzymes i n which a few iso lates showed absence of enzyme
activity were CAT, PER and EST. Other studies have reported similar observations (Selander et al. , 1 985).
The analysis of isozyme data using the normalised Shannon-Wiener diversity measure revealed that M. canis has a higher mean phenotypic diversity (H = 0.459) than M. cookei (H = 0.408). This is in spite of M.
canis being only of the "-" mating type whi le M. cookei had both "+" and "-" m at i ng types (Tab les 3 - 1 0 and 3- 1 1 ). Th is resu lt was rather
u nexpected as low variat ion has been suggested to be a featu re of asexual populations (Maynard-Smith, 1 971 ). However, the low level of
ferti l ity found among M. cookei, with some iso lates being completely i nferti le (Table 3-1 1 ) , may explain the low mean phenotypic d iversity
among M. cookei isolates. Tibayrenc et al. ( 1 991 ) have also pointed out
that the demonstration of sexual reproduction in laboratory cultures or even i n nature simply shows that the potential for sexual reproduction has not been lost, but even so might not occur.
The normalised Shannon-Wiener mean diversity measure of clinical and
carrier isolates of M.canis was very similar. This suggests that M. canis
from carriers may have the potential to cause in fections . P robably differences in host defence or lack of e.g. trauma may be an important
factor i n resistance to M. canis infections.
The small variation among the regional populations of M. canis is not
surprising in view of a complete absence of a "+" mating type among the
i so lates , the e x istence of one mat ing type and therefore on ly the anamorphic phase limiting their capacity to vary genetically.
Since M. canis exists in nature as an asexual anamorphic form, gene sh uff l i ng would seem to be i nh ibited with a l i ke ly existence of a

21 8
un iparental l i neage (s) . Si nce evo lutionary convergence to the same mu lti locus phenotype is h ighly improbable , isolates with identical or similar multi locus phenotypes are considered members of the same cell
line (Selander et al. , 1 985) . However, this does not mean that the cell l ines (Fig .3-48, 3-49) identified by a lim ited number of enzyme markers
are genetically homogenous. More detai led genetic studies may reveal additional variabi l ity among the iso lates. Maynard-Smith ( 1 971 ) has suggested that lack of genetic recombination may not be detrimental to a population or species if (a) the offspring are consistently dispersed into an environment simi lar to that of the parent, (b) there is intense selection
pressure, and (c) populations are small.
M. canis occurs in nature on discrete hosts. Apart from the infective
propagules, the pathogen lives primarily on the host. This may provide a
relatively uniform environment for the fungus for several generations thus
meeting Maynard-Smith's fi rst criterion. Secondly, host specialisation of M. canis for cats and to a lesser extent dogs and humans suggests that
host-pathogen interactions exert strong selective pressure on the fungus. Since M. canis is predominantly haploid, any genetic differences would be expected to be i mmediately expressed, i ncreasing the se lective
pressures. Thirdly, the dependence of the fungus on an uncertain vector is likely to produce a population size that is intermittently low, acting as a bottle neck, leading to a reduction in effective population size. Therefore,
it seems that all the three criteria are met.
Mu lti locus diversity as measured by the Shan non-Wie ner diversity measure although widely used has on ly a moderate discriminant ability
and in addit ion is sensitive to sample size ( Magurran, 1 988). When comparing regional populations this statistic is, therefore, affected by both the number of phenotypes observed within each region as well as
equitabi lity (evenness of distribution) of the phenotypic frequencies (Gaur
et al. , 1 981) . lt is i nd icated to be more sensitive to the n u m be r of
phenotypes than the evenness of distribution. That is, more phenotypes
with a skewed distribution appear to give higher diversity than fewer phenotypes with an equitable distri bution (Goodwin et al. , 1 993). The
number of phenotypes detected wi l l be a function of the sample, and si nce the samp le sizes varied among the three regions, the diversity
values were normalised by H = H/Hmax (Sheldon, 1 969) i n which H is

21 9
the usual Shannon-Wiener diversity measure over phenotypes, and H max is ln(N ) ; the maximum diversity for a sampl e of size N. The
normalised statistic has been found to. be re latively stable and has provided the best measure of diversity when sample sizes vary (Sheldon, 1 969; Goodwin et al., 1 992).
According to Nei ( 1 977), the apportionment of genetic variabi lity in terms of the Shannon diversity measure (Lewontin , 1 972) is simi lar to Nei's
(1 972, 1 978) gene diversity analysis except that Nei's measure can be
related to the number of codon differences per locus when the genetics of the organism is known. However, the estimation of codon differences by statistical methods (Nei, 1 972) may not reflect the true substitution at
the gene level. 1t may either underestimate or over estimate the amount of substitution occurring.
The apportion ment of total d iversity (fir) of M. canis from Auckland,
Palmerston North and Well ington was determined using the diversity analysis of Ne i ( 1 973, 1 975, 1 977). N e i modif ied the F-statistics developed by Wright (1 951 ) to· give a means of analysing population structu re , that is , of part it ion i ng the g e net ic variation of the total
population into components. Gst (which is a similar statistic as Fst, Nei,
1 973, 1 975, 1 977) as a measure of subpopulation differentiat ion , becomes a fu nct ion of past and pre se nt subpopu lat ion s ize and
intermigration. Therefore, where differentiation is due purely to sampling d rift , the value of Gst should be the same for all phenotypes at a l l enzyme systems, or where the genetics of the organisms is known, for all alleles at all loci , since being in the same organism, they were subject to
the same evolutionary population history (Wright, 1 978).
From the res u lts i n Table 3-40, M. canis contains a substantia l
phenotypic variabi l ity, which fo r the most part ex ists with in local popu lations and accounts fo r 84.9% of the total mean phenotypic
divers ity . The i nte rpopu lat ion diffe rent iat io n on the other hand i s
moderate, accounting for 21 .7%, while the diversity among populations i s
1 5. 1 %. Spieth (1 975) reported a simi lar result with Neurospora spp., of
h igh variation with i n popu lations and with litt le dissimilarity between
popu lat ions. R iba et al. ( 1 986) and St Lag e r et al. (1 992a) using
Metarhizium anisophiliae, an entomopathogenic fungus with no known

220
sexual stage, found a substantial interisolate variabi lity. Other workers using Rhynchosporium secalis, an imperfect fungus, have also reported a high amount of variation within populations as defined by geographical
areas (Goodwi n et al. , 1 993 ) . Sp iet h ( 1 975) suggested that the
haplophase se lect ion i n Neurospora spp. ought to domi nate the behaviour of some, i f not many enzyme loci. He proposed a model based
o n e nv i ro n m ental heteroge n e ity wh ich evokes gene f low among
neighbouring populations that occupy shifting multiple adaptive niches.
The mechanisms that generate and maintain these phenotypic diversity st ructures fo r M. canis are n ot yet known . H owever, i n genera l , population structure results from complex interactions between intrinsic
factors, primarily gene flow, genetic drift and natural selection. These
promote or constrain genetic s imi larity within populations and act i n different ways: gene flow, by facilitating the spread of genetic variants, genetic drift , by random fixat ion or e l iminating genetic variants ( i .e.
simi larity by descent) and natural selection, by favouring genetic variants that are better adapted to the ecological niches. I n population theory,
i ntermig ration is recog n i sed as an important force in mai ntai n ing
homogeneity among populations of a species (Lewontin, 1 974).
The e lectrophoretic data can also be used to calcu late phenotypic identity (/) between pairs of closely re lated species. Hendrick's identity
measure was used to compare i nterspecies identity. The phenotypic identity between M. canis and M. cookei was 0.779 ( I = 0 .779). This
seems a reasonable estimate of their identity, as for example, Hamrick et
al. ( 1 986) est imate of identity ranged from I = 0.576 to I = 0.792 for
Histoplasma capsulatum from different sites using isozyme data.
The recovery of isolates of the same electrophoretic phenotypes from the
t h re e d i ffere nt geog raph ical regions suggests that the phenotypic structure of M. canis may comprise cel l l ines. This means that for M. canis there must be a means of dispersal over wide areas. Since M.
canis can be t ransmitted fro m animal to human and vice versa and
h u man to human, the strong poss ib i l i ty is that humans , an imals, especially pet animals, and contaminated fomites may act as agents of
dispersal . For some fungi (Spieth, 1 975; St Leger, 1 992a) and bacteria
(Selander et al. , 1 985) wind dispersal has been suggested. To what

221
extent this may occur for M. canis is not yet known, although M. canis spores have been isolated from air i n enclosed surroundings (Friedman et al. , 1 960 ; Uscavage and Kral, 1 961 ; Midgley et al., 1 972; Smith, 1 982).
Relationships Among Electrophoretic Phenotypes.
The dendrograms generated (Figs.3-48, 3-49) summarise the phenotypic relatio nships. At normalised percent disagreement (PTC) of about 50%, there are three main clusters of M. canis isolates (clusters 3,4, and 5)
and two of M. cookei (clusters 1 and 2), each represented by subclusters within each cluster of electrophoretic phenotypes. The clustering based on isozymes was in good agreement with the taxonom y based o n
morphology of M. canis, M. cookei and Diheterospora (cluster 6). Each of the three species were clustered separately from each other based on
isozyme data. The use of genetic similarities in fungal studies is sti l l in its infancy (St Leger, 1 992b), therefore, there are no guidelines for levels of similarities at which varietal distinctions can be made.
M. cookei was represented by clusters between H1 54 to A 1 25 (Fig.3-48). Most electrophoretic phenotypes belonged to cluster 2 bounded by A 1 55 and A 1 25 which is divided into two subgroups (or subclusters 2a and 2b). Cluster 1 is bounded by H1 54 and H223. Of the "-" mating types (H1 54,
H30, A 1 07, H21 9 , H 1 73 and A32) , four had sim i lar e lectrophoretic
phenotypes except iso lates H 1 73 and A32 which were more closely related and therefore grouped in the same subcluster (2a) while H 1 54,
H30, A 1 07 and H21 9 were grouped in cluster 1 .
Analysis of M. canis revealed three main divisions (i) cluster 3 (ii ) cluster
4 and (ii i) cluster 5. The two Diheterospora isolates had a single line for
28AD and 32HD, cluster 6.
Clinical Distribution.
Cluster 3 of the M. canis isolates comprised a subcluster 3a with mostly
clinical isolates from infected human cases (Fig.3-49) . The grouping of
this subcluster was foun� to be statistically significant using a Z-test (Z =
2.731 > 1 .96; Ps0.05). This indicates a nonrandom association, which

222
suggests that the iso lates may have some isozyme (biochemical) characteristics which allow them to be grouped together (? existence of
special vi ru lence factor(s)). C luster 4, subcluster 4c had a number of clinical isolates, but this was not significant (Z = 1 .405 < 1 .96; P�0.05). This may be a different cell line of clinical isolates.
Distribution According to Host.
The isolates from clinical cases grouped in the subcluster 3a were mainly
from humans, the others from infected cats and dog were scattered in the subclusters 4b and 4c. Although the clustering seems to indicate isolates "special ised" for human infection , the other cl in ical iso lates outside cluster 3 means that infect ion can also be caused by other outside
isolates from outside the cluster 3. Since the majority of isolates from cats were from carriers, it is not clear from this study whether significant clustering based on clinical and carrier status is a common phenomenon with M. canis.
Geographical Distribution.
The isolates in cluster 3 represent all the three geographical regions,
which implies some form of dispersal or intermigration operating to allow
presence of the same or closely related phenotypes in the three regions.
Cluster 4 is mostly of isolates from Palmerston North (PN) with a few from Auckland (AK) and Well i ngton (WG). This suggests some i ntergeographical migration of especially the clinical isolates. Similarly, cluster
5 had one isolate from Wellington grouped together with the tester strain
RV88 obtained from the Prince Leopold Institute for Tropical Medicine.
The clustering this tester strain (RV88) is interesting in that although it is
dist i nct ly different from the New Zealand isolates, with only the one
similar isolate (WG31 ) the other tester strain (RV87) is however, similar to the New Zealand isolates. The emphasizes the possibi lity of some
isolates being clones.

223
CONCLUSION
The findings reported in this thesis confirm the importance of cats and to a lesser extent dogs and contaminated fomites as important reservoirs
not only of M. canis but also of other potentially pathogenic fungi . A variety of potential opportunist ic pathogens e .g . Fusarium, Mucor,
Penicillium and Paecilomyces were isolated from both cats and dogs and also from so i l . One noteworthy fungus iso lated from the soi l was Conidiobolus coronatus which can cause entomophthoromycosis.
To minimise human infections by pathogenic and potentially pathogenic fungi, it would be necessary to raise awareness and educate the public
on the role of cats, dogs and soi l as reservoirs of these fungi. This is
especially in view of a growing passion for animals by people.
The enzyme assays conducted showed that although proteolytic activity
was variable among the M. canis isolates, there was consistently higher proteinase expression in shake cultures compared to stationary cultures. Simi larly, keratinase activities of isolates was greater in shake cultures. However, elastase activity was higher i n stationary cultures. M. cookei
isolates also had higher proteinase expression i n shake cultures but showed no sign ificant difference for e lastase activity between the two
methods. lt is postulated that shake cultures of M. canis more closely resemble the in vivo growth of the fungus and thus the diffe rences in enzyme expression are important in our understanding of differences in mechanisms of pathogenicity.
Enzyme inh ibitors studies revealed that both M. canis and M. cookei expressed seri ne-catalysed prote inase(s) , and metallo-e lasti no lyt ic
proteinase(s) but aspartic-, cysteine- and metallo-catalysed proteinase(s)
were expressed only by M. canis. Perhaps, these proteinases act as
virulence factors in the hydrolysis of skin proteins.
Gelatin/SDS-PAGE also detected more proteinases in shake cultures
than stat ionary cultu res of M. canis iso lates. Of the six proteinases
detected, those of Mr 1 22 KDa, 62 KDa and 28 KDa were very highly

224
expressed (P=0.0001 ) i n shake cu ltures. M. cookei expressed more
proteinases i n stationary cu ltu res than shake cu ltures. The enzyme
expression by these two Microsporum spp. may be a reflection of their differi ng ecolog ical niches. lt is proposed that the high ly expressed proteinases of Mr 1 22 KOa, 62 KDa and 28 KDa (probably 62 KDa) may play an important role in the pathogenicity of dermatophytoses caused by M. canis.
An understanding of the bio logical and biochemical mechanisms of d isease may suggest the types of m olecu les needed for drugs. For
rational design of chemotherapeutic agents, proteinase inhibitors can be developed by (a) characterisation of specificities of proteinases and (b) synthesizing peptides with similar features but with a hydrolyzable amide bond replaced with a non reactive "isostere". This approach has been used for renin i nhibitors and for inhibitors for HIV-1 proteinase (Kunitz,
1 992) . One can go fu rt h er and add specif ic mo iet i es , such as chloromethyl ketones or phosphonates capable of forming transitionstate analog complexes with the enzyme. Example are the Schistosoma
mansoni cercaria! elastase (Cohen et al. , 1 991 ) and carboxypeptidase A (Kaplan et al. , 1 991 ).
In the population studies based on isozyme patterns reported, M. canis
isolates had a higher diversity than those of M. cookei. The detection of
mostly weakly fertile and unfertile isolates among M. cookei may mean low levels of sexual reproduction in nature and therefore low phenotypic
variation. The apportionment of total diversity of M. canis according to
geographical regions revealed a substantial phenotypic variabi lity within local populations and a moderate interpopulation differentiation.
The main deficiencies with respect to the study of the populations are small sample sizes from Auckland and Wellington, very few isolates from
dogs, a slightly higher number of isolates from carriers and a lack of
knowledge about the genetics of a number of bands. But it is possible to draw broad tentative conclusions; (a) there is a high level of variation
within populations (as defined by geographical regions) and (b) there is a
lack of sharp difference between the regions.

225
With the help of cluster analysis on the isozyme data using normalised perce nt d i sag ree ment as a distance measu re and a dendrogram computed by the average-l inkage method of clustering, there was a
significant subclustering of human isolates (subcluster 3a) while other isolates from infected sources were scattered throughout the subclusters of cluster 4.
When the data for the cl in ical iso lates was examined, they had i n
common EST phenotype 9 . Although EST was present among some isolates from carriers , it was more commonly associated with cli n ical isolates, which also had a low phenotypic diversity at EST (H =0. 1 50)
compared to carriers with a higher diversity (H = 0.764). The low EST
diversity among clinical isolates means the isolates have an EST which is closely related. If EST is important in pathogenicity, it could be used in the breakdown of the inhibitory fatty acids found in sebum and therefore offer clinical iso lates an advantage in the process of pathogenesis. The
fact that esterases have overlapping substrata specificities would make them good candidates in overcoming this defence barrier of the host
leading to infection. This aspect would be worthy of further investigation.

226
APPENDIX A
Microsporum canis isolated and submitted from different sources.
NO Host Description Source Isolate
9735 kitten female SPCA M. can is
331 cat male, adult SPCA M. can is
4261 cat Infected Vet. M.canis
Clinic
4487 cat Vet. M.canis Clinic
457 cat female, stray SPCA M. can is 551 cat female, 1 yr SPCA M.canis
(M.cooke1) 51 1 cat male, 6mths SPCA M.canis 4484 dog Vet. M. can is
Clinic 767 cat 1 yr SPCA M. can is 768 cat 1 yr SPCA M. can is 733 cat male SPCA M. can is 795 cat female SPCA M.canis 730 cat stray SPCA M. can is 729 cat adult SPCA M. can is 790 cat female SPCA M. can is 794 cat female, 8yrs SPCA M.canis 745 cat adult, stray SPCA M.canis
761 cat stray SPCA M.canis
797 cat male, 5mths SPCA M.canis Blkt2 SPCA M.canis
852 cat male SPCA M.canis
854 cat female, 8mths SPCA M.canis
839 cat adult, stray SPCA M.canis
862 cat male, 6mths SPCA M.canis
855 cat female SPCA M. can is

227
APPENDIX A Contd.
2 dog SPCA M.canis
mb001 4 cat +Ve ectothrix Hkwh itu M.canis
infection Clinic
mb28 cat SPCA M.canis
989 cat male, 8wks SPCA M.canis
983 cat stray, adult SPCA M.canis
991 cat adu It, stray SPCA M. can is
993a+b cat male, adu lt SPCA M.canis
1 001 cat female, adult S PCA M. can is
1 002 cat stray, 1 yr SPCA M.canis
995 cat adu lt SPCA M.canis
397437 human leg infection Wgtn M.canis
397437 human face infection Wgtn M.canis
3851 95 human face infection Wgtn M.canis
x5 human infection Wgtn M.canis
x2 human infection Wgtn M.canis
?(mb35) human? source unkwn Wgtn M.canis
501 4 dog Vet. C l inic M.canis
851 54 cat CDCNZ M.canis
Wgtn 90359 girl 2yrs Waipukurau M.canis
295 human Akld hosp. M.canis
n3 human Akld hosp. M. can is
399svb human Akld hosp. M.canis
628 human Akld hosp. M. can is
760 human Akld hosp. M.canis
21 1 human Akld hosp. M.canis
Akld hosp. = Auckland hospital, Wgtn = Wellington, Vet. Clinic = Veterinary Faculty Clin ic, Massey University, CDCNZ = Communicable Disease Center, New Zealand, SPCA = Society for the Prevention of Cruelty to Animals, 993a =
no pigment (cream white), 993b = yellow pigment was produced.

228
PPENDIX A Contd.
) M. cookei Isolates from Different Sites in Palmerston North.
Nil Location Land use Stock pH Isolate
8 Fielding rd cleared grd 6.2 A= M. cookei
29 Square flower/gdn 5.6 30 Milverton roadside 6.3 H= M. cookei 32 Fergusson st park 5.9 A= M. cookei
39 Freyberg school 6.2 A= M. cookei 81 Albert st park 6. 1 A= M. cookei 1 07 Fergusson st school 5.9 A= M. cookei 1 25 Stacks/Man a residential 6.7 A= M. cookei
place empty plot 1 52 Cuba st A+Pshowgrds - 6.3 A= M. cookei 1 53 Cuba st A+Pshowgrds - 5 . 1 H= M. cookei 1 54 Pascal st empty plot 5.6 H= M. cookei 1 55 Pascal st empty plot 6.0 A= M. cookei 1 73 Botanical rd school 5.3 H= M. cookei 1 92 Chippendale park 6.7 H= M. cookei
Crescent 21 9 Park rd park H= M. cookei 223 Kimbolton rd roadside H= M. cookei 228 Oroua river riverbank H= M. cookei
e :- S33 (M. cooke1) was from Massey University Departmental Culture Collection.
A = isolates obtained from antibiotic moistened soils.
H = isolates obtained from water only moistened soils.

229
APPENDIX B
Microsporum spp. deposited in Microbiology & Genetics Departmental
Cultures Collection. (Freeze-dried in 20% skim mi lk).
Original Laboratory Culture Collection
Microsporum spp. Code Code N!!
Nannizzia otae( +) RV42487 RV87 836
Nannizzia otae(-) RV42488 RV88 820
Arthroderma simii( +) MY03684 81 8 Arthroderma simii(-) MY03784 824
M. canis 331 PN01 794 M. canis 457 PN02 81 9 M. canis 51 1 PN03 858 M. canis 551 PN04 81 7 M. canis 4261 PN05 843 M. canis 4484 PN06 822 M. canis 4487 PN07 823 M. canis 9735 PN08 800 (775) M. canis 851 54 WG09 797 M. canis 90359 WG1 0 825 (772) M. canis 729 PN1 1 840 M. canis 730 PN1 2 826 M. canis 733 PN1 3 787 (n3) I M. canis 745 PN1 4 783 (745)
M. canis 761 PN1 5 786
M. canis 790 PN1 6 805 M. canis 795 PN1 7 784 (795)
M. canis 797 PN1 8 831 M. canis 0767 PN1 9 801
M. canis 0768 PN20 847
M. canis blkt2 PN21 782
M. canis 839 PN22 799

230
APPENDIX 8 contd.
M. canis 852 PN23 81 3
M. canis 854 PN24 842 M. canis 855 PN25 844
M. canis 862 PN26 789
M. canis dog2 PN27 855
M. canis mb28 PN28 828 M. canis mb0001 4 PN29 859 M. canis 397437-leg WG30A 832 M. canis 397437-face WG30B 785 M. canis 3851 95 WG31 8 1 6 M. canis 397438 WG32 791 M. canis no code(x5) WG33 851 M. canis no code(x2} WG34 8 1 0 M. canis no code WG35 8 1 5 M. canis no code UK36 81 1 M. canis 983 PN37 806 M. canis 991 PN38 857 M. canis 993A PN39A 830 M. canis 9938 PN39B 807 (81 4) M. canis 995 PN40 829 M. canis 989 PN41 834 M. canis 1 002 PN42 835 M. canis 1 001 PN43 790 M. canis 501 4 PN44 827 M. canis 295 AK45 852
. M. canis 773 AK46 848 M. canis 399svb AK47 856 M. canis. 628 AK48 849 M. canis 760 AK49 850 M. canis 21 1 AK50 846

231
APPENDIX 8 contd.
M. cookei 08 HOB 792 M. cookei 30 H30 802 M. cookei 32 A32 837 M. cookei 33 S33 838 M. cookei 39 A39 803 M. cookei 81 A81 845 M. cookei 1 07 A 1 07 839 M. cookei 1 25 A125 833 M. cookei 1 52 A 1 52 841 M. cookei 1 53 A153 798 M. cookei 1 54 H 1 54 853 M. cookei 1 55 A 1 55 81 2 M. cookei 1 73 H 1 73 808 M. cookei 1 92 H 1 92 795 M. cookei 1 9 H21 9 772 (793) M. cookei 23 H223 773 (796) M. cookei 28 H228 821 M. cookei 551 C551 788
Diheterospora 28 AD28 804 Diheterospora 32 HD32 809

232
APPENDIX C
The enzyme names, symbols and Enzyme Commission (EC) numbers used are those recommended by the International Union of Biochemistry
( IUBNC, 1 984).
The isozymes used in this study are 1 to 8.
Enzyme
1 . Catalase 2. Esterase 3. Glucose-6-phosphate
dehydrogenase 4. Glucose-6-phosphate
isomerase 5. Leucine aminopeptidase 6. Malate Dehydrogenase 7. Peptidase (Leu-Aia)
8. Peroxidase
9. G lutamate dehydrogenase (NADPH+)
1 0. Alkaline phosphatase 1 1 . Acid phosphatase 1 2. Diaphorase
1 3. Superoxide dismutase
1 4. a-glucosidase
1 5. Lactate dehydrogenase 1 6. Urease
1 7. Malate dehydrogenase (NADP+)
1 8. Alcohol dehydrogenase 1 9. (S}-2-Hydroxy-acid
oxidase 20. Carbonic anhydrase
Symbol
CAT EST
G6P
GPI LAP MOH PEP
PER
GTDHP ALP
ACP DA? SOD
a-GLUS
LDH U RE?
MDHP
ADH
HAOX
CA
EC Number
1 . 1 1 . 1 .6
3.1 . 1 .x
1 . 1 . 1 .49
5.3. 1 .9 3.4. 1 1 . 1 1 . 1 . 1 .37 3.4. 1 1 .x. 1 3
1 . 1 1 . 1 .7
1 .4.1 .4
3. 1 .3. 1 3. 1 .3.2 1 .6.4.3 1 . 1 5. 1 . 1
3.2. 1 .20
1 . 1 .1 .27 3.5. 1 .5
1 . 1 . 1 .40 1 . 1 . 1 . 1
1 . 1 .3. 1 5 4.2. 1 . 1

APPENDIX C Contd.
21 . Aspartate aminotransferase AAT
22. Shikimic acid dehydrogenase SKDH
23. Succinate dehydrogenase SUDH
24 inorganic pyrophosphatase pp
25. Phenol oxidase PO?
26. Thiolsulfate sulfur transferase TST
27. Aryl sulfatase ARS 28. Purine nuclease
phosphorylase PNP
isozyme 1 -8 gave good enzyme activity staining and were
used in this study for indexing allelic variation among the different isolates.
9 showed no variation between species and was therefore not included in the study.
1 0 could not be successfully resolved with the
buffers shown in appendix D.
2.6. 1 . 1
1 . 1 . 1 .25
1 .3.99. 1
3.6. 1 . 1 ?
2.8. 1 . 1
3.1 .6 . 1
2.4.2 .1
1 1 only Diheterospora spp. showed activity for this
isozyme.
1 2- 13 showed some enzyme activity but the intensity
of staining was very poor. 1 4-28 no enzyme activity was detected on the gels.
233

234
APPENDIX D
Buffer systems which were trial led to resolve the alkaline phosphatase enzyme
Enzyme Electrode buffer Gel buffer V/mA
ALP 0.41 M citric acid Tris-succinic acid (pH 6.0) adjusted (pH6.0) 1 50v
with NaOH 0.0025M succinic acid,
0.004M tris
Tris-citrate (pH 7.0) Tris-citrate (pH 7.0) 0.55M Tris, electrode buffer 25mA 0.043M citric acid diluted 1 : 1 5ml
Tris-maleic anhydride Tris-maleic anhydride (pH7.4) di luted 1 :9 (pH 7.4) 1 2. 1 g Tris 1 00v 1 1 .60g maleic anhydride 3.74g EDTA 2.03g Mgcl2.6H20
in 1 litre, adjusted
with NaOH.
Borate (pH 8.0) Tris-citrate (pH 8.6) 0.3M boric acid 0.076M Tris, 1 00v adjusted with NaOH 0.007M citric acid,
Lithium-borate(pH 8.1 ) Tris-citrate (pH 8.5) 0.06M UOH 0.03M Tris 1 50v 0.03M H3B03 O.OOSM citric acid

APPENDIX D Contd.
Borate (pH 8.2) 1 8.55g boric acid
in 1 litre
Borate (pH 8.5) 1 8.55g boric acid
in 1 litre
Tris-citrate (pH 6.3) 1 2.36g Tris, 1 1 .66g citric acid in 1 litre
Tris-citrate (pH 9.5) 1 3.1 g Tris 0.525g citric acid
in 500ml
Tris-EDTA (pH 8.5) 4.6g Tris 0.09g EDTA
in 1 litre
Tris-citrate (pH 7.0) 0.73g Tris 0.63g citric acid
in 1 litre
235
1 50v
40mA
250v

236
REFERENCES
Achtman, M. and Pluschke, G., 1 986. Analysis of descent and virulence among selected Escherichia coli. Ann. Rev.Microbiol. , 40 :1 85-
21 0.
A insworth , G .C . , 1 986. I ntroduct ion to the H istory of Medical and Vete ri n a ry Myco l o g y . C a m b ri dg e U n iv e rs i t y P re s s , Cambridge.
Aje l lo , L. , 1 953. The de rmatophyte , Microsporum gypseum, as a
saprophyte and parasite. J . lnvest.Dermatol. , .f.!:1 57-1 71 .
Aje llo, L. , 1 959. A new Microsporum and its occurence i n soil and on animals. Mycologia, §1:69-76.
Aje l l o , L. , 1 960 . Geographic d i st ri b ut ion and preve lance of t he dermatophytes. Ann.N.Y.Acad.Sci. , 89(1 ):30-38.
Aje l l o , L. , 1 96 1 . The ascigero u s state of Microsporum cookei.
Sabouraudia, !!ID:1 73-1 n.
Ajello, L. , 1 962a. Epidemiology of human fungus infections. I n : Dalldorf, G. (ed. ), Fungi and Fungous Diseases. Charles C. Thomas,
I l l inois. pp.69-83.
Aje l l o , L. , 1 962b. Present day concepts of the dermatoph ytes . Mycopathoi.Mycoi.Appl., 1 7:31 5-324.
Ajel lo, L. , 1 968. A taxonomic review of the dermatophytes and related species. Sabouraudia, 6(2):1 47-1 59.
Ajello, L., 1 970. Sexual reproduction among fungi pathogenic to man : a
historical review. Mykosen, 1 4(7):343-352.

237
Aje l lo , L. , 1 974. Natural h istory of the dermatophytes and re lated species. Mycopathoi .Mycoi.Appl. 53:93-1 1 0.
Aje l lo , L. , 1 977. Mi lestones i n the h istory of medical mycology: The dermatophytes . In lwata, K. (ed . ) , Recent Advances i n
Medical and Veterinary Mycology, Proceedings of the sixth Congress of the International Society for Human and Animal
Mycology, University of Tokyo, Tokyo,_ pp.3-1 1 .
Aje l lo , L. , 1 980. Natural habitats of the fungi that cause pulmonary mycoses . I n : P re usse r, J . H . (ed . ) , Medical Mycology, Zbi.Bkt.Suppl. §. Gustav Fisher Verlag, N. V. pp.31 -42.
Ajel lo, L. , 1 982. Current trends in our knowledge of the taxonomy of pathogenic fungi . I n : Baxter, M. (ed. ) , Proceedings of the Eighth Congress of the International Society for Human and Animal Myco logy, Massey University, Palmerston North , pp.41 8-424.
Ajel lo , L. , Varsavsky, E . , G inther, O.J. and Bubashi , G. , 1 964. The
natural h istory of Microsporum nanum. Mycolog ia, 36 :873-884.
Aje l l o , L. , Georg , Luci l le K . , Kaplan , W. and Kaufman, L. , 1 966 .
Laboratory Manual for Medical Mycology. US Department of
Health , Educat ion and We lfare , Publ ic Health Service, Communicable Disease Centre, Antlanta, Georgia.
Ajello, L. and Cheng Shu-Lan, 1 967. The perfect state of Trichophyton mentagrophytes. Sabouraudia, §:230-234.
Aje l lo , L. and Alpert, E .M . , 1 972. Survey of Easter Is lands soils for
keratinophilic fungi. Mycologia, 64:1 6 1 - 1 66.

238
Aje l lo , L. , Kaplan , W . and Chand le r, F.W. , 1 985. D e rm atophyte
myceto mas : fact or f ict i o n ? . I n : Pan American Health O rg a n i sat i o n ( PA H O) , S u pe rf i c i a l , Cut a n e o u s and Subcutaneous Infections. 5th Inte rnational Confe rence on Mycoses. Scientific Publication N°396, 27-30 April , Caracas,
Venzuela. pp. 1 35-1 40.
Alexander Ranee R., Griffiths Joan M. and Wi lki nson Maria L., 1 985.
Basic Biochemical Methods. John Wiley and Sons, N. Y.
Alexopoulos, C.J. and Mims, C.W. , 1 979. Introductory Mycology (third
edition). John Wiley and Sons, Toronto.
Aljabre, S.H .M. , Richardson, M.D. , Scott, E.M. and Shankland, G.S. , 1 992 . Germ i n at ion of Trichophyton mentagrophytes on human stratum corneum in vitro. J.Med.Vet.Mycol. , 30:1 45-1 52.
Alsop, J. and Prior, P.P. , 1 961 . Ringworm infection in a cucumber g reen
house. Brit.Med.J. , 1:1 081 -1 083.
Alteras, 1 . , 1 970. First case of tinea infections by Microsporum nanum i n
Romania. Mykosen , 1 3:448-450.
Alteras, I. and Cojocaru, 1 . , 1 970. Evolution of tinea capitis i n Romania
after World War 1 1. l nt.J.Dermatol. , �:1 1 9-1 24.
A n ag nostakis , S . L. , 1 992 . Diversity with in popu lations of fungal
pathogens on perennial parts of perennial plants. In : Carrol,
G . C . and Wick low, D .T . , The F u nga l Com m u n ity : I ts
Organisation and Role i n the Ecosystem (2nd ed. ) . Marcel Dekker, Inc. , N .Y. pp. 1 83-1 92.
Apodaca, G. and McKerrow, J .H. , 1 989a. Purification and
characterisation of a 27 000-Mr extracellular proteinase from
Trichophyton rubrum. lnfect. lmmun., 57(1 0):3072-3080.

239
Apodaca, G . and McKerrow, J .H . , 1 989b. Regulation of Trichophyton
rubrum proteolytic activity. l nfect. lmmun., 57(1 0):3081 -3090.
Apodaca, G. and McKerrow, J .H. , 1 990. Expression of proteolytic activity
by cu ltu res of Trichophyton rubrum. J . Med. Vet . Myco l . ,
28:1 59-1 71 .
Arcus, A.C., 1 970. Protein analysis by eletrophoretic molecular sieving in
a gel of graded porosity. Anai.Biochem.1 37:53-63.
Asahi , M. , Undquist, R., Fukuyama, K., Apodaca, G. , Epstein, W.L. and
McKerrow, J .H. , 1 985. Purification and characterisation of
major extracellu lar proteinases from Trichophyton rubrum. Bichem.J. , 232:1 39-1 44.
Avise, J .C. , 1 975. Systematic value of electrophoretic data. Syst.Zool., 23:465-481 .
Ayala, F.J . , 1 975. Genetic. differentiation during the speciation process. Evoi.Biol. , �:1 -78.
Ayala, F.J . , 1 984. Molecu lar polymorp hisms: How much is there and why?. Develop. Genet. , �:379-391 .
Bakerspige l , A . , 1 953. Soil as a storage medium for fungi. Mycologia,
45:596-604.
Bakerspige l , A . , 1 974. The kerati nophi lic fungi of Ontario , Canada.
Mycopathoi.Mycoi.Appl. , 53: 1 - 1 2.
Banda, M.J. , Werb, Z. and Mckerrow, J .H. , 1 987. E lastin degradation. In :
C u n n i ng ham, Leon W. (ed. ) , Structu ral and contract i le proteins; part D : Extracellu lar matrix. Methods in Enzymology,
1 44:294-305.
Barlow, A.J.E. and Chattaway, F.W. , 1 955. Attack of chemically modified
keratin by certain dermatophtes. J . lnvest.Dermatol . , 24:65-74.

240
Barnett, H .L. and Hunte r, B .B . , 1 972. I l lustrated Genera of Imperfect Fungi (3rd ed. ) . Burgess Publishing Company.
Barron, G.L. , 1 968. The Genera of Hyphomycetes from the Soi l . The Williams and Wilkins Company, Baltimore.
Baxter, M. , 1 966. Isolation of Trichophyton mentagrophytes from British soil. Sabouraudia, 4(4):207-209.
Baxter, M., 1 968. Studies on the keratinophilia of dermatophytes. Ph.D.
Thesis. Birmingham University, England.
Baxter, M., 1 969. Keratinophi lic fungi isolated from humans and from soil in the city of Birmingham, England. Mycopathoi .Mycoi.Appl. , 391 :389-397.
Baxter, M. and Pearson, R.D. , 1 969. The occure nce of Microsporum nanum as a human pathogen and animal pathogen in New Zealand. NZ J.Med.Lab.Technol., 23: 87-90.
Baxter, M. , 1 973. Ringworm due to Microsporum canis in cats and dogs
in New Zealand. N.Z.Vet.J. , 21 (3):33-37.
Baxter, M . and l l lston Gaylene M. , 1 977. Envi ro n mental reservoi rs of
psychotrophic meat spoi lage fungi . N .Z.Vet.J., 25:1 65-1 67.
Baxter, M. and l l lston Gaylene M. , 1 980. Temperature relationships of
fungi iso lated at low temperatu re s f rom soi ls and other substrates. Mycopathologia, 72: 21 -25.
Baxter, M. and Rush-Munro , F.M., 1 980. The superficial mycoses of man
and animals in New Zealand and their d iagnosis (3rd ed. ) . Massey University.

241
Beare, J.M. , Gentles, J .C. and Mackenzie, D.W. R., 1 968. Mycology. In : Rook, A. , Wilkinson, D.S. and Ebling, F.J.G. (eds.) , Textbook
of Dermato logy. Blackwel l Scientific Publ ication . Oxford.
pp.809-91 4.
Backer, 1 . , Perez-Tamayo, R., Montfort, 1 . , Alvizouri, Ana M. and Perez
Montfort, R. , 1 988. Entamoeba histolytica: Role of amebic
protei nases and po lymorphonuclear l eukocytes in acute
experimental amebiases in the rat. Exp. Parsitol . , 67:268-280.
Bedoya-Escobar, V. l . , Naranjo-Mesa, M.S. and Restrep-Moreno, A. ,
1 993. Detect ion of proteo lytic e nzymes re leased by the
d i m o rp h i c fu n g u s Para coccidioides b ransiliensis . J. Med. Vet. Mycol. , � :299-304.
Benedek, T. , 1 948. On a newer trend of classification of dermatophytes. Mycopathoi.Mycoi.Appl., �:201 -206.
B e neke, E .S . and Rog e rs , A . L. , 1 980. Medical Mycology Manual. Burgess, Minnespolis.
Blatt, W.F. , 1 971 . Ultrafi ltration for enzyme concentration. In : Colowick, S . P . and Kaplan , N .O. (eds . ) , Enzyme Puri fication and
Related Techn iques. Academic Press, N .Y. , Methods i n Enzymology, XX 1 1 :273-437.
Bogaty , H . , 1 969. Differe nces between adu lt and ch i ldre n 's hai r. J .Soc.Cosmet.Chem., 20:1 59-1 71 .
B o h m e , H . and Z ieg le r , H . , 1 96 9 . The d istr i but i on of geoph i l ic
dermatophytes and other keratinophilic fungi in relation to the pH of the soil . Mycopathologia, 38:247-255.
B rewer, G.J . , 1 970. An Introduction to Isozyme Techniques. Academic
Press. London.

242
Bulmer, G.S. and Fromtl ing , R.A. , 1 983. Pathogenic mechanisms of mycotic agents. I n : H oward, D . H . , Fungi Pathogenic fo r
Humans and Animals, Part B - Pathogenicity and Detection: ! . Mycology Series. Mercel Dekker, Inc .. pp. 1 -59.
Campbell, C.K. , 1 988. Teleomorphs of dermatophytes. In : TOmbay, E. (ed.) , FEMS-Symposium of dermatophytes and Dermatophytoses i n Man and Animals. May 21 -23, 1 986.
lzmir, Turkey. pp.24-30.
Carman Mi riam G. , Rush-Munro , F. M. and Carter Margery E . , 1 979. Dermatophytes isolated from domestic and feral animals. N.Z.
Vet.J. , 27:1 36 and 1 43-1 44.
Carmichael, J.W., 1 962. Chrysosporium and some other aleuriosporic hyphomycetes. Can.J.Bot. , 40:1 1 37-1 1 73.
Carretta , G . , Aje l l o , L. and P adhye , A .A. , 1 990. Occu re nce of arthroderma gloria, a geophile keratinophilic ascomycete, i n Italy. J.Med.Vet.Mycol. , 28(2):99-1 02.
Castellani , A . , 1 963. Further researches on the viability and growth of many pathogenic fungi and some bacteria in sterile distilled
water. Mycopathoi.Mycoi.Appl., 20:1 -6.
Chabasse, D. , De Gentile, L. and Bouchara, J-Ph., 1 989. Pathogenicity o f so m e Chrysosporium species i so lated i n France.
Mycopathoi.Mycoi.Appl. , 1 06 : 1 71 - 1 n.
C hang , L.O . , S rb , A . M. and Steward , F .C . , 1 962. Elect rophoretic separation of the soluble p roteins of Neurospora. Nature,
Lond. , 1 93: 756-759.
Chattaway, F.W., Thompson, C.C. and Barlow, A.J.E., 1 954. Enzymes of
Microsporum canis. Biochim.Biophys.Acta, 1 4:583-584.

243
Chattaway, F.W. , Thompson, C.C. and Barlow, A.J.E. , 1 956. The action of inhibitors on dermatophytes. Biochem.J . , 63:648-656.
Chattaway, F.W., Ell is, D.A. and Barlow, A.J .E . , 1 963. Peptidases of dermatophytes. J . lnvest.Dermatol . , .11.LU:31 -37.
Cheung, S.C. and Maniotis, J . , 1 973. A genetic study of extracel lu lar elastin-hydrolysing protease in ringworm fungus Arthroderma benhamiae. J.Gen.Microbiol., 74:299-1 973.
Chmel , L . , Hasi l ikova Anna, H rasko , J . and Vlaoi l ikova, 1 972. The
influence of some ecological factors on keratinophi lic fungi in the soil. Sabouraudia, 1 0 :26-34.
C h ra m b ac h , A . and R o d bard , D . , 1 9 7 1 . P o l yacry l a m i d e g e l electrophoresis. Science, 1 72:440-451 .
C lare , B.G . , Flentje, N .T. and Atkinson , M. R. , 1 968. E lectrophoretic
patterns of oxidoreductases and other proteins as criteria in fungal taxonomy. Aust.J.Bioi.Sci. , �:275-295.
Cochrane, B.J. , Brown, J.K. and Wain, R.P., 1 989. Genetic studies in the
genus Basidiobolus. I . Isozyme variation among isolates of
human and natural populations. Mycologia, 81 (4):504-51 3.
Cole, G .T. and Samson, R.A., 1 979. Patterns of Development in Conidial Fungi. London, Pittman. pp. 1 90.
Col l inge, Carol A., Stockdale , Phyllis M. and Gregory, M.W. , 1 974. A
mycological study of Arthroderma benhamiae from Central
African hedgehog. Sabouraudia, 1 2:227-232.
C o n n o l e , M . D . , 1 96 5 . K e rat i n o p h i l i c f u n g i o n cats and dogs .
Sabouraudia, �:45-48.
C o n n o l e , M . D . , 1 990 . Rev iew of a n i mal mycoses i n A u st ra l ia .
Mycopathologia, ffi:1 33-1 64.

244
Costa, A. R. , Porta, E. , Pegas, J . R.P. , dos Reis, V.M.S., Pires, M.C. ,
Lacaz, C.S., Rodrigues, M.C . • Muller Helena and Cuce, L.C.,
1 99 1 . Rh inofacial zygo mycosis caused by Conidiobolus coronatus. Mycopathologia, 1 1 5:1 -8.
C rawford, D .J . , 1 983. Phylogenetic and systematic i nfe rences fro m
electrophoretic studies. I n : Tanksley, S .D. and Orton, T.J.
(eds. ) , l sozymes in P lant Genetics and Breeding, Part A. Elsevier, Oxford. pp.3-1 3.
C ruickshank, C.N .D. and Trotter, M.D. , 1 956. Separation of epidermis
from dermis by fi ltrates of Trichophyton mentagrophytes. Nature, 1 77:1 085-1 086.
C ruickshank, R.H . , 1 990. Pectic zymograms as criteria in taxonomy of Rhizoctonia. Mycoi.Res. , 94(7):938-946:
Curson , R.T.M. , 1 978. Pathogenic Free-Living Amebae - Occurrence in
New Zealand Thermal Regions Together with Investigation into their Disinfection, Immunity and Virulence. Ph.D. Thesis.
Massey University, New Zealand.
Daniels, G., 1 953. The digestion of human hair kerati n by Microsporum canis. J.Gen.Microbiol., !!:289-294.
D av i d so n , A . M . a n d G re g o ry , P . H . , 1 9 34 . In situ c u lt u re s of
dermatophytes. Can.J.Res. , 1 0 :373-393.
D av i d s o n , F . D . , M acke n z i e , D . W . R . a n d Owe n , R .J . , 1 9 8 0 .
Deoxyribonucleic acid base composition of dermatophytes.
J.Gen. Microbial. 1 1 8:465-470.
Davidson, F.D. and Mackenzie, D.W.R., 1 984. D NA homology studies i n · the taxonomy of dermatophytes. Sabouraudia, 22: 1 1 7- 1 23.

245
Davidson, M. and Unestam, T. , 1 974. Factors affecti ng the sexual reproduction of a dermatophyte, Arthroderma benhamiae, in synthetic media. Physioi.Piant. , �: 237-244.
Dawson Christ ine 0. and Gentles, J .C . , 1 961 . The perfect states of
Keratinomyces ajelloi Vanbreuseghem, Trichophyton terrestre D u ri e a n d F ra y a n d Microsporum nanum F u e n t e s . Sabouraudia, !:49-57.
Dawson Christine, Gentles, J .C. and Brown, E.M., 1 964. Environmental
co ndit io ns affect ing sexual rep roduct ion i n species of Arthroderma and Nannizzia. Sabouraudia, �:245-250.
de Vries G.A. , 1 962. Keratinophi l ic fungi and their action. Antonie van
Leeuwenhoek, 28:1 21 -1 33.
de Vries G.A. , 1 964. Keratinophylic fungi . Ann.Soc. Belge Med.Trop. , 44( 4/5) :795-802.
De Vroey C. , 1 964. Formes sexees des dermatophytes. Production de cleistotheces de Microsporum gypseum (Bodin) Guiart and Grigoraki sur divers milieux steri le. Ann.Soc.Belge Med.Trop. 44:831 -840.
D e V roey C . , 1 984. Eco log ical and e p i d e m io log ical aspects i n
dermatophytoses. Zbl. Bakt.Hyg. A257 :234-239.
D e Vroey C. , 1 985. Epidemio logy of ri ngworm (dermatophytosis) .
Seminars in Dermatol., 4(3) :1 85-200.
De Vroey, C., 1 988. Dermatophyte, a "nomen dubium"?. In: Tumbay, E. (ed.) , FEMS-Symposium of dermatophytes and
Dermatophytoses i n Man and An imals. May 21 -23, 1 986.
lzmir, Turkey. pp. 1 6-23.

246
De Vroey C. and Hennebert, G .L. , 1 982. Theoretical and practical implications of the "morph" terminology to the taxonomy and nomenclature of fungi of medical importance. In : Baxter, M.
(ed.) , Proceedings of the Eighth Congress of the International Society for Human and Animal Mycology, Massey University, Palmerston North, pp.440-445.
Dei Cas E. and Vernes, A. , 1 986. Parasitic adaptation of pathogenic
fung i to mam mal ian hosts . C RC C ri t . Rev . M ic ro b ia l . , 1 3(2):1 73-21 8.
Demange, C . , Contet-Audonneau, N . , Kombi la, M. , Miegev i l le , M . , Berthonneau, M. , De Vroey, C h . and Percebois, G . , 1 992. Microsporum gypseum c o m p lex in man and an i m a ls . J .Med. Vet.Mycol. , 30:301 -308.
Denning, D.W. , Ward, P.N., Lynda, Fenelon E. and Benbow, E.W., 1 992.
Lack of vessel wall elastolysis in human invasive pulmonary
aspergil losis. lnfect.lmmun., 60(1 2):51 53-51 56.
Denning, D.W. , Ell iot, J. and Keaney, M., 1 993. Temperature-dependent expression of e lastase in Aspergillus species.
J.Med.Vet.Mycol., �:455-458.
Depiazzi , L.J . and Richards, R.B., 1 979. A degrading proteinase test to
distinquish begnin and virulent ovine isolates of Bacteriodes
nodosus. Aust.Vet.J. , 55:25-28.
di Menna, Marg aret E. and Marples, Mary J . , 1 954. Microsporum
distortum sp.nov. from New Zealand. Trans.Brit.Mycoi.Soc. , 37:372-374
Dunn, B.M., 1 989. Determination of protease mechanism. In : Beynon,
R.J. and Bond, Judith S� . Proteolytic Enzymes: A Practical Approach . Oxford U nive rsity Press, (C iarendon P ress)
Oxford. pp.57 -81 .

247
Durie, E .B. and Frey, Dorothea, 1 957. A new species of Trichophyton
from New South Wales. Mycologia, 49 :401 -41 1 .
Durie, E .B. and Frey, Dorothea, 1 962. The presence of dermatophytes
and other keratinophilic fungi in soil . Aust.J.Dermatol . , 2:1 67-
1 71 .
Eakin , Ann E. , McGrath, Mary E. , McKerrow, J .H . , Fletterick, R.J. and
Craik, C.S . , 1 993. Production of crystall izab le cruzain , the
m aj o r c y st e i n e p ro t e a s e f ro m Trypanosoma cruzi. J.Bioi.Chem., 266(9):61 1 5-61 1 8.
E I-Naghy, M.A. , Maghazy, S.N . , Fadi-AI Iah , E.M. and EI-Gendy, Z .K. ,
1 992. Fungistatic action of natu ral oi ls and fatty acids on dermatophytic and saprophytic fungi . Zentralbi. Mikrobio l . , 1 47:21 4-220.
Emmons, C.W. , 1 934. Dermatophytes; natural g rouping based on the
form of the spores and accessory organs. · Arch.Dermatoi.Syphil . , 30(3):337-362.
English, Mary P. , 1 963. The saprophytic growth of keratinophilic fungi on keratin. Sabouraudia, 2:1 1 5-1 30.
English, Mary P. , 1 965. The saprophytic growth of non-keratinophi l ic
fung i o n kerat i n ized su bstrata, and a com pari son with
keratinophi lic fungi. Trans.Brit.Mycoi.Soc. , 48(2):21 9-235.
English Mary P . , 1 972. The epidemiology of animal ringworm in man.
Brit.J.Dermatol. 86(suppl.) :78-87.
English Mary P . , 1 980. Ecological aspects of dermatophytes regarded essentially as anthropophilic. In : Preusser, J.H. (ed. ) , Medical
Mycology, Zbi .Bkt.Suppl. §. Gustav Fisher Verlag, N .Y. pp.53-
59.
=rnst, J .F. , 1 989. Molecular genetics of pathogenic fungi : Some recent developments and perspectives. Mycoses, 33(5): 225-229.

248
Evans, E.G.V. and Gentles, J.C., 1 985. Essentials of Medical Mycology. Churchill Livingstone, London.
Evans, E .G .V . and Richardson , M . D . , 1 989. Medical Mycology: A Practical Approach. Oxford Univ. Press. Oxford.
Evron-Maoz, R. and Raubitschek, F. , 1 960. The morphology of the
p s e u d o p a ra s i t i c p h a s e o f s o m e d e rm at o p h yt e s . Mycopathologia, ,!g:1 1 1 -1 23.
Frazier, W.C., 1 926. A method for the detection of changes in gelatin due to bacteria. J . lnfect.Dis., 39 :302-309.
Frey Dorothea, 1 97 1 . Iso lation of Microsporum cookei from a human case. Sabouraudia, .§!:1 46-1 48.
Friedman, L. , Derbes, V.J . , Hedges, E.P. and Sinski , J.T. , 1 960. The isolation of dermatophytes from the air. J . l nvest.Dermatol. , 35:3-5.
Gadasi Hana and Kobi ler, D . , 1 983. Entamoeba histolyitca: correlation between v i ru le nce and co nte nt of proteolyitc e nzymes.
Exp.Parasitol. , 55:1 05-1 1 0.
Garber, E.D., 1 956. A nutrition-inhibition hypothesis of pathogenicity. The
Amer.Natur. , XC(N°852):1 83-1 94.
Gaur, P.K., Lightwardt, R.W. and Hamrick, J .L, 1 981 . Isozyme variation
among soil isolates of Histoplasma capsulatum. Exp.Mycol. , �:69-77.
Gazzinell i , G. and Pellegrino, J. , 1 964. Elastolytic activity of Schistosoma
mansoni cercaria! extract. J.Parasitol . , 50:591 -592.
3ent les, J.C. and O'Sul l ivan, J .G . , 1 957. Corre lation of human and
a n i m a l r i n g w o r m i n W e st of Scot land . Br i t . M e d . J . ,
ii(5046):678-682.

249
Gentles, J.C. , 1 962. Kerati nophilic fungi and diseases caused by them.
In: Dalldorf, G. (ed. ) , Fungi and Fungous Diseases. Charles
C. Thomas, I l linois. pp. 1 1 -21 .
G e nt les , J . C . , Daws o n , Christ i n e 0 . and Con no le , M . D . , 1 965 . Keratinophilic fungi on cats and dogs 1 1 . Sabouraudia, �:1 71 -1 75.
Georg, Lucille K., 1 956. The role of animals as vectors of human fungus
diseases. Trans.N.Y.Acad.Sci . , jj!:639-647.
Georg Lucil le K. , 1 959. Animals in public health: Diagnosis and Nature . U S Department of Health , Education and Welfare . Public H ealth Service , Bureau of State Services Com m unicable Disease Centre. Antlanta, Georgia.
Georg Luci l le K . , 1 960. Epidemiology of dermatophytes sou rces of i n fec t i o n , m o d e s of t ra n s m iss i o n and e p i d e m ic i t y . Ann .N.Y.Acad.Sci . , 89:69-77.
Georg Luci lle K. and Camp, LB., 1 957a. Routine nutritional tests for the
identification of dermatophytes. J.Bacteriol. , 74:1 1 3-1 21 .
Georg Luci lle K. , Kaplan, W. and Camp, LB., 1 957b. Equine ringworm
w i t h s p e c i a l re f e re n c e t o Trichophyto n equin um. Am.J.Vet.Research. , 1§:798-81 0 .
Georg Lucille K. , Kaplan, W. , Ajello, L , William, W.M. and Ti lden Evelyn,
B . , 1 95 9 . T h e p aras i t i c n atu re of t h e s o i l f u n g u s Keratinomyces ajelloi. J. lnvest .Dermatol. , 32:539-544.
G essner, A . R . a nd Mortensen , J . E . , 1 990. Pathogenic factors of
Pseudomonas cepacia i so lates from patients with cystic
fibrosis. J.Med.Microbiol. , 33: 1 1 5-1 20.

250
Gharbia, S.E. and Shah, H .N . , 1 990. Identification of Fusobacterium spec ies by the e lectrophoret ic m ig ration of g lutamate dehydrogenase and 2-oxoglutarate reductase i n relation to
their DNA base composition and peptidoglycan dibasic amino
acids. J.Med.Microbiol. , 33:1 83-1 88.
Giblett, E. R. and Henry, B.S. , 1 950. Physiological studies on the genus Microsporum. J. lnvest.Dermatol., 1 4:377-386.
Gibson , I . and Khadem, N . , 1 983. Protein variation i n protozoa. I n : Oxford, G.S. and Rollinson, D . (eds.), Protein Polymorphism :
Adaptative and Taxonomic Significance. The Systematics
Association Special Volume, N1124. Academic Press, N.Y . . pp.59-73.
Goodwin, S.B., Spielman, Linda J. , Bergerson, J.M. and Fry, W.E., 1 992. Clonal diversity and genetic differentiation of Phytophthora infestans populat ions i n nort h e rn and central Mex ico . Phytopathology, 82:955-961 .
Goodwin , S.B. , Maroof, M.A.S. , Al lard, R.W. and Webster, R.K., 1 993.
I s ozym e vari at io n w it h i n a n d am o ng po p u l at i o n s of
Rhynchosporium secalis i n Europe, Australia and U nited
States. Mycoi.Res., 97:49-58.
Gordon, M.A., 1 953. The occurence of the dermatophyte Microsporum gypseum as a saprophyte in the soi l . J . l nvest.Dermatol . ,
20:201 -206.
Gordon, M.A. , 1 981 . Relative virulence of different mating types of the
Microsporum gypseum complex. I n : Vanbreuseghem , R. and De Vroey C . (eds.) , Sexuality and Pathogenicity of Fungi.
Proceedings of the third . International Colloquium on Medical
Mycology. Masson, N.Y., pp. 1 70-1 76.
G o rdo n , M . A . , Pe rri n , U . and L i tt l e , G . N . , 1 967. D i ffere n ces i n
p at h og e n i c i t y b e t w e e n Microsporum gypseum a n d
Microsporum fulvum. Sabouraudia, §:366-370.

251
Granell i-Piperno Angela and Reich, E., 1 978. A study of protease and protease-inhibitor complexes in biological fluids. J .Exp.Med.,
1 48:223-234.
G rappe l Sara h , F. and B lank , F. , 1 972. Ro le of kerat i nases i n dermatophytosi s , 1 : I m mune responses of g u i n ea pigs
infected with Trichophyton mentagrophytes and guinea pigs immunized with keratinases. Dermatologica, 1 45:245-255.
Griff in, D.M. , 1 960a. Perfect stage of Microsporum gypseum. Nature, 1 86:94-95.
Griffin, D.M. , 1 960b. Fungal colonisation of steri le hair in contact with
soi l. Trans.Brit.Mycoi.Soc. , 43:583-596.
G riffi n, D .M. , 1 960c. The rediscovery of Gymnoascus gypseum, the
perfect state of Microsporum gypseum, and a not e o n Trichophyton terrestre. Trans.Brit.Mycoi.Soc. , 43(4):637-642.
G ri n , E. l . and Ozegovic, L . , 1 963. I nf luence of the soi l o n certain dermatophytes and their evolutional trend. Mycopathologia, 21 :22-28.
G rzywnowicz, G. , Lobarzewski , J . , Wawrzkiewicz, K. and Wolski , T. ,
1 989. Comparative characterisation of proteolytic enzymes
from Trichophyton gallinae and Trichophyton verrucosum.
J.Med.Vet.Mycol. , 27:31 9-328.
H aj in i , G .H . , Kandhari , K.C . , Mohapatra, L.N. and Bhutani, L.K. , 1 970.
E ffect of h a i r o i l s and fatty acid s o n t h e g rowth o f
dermatophytes and thei r in vitro penetration of human scalp
hair. Sabouraudia, !!:1 74-1 76.
H amrick, J .L. , Lightwardt, R.W. and Lan, C. , 1 986. Levels of isozyme variation within and among Histoplasma capsulatum localities.
Trans. Kansas Acad.Sci. , 89(1 -2):49-56.

252
Hanaoka, F., Shaw, J .L. and Mueller, G.C., 1 979. Recovery of functional
proteins from sodium dodecy l sulfate-po lyacrylamide gels. Anai.Biochem., 99:1 70-1 74.
Harris, E . L. V. and An gal, S . , 1 989 . Protein Pu rification : A Practical Approach . Oxford U n iversity Press, (Ciare ndon P ress)
Oxford.
H arri s , H . a n d H o pk n i s o n , D . A . , 1 976 . H a ndbook of E nz y m e Electrophoresis i n Human Genetics. North-Holland Publishing
Company. New York.
Healy, N . , Grieg , S . , Enahoro, H. , Roberts, H. , Drake, L. , Shaw, E. and
Ashal l , F. , 1 992. Detection of peptidases in Trypanosoma
cruzi ep imastigotes usi ng chromogenic and f luorogen ic
substrates. Parasitology, 1 04:31 5-322.
Hedrick, P.W., 1 971 . A new approach to measuring genetic similarity. Evolution, 25:1 76-1 80.
H el lmich, S. and Schauz, K., 1 988. Production of extracellular alkaline
and neut ra l p roteases of Ustilago maydis. Exp . Myco l . , .l_g:223-232.
H eusse n , C . and Dowdle , E . B . , 1 980 . Electrophoretic analys i s of
p lasminogen activators in polyacrylamide gels contain ing
sodiu m dodecyl su lfate and copo lymerised substrates .
Anai.Biochem., 1 02:1 96-202.
H i l l , B.H . R. , 1 959. Microsporum canis i nfection in man and an imals.
Aust.J.Dermatol. , §:1 03-1 06.
H il l , R.E. and Hastie, N.D. , 1 987. Accelerated evolution in reactive centre regions of serine protease inhibitors. Nature, 326:96-99.
Hi ll is, D.M. and Moritz, C. (eds. ), 1 990. Molecular Systematics. Sinauer Associates, l!'lc· Publishers , Sunderland, Massachusetts,
U.S.A.

253
Hopsu-Havu, V.K. , Sonck, C.E. and Tunnela E lvi, 1 972. Production of elastase by pathogenic and non-pathogenic fungi. Mykosen,
1 5{3):1 05-1 1 0.
Howard, D.H. , 1 983. Ascomycetes: the Dermatophytes. In : Howard, D.H. (ed. ) , Fungi Pathogenic for Humans and Animals. Part A
(Biology). Marcel Dekker, I nc., N. Y ., p. 1 1 3-1 47.
Hubalek, Z. and Rush-Munro, F.M. , 1 973. A dermatophyte from birds:
Microsporum ripariae sp. nov .. Sabouraudia, 2{3):287-292.
Hunter, R.L. and Markert, C.C. , 1 957. Histochemical demonstration of enzymes separated by zone e lectrophoresis in starch gels. Science, 1 25:1 294-1 295.
Husse in , H .M. , 1 987. Fusaria and Fusarium Toxins i n Maize. PhD
Thesis. Massey University, New Zealand.
I .U.B. , 1 984. Enzyme Nomenclature : I nternational Union of Biochemistry
Nomenclature Committee. Academic Press. New York, USA.
lve, F.A. , 1 966. The carrier state of tinea capitis in Nigeria. Brit.J.Dermatol., 78:21 9-221 .
Jeffries, C.D. , 1 982. Problems and status of the pathogenic fungi. I n :
Baxter, M . (ed.) , Proceedings of the Eighth Congress o f the
I nternationa l Society for Human and Animal Mycology,
Massey University, Palmerston North, pp.438-439.
-
Jeffries , C . D . , Reiss Errol and Aje l lo , L. , 1 984. Analytical isoelectric
focus i ng of secreted d ermatophyte protei ns appl ied to
taxonomic differentiation of Microsporum and Trichophyton
species (preliminary studies). J.Med.Vet. Mycol., 22:369-379.
Jones Merie l G . and Noble, W.C. , 1 981 . A study of fatty acids as a
taxonomic too l for derm atophyte fung i . J .Appl. Bacteria l .
50:577-583.

254
Kaben , U. , 1 967. Verbreitung und epidemiologie der dermatomykosen tierischen ursprung. Mykosen, . .1Q:47-60.
Kaplan , W. , Hopping, J .L. and Georg, Luci l le K. , 1 957. Ringworm in horses caused by the dermatophyte Microsporum gypseum. J.Am.Vet.Med.Assoc., 1 31 :329-332.
Kaplan , W. , Georg, Luci lle K. , Hendricks, S.L. and Leeper, R.A. , 1 957. Isolation of Microsporum distortum from animals in the United
States. J . lnvest.Dermatol., 28:449-453.
Kaplan , W. and Gump, R. H . , 1 958. Ringworm in the dog caused by
Trichophyton rubrum. Vet.Med., 53:1 39-1 42.
Kaplan , W. , and lvens Sue M. , 1 96 1 . Observations on the seasonal variations in incidence of ringworm in dogs and cats in the United States. Sabouraudia, 1:91 -1 02.
Kat oh , T., Sane, T. and Kagawa, S . , 1 990. Isolation of dermatophyte
from clin ically normal scalps in Microsporum canis i nfections using the hairbrush method. Mycopathologia, 1 1 2:23-25.
Keene, W.E. , Petitt, M.G. , Alien Susan and McKerrow, J .H. , 1 986. The
maj o r n e ut ra l p ro te i n ase o f Entamoeba histolytica.
J.Exp.Med., 1 63:536-549.
Keep, J .M., 1 960. The viability of Microsporum canis on isolated cat hair.
Aust.Vet.J. , 36:277-278.
King , D.S, 1 979. Systematics of fungi causing entomophthoromycosis.
Mycologia, 71 :731 -745.
Klokke, A.H. and de Vries, G.A. , 1 -963. Tinea capitis i n chimpanzees
caused by Microsporum canis Bod i n 1 902 res e m bl i ng
M.obesum Conant 1 937. Sabouraudia, 2(4):268-270.

255
Kolattukudy, P .E . , Lee, J .D . , Rogers, L.M . , Zimmerman, P. , Cese lski Sarah, Fox, B., Stein, B. and Copeland, E.A., 1 993. Evidence
for possible involvement of e lasto lytic serine protease i n Aspergillus. lnfect. lmmun., 61 (6):2357-2368.
Koneman, E .W. , Roberts, G . D . and W rig ht , S .F . , 1 978. P ractical Laboratory Mycology. Williams and Wilkins, Baltimore.
Kot rajaras , R . , 1 965. Studies on proteo lyt ic enzyme produced by
dermatophytes. J . lnvest.Dermatol . , 44:1 -5.
Krempi-Lamprecht, 1 988. Identification of dermatophytes by classical and rapid methods. In: TOmbay, E. (ed.), FEMS-Symposium of dermatophytes and Dermatophytoses in Man and Animals.
May 21 -23, 1 986. lzmir, Turkey. pp.39-47.
Kunert, J., 1 992. Effect of reducing agents on proteolytic and keratinolytic
activity of e nzymes of Microsporum gypseum. Mycoses , 35:343-348.
Kunitz , 1 . 0. , 1 992 . Structu re-based strategies for drug desig n and discovery. Science, 257:1 078-1 082.
Kurzeja, K.C. and Garber, E.D., 1 973. A genetic study of electrophoretical ly variant extracel lular amylolytic enzymes of
wild-type strains of Aspergillus nidulans. Can.J.Genet.Cytol . ,
.1.§:1 75-287.
Kwon-Chung Kyung J. , 1 974. Genetics of fungi pathogenic for man. CRC
Crit. Rev.Microbiol . .�:1 1 5-1 33.
La Touche, C.J . , 1 955. The impo rtance of t he animal reservoi r of infection in the epidemiology of animal-type ringworm in man.
Vet.Rec. , 67:666-669.

256
Lacey, J . , 1 990. Aerobio logy and health : the role of ai rborne fungal spores in respiratory disease. In : Hawksworth, D.C. (ed. } ,
Fontiers in Mycology : Hononary and General Lectures from t h e fo u rt h I n te rnat i o n a l M yco log ical Co ngress . CAB
International. pp. 1 57 -1 85.
Lachapelle, J.M. and Armijo, F., 1 983. Anatomo-cli nical classification of dermatophytoses: its therapeutic implications. In : Rook, A.J. and Maibach, H . l . (eds.) , Recent Advances in Dermatology. Churchill Uvingstone, London. pp.37-55.
Lacks, S.A. and Springhorn, S.S., 1 980. Renaturation of enzymes after
polycrylamide gel electrophoresis in the presence of sodium dodecyl sulfate. J.Bioi.Chem., 255(1 5):7467-7473.
Laemmli, U.K., 1 970. Cleavage of structural proteins during the assembly of the head of bacteriophage T 4. Nature, 227:680-685.
Langeron, M. and Milochevitch, S., 1 930. Morphologie des dermatophytes sur milieux naturels et sur milieux a base de polysaccharides. Essai de classification (Deuxieme memoire). Ann.Parasitol . , !!:465-508.
Leach, B.E. , Ford, J.H. and Whiffen, A.J. , 1 947. Actidione, an antibiotic
from Streptomyces griseus. J.Am.Chem.Soc. , 69 :474.
Lee Wen Shya, 1 979. The Isolation of Keratinophi lic Fungi from Soil in
Palmerston North City and the S urroundi ng area. B .Sc. Project. Massey Univ. , New Zealand.
Le ucht man n , A . and Clay , K . , 1 990 . I sozy me vari at i o n i n t h e
A crem o nium/Epichloe fu n g a l e n d o p h yt e co m p l e x . Phytopathol. , 80(1 0): 1 1 33-1 1 39.
_euchtmann, A., Petri ni , 0., Petrin i , E. Li l iane and Carrel, G.C., 1 992.
Isozyme polymorphism in six endophytic Phyllosticta species.
Mycol. Res., 96(4):287-294.

257
Lewontin, R.C., 1 972. The apportionment of human diversity. Evoi .Biol., §: 381 -399.
Lewontin , R.C . , 1 974. The Ge netic Basis of Evolut ionary Change.
Columbia University Press.
Lewonti n , R.C. and Hubby, J .C. , 1 966a. A molecular approach to the study of genic heterozygosity in natural populations. 1 : The number of alleles at different loci in Drosophila
pseudoobscura. Genetics, 54:577-594:
Lewontin , R.C. and Hubby, J.C. , 1 966b. A molecular approach to the
study of genetic heterozygosity in natu ral populations. 1 1 : amount of variation and degree of heterozygosity i n natural populations of Drosophila pseudoobscura. Genetics, 54:595-
609
Londero, A.T. and Ramos, Cecy D. , 1 985. A twenty-year ( 1 960-1 970) survey of dermatophytes in the state of Rio Grande Do Sui,
Brazi l . I n : P roceedings of the 5th I nternat ional ISHAM Co nfere nce o n Mycoses : Superficia l , Cutaneous , and Subcutaneous Infections. Scientific Publication N°396, Pan
American Health Organisation, Caracas, Venezuela. 27-30th
April, 1 980. pp. 1 88-1 92.
Lorincz, A.L. and Sun, S.H. , 1 963. Dermatophyte viabi lity at modestly
raised temperatures. Arch. Dermatol., 88:393-402.
Lowry, O.H. , Rosenbrough , N .J . , Farr, A.L. and Randal l , R.J . , 1 951 .
P rote i n m easu re me nt wi th t he fo l i n pheno l reag e nt .
J.Bioi.Chem., 1 93:265-275.
Lundell , E . , 1 965. Microsporum cookei Ajello, An eczematous skin lesion.
Mykosen, j_g:1 23-1 26.
Lunder, M. , 1 992. Is Microsporum canis i nfection about to become a
serious dermatological problem?. Dermatology, 1 84:87-89.

258
Lurie, H. and Borok, R. , 1 955. Trichophyton mentagrophytes iso lated
from the soil of caves. Mycologia, 49:506-51 0.
Mackenzie, D.W.R. , 1 961 . The extra-human occurence of Trichophyt_on tonsurans var sulfureum in a residential school.
Sabouraudia.! :58-64.
Mackenz ie , D .W. R. , 1 963. "Hai rbrush diagnosis" in detect ion and eradication of non-fluorescent scalp ringworm.
Brit. Med.J . • ii :363-365.
Mackenzie , D .W. R . , 1 988. Antigen ic co mposition and serology of dermatophytes. In : Tumbay, E. (ed. ) , FEMS-Symposium of dermatophytes and Dermatophytoses in Man and Animals. May 21 -23, 1 986. lzmir, Turkey. pp.31 -38.
Maeda, H . and Mol la , A. , 1 989 . Pathogenic pote ntials of bacterial proteases. Clin.Chim.Acta, 1 85 :357-368.
Magurran, E. Anne, 1 988. Ecological D iversity and its Measure ment. Prince Univ. Press, New York.
Mahan, M .J . , S lauch , J .M . and Mekalanos, J .J . , 1 993. Se lection of bacterial virulence genes that are specifically induced in host
tissues. Science, 259:686-688.
Male, 0. and Holubar, K. , 1 968. Comparative studies on the enzyme
h istochemical behaviour of some dermatophytes. I. in vitro
i nvestigation (saprophytic biophase). Mycopathoi.Mycoi .Appl. ,
35:1 50-1 60.
\t1ale, 0., Thurner, J. and Jaksch, W. , 1 980. Microsporum infections in
the Federal Republic of Germany. Medical Mycology, Zbl. Bakt. Suppl., §. pp.353-360.
�a le , 0 . , 1 99 0 . The s i g n if icance of m ycology in m ed ici n e . I n :
Hawksworth, D.C. (ed.), Fontiers in Mycology: Hononary and
General Lectures from the fourth International Mycological
Congress. CAB International. pp. 1 31 - 1 56 .

259
Mandl, 1 . , 1 961 . Collagenases and elastases. Adv.Enzymol. , 23: 1 63-264.
Mantovani , A. , 1 978. The role of animals in the epidemiology of mycoses. Mycopathologia, 65:61 -66
Mantovani , A. , 1 982. Current trends in our knowledge of the ecology and epidem io logy of fungal i nfect ions . I n : Baxte r , M . (ed. ) ,
P roceedings of the Eighth Congress o f the I nternational
Society for Human and Animal Mycology, Massey University, Palmerston North, pp.360-361 .
Marchis io , V .F . , Curretti , D . , Cassine l l i , C. and Bordese, C . , 1 991 . Kerati noph i l ic fungi i n t he so i ls of Papua New Gu inea. Mycopathologia, 1 1 5:1 1 3-1 1 9.
Mariat, F. and Adan-Campos, C., 1 967. La technique du cam� de tapis,
m e t h od s i m p le d e p re l ev e m e nt d a n s l e s m yc o s e s superficielles. Ann. lnst.Pasteur, 1 1 3:666-668.
Maresca, B . and Kobayas h i , G . S . , D i mo rph ism i n Histoplasma capsulatum: a model for the study of cel l differentiatio n in pathogenic fungi. Microbioi.Rev. ,53(2):1 86-209.
Markert, C .L. and Moller, F. , 1 959. Multiple forms of enzymes: tissue,
ontogenic and species specific patterns. Proc.Nati.Acad.Sci . ,
45:753-763.
Marples, Mary J . , 1 95 1 . Some observations on the occurrence and c l i n ical course of t i nea capit is and corpori s i n Otag o .
N.Z.Med.J. , 50 :460-65.
Marples Mary J. , 1 956. The ecology of Microsporum canis Bodin in New
Zealand. J .Hygiene, 54:378-387.
Vl a rp les M a ry J . , 1 95 9 . Some p ro b l e m s i n t he eco logy o f t h e
dermatophytes. N.Z. Med.J. , 58:64-69.

260
Marples Mary J . , 1 965. The distribution of keratinophi lic fungi in soils f ro m New Zea land and f ro m two Po lynes ian I s lands . Mycopathoi.Mycoi.Appl., 25:361 -372.
Marples Mary J. and Smith, J.M.B. , 1 960. The hedgehog as a source of human ringworm. Nature. Lend., 1 88:867.
Marples, Mary J. and Smith, J.M.B. , 1 962a. Further observations on the ecology of Microsporum distortum. N.Z. Med.J. , 6 1 :539-544.
Marples Mary J. and Smith, J .M.B. , 1 962b. Trichophyton te"estre as a
resident in hedgehog skin. Sabouraudia, g:1 00-1 07.
Matsumoto, T. , Padhye, A.A. and Ajello, L. , 1 983. Successful mating of Microsporum distortum with Nannizzia otae. Trans.Brit.Mycoi.Soc. , 81 (3):645-650.
May, B . , Roberts , D.W. and Soper, R.S. , 1 979. l ntraspecific genetic variab i l i ty in labo rato ry st rai ns of Entomophthora as determined by enzyme e lectrophoresis. Exp.Mycol. , �:289-297.
Maynard-Smith, J . , 1 971 . What is sex?. J.Theor.Biol. , 30 :31 9-335.
McAieer Rose, 1 980. Fungal infections of the scalp in Western Australia. Sabouraudia, j]:1 85-1 90.
McGinnis, M.R., 1 980. Recent taxonomic developments and changes in medical mycology. Ann.Rev.Microbiol., 34:1 09-1 35.
McGinnis, M.R., Ajello, L. and Rogers, D.P. , 1 981 . Proposal to conserve
Epidermophyton Sabouraud, 1 907. Taxon, 30: 351 -353.
'v1cKerrow, J.H. , Pino-Heiss Stephanie , Undquist, R. and Werb, Z., 1 985.
Purification and characterisation of elastinolytic proteinase
secreted by cercariae of Schistosoma mansoni. J.Bioi.Chem.,
260{6) :3703-3707.

261
Medical Research Council, 1 967. Nomenclature of Fungi Pathogenic to Man and An imals . Me m o randu m N °23 ( 3 rd e d . ) , H e r Majesty's Office, London.
Medoff, G., Sacco Margherita, Maresca, B. , Schlessinger, D., Painter, A., Kobayashi , G.S. and Carratu. L., 1 986. Irreversible block of
t h e myce l ia l -to-yeast p h ase t ransit ion of Histoplasma capsulatum. Science, 231 :476-479.
Medoff, G . , Kobayashi , G.S. , Painter Audrey and Travis , S . , 1 987.
M o rp h og e n e s i s a n d p at h o g e n ic i ty of Histoplasma capsulatum. lnfect. lmmun., 55(6):1 355-1 358.
Meevootisom, V. and Niederpruem, D.J . , 1 979. Contro l of exocellu lar . proteases in dermatophytes and especially Trichophyton rubrum. Sabouraudia, 1 7:91 - 1 06.
Micales, J.A., Bonde, M.R. and Peterson, G.L, 1 986. The use of isozyme ana lysis i n fungal taxonomy and genetics . Mycotaxon , 27(27):405-449.
Michelmore, R.W. and Hulbert, S.H. , 1 987. Molecular markers for genetic analysis of phytopathogen ic fungi . Ann. Rev.Phytopathol . , 25:383-404.
M idg ley G i l l i an and C layton , Yvo n n e M. , 1 972 . D i st ri b ut io n o f
d e rmat o p h ytes a n d Candida albicans s p o re s i n t h e
environment. Brit.J.Dermatol. , 86(suppl.8) :69-n.
Mi llis, S .d. , Forster, H. and Coffey, M.D. , 1 99 1 . Taxonomic structure of
Phytophthora, Cryptogea and P.drechsleri based on isozyme
and mitochondrial DNA analysis. Mycoi.Res., 95(1 ):31 -48.
Minocha, Y. , Pasricha, J.S., Mohapatra, L.N. and Kandhari, K.C. , 1 972.
P roteolytic activity of d ermatophytes and its role i n the pathogenesis of skin lesions. Sabouraudia, 1 0 :79-85.

262
Mirelman, D. , 1 987. Effect of culture conditions and bacterial associates
on the zymodemes of Entamoeba histolytica. Parasitology
Today, 3(2):27-40.
Mochizuki, T. , Takada, K., Watanabe, S., Kawasaki, M. and lshizaki, H. , 1 990. Taxonomy of Trichophyton interdigitale ( Trichophyton
mentagrophytes var. interdigitale) using restriction enzyme analysis of mitochondrial DNA. J.Med.Vet.Mycol. , 28:1 91 -1 96.
Moore, G.L. , 1 969. Use of azo-dye-bound collagen to measure reaction velocities of proteolytic enzymes. Anai.Biochem., 32:1 22-1 27.
Murphy, R.W., Sites, J.W. , Buth, D.G. and Haufler, C.H., 1 990. Proteins 1 : Isozyme e lectrophoresis. I n : H i l l is , D .M. and Moritz, C.
(eds . ) , Molecular Systematics. S inaue r Associates , I nc.
Publishers, Sunderland, Massachusetts, U.S.A. , pp.45-1 21 .
Mycoses Newsletter. Apri l , 1 991 . 1JID:1 3-1 7. CDC, New Zealand
Mycoses Newsletter. Apri l, 1 992. g{ll:3- 13. CDC, New Zealand
Nakamura, M., 1 956. Casease i n Entamoeba histolytica. Nature, Lond. , 1 83:397.
Nealson , K. H . and Garber, E. D . , 1 967. An electrophoretic survey of este rases, phosphatases and leucine aminopeptidases in mycelial extracts of species of Aspergillus. Mycologia, 59:331 -336.
Nei, M. , 1 972. Genetic distance between populations. Amer.Natur. , 1 06:
283-292.
Nei , M . , 1 973. Analysis of gene d iversity in subdivided populations.
Proc.Nat.Acad.Sci. USA., 70(1 2): 3321 -3323.
Nei , M . , 1 975. Molecu lar Population Genetics and Evolution . North
Holland, Amsterdam.

263
Nei, M. , 1 977. F-statistics and analysis of gene diversity in subdivided populations. Ann.Hum.Genet. , Lond., �:225-233.
Nei , M. , 1 978. Estimation of ave rage heterogosity and genetic distance from a small sample of individuals. Genetics, 89: 583-590.
N i s h i ha ra , M . , C h ram bach , A . and Aposh ian , V. H . , 1 967 . The
deoxycytidylate deaminase found i n Bacillus subtilis infected
with phage SP8. Biochemistry, 6(7):1 877-1 886.
North, M.J . , 1 982. Comparat ive biochemistry of the prote inases of eucaryotic microorganisms. Microbioi.Rev. , 46(3):308-340.
Noval, J .J. and Nickerson, W.J . , 1 959. Decomposition of native keratin
by Streptomyces fradiae. J. Bacteriol. , n:251 -263.
O'Sullivan, J. and Mathison, G.E., 1 971 . The localisation and secretion of a proteolytic enzyme complex by the dermatophytic fungus, Microsporum canis. J.Gen.Microbiol. , 68:31 9-326.
Okeke, C . N. and Mul ler, J. , 1 99 1 . In vitro production of extracel lular e lastolytic proteinase by Histoplasma capsulatum var. duboisii
and Histoplasma capsulatum var. capsulatum i n yeast phase. Mycoses, 34:461 -467.
Olgert, R.P. and Wretlind, B., 1 979. Assessment of protease (elastase)
a s a Pse udomonas a e ruginosa v i ru l ence fact o r i n
experimental mouse burn infection. l nfect. lmmun. , 24(1 ):1 81 -
1 87.
Ornstein, L., 1 964. Disc e lectrophoresis. I. Background and theory. Ann.
N . V. Acad.Sci. , 1 21 :32 1 -349.
Orr, G.F. , 1 969. Keratinophilic fungi isolated from soi ls by modified hair
bait technique. Sabouraudia, Z:1 29-1 34.
Osterman, LA., 1 984. Methods of Protein and Nucleic Acid Research: 1 .
Electrophoresis, l soe lectric Focusing, U ltracentrifugation.
Springer-Verlag, N.Y.

264
Otcenasek, M. , 1 978. Ecology of the dermatophytes. Mycopathologia, 65:67-72.
Oudemans, P. and Coffey, M.D., 1 991 . Isozyme comparison within and among worldwide sources of three morphologically distinct species of Phytophthora. Mycoi.Res. , 95(1 ):1 9-30.
Padhye , A.A. , 1 97 1 . An unusual variant of Microsporum cookei.
Sabouraudia, �:254-255.
Padhye , A.A. and Carm ichae l , J . W . , 1 968 . Mat ing react ions of Trichophyton simii and T. mentagrophytes strains from poultry farm soi l in India. Sabouraudia, §:238.
Padhye , A.A. and Carmichae l, J .W. , 1 971 . The genus Arthroderma
Berkeley. Can.J.Botany, 49:1 525-1 540.
Padhye , A. A. and Carmichae l , J. W. , 1 972. Arthroderma insingulare sp.nov. , another gymnoascaceous state of the Trichophyton
terrestre complex. Sabouraudia, 1Q:47-51 .
Padhye, A.A. , Blank, F., Koblenzer, P.J. Patz, S. and Ajello, L. , 1 973.
Microsporum persicolor i nfect ion in the U n ited States .
Arch.Dermatol., 1 08:561 -562.
Padhye, A.A. and Aje l lo, L. , 1 974. Further observations on Nannizzia
persicolor (="N. quinckeanr). Sabouraudia, jg:362-363.
Parkinson, D . , G ray, T. R.G. and Wi l l iams, S.T. , 1 97 1 . Methods fo r
Studying the Ecology of Soi l Micro-organisms. IBP Handbook,
N21 9. Blackwell Scientific Publications. Oxford.
Philpot Christine M. , 1 977a. Some aspects of the epidemiology of tinea.
Mycopathol. Mycol. Appl. , 62( 1 ) :3-1 3.
P h i l pot C h rist i n e M . , 1 977b. The use of n utrit ional tests fo r t he
identification of dermatophytes. Sabouraudia, 1.§:1 41 -1 50.

265
P h i l pot C h ri st i n e M . , 1 978a . Geog rap h ical d ist ri bu t i on o f t he dermatophytes: a review. J.Hyg. , Camb., 80:301 -31 3.
P h i l pot Chri sti n e M . , 1 978b. Sero log ical d i ffe rences among the dermatophytes. Sabouraudia, .1§.:247-256.
Pi l lsbury, D.M. , Shel ley, W.B. and Kligman, A.M. , 1 956. Text Book of Dermatology. W.B.Saunders Co. , Phi ldelphia. pp. 1 05-1 06.
P inett i , P ., 1 962. On the validity of the concept of keratinophi lia of
dermatophytes in the pathogenesis of dermatophytoses. Italian Gen.Rev.of Dermatol., 1 1 1 (3):1 -9.
Polonelli , L. , Castagnola, M. and Morace, G. , 1 986. Identification and serotyping of Microsporum canis i solates by monoclonal
antibodies. J.Ciin.Microbiol. , 23(3):609-61 5.
P rakash , S . , Lewonti n , R .C . and Hubby , J . L. , 1 969 . A molecu lar approach to the study of genic heterozygosity in natural popu lat ions. IV. P atte rns of genic variat ions in central,
marg inal , and isolated popu lations of Drosophila pseudo
obscura. Genetics, §1:841 -858.
Prochacki , H. and Engelhardt-Zasada Charlotta, 1 974. Epidermophyton stockdaleae sp.nov . . Mycopathol. Mycol. Appl. 54:341 -345.
Pugh, G.J .F. , 1 964. Dispersal of Arthroderma curreyi by birds, and its
role in the soil. Sabouraudia, �:275-278.
Pume ll, D.M., 1 978. Virulence genetics of Aspergillus nidulans Eidam: A
review. Mycopathologia, 65:1 77-1 82.
Pumell, D.M. and Martin, G.M., 1 971 . Aspergillus nidulans: association of certai n alkal i ne phosphatase mutat ions with decreased
viru lence for mice. J . lnfect.Dis. , 1 23(3):305-306.

266
P u s h ka re nko , V. l . and P u s h kare n ko , G . D . , 1 96 9 . Obobennosti aminokislotnogo sostava poto so stopu litz s kl inicheski vyra
zhennoi epidermofitiei. Vestn.Dermatoi.Venerol. , 49:47-49.
Raubitschek, F . , 1 955. Nutritional requirements of dermatophytes i n continuous shake culture. J . lnvest.Dermatol., 25(2):83-87.
Raubitschek, F. , 1 957. Preliminary and short report: in vitro i nvasion of hair by dermatophytes. J. lnvest.Dermatol. , 29(3):1 61 -1 64.
Raubitschek, F . , 1 961 . Mechanical versus chemical keratinolysis by dermatophytes. Sabouraudia, .1m :87-90.
Raubitschek, F. and Maoz, Ruth . , 1 957. Invasion of nai ls in vitro by certain dermatophytes. J . lnvest.Dermatol . , 28(3):261 -267.
Rebell, G. and Taplin, D., 1 978. Dermatophytes: Their Recognition and
Ident i ficat ion . U n ivers ity of Miami Press, Coral Gables, Florida.
Reddy, M.M. and Threlkeld, S.F.H. , 1 971 . Genetic studies of isozymes in Neurospora I . a study of eight species. Can.J.Genet.Cytol . ,
ll:298-305.
Reddy, M.M. and Threlkeld, S.F.H. , 1 972. Genetic studies of isozymes in
Neurospora 1 1 . Esterases. Can.J.Genet.Cytol. , 1 4:527-531 .
Reed, S.L. , Keene, W.E. and McKerrow, J .H . , 1 989. Thiol proteinase
expression and pathogenicity of Entamoeba histolytica.
J.Ciin.Microbiol., 27(1 2):2772-2777.
Rees" R.G. , 1 967. Keratinophi lic fungi from Queensland - I . lsolations
from animal hair and scales. Sabouraudia, §:1 65-1 72.
Reichard , U . , BOttner Susanne, E iffert, H . , Staib, F. and ROchel, R. ,
1 990. Purification and Characterisation of extracellular serine
proteinase fr�m Aspergillus fumigatus and its detection in
tissue. J.Med.Microbiol. , 33:243-251 .

267
Reynolds, J.A. and Tanford, C. , 1 970. The gross conformation of proteinsodiu m dodecyl sulfate complexes. J . Bioi.Chem. , 243 :372-374.
R i ba, G . Bouvie r- Fourcade, I . and Caudal , A . , 1 986. lsoenzymes polymorphism in Metarhizium anisopliae (Deuteromycotina: Hyphom ycetes ) . Entomoge nous fu ng i . Mycopatho logia,
96:1 61 -1 69.
Rippon , J . W. , 1 967. E lastase production by ringworm fungi. Science, 1 57 :947.
R ippo n , J .W. , 1 968 . E xtrace l l u lar co l lage nase from Trichophyton
schoenleini. J.Bacteriol. , �:43-46.
Rippon , J .W. , 1 975. Biochem ical-genetic dete rminants of vi ru lence among dermatophytes. In : Mycoses. Proceedings of the Third
International Conference on the mycoses, Sao Paulo, Brazi l ,
27-29 August , 1 974 , Wash i ngto n , Pan American H ealth Organisation. pp.88-97.
Rippon, J.W. , 1 982a. Host specificity in dermatophytoses. In : Baxter, M.
(ed.) , Proceedings of the Eighth Congress of the International
Society for Human and Animal Mycology, Massey University,
Palmerston North, pp.28-33.
Rippon, J .W., 1 982b. Medical Mycology: The Pathogenic Fungi and the
Pathogenic Actinomycetes. W.B.Saunders, London. pp.1 54-
248.
Rippon, J .W., 1 985. The changing epidemiology and emerging patterns
of dermatophyte species. In : McGinnnis, M.R. (ed.) , Current
Topics in Medical Mycology (vol. 1 ) . Springer-Verlag. pp.208-
234.
R i pp o n , J .W. a n d Sche rr , G . H . , 1 95 9 . I n d uced d i m o rp h i s m i n
dermatophytes. Mycologia, 51 :902-91 4.

268
R i pp o n , J . W. and Lori ncz , A. L. , 1 964 . Co l lag e n ase act iv i ty of Streptomyces (Nocardia) !71adurae.J . I nvest . D ermato l . ,
43:483-486.
Rippon, J.W. and Varadi, D.P., 1 968. The elastases of pathogenic fungi and actinomycetes. J . lnvest.Dermatol., 50(1 }:54-58.
Rippon, J .W. and Garber, E.D. , 1 969. Dermatophyte pathogenicity as a
f u nct i o n o f m at i n g t y p e and a s s o c iat e d e nz y m e s . J . lnvest.Dermatol. , 53:445-448.
Rippon, J.W. and Soo Hoo, M., 1 971 . Determination of fungal elastase. Appi.Microbiol., 22(3):471 -472.
Roberts, F.F. and Doetsch, R. N . , 1 967. Purification of a highly active
p rotease fro m a Microsporum spec ies . Anto n i e van Leeuwenhoek, 33:1 45-1 52.
Rodbard, D. and Chrambach, A. , 1 971 . Estimation of molecular radius, f ree mobi l i ty , and va lence us ing po lyac ry l a m i d e g e l electrophoresis. Anai.Biochem., 40:95-1 34.
Rook, A., Wi lki nson, D.S. and Ebl ing , F.J.G. (eds.), 1 968. Textbook of Dermatology (vol.2). Blackwell Scientific Publication, Oxford.
Rosenstreich , D.L. , 1 980. Genetics of resistance to infection. Nature,
285:436-437.
Rosenthal , S .A. and Wapnick, H . , 1 963. The value of MacKenzie's
" h a i rb rush " tec h n i c i n t h e i so lat i o n of Trichophyton
mentagrophytes f rom c l i n ica l ly n o rm a l g u i nea-pig s .
J . lnvest.Dermatol., 41 :5-6.
Rothman, S. , 1 953. Physiology and Biochemistry of the Skin. University
of Chicago Press. pp.349-359.

269
Roy, K., Ghosh, G .R. and Dutta, S.K., 1 972. Keratinophi lic fungi and the prevalence of dermatomycoses in Orissa, India. Sabouraudia, 1 0:21 8-229.
Sabouraud, A., 1 9 1 0. Les Teignes. Masson et Cie, Paris.
Sanchez, J . , Velaso, P. , Quindos, G., Campbell, C.K. and Cisterna, R. , 1 989. Isolation of dysgonic strains of Microsporum canis in Bi lbao (Spain). J.Med.Vet.Mycol., 27:391 -395.
Sanyal, A.K., Das, S.K. and Bane�ee, AB., 1 985. Purification and partial c h aracte ri sat i o n of an exoce l l u la r p ro te i nase f ro m Trichophyton rubrum. Sabouraudia, 23:1 65-1 78.
Sarath, G. , De la Motte Rebecca S. and Wagner F.W., 1 989. Protease
assay methods. I n : Beynon , R .J . and Bond, Judith S . , Proteolytic Enzymes: A Practical Approach. Oxford University Press, (Ciarendon Press) Oxford. pp.25-54.
S a rg eau nt , P .G . , 1 987 . The re l iabi l ity of Entamoeba histolytica zymodemes in clinical diagnosis. Parasitology Today, 3(2):40-43.
Satche l l , J .E. , 1 974. Litte r- interface of animate/i nanimate matter. I n : Dickinson , C . H . and Pugh, G .J .F. (eds. ) , Biology o f Plant
Litter Decomposition (Vol. 1 ). Academic Press, London.
Scopes, R.K. , 1 987. Protein Purification : Principles and Practice (2nd
ed.) . Springer-Verlag. New York.
See, Y .P . and Jackowski , G . , 1 989. Esti mating mo lecular weight of
polypeptides by SOS gel electrophoresis. In : Creighton, T:E. , Protein Structure : A Practical Approach. Oxford Univ. Press,
N.Y. , pp. 1 -1 9.
See l inger, H .P . A. , 1 988. The beg in n ings of m edical mycology. I n :
Tumbay, E . (ed. ) , FEMS-Symposium of Dermatophytes and
Dermatophytoses i n Man and Animals. May 21 -23, 1 986.
lzmir, Turkey. pp. 1 -1 5.

270
Selander, R.K. , McKinney, R.M. , Whittam , T.S . , B ibb, W.F. , B renner, D .J . , No lte , F .S . and Pattison Patricia, E . , 1 985. Genetic st ruct u re o f popu lat i o ns o f Legionella pneumophila.
J.Bacteriol. , 1 63(3):1 021 - 1 037.
Se lander, R .K . , Caugant, D .A. , Och man, H . , Musser, J .M. , Gi lmour Marion, N . , and Whittam, T.S. , 1 986. Methods of multilocus
enzyme electrophoresis for bacterial population genetics and systematics. Appi.Environ.Microbiol., §1.:873-884.
Se lander, R .K . , Caug ant, D .A. and Wh ittman , T. S. , 1 987. Genetic
structure and variation in natural populations of Escherichia
coli. I n : N e id hardt , F . C . , l ng rah a m , J . C . , Low, K. B . , Magasanik, B . , Scaechter, M . and Umbarger, H .E . (eds. ) , Escherichia coli and Salmonella typhimiurium: Cel lular and
Mo lecu lar B io logy, vo l .2 . Am.Soc. M icrobiol . , Washington , DC . . pp. 1 625-1 648.
Selander, R.K. and Musser, J.M., 1 990. Population genetics of bacterial pathogenesis. I n : lng lewski Barbara H. and Clark Virginia L. (eds . ) , Molecu lar Basis of Bacterial Pathogenesis (volxi ) .
Academic Press, Inc. , London. pp. 1 1 -36.
Shadomy, H .J . and Ph i lpot Christine M., 1 980. Uti l isation of standard
laboratory methods i n the laboratory diagnosis of problem
dermatophytes. Am.J.Ciin.Pathol. , 74 :1 97-201 .
Sheldon , A.L. , 1 969. Equitabi lity i ndices: dependence on the species
count. Ecology, 50(3):466-467.
Sici liano, M.J. and Shaw, C.R. , 1 976. Separation and visualisation of enzymes o n gels . I n : S mith, I (ed. ) , Chromatographic and
Electrophoretic Techniques. vol.2. Zone Electrophoresis (4th ed.) . William Heinemann Medical Books Ltd.
S igh , R . S . and Jai n , S . K. , 1 97 1 . Popu lat ion b io logy of Avena: 1 1 isoenzyme polymorphism i n populations of the mediterranean region and Central California. Theor.Appi.Genet. , 41 :79-84.

271
Smith, G . , 1 938. An Introduction to Industrial Mycology. Edward Arnold and Co Ltd. pp.240-251 .
Smith , H . , 1 984. The biochemical challenge of microbial pathogenicity.
J .Appi.Bacteriol., 47:395-404.
Smith, H . , 1 988. The development of studies on the determinants of bacterial pathogenicity. J.Comp.Pathol., 98:253-273.
Smith, H . , 1 989. Progress in studies of the determinants of fungal pathogenicity. The 1 2th lan Murray Memorial Lecture , The British Society for Mycopathology. Oxford. pp.1 -36.
Smith, J.M.B. , 1 982. The pathogenesis of ringworm. In Baxter, M. (ed.) ,
P roceedings of the Eighth Congress of the I nternat ional Society for Human and Animal Mycology, Massey University, Palmerston North, pp. 1 4-23.
Smith, J.M.B. and Marples Mary J., 1 963. Trichophyton mentagrophytes
var. erinacei. Sabouraudia, 3:1 -1 0.
S mith , J .M.B. , Rush-Munro, F.M. and McCarthy, M. , 1 969. Animals as reservoir of human ringworm in New Zealand.
Austr.J.Dermatol. , 1 0(3):1 69-1 82.
Smithies, 0., 1 955. Zone electrophoresis in starch gels: group variations in the serum proteins of normal human adults. Biochem.J.,
21_:629-641 .
S myth , J .D . 1 972. Parasites as models i n cel lular differentiation . I n : I naugural Lecturers, Imperial Col lege, University of London,
London. 55-65.
>neath, P.H.A. and Sokal, R. R., 1 973. Numerical Taxonomy. Freeman.
San Francisco, U.S.A.

272
Somervil le Dorothy A. and Marples Mary J . , 1 967. The effects of soi l enrichment on the isolation of keratinophi lic fungi from soi l samples. Sabouraudia, §:70-76.
Soon, S-H.T., 1 991 . Isolation of keratinophi lic fungi from soil in Malaysia. Mycopathologia, 1 1 3 :1 55-1 58.
Spieth , P . T. , 1 975 . Populat ion genetics o f al lozyme variat io n i n
Neurospora intermedia. Genetics, 80:785-805.
St Lege r, R.J . , May, B . , A l lee, L.L. , Frank, D .C, Staples, R .C. and
Roberts, D. W. , 1 992a. Genetic differences in allozymes and in infection structures among isolates of the
entomopathogenic fungus Metarhizium anisopliae. J . l nvert. Pathol. , 60 :89-1 01 .
St Lege r, R.J . , Al lee , L.L. , May, B. , Staples, R.C. and Roberts, D.W.,
1 992b. World-wide distribution of genetic variation among isolates of Beauveria spp. Mycoi.Res. , 96(1 2):1 007-1 01 5.
Stewart, D . J . , 1 979 . The ro le of e lastase i n the d i ffe rent iat ion of
Bacteriodes nodosus i n fect i o n s i n s h e e p and catt l e . Res.Vet.Sc., 27:99-1 05.
Stockd a l e Phy l l i s M . , 1 9 53a . N ut ri t i o n a l req u i re m ents of t h e dermatophytes. Bioi.Revs. , 28:84-1 04.
Stockdale Phy l l i s M . , 1 953b. Req u i re m e nts for the g rowth and
sporulat ion of Trichophyton persicolor. J . Gen. Microbial . , §:434-441 .
Stockdale Phyllis M . , 1 96 1 . Nannizzia incurvata gen.nov. , sp. nov. , a perfect state of Microsporum gypseum (Bodin) G uiart et
Grigorakis. Sabouraudia, 1:41 -48.
Stockdale Phyllis M. , 1 963. Microsporum gypseum complex (Nannizzia
incurvata Stockd. , N.gypsea (Nann . ) comb .nov. , N. fulva sp.nov.). Sabouraudia, 3:1 1 4-1 26.

273
Stockdale Phyl l is M. , 1 967. Nannizzia persicolor sp.nov. , the perfect
state of Trichophyton persicolor. Sabouraudia, 5 :355-359.
Stockdale, Phyll is M. , 1 968. Sexual stimulation between Arthroderma
simii Stockd. , Mackenzie and Austwick and related species. Sabouraudia, �:1 76-1 81 .
Stockdale, Phyll is M. , 1 981 . Sexual stimulation between Arthroderma simii and other dermatophytes. I n : Vanbreuseghem, R. and De Vroey C. (eds. ) , Sexual ity and Pathogenicity of Fungi.
Proceedings of the Third International Col loquium on Medical
Mycology. Masson, N.Y., pp.57-68.
Takashio, M . , 1 969. Etude de certains facteurs nutritifs stimulant la reproduct ion sexuee chez Arthroderma simii Stockdale. , 1 965. Buii.Acad.R.Belge CI.Sci . , 55:842-852.
Takashio, M . , 1 970. Sexual reproduction of some Arthroderma and
Nannizzia on di luted Sabouraud agar with and without salts. Mykosen, 1M1.1:1 1 -1 7.
Takashio, M . , 1 973a. Etude des phenomemes de reproduction l ies au
v i e i l l i sse m e nt et au raj e u n i sse m e nt des cu l tu re s d e champignons. Ann.Soc.Belge Med.Trop., 53:427-580
Takashio, M . , 1 973b. Les formes sexuees du complex Trichophyton
mentagrophytes: Arthroderma vanbreuseghemii sp.nov. , A rthroderma benhamiae et A rthroderma simii. B u l l .
Soc.Fran�. Mycol. Med.,_g:1 53-1 56.
Takashio, M . , 1 974. Observations on African and European strains of
Arthroderma benhamiae. lnt.J.Dermatol . , ll:94-1 01 .
Takashio, M . , 1 977. The Trichophyton mentagrophytes complex. The
D ermatophytes . In lwata, K. (ed . ) , Recent Advances i n
Medical and Veterinary Mycology, Proceedings of the Sixth
Congress of the International Society for Human and Animal
Mycology, University of Tokyo, Tokyo, pp.271 -276.

274
Takashio, M. , 1 979. Taxonomy of dermatophytes based on their sexual states. Mycologia, 11:968-976.
Takashio, M . , 1 98 1 . Production , maintenance and uti l isation of teste r strains by sexual cross ings of dermatophytes: apropos of Nannizzia otae: In : Vanbreuseghem, R. and De Vroey, C. , Sexuality and Pathogenicity of Fungi. Masson, N .Y. pp. 69-82.
Takashio, M. and De Vroey, C., 1 976. Reproduction sexuee de certains d e rmatophytes s u r m i l i e u a base de grai nes de n iger (Guizotia abyssinica). Buii.Soc. Fr.Mycoi.Med., §:1 4 1 - 1 44.
Takiuchi , 1 . , Higuchi , D . , Sei , Y. and Koga, M . , 1 982. I so lation of an e x t race l l u l a r p rot e i n as e f ro m Microspo ru m can is. Sabouraudia, 20:281 -288.
Takiuchi , 1 . , Sei, Y. , Takagi, H. and Negi, M. , 1 984. Partial
c haracteri satio n of t h e e xt race l l u la r ke rat i n ase f ro m
Microsporum canis. Sabouraudia, 22:21 9-224.
Tal , M . , S i lberstei n , A. and N usser E l izabeth , 1 985. Why does commassie bri l l iant blue T i nteract differently with different
proteins? J.Bioi .Chem., 260(1 8):9976-9980.
Tanaka, S . , Summerbell , R.C. , Tsuboi , R. , Kaaman, T. , Sohn le , P.G. ,
Matsu m ot o , T . a n d R ay , T . C . , 1 9 9 2 . A d v a n ce s i n
d ermatophytes and dermatophytosis. J .Med. Vet. Myco l . ,
30(suppl. 1 ):29-39.
Tate, P . , 1 929. On the enzymes of certain dermatophytes or ringworm
fungi. Parasitology, 21 :31 -54.
Tibayrenc, M. , Kjellberg, F. , Arnaud, J. Oury, B. , Breniere , S .F. , Darde, M-L. and Ayala, F.J . , 1 991 . Are eukaryotic microorganisms
c l o na l o r s e x u a l ? A p o pu lat i o n g e ne t i cs v antag e .
Proc.Nati.Acad.Sci .USA., 88:51 29-51 33.

275
Tucker, W.D.L. and Noble, W.C . , 1 990. The value of electrophoretic prote i n patterns fo r t h e study of Microsporum canis. J.Med.Vet.Mycol. , 28:1 1 7-1 23.
Tzeng, S. , McKerrow, J.H. , Fukuyama, K. , Jeong Kathleen and Epstein, W. , 1 983. Degradation of purified skin keratin by proteinase
secreted from Schistosoma mansoni cercariae. J.Parasitol. , 69(5):992-994.
Unkeless, J.C., Dano, K. , Kellerman, G. and Reich, E., 1 974. Fibrinolysis associated with oncogenic transformation: partial purification and characterisat ion of the ce l l factor - a p lasminogen activator. J.Bioi.Chem., 249:4295- 4305.
Uscavage, J.P. and Kral, F., 1 961 . Microsporum canis: isolation from the
air. J.Small Animal Pract. , !:279-280.
Usunov, P.Y. , 1 966. Detection of soil dermatophytes and other moulds by the float technique. Proc. lnt.Dermatoi.Symp., 1 0 :51 -53.
Utz , J .P . , 1 981 . The importance of mycoses in human medicine. In :
Vanbreuseghem, R. and De Vroey C. (eds. ) , Sexuality and Pathogenicity of Fungi. Proceedings of the Third I nternational
Colloquium on Medical Mycology. Masson, N. V. , pp.5-1 3.
Vallejos, C.E., 1 983. Enzyme activity staining. In: Tanksley, S.D. & Orton, T.J . , l sozymes in P lant Genetics and Breedi ng, Part A.
Elsevier Science Publishers B. V., Amsterdam. pp.469-51 6.
Vanbreuseghem, R. , 1 949 . La culture des dermatophytes in vitro sur
chevaux isoh�s. Ann.Parasit.Hum.Comp., 24:559-573.
Vanbreuseghem, R., 1 950. Contribution a l'etude des dermatophytes du
Congo Beige : Le Sabouraudites (Microsporum) langeroni
nov.sp . . Ann.Parasit.Hum.Comp., 25:509-51 7.

276
Vanbreuseg hem, R. , 1 951 . Sur un nouveau dermatophyte i sole au Congo Beige: Sabouraudites rivalieri nov.sp . . Arch.Derm.Syphi i. ,Z:1 09-1 1 3.
Vanbreuseg hem, R. , 1 952a. Keratin digestion by dermatophytes: a specific diagnostic method. Mycologia, 44: 176-1 82.
Vanbreuseghem, R., 1 952b. Technique biologique pour l'isolement des
dermatophytes du sol . Annls Soc. Beige Med Trop.,32:1 73-1 n.
Vanbreuse g h e m , R . , 1 963a. Derm ato mycose s : faut- i l d i sti n g u e r Microspo rum langeroni et Microsporum audouini? . Buii.Soc.Fr.Syphil. , 70 :34-37.
Vanbreuseghem, R. , 1 963b. Dermatophytes from the Republic of the Congo and Ruanda-Burundi. New description of Microsporum
rivalieri. Sabouraudia, 2 :21 5-224.
Vanbreuseghem, R. , 1 977. Classification moderne des dermatophytes. Dermatologica, 1 55:1 -6.
Vanbreuseghem, R., De Vroey, C. and Takashio, M., 1 970. Production of
macroconid ia by Microsporum ferrugineum Ota, 1 922.
Sabouraudia, Z:252-256.
Vanbreuseghem, R. and Larsh , H.W., 1 977. Conclusions to the round
table on the global problems due to fungi. In: Proceedings of
the 6th Congress of the International Society for Human and
Animal Mycology, Tokyo. Recent Advances in Medical and
Veterinary Mycology. U niv. of Tokyo Press, Tokyo. pp.253-
. 255.
Vanbreuseghem, R., De Vroey, C. and Takashio, M., 1 978. A Practical
Guide to Medical and Veterinary Mycology. Masson.

277
Vanbreuseghem, R. and Takashio, M., 1 981 . The groups of Arthroderma benhamiae var. erinacei. I n : Vanbreuseghem, R. and De
Vroey C. (eds. ) , Sexual ity and Pathogen icity of Fung i . Proceedings of the Third International Colloquium on Medical Mycology. Masson, N.Y., pp.1 1 8-1 27.
Verhagen, A.R., 1 974. Distribution of dermatophytes causing tinea capitis
in Africa. Trop. Geogr.Med. , 26:1 02-1 09.(1 .2.91 )
Vil leneuve, N. , Grandtner, M.M. and Fortin , J.A., 1 989. Frequency and diversity of ectomycorrhizal and saprophytic macrofungi i n laurentide mountain o f Quebec. Can.J.Bot. , 67:261 6-2629.
Waldorf, A. R., 1 986. Host-parasite relationship in opportunistic mycoses. CRC Crit.Rev.Microbiol. , 1 3(2):1 33-1 72.
Waiter Hans-Eimar, 1 984. Method with haemoglobin, casein and azocoll as substrata. In : Bergmeyer H.U. (editor in chief), Bergmeyer
JOrgen and Gra�i Marianne (eds . ) , Methods of Enzymatic Analysis : Enzymes 3 : Peptidases, P rotei nases and the i r Inhibitors. Verlag Chemie, Florida. p.270-277.
Watanabe, S. and Hironga, M. , 1 981 . Differences or similarities of the
clinical lesions produced by "+" and "-" types members of the
"mentagrophytes" complex in Japan. I n : Vanbreuseghem, R.
and De Vroey C. (eds.), Sexuality and Pathogenicity of Fungi. Proceedings of the Third International Colloquium on Medical
Mycology. Masson, N .Y., pp.83-96.
Weary, P.E. , Canby, C.M. and Cawley, E.P., 1 965. Keratinolytic activity
o f Microsporum can is a n d Microsporum gypseum.
J. lnvest.Dermatol., 44:300-31 0.
Weary , P . E . , Can by , C. M . , 1 96 9 . Fu rt h e r o bserv at i on s o n the
Kerat i n o lyt ic act iv ity of Trichophyton schoenleini and
Trichophyton rubrum. J. lnvest.Dermatol. , 53(1 ):58-63.

278
Weber, Klaus, Pringle, J . R. and Osborn Mary, 1 972. Measurement of
molecular weights by electrophoresis on SDS-acrylamide gel. I n : H i rs, C . H .W. and Masheff , S . N . (eds. ) , Methods i n Enzymology, XXVI :3-27.
Weitzman l rene, 1 964a. Variation in Microsporum gypseum I. a genetic
study of pleomorphism. Sabouraudia, 3(3): 1 95-204.
Weitzman l rene, 1 964b. I ncompatibil ity i n the Microsporum gypseum
complex. Mycologia, 56:425-435.
Wietzman lrene and Si lva-Hutner Margarita, 1 967a. Non-keratinous agar media as substrates fo r the ascigerous state i n certain members of the Gymnoascaceae pathogenic for man and
animals. Sabouraudia, .§:335-340.
Weitzman l re ne , Si lva- H utne r Margarita and Kozma, 1 . , 1 967b. A comparison of the pathogenicity of th ree members of the Microsporum gypseum complex. Sabouraudia, .§:360-365.
Weitzman l rene, Gordon, M.A. and Rosenthal, S.A., 1 971 . Determinaton of the perfect state , mating type and e lastase activity i n c l i n ica l i so l at e s o f Microsporum gypseum comp lex . J . lnvest.Dermatol . , 57:278-282.
Weitzman l rene and Padhye, A.A., 1 978. Mating behaviour of Nannizzia
otae (Microsporum canis). Mycopathologia, 64:1 7-22.
Weitzman l rene, McGinnis, M.R. , Padhye, A.A. and Ajello, L. , 1 986. The
g e n u s Arthroderma and its late r synonym Nannizzia.
Mycotaxon, 25(2):505-51 8.
Werb , Z. , Banda, M.J . , Mckerrow, J . H . and Sandhaus, R.A. , 1 982. E lastases and e l ast in degradation . J . l nvest . De rmato l . ,
79 :1 54s-1 59s.
Wilk inson, L . , 1 989. SYSTAT: The system for statistics. Systat Inc.,
Evanston, IL, U .S.A.

279
Wi lso n , W.J . , P l u n kett , O .A . and G regersen , A . , 1 954. Nodu lar g ra n u l o m at o u s per i fo l l i cu l i t i s of the legs caused by
Trichophyton rubrum. Arch.Dermatol. , 69 :258-277.
Wilson, W.J. and Plunkett, O.A., 1 974. The Fungous Diseases of Man. Berkeley and Los Angeles. University of California.
Wood, E.J. and Bladon, P.T., 1 985. The Human Skin. Edward Arnold.
Woodgyer, A.J. , 1 977. Asymptomatic carriage of dermatophytes by cats.
N .Z.Vet.J. , 25:67-68.
Woodgyer, A., 1 993. Trichophyton tonsurans infections in New Zealand.
Mycoses Newsletter (CDCNZ). Apri l, �:1 -1 5.
Wright, S . , 1 951 . Genetical structure of populations. Ann. E ugen ics, .1.§:323-354.
Wright , S . , 1 978. Evolution and the genetics of popu lat ions. Vol .4.
Variability within and among natural populations. University of
Chicago Press, Chicago, IL.
Vamamoto, I . and Kagawa, S., 1 986. Isolation of Microsporum canis from
the carrier state by hai rbrush method. Jpn.J . Med. Mycol . ,
27:27-28.
Vu, R.J., Harmon , S.R. and Blank, F. � 1 968. Isolation and purification of
exocel lu lar kerat inase o f Trichophyton mentagrophytes .
. J.Bacteriol., 96(4):1 435-1 436.
Vu, R.J., Harmon , S.R., Wachter, P.E. and Blank, F., 1 969. Amino acid composition and specificity of a keratinase of Trichophyton
mentagrophytes. Arch.Biochem.Biophys., 1 35:363-370.
Vu, R.J. , Harmon, S.R., Grappel Sarah, F. and Blank, F., 1 971 . Two cell bou n d kerat i n as e s of Trichophyton mentagrophytes.
J.lnvest.Dermatol., 56(1 ):27-32.