Copyright 2007, Paradigm Publishing Inc. EXCEL 2007 Chapter 4 BACKNEXTEND 4-1 LINKS TO OBJECTIVES...
37
Copyright 2007, Paradigm Publishing Inc. EXCEL 2007 Chapter 4 BACK NEXT END 4-1 LINKS TO OBJECTIVES • Summarizing with Range names and 3-D formulas • Modify range names • Formulas with links • The Consolidate Feature • Create, edit, & format a PivotTable • Create & format a PivotChart • Format a chart’s x-, y-, or z- axis • Modify or remove chart gridlines • Add a trendline to Microsoft Excel 2007 – Level 2 SUMMARIZING AND CONSOLIDATING DATA
-
Upload
arlene-adams -
Category
Documents
-
view
214 -
download
0
Transcript of Copyright 2007, Paradigm Publishing Inc. EXCEL 2007 Chapter 4 BACKNEXTEND 4-1 LINKS TO OBJECTIVES...

Copyright 2007, Paradigm Publishing Inc.
EXCEL 2007Chapter 4
BACK NEXT END
4-1
LINKS TO OBJECTIVES• Summarizing with
Range names and 3-D formulas
• Modify range names
• Formulas with links
• The Consolidate Feature
• Create, edit, & format a PivotTable
• Create & format a PivotChart
• Format a chart’sx-, y-, or z- axis
• Modify or remove chart gridlines
• Add a trendline to a chart
• Features Summary
Microsoft Excel 2007 – Level 2
SUMMARIZING AND CONSOLIDATING DATA

Copyright 2007, Paradigm Publishing Inc.
EXCEL 2007Chapter 4
BACK NEXT END
4-2
LINKS TO OBJECTIVES• Summarizing with
Range names and 3-D formulas
• Modify range names
• Formulas with links
• The Consolidate Feature
• Create, edit, & format a PivotTable
• Create & format a PivotChart
• Format a chart’sx-, y-, or z- axis
• Modify or remove chart gridlines
• Add a trendline to a chart
• Features Summary
Performance ObjectivesPerformance Objectives
• Summarize data by creating formulas with range names that reference other worksheets
• Modify the range assigned to a range name• Summarize data by creating 3-D formulas• Create formulas that link to cells in other
workbooks• Edit a link to a source workbook• Break a link to an external reference• Use the Consolidate feature to summarize data in
multiple worksheets• Create, edit, and format a PivotTable• Create and format a PivotChart• Format the x-, y-, or z-axis in a chart• Modify or remove chart gridlines• Add a trendline to a chart to forecast future values• Modify trendline options
Copyright 2007, Paradigm Publishing Inc.
EXCEL 2007Chapter 4
BACK NEXT END
4-3
LINKS TO OBJECTIVES• Summarizing with
Range names and 3-D formulas
• Modify range names
• Formulas with links
• The Consolidate Feature
• Create, edit, & format a PivotTable
• Create & format a PivotChart
• Format a chart’sx-, y-, or z- axis
• Modify or remove chart gridlines
• Add a trendline to a chart
• Features Summary
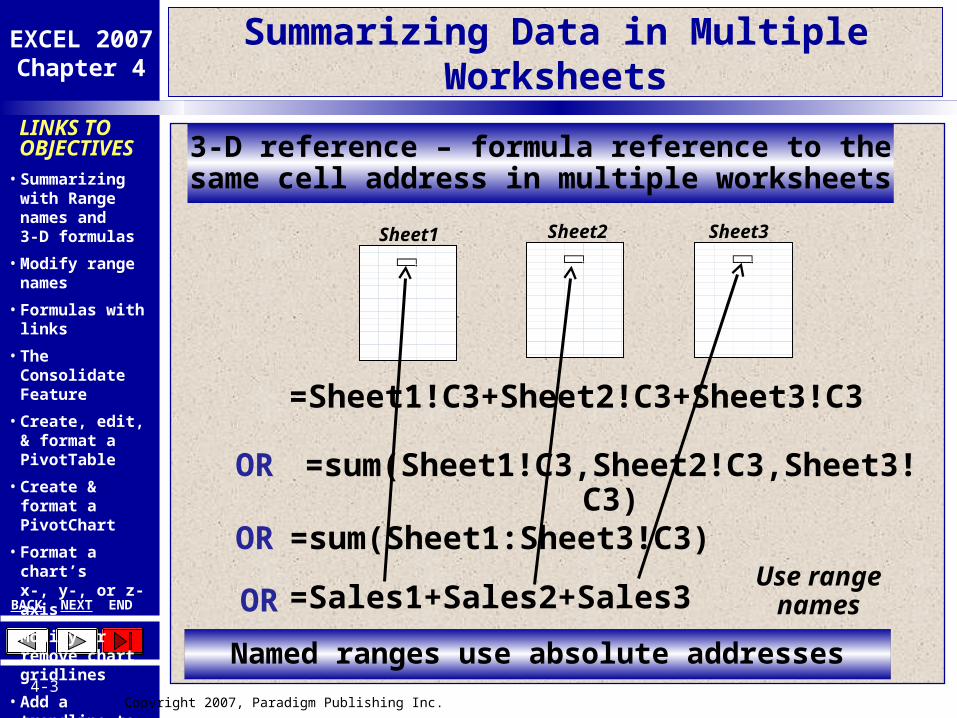
Summarizing Data in Multiple Worksheets
Sheet1 Sheet2 Sheet3
3-D reference – formula reference to the same cell address in multiple worksheets
=Sheet1!C3+Sheet2!C3+Sheet3!C3
=sum(Sheet1:Sheet3!C3)
ORUse range
names=Sales1+Sales2+Sales3
=sum(Sheet1!C3,Sheet2!C3,Sheet3!C3)
OR
OR
Named ranges use absolute addresses

Copyright 2007, Paradigm Publishing Inc.
EXCEL 2007Chapter 4
BACK NEXT END
4-4
LINKS TO OBJECTIVES• Summarizing with
Range names and 3-D formulas
• Modify range names
• Formulas with links
• The Consolidate Feature
• Create, edit, & format a PivotTable
• Create & format a PivotChart
• Format a chart’sx-, y-, or z- axis
• Modify or remove chart gridlines
• Add a trendline to a chart
• Features Summary
Naming a RangeNaming a Range
Select the cell or range of cellsto be named
Click the Name box,type the name, and press Enter
ORClick
Type name and
Click OK
Copyright 2007, Paradigm Publishing Inc.
EXCEL 2007Chapter 4
BACK NEXT END
4-5
LINKS TO OBJECTIVES• Summarizing with
Range names and 3-D formulas
• Modify range names
• Formulas with links
• The Consolidate Feature
• Create, edit, & format a PivotTable
• Create & format a PivotChart
• Format a chart’sx-, y-, or z- axis
• Modify or remove chart gridlines
• Add a trendline to a chart
• Features Summary
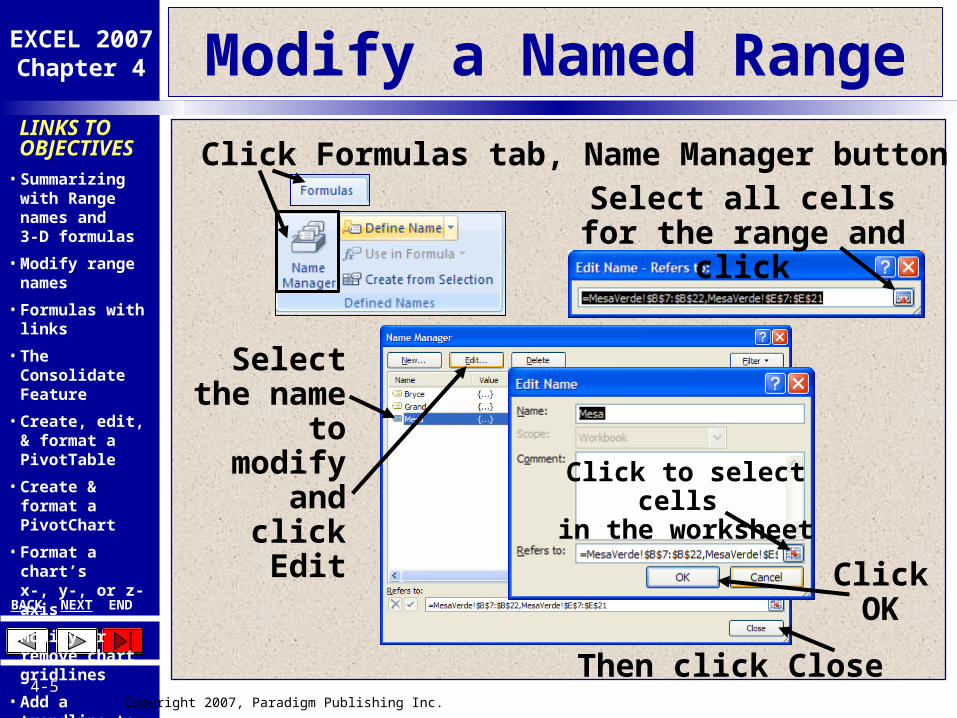
Modify a Named Range
Click Formulas tab, Name Manager button
Select the
name to modify
and click Edit
Click to select cells in the worksheet
Select all cells for the range and
click
Click OK
Then click Close

Copyright 2007, Paradigm Publishing Inc.
EXCEL 2007Chapter 4
BACK NEXT END
4-6
LINKS TO OBJECTIVES• Summarizing with
Range names and 3-D formulas
• Modify range names
• Formulas with links
• The Consolidate Feature
• Create, edit, & format a PivotTable
• Create & format a PivotChart
• Format a chart’sx-, y-, or z- axis
• Modify or remove chart gridlines
• Add a trendline to a chart
• Features Summary
Totaling Named RangesTotaling Named RangesTo analyze data in multiple
worksheetsusing named ranges
Step 1: Make cell active where function will appear
Step 2: Type =SUM(Bryce,Grand,Mesa) and press Enter
Sum of ranges forall three sheets

Copyright 2007, Paradigm Publishing Inc.
EXCEL 2007Chapter 4
BACK NEXT END
4-7
LINKS TO OBJECTIVES• Summarizing with
Range names and 3-D formulas
• Modify range names
• Formulas with links
• The Consolidate Feature
• Create, edit, & format a PivotTable
• Create & format a PivotChart
• Format a chart’sx-, y-, or z- axis
• Modify or remove chart gridlines
• Add a trendline to a chart
• Features Summary
Data Linked to Other WorkbooksData Linked to Other Workbooks
1. Open both workbooks2. Arrange windows panes to see both
3. Click in formula cell and type =
4. Click desired cell in the other workbook
='[GroupSalesbyPark-May.xlsx]AttendanceSummary'!$F$7
Workbook namein brackets
Worksheet namefollowed by !
Cell orrange
5. Press the Enter key

Copyright 2007, Paradigm Publishing Inc.
EXCEL 2007Chapter 4
BACK NEXT END
4-8
LINKS TO OBJECTIVES• Summarizing with
Range names and 3-D formulas
• Modify range names
• Formulas with links
• The Consolidate Feature
• Create, edit, & format a PivotTable
• Create & format a PivotChart
• Format a chart’sx-, y-, or z- axis
• Modify or remove chart gridlines
• Add a trendline to a chart
• Features Summary
Maintaining External References
External References include drive and folder paths to the source workbook;
moving the source workbook breaks the link
Appears when opening a workbook with external references
Click to enable content or change default
Click
OR
Select and change as desired
Copyright 2007, Paradigm Publishing Inc.
EXCEL 2007Chapter 4
BACK NEXT END
4-9
LINKS TO OBJECTIVES• Summarizing with
Range names and 3-D formulas
• Modify range names
• Formulas with links
• The Consolidate Feature
• Create, edit, & format a PivotTable
• Create & format a PivotChart
• Format a chart’sx-, y-, or z- axis
• Modify or remove chart gridlines
• Add a trendline to a chart
• Features Summary
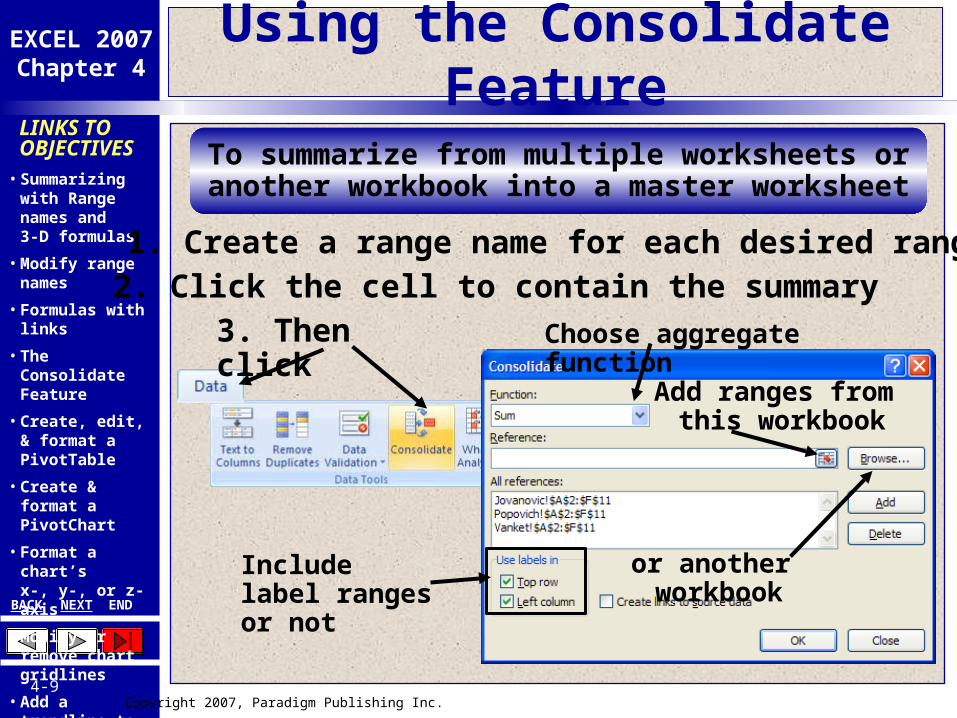
Using the Consolidate Feature
To summarize from multiple worksheets or another workbook into a master worksheet
3. Then click
1. Create a range name for each desired range 2. Click the cell to contain the summary
Choose aggregate function
Add ranges from this workbook
or another workbook
Include label ranges or not

Copyright 2007, Paradigm Publishing Inc.
EXCEL 2007Chapter 4
BACK NEXT END
4-10
LINKS TO OBJECTIVES• Summarizing with
Range names and 3-D formulas
• Modify range names
• Formulas with links
• The Consolidate Feature
• Create, edit, & format a PivotTable
• Create & format a PivotChart
• Format a chart’sx-, y-, or z- axis
• Modify or remove chart gridlines
• Add a trendline to a chart
• Features Summary
Creating a PivotTable Report
A PivotTable is an interactive table that organizes
and summarizes data
Click
First row of data must have unique column headings;
rows or columns may NOT be blank

Copyright 2007, Paradigm Publishing Inc.
EXCEL 2007Chapter 4
BACK NEXT END
4-11
LINKS TO OBJECTIVES• Summarizing with
Range names and 3-D formulas
• Modify range names
• Formulas with links
• The Consolidate Feature
• Create, edit, & format a PivotTable
• Create & format a PivotChart
• Format a chart’sx-, y-, or z- axis
• Modify or remove chart gridlines
• Add a trendline to a chart
• Features Summary
Creating a PivotTable Report../2
Noticerepeate
ddatain
columns
List of data for PivotTable

Copyright 2007, Paradigm Publishing Inc.
EXCEL 2007Chapter 4
BACK NEXT END
4-12
LINKS TO OBJECTIVES• Summarizing with
Range names and 3-D formulas
• Modify range names
• Formulas with links
• The Consolidate Feature
• Create, edit, & format a PivotTable
• Create & format a PivotChart
• Format a chart’sx-, y-, or z- axis
• Modify or remove chart gridlines
• Add a trendline to a chart
• Features Summary
Creating a PivotTable Report../3
Select a range in this workbook or another workbook
Choose where the
PivotTable Report should
be placed Click OK

Copyright 2007, Paradigm Publishing Inc.
EXCEL 2007Chapter 4
BACK NEXT END
4-13
LINKS TO OBJECTIVES• Summarizing with
Range names and 3-D formulas
• Modify range names
• Formulas with links
• The Consolidate Feature
• Create, edit, & format a PivotTable
• Create & format a PivotChart
• Format a chart’sx-, y-, or z- axis
• Modify or remove chart gridlines
• Add a trendline to a chart
• Features Summary
Creating a PivotTable Report../4
Insert tab, PivotTable
Check or drag-drop into
appropriatearea

Copyright 2007, Paradigm Publishing Inc.
EXCEL 2007Chapter 4
BACK NEXT END
4-14
LINKS TO OBJECTIVES• Summarizing with
Range names and 3-D formulas
• Modify range names
• Formulas with links
• The Consolidate Feature
• Create, edit, & format a PivotTable
• Create & format a PivotChart
• Format a chart’sx-, y-, or z- axis
• Modify or remove chart gridlines
• Add a trendline to a chart
• Features Summary
Filter by clicking arrows
Can change aggregate function
Can format as desired, print unfiltered / filtered view
Creating a PivotTable Report../5

Copyright 2007, Paradigm Publishing Inc.
EXCEL 2007Chapter 4
BACK NEXT END
4-15
LINKS TO OBJECTIVES• Summarizing with
Range names and 3-D formulas
• Modify range names
• Formulas with links
• The Consolidate Feature
• Create, edit, & format a PivotTable
• Create & format a PivotChart
• Format a chart’sx-, y-, or z- axis
• Modify or remove chart gridlines
• Add a trendline to a chart
• Features Summary
Creating a PivotTable Report../6
Click then click
OR
Click down arrow
Changing the aggregate function

Copyright 2007, Paradigm Publishing Inc.
EXCEL 2007Chapter 4
BACK NEXT END
4-16
LINKS TO OBJECTIVES• Summarizing with
Range names and 3-D formulas
• Modify range names
• Formulas with links
• The Consolidate Feature
• Create, edit, & format a PivotTable
• Create & format a PivotChart
• Format a chart’sx-, y-, or z- axis
• Modify or remove chart gridlines
• Add a trendline to a chart
• Features Summary
Creating a PivotChart
To display PivotTable data in a chart
--from an existing PivotTable--
--from scratch--
Click in the PivotTable,then click
Click in the list of data,
then click thePivotTable down
arrowand click PivotChart
Excel displays the Insert Chart dialog box
Excel displays a blank chart with the PivotTable Field list pane

Copyright 2007, Paradigm Publishing Inc.
EXCEL 2007Chapter 4
BACK NEXT END
4-17
LINKS TO OBJECTIVES• Summarizing with
Range names and 3-D formulas
• Modify range names
• Formulas with links
• The Consolidate Feature
• Create, edit, & format a PivotTable
• Create & format a PivotChart
• Format a chart’sx-, y-, or z- axis
• Modify or remove chart gridlines
• Add a trendline to a chart
• Features Summary
Creating a PivotChart ../2
--existing PivotTable--
Click in the PivotTable,then click
Filter by
clicking
arrows
Copyright 2007, Paradigm Publishing Inc.
EXCEL 2007Chapter 4
BACK NEXT END
4-18
LINKS TO OBJECTIVES• Summarizing with
Range names and 3-D formulas
• Modify range names
• Formulas with links
• The Consolidate Feature
• Create, edit, & format a PivotTable
• Create & format a PivotChart
• Format a chart’sx-, y-, or z- axis
• Modify or remove chart gridlines
• Add a trendline to a chart
• Features Summary
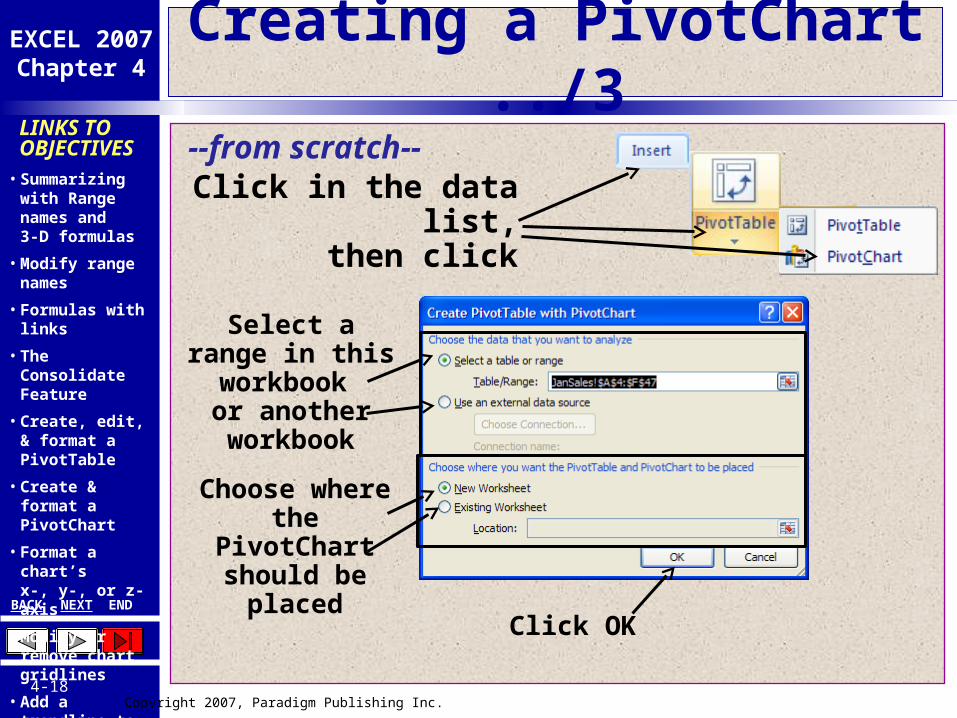
Creating a PivotChart ../3
--from scratch--Click in the data
list,then click
Select a range in this workbook or another workbook
Choose where the
PivotChart should be
placedClick OK

Copyright 2007, Paradigm Publishing Inc.
EXCEL 2007Chapter 4
BACK NEXT END
4-19
LINKS TO OBJECTIVES• Summarizing with
Range names and 3-D formulas
• Modify range names
• Formulas with links
• The Consolidate Feature
• Create, edit, & format a PivotTable
• Create & format a PivotChart
• Format a chart’sx-, y-, or z- axis
• Modify or remove chart gridlines
• Add a trendline to a chart
• Features Summary
Creating a PivotChart ../4
--from scratch--
PivotTable created with PivotTable Field List
Filter by
clicking
arrows

Copyright 2007, Paradigm Publishing Inc.
EXCEL 2007Chapter 4
BACK NEXT END
4-20
LINKS TO OBJECTIVES• Summarizing with
Range names and 3-D formulas
• Modify range names
• Formulas with links
• The Consolidate Feature
• Create, edit, & format a PivotTable
• Create & format a PivotChart
• Format a chart’sx-, y-, or z- axis
• Modify or remove chart gridlines
• Add a trendline to a chart
• Features Summary
Format Chart Axes
Two-dimensional chart
Three-dimensional chart
Can add or delete chart elements, change scaling, gridlines, fonts,
color, size of labels, etc.

Copyright 2007, Paradigm Publishing Inc.
EXCEL 2007Chapter 4
BACK NEXT END
4-21
LINKS TO OBJECTIVES• Summarizing with
Range names and 3-D formulas
• Modify range names
• Formulas with links
• The Consolidate Feature
• Create, edit, & format a PivotTable
• Create & format a PivotChart
• Format a chart’sx-, y-, or z- axis
• Modify or remove chart gridlines
• Add a trendline to a chart
• Features Summary
Format Chart Axes …/2
Right-click
vertical (value)
axisThen click
Format Axis…
Customize minimum, maximum values on y-axis
Set theseto affect the
values on the y-axis

Copyright 2007, Paradigm Publishing Inc.
EXCEL 2007Chapter 4
BACK NEXT END
4-22
LINKS TO OBJECTIVES• Summarizing with
Range names and 3-D formulas
• Modify range names
• Formulas with links
• The Consolidate Feature
• Create, edit, & format a PivotTable
• Create & format a PivotChart
• Format a chart’sx-, y-, or z- axis
• Modify or remove chart gridlines
• Add a trendline to a chart
• Features Summary
Format Chart Axes …/3
Click on the chart, then click
Choose
Customize the display of gridlines
Choose

Copyright 2007, Paradigm Publishing Inc.
EXCEL 2007Chapter 4
BACK NEXT END
4-23
LINKS TO OBJECTIVES• Summarizing with
Range names and 3-D formulas
• Modify range names
• Formulas with links
• The Consolidate Feature
• Create, edit, & format a PivotTable
• Create & format a PivotChart
• Format a chart’sx-, y-, or z- axis
• Modify or remove chart gridlines
• Add a trendline to a chart
• Features Summary
Add a Trendline to a ChartUse to illustrate the direction or
trend that the data is presenting in the
chartTrend / Regression Type Description
Exponential Curved line to display values that are increasing or decreasing at higher rates
Linear For values that increase / decrease at a steady rate(best-fit-straight line)
Logarithmic For values that increase / decrease quickly and level out (best-fit curved line)
Polynomial For values that fluctuate (curved line)
Power For values that increase / decrease at a specific rate(curved line)
Moving Average For values with fluctuations smoothed out to show a pattern (curved line)

Copyright 2007, Paradigm Publishing Inc.
EXCEL 2007Chapter 4
BACK NEXT END
4-24
LINKS TO OBJECTIVES• Summarizing with
Range names and 3-D formulas
• Modify range names
• Formulas with links
• The Consolidate Feature
• Create, edit, & format a PivotTable
• Create & format a PivotChart
• Format a chart’sx-, y-, or z- axis
• Modify or remove chart gridlines
• Add a trendline to a chart
• Features Summary
Add a Trendline to a Chart../2
Trendlines cannot be added to 3-D, stacked chart subtypes, doughnut, pie, radar, or surface
charts
Click on a data series, then click
Choose desired options and click
Close

Copyright 2007, Paradigm Publishing Inc.
EXCEL 2007Chapter 4
BACK NEXT END
4-25
LINKS TO OBJECTIVES• Summarizing with
Range names and 3-D formulas
• Modify range names
• Formulas with links
• The Consolidate Feature
• Create, edit, & format a PivotTable
• Create & format a PivotChart
• Format a chart’sx-, y-, or z- axis
• Modify or remove chart gridlines
• Add a trendline to a chart
• Features Summary
Add a Trendline to a Chart../3
Choose desired options and click
Close
To change its properties,Right-click a trendline and choose Format Trendline…

Copyright 2007, Paradigm Publishing Inc.
EXCEL 2007Chapter 4
BACK NEXT END
4-26
LINKS TO OBJECTIVES• Summarizing with
Range names and 3-D formulas
• Modify range names
• Formulas with links
• The Consolidate Feature
• Create, edit, & format a PivotTable
• Create & format a PivotChart
• Format a chart’sx-, y-, or z- axis
• Modify or remove chart gridlines
• Add a trendline to a chart
• Features Summary
How do you name a range?
Features Summary
Select the range to be named, then
Click the Name box,type the name, and press Enter

Copyright 2007, Paradigm Publishing Inc.
EXCEL 2007Chapter 4
BACK NEXT END
4-27
LINKS TO OBJECTIVES• Summarizing with
Range names and 3-D formulas
• Modify range names
• Formulas with links
• The Consolidate Feature
• Create, edit, & format a PivotTable
• Create & format a PivotChart
• Format a chart’sx-, y-, or z- axis
• Modify or remove chart gridlines
• Add a trendline to a chart
• Features Summary
How do you modify a range name?
Features Summary
Click Formulas tab, Name Manager button
Select the
name to modify
and click Edit

Copyright 2007, Paradigm Publishing Inc.
EXCEL 2007Chapter 4
BACK NEXT END
4-28
LINKS TO OBJECTIVES• Summarizing with
Range names and 3-D formulas
• Modify range names
• Formulas with links
• The Consolidate Feature
• Create, edit, & format a PivotTable
• Create & format a PivotChart
• Format a chart’sx-, y-, or z- axis
• Modify or remove chart gridlines
• Add a trendline to a chart
• Features Summary
What is a 3-D reference?
A reference to the same cell in a range that
extends over multiple worksheets
Features Summary

Copyright 2007, Paradigm Publishing Inc.
EXCEL 2007Chapter 4
BACK NEXT END
4-29
LINKS TO OBJECTIVES• Summarizing with
Range names and 3-D formulas
• Modify range names
• Formulas with links
• The Consolidate Feature
• Create, edit, & format a PivotTable
• Create & format a PivotChart
• Format a chart’sx-, y-, or z- axis
• Modify or remove chart gridlines
• Add a trendline to a chart
• Features Summary
How do you enter a link to a cell in another worksheet?
Features Summary
1. Open both workbooks2. Arrange windows panes to see both
3. Click in formula cell and type =
4. Click desired cell in the other workbook5. Press the Enter key

Copyright 2007, Paradigm Publishing Inc.
EXCEL 2007Chapter 4
BACK NEXT END
4-30
LINKS TO OBJECTIVES• Summarizing with
Range names and 3-D formulas
• Modify range names
• Formulas with links
• The Consolidate Feature
• Create, edit, & format a PivotTable
• Create & format a PivotChart
• Format a chart’sx-, y-, or z- axis
• Modify or remove chart gridlines
• Add a trendline to a chart
• Features Summary
What must you do after moving a file that has been linked with an external reference?
Edit the linked reference
Features Summary
Click

Copyright 2007, Paradigm Publishing Inc.
EXCEL 2007Chapter 4
BACK NEXT END
4-31
LINKS TO OBJECTIVES• Summarizing with
Range names and 3-D formulas
• Modify range names
• Formulas with links
• The Consolidate Feature
• Create, edit, & format a PivotTable
• Create & format a PivotChart
• Format a chart’sx-, y-, or z- axis
• Modify or remove chart gridlines
• Add a trendline to a chart
• Features Summary
How must the data list be set up before you can create a PivotTable?
Features Summary
The first row must contain unique column headings,
There may be no blank rows or columns

Copyright 2007, Paradigm Publishing Inc.
EXCEL 2007Chapter 4
BACK NEXT END
4-32
LINKS TO OBJECTIVES• Summarizing with
Range names and 3-D formulas
• Modify range names
• Formulas with links
• The Consolidate Feature
• Create, edit, & format a PivotTable
• Create & format a PivotChart
• Format a chart’sx-, y-, or z- axis
• Modify or remove chart gridlines
• Add a trendline to a chart
• Features Summary
How do you add fields to a PivotTable?
Features Summary
Checkmark each field box in the PivotTable Field
List pane or
drag the name to the desired area

Copyright 2007, Paradigm Publishing Inc.
EXCEL 2007Chapter 4
BACK NEXT END
4-33
LINKS TO OBJECTIVES• Summarizing with
Range names and 3-D formulas
• Modify range names
• Formulas with links
• The Consolidate Feature
• Create, edit, & format a PivotTable
• Create & format a PivotChart
• Format a chart’sx-, y-, or z- axis
• Modify or remove chart gridlines
• Add a trendline to a chart
• Features Summary
How do you filter a PivotTable?
Features Summary
Filter by clicking arrows

Copyright 2007, Paradigm Publishing Inc.
EXCEL 2007Chapter 4
BACK NEXT END
4-34
LINKS TO OBJECTIVES• Summarizing with
Range names and 3-D formulas
• Modify range names
• Formulas with links
• The Consolidate Feature
• Create, edit, & format a PivotTable
• Create & format a PivotChart
• Format a chart’sx-, y-, or z- axis
• Modify or remove chart gridlines
• Add a trendline to a chart
• Features Summary
How do you filter a PivotChart?
Features Summary
Filter by
clicking
arrows

Copyright 2007, Paradigm Publishing Inc.
EXCEL 2007Chapter 4
BACK NEXT END
4-35
LINKS TO OBJECTIVES• Summarizing with
Range names and 3-D formulas
• Modify range names
• Formulas with links
• The Consolidate Feature
• Create, edit, & format a PivotTable
• Create & format a PivotChart
• Format a chart’sx-, y-, or z- axis
• Modify or remove chart gridlines
• Add a trendline to a chart
• Features Summary
How do you show gridlines in a chart?
Features Summary
Choose
Click on the chart, then click
Choose

Copyright 2007, Paradigm Publishing Inc.
EXCEL 2007Chapter 4
BACK NEXT END
4-36
LINKS TO OBJECTIVES• Summarizing with
Range names and 3-D formulas
• Modify range names
• Formulas with links
• The Consolidate Feature
• Create, edit, & format a PivotTable
• Create & format a PivotChart
• Format a chart’sx-, y-, or z- axis
• Modify or remove chart gridlines
• Add a trendline to a chart
• Features Summary
How do you add a trendline to a chart?
Features Summary
Click on a data series, then click
Then click desired option
Copyright 2007, Paradigm Publishing Inc.
EXCEL 2007Chapter 4
BACK NEXT END
4-37
LINKS TO OBJECTIVES• Summarizing with
Range names and 3-D formulas
• Modify range names
• Formulas with links
• The Consolidate Feature
• Create, edit, & format a PivotTable
• Create & format a PivotChart
• Format a chart’sx-, y-, or z- axis
• Modify or remove chart gridlines
• Add a trendline to a chart
• Features Summary
Coming Next
USING DATA ANALYSIS FEATURES