
Copy/Near Duplicate Detection - CVHCI · Content-based image and video analysis Copy/Near Duplicate...
82
Content-based image and video analysis Copy/Near Duplicate Detection Hazım Kemal Ekenel, [email protected] Rainer Stiefelhagen, [email protected] 05.07.2009
Transcript of Copy/Near Duplicate Detection - CVHCI · Content-based image and video analysis Copy/Near Duplicate...
Content-based image and video analysis
Copy/Near Duplicate Detection
Hazım Kemal Ekenel, [email protected]
Rainer Stiefelhagen, [email protected]
05.07.2009

2
What is a copy/near-duplicate?
Near-duplicate image:
An image is called a near-duplicate of a reference image
if it is “close”, according to some defined measure, to the
reference image.
Another definition:
An image that appears, to a human observer, to be
identical or very similar.
Near duplicate image cases:
• Being perceptually identical
• Being images of the same 3D scene
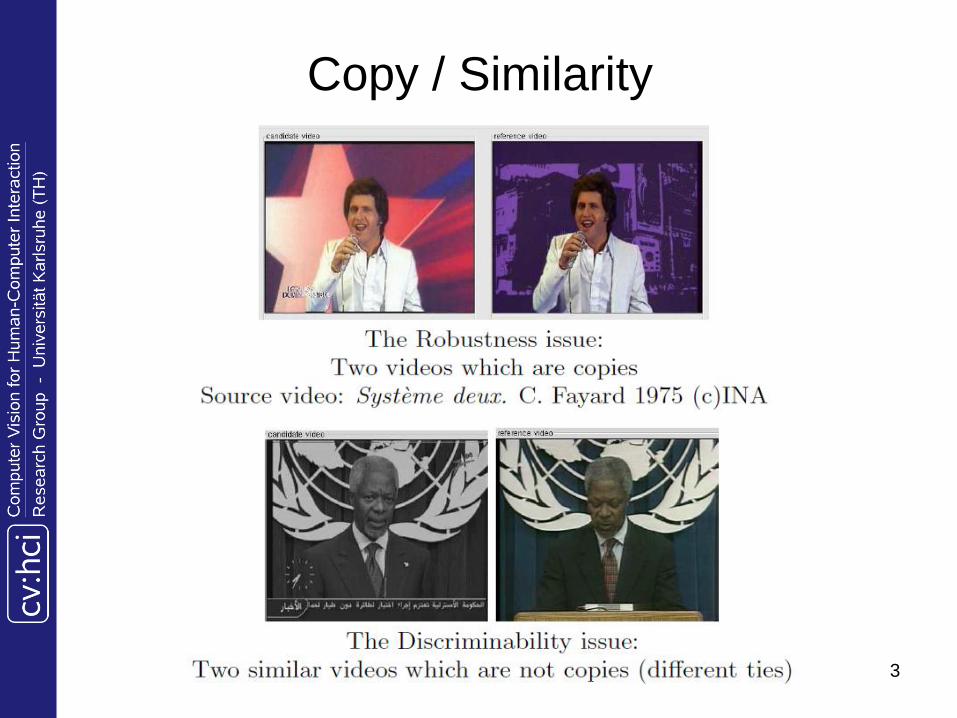
Copy / Similarity
3

4
Applications
Detection of copyright violations
Detection of doubles in large image databases
Reduction of required disk space
Grouping images in search results
Commercial tracking
Compression of video files
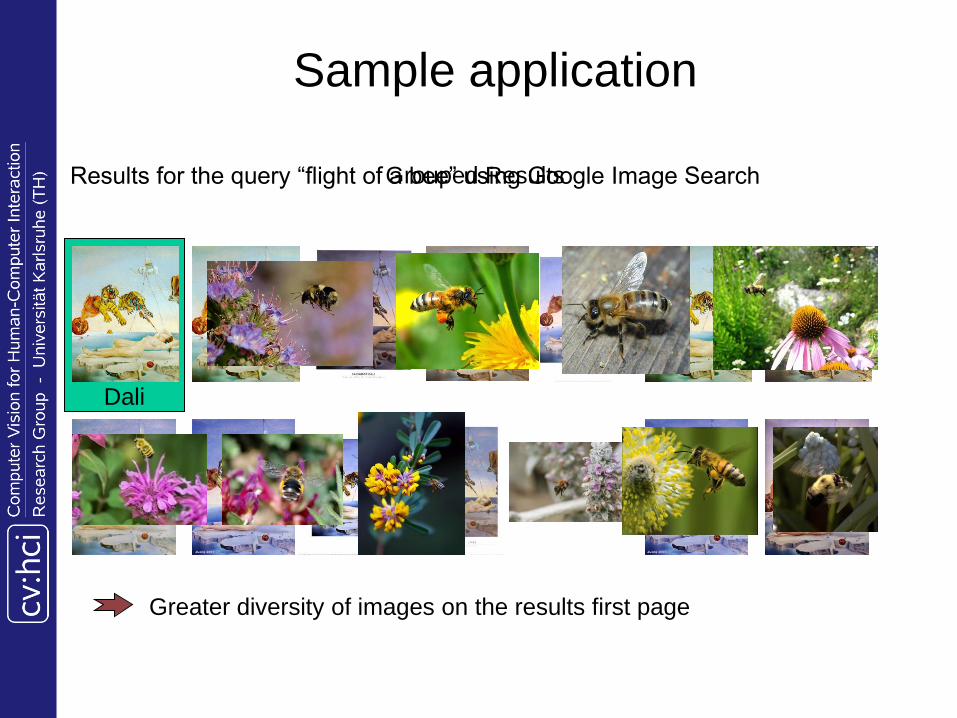
Sample application
Dali
Results for the query “flight of a bee” using Google Image SearchGrouped Results
Greater diversity of images on the results first page
Video Copy Detection: a Comparative Study
Julien Law-To, Li Chen, Alexis Joly, Ivan Laptev, Olivier Buisson,
Valerie Gouet-Brunet, Nozha Boujemaa, Fred Stentiford
Content-based image and video retrieval 6

Global Descriptors
Temporal
a(t): global temporal activity, I: image, N: number of
pixels for each image, K(i): weight function to
enhance the importance of the central pixels
A signature is computed around each maxima of the
temporal activity a(t)
Spectral analysis by FFT leads to a 16-dimensional
vector based on the phase of the activity.
Content-based image and video retrieval 7

Global Descriptors II
Ordinal Measurement
Partition the image into N blocks
Sort the blocks using their average gray level
Signature S(t) uses the rank ri of each block I
The distance D(t) is defined for computing the similarity
of two videos (a reference R and a candidate C) at a
time t where T is the length of the considered segment.
Content-based image and video retrieval 8

Global Descriptors III
Temporal Ordinal Measurement
Rank the regions along the time
Each frame is divided into K blocks, λk is the rank of the
region k in a temporal window with the length M.
The distance D between a query video Vq and a reference
video Vr at the time t is:
where,
p is the temporal shift tested and CM is a normalizing factor.
The best temporal shift p is selected.
Content-based image and video retrieval 9
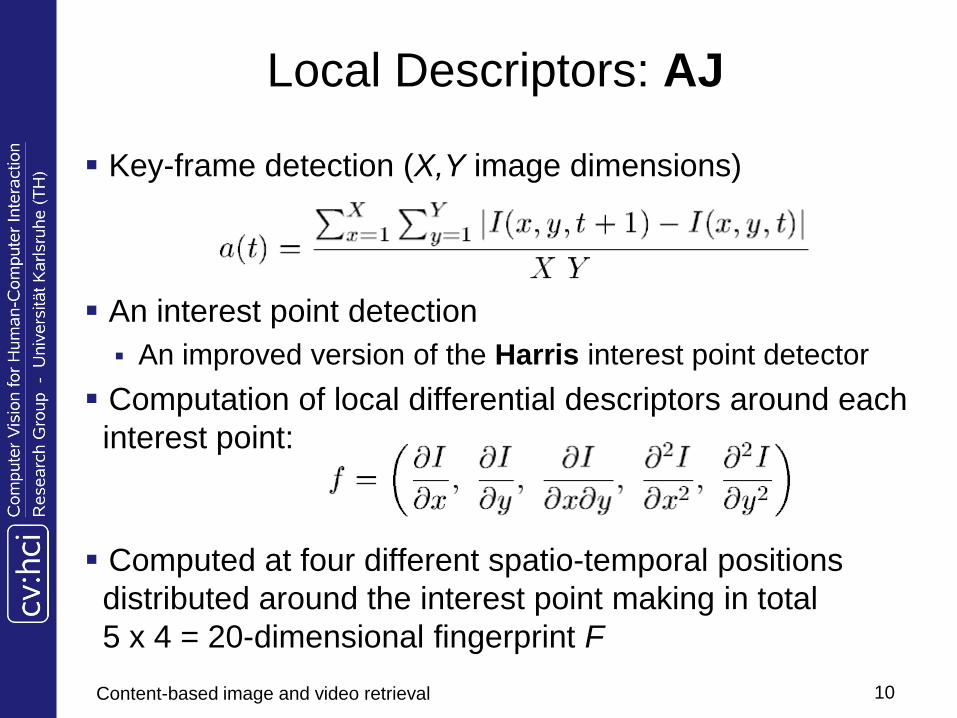
Local Descriptors: AJ
Key-frame detection (X,Y image dimensions)
An interest point detection
An improved version of the Harris interest point detector
Computation of local differential descriptors around each
interest point:
Computed at four different spatio-temporal positions
distributed around the interest point making in total
5 x 4 = 20-dimensional fingerprint F
Content-based image and video retrieval 10

Local Descriptors: ViCopT
Harris interest points are extracted on every frame.
Signal description similar to the one used in AJ is
computed.
The local differential descriptors are extracted at four
spatial positions around an interest point, leading to
20-dimensional signatures for each frame.
The interest points are associated from frame to
frame to build trajectories.
For each trajectory, the signal description is the
average of each component of the local description
A label is also assigned to local descriptions:
Background & Motion
Content-based image and video retrieval 11

Local Descriptors: STIP
STIP: Space Time Interest Points
STIP correspond to points where the image values
have significant local variation in both space and time
STIP points are described by the spatio-temporal third
order local jet leading to 34-dimensional vector.
Content-based image and video retrieval 12
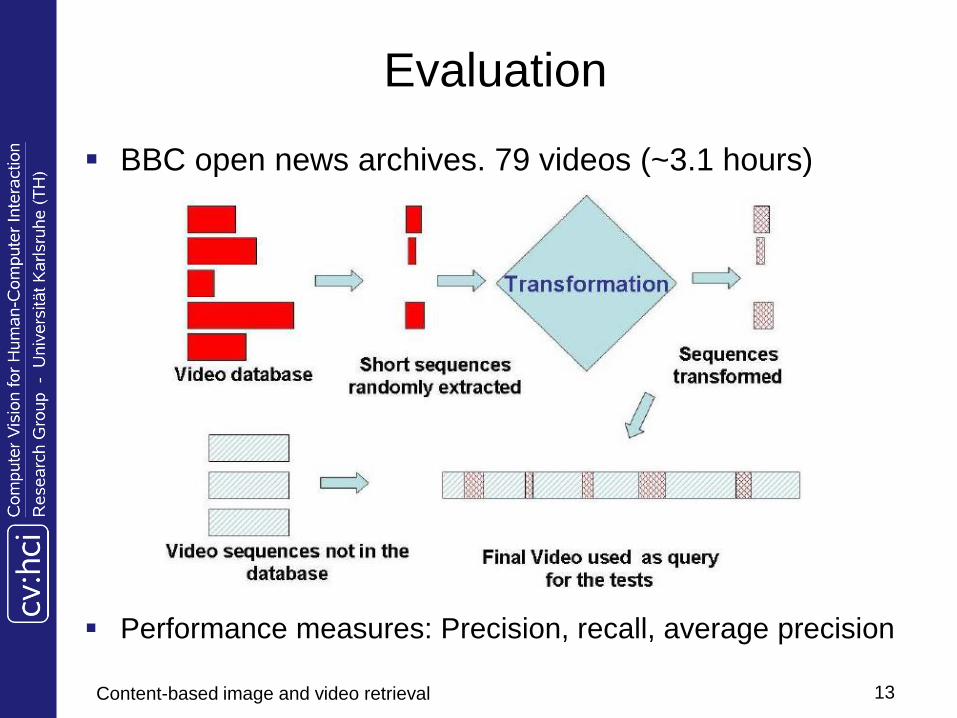
Evaluation
BBC open news archives. 79 videos (~3.1 hours)
Performance measures: Precision, recall, average precision
Content-based image and video retrieval 13

Single Transformations
Content-based image and video retrieval 14
Outcomes
For all transformations, Temporal Ordinal Measure
presents excellent results: all the segments have
been found with no false alarm
The Ordinal Measure presents poor results for
zooming, cropping and letter-box transformations
Local descriptors based on Harris points of interest
are not robust to a decrease of the contrast because
the value of the corners can become too low
Content-based image and video retrieval 15

Combined Transformations
Content-based image and video retrieval 16
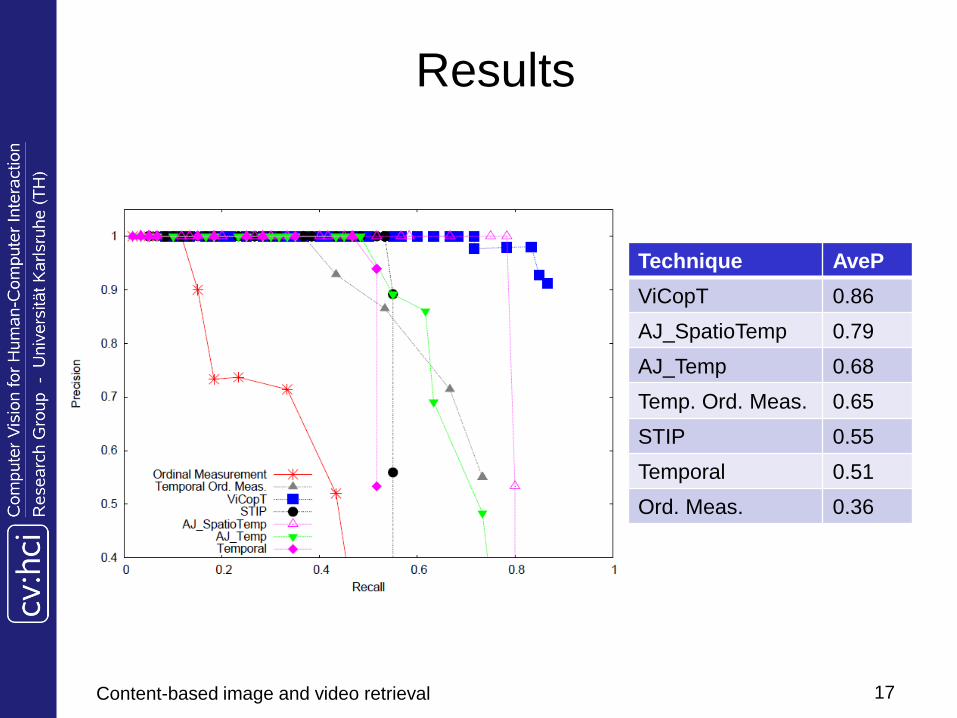
Results
Content-based image and video retrieval 17
Technique AveP
ViCopT 0.86
AJ_SpatioTemp 0.79
AJ_Temp 0.68
Temp. Ord. Meas. 0.65
STIP 0.55
Temporal 0.51
Ord. Meas. 0.36

Scalable Near Identical Image and Shot Detection
O. Chum, J. Philbin, M. Isard, A. Zisserman
Credit: Michael Weber
Content-based image and video retrieval 18
19
Tasks
Enumeration of duplicates in a corpus Given
Set of images
Query image
Wanted Corpus with all duplicate images
Identification of a duplicate image Given
Set of images
Query image
Wanted Pruned list from the top matches
20
Problems
Partial occlusion
Digitalization artifacts
Compression artifacts
Differing levels of compression
Mild photometric distortions
Image blur
21
Copy Duplicate Detection Methods
Color Histograms & LSH
Color Histograms
Locality Sensitive
Hashing
SIFT Features & Min Hash
SIFT Features
Min Hash
Requirements in large databases
Small amount of data stored for each image
Queries must be very fast
• Both presented methods achieve these requirements
22
Color Histograms & LSH
Color Histograms
Used for image representation
Extremely compressed feature vector
Stored information size per image is 384 bytes
Locality Sensitive Hashing
Used to find near duplicate histograms
Efficiently finds all points within a given radius with
high probability
Euclidean distance between feature vectors is used
as measure of similarity

23
Color Histograms I
Opponent color model
Simple to compute
3 channels I, O1 and O2
5.04/)2(
5.04/)2(
3/)(
2
1
BGRO
BGRO
BGRI

24
Color Histograms II
Spatial pyramid scheme
Jointly encodes global and local information
3 levels of data – every level has 128 bytes
The higher the level, the more local the data
I has double the amount of data as O1 and O2 because
more information is contained in the intensity information
Each bin is represented by a single byte
25
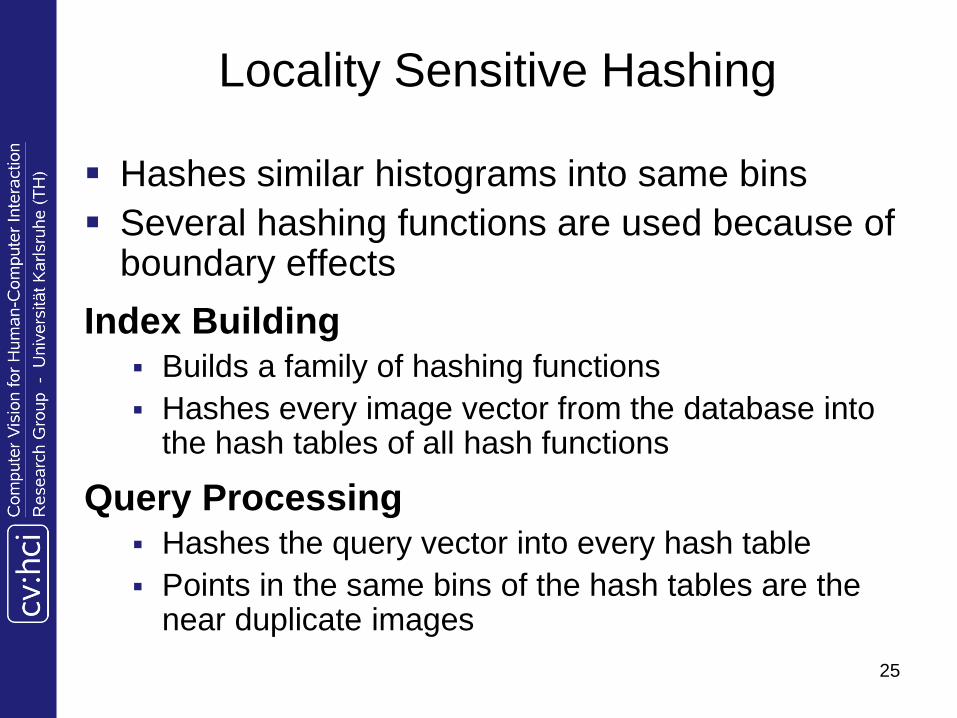
Locality Sensitive Hashing
Hashes similar histograms into same bins
Several hashing functions are used because of boundary effects
Index Building Builds a family of hashing functions
Hashes every image vector from the database into the hash tables of all hash functions
Query Processing Hashes the query vector into every hash table
Points in the same bins of the hash tables are the near duplicate images

26
Color Histograms & LSH Summary
Creates a p-dimensional vector v from the color
histogram
Each hashing function from locality sensitive
hashing generates an integer hash value from v
All images in the database have to be hashed
this way into the hash tables
For queries only the hash values have to be
calculated and searched in the hash tables

27
SIFT Features & Min Hash
Image description
SIFT features are used for image representation
Robust and insensitive to small local distortions
Visual words are used because Min Hash was
developed for text near duplicate detection
Min Hash
Used to find images whose similarity is above a given
threshold for a given query
Used in this method because the feature vectors do not
have to be as similar as in LSH
Finds similar images in constant time

28
SIFT Features
Scale Invariant Feature Transform (SIFT)
Transformation of image data into scale-invariant
coordinates relative to local features
Insensitive to small local geometric and photometric
image distortions
(a) Original image. (b) image with SIFT features
29
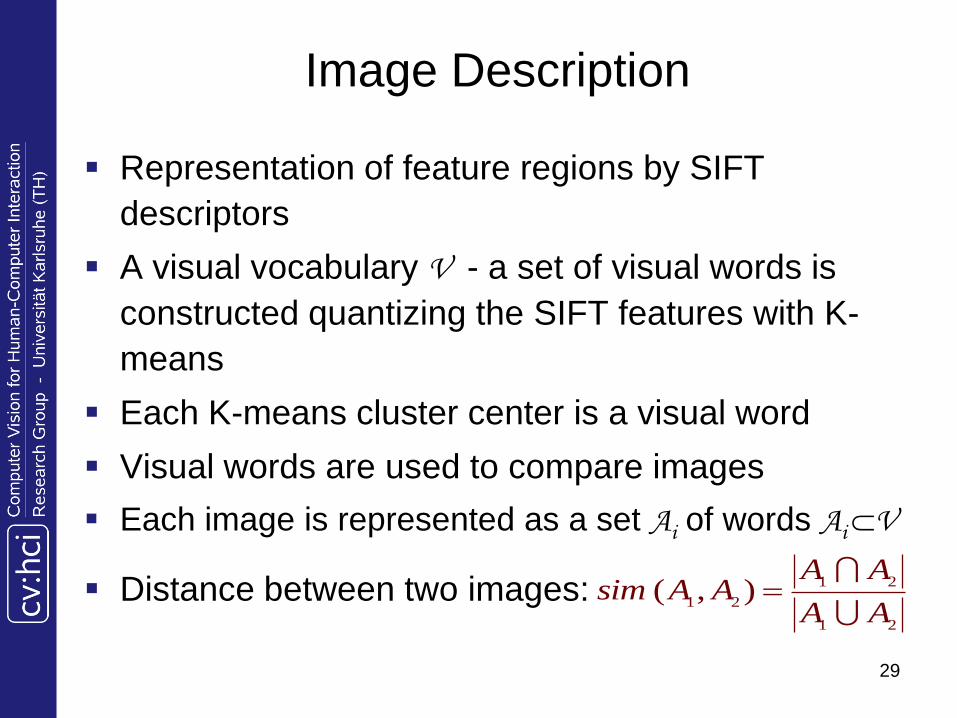
Image Description
Representation of feature regions by SIFT
descriptors
A visual vocabulary V - a set of visual words is
constructed quantizing the SIFT features with K-
means
Each K-means cluster center is a visual word
Visual words are used to compare images
Each image is represented as a set Ai of words Ai V
Distance between two images:21
21
21),(
AA
AAAAsim

30
Min Hash
Developed for text near duplicate detection
Works with visual words
Algorithm
Create random permutations
For each document Ai a min hash min (Ai) is recorded
Estimation of sim(A1,A2):
sim(A1,A2) = l/N
N is the number of independent permutations j
l is the number of how many times )()(21
AminAminjj

31
Min Hash Example
},,,,,{Vocabulary FEDCBAV
},,{and},,{},,,{setsThree FEADCBCBA
40:},,{with},,{
41:},,{with},,{
43:},,{with},,{
DCBFEA
FEACBA
DCBCBA
Estimated similarities

32
SIFT Features & Min Hash summary
Each feature region is represented by a SIFT descriptor
K-means quantizes the SIFT descriptors of features to sets of visual words
Min hash efficiently finds near duplicate images of a query image in the data set
Similarity is computed using a set overlap measure

33
Experiment I – data set
TRECVID 2006 database
165 hours (17.8M frames, 127
GB) MPEG-1 news footage from
different TV stations from all
over the world
For image detection taken
146,588 frames
Resolution is 352x240 pixels
Data is not labeled
Frames contain
Compression artifacts
Jitter
Noise

34
Experiment I
True similarity set
Images that match the similarity definition: Images whose histograms are within a given distance to the
reference histogram
Set of images whose similarity is above a threshold
Raw approximate similarity set
Images found by Using the reference histogram for LSH query
Having at least one matching tuple of visual words
Includes many false positives
Verified approximate similarity set
Filtered version of the raw approximate similarity set

35
Experiment I - results
Used parameters for verification
Histogram method
Distance < 200
Min hash method
Similarity > 35%
Random pairs
In 99.9% of cases
Histogram method
Distance > 500
Min hash method
Similarity < 5%
Similarity for the Min hash method
Similarity for the Histogram method
36
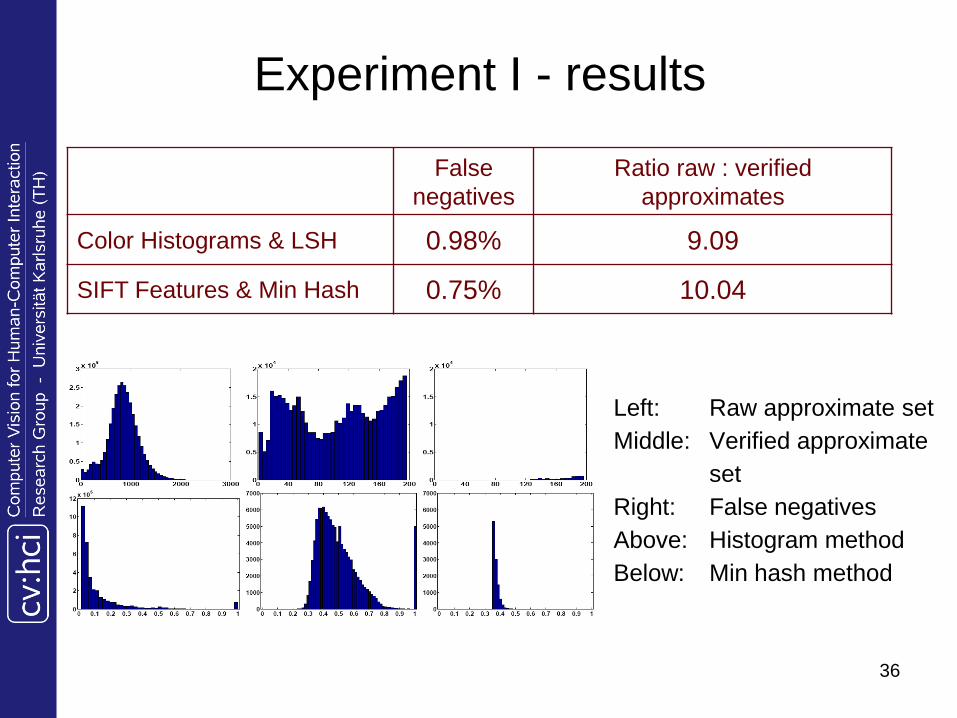
Experiment I - results
Left: Raw approximate set
Middle: Verified approximate
set
Right: False negatives
Above: Histogram method
Below: Min hash method
False
negatives
Ratio raw : verified
approximates
Color Histograms & LSH 0.98% 9.09
SIFT Features & Min Hash 0.75% 10.04

37
Experiment II
Several selected sets of 30-40 near duplicate
images from the TRECVID 2006 database
Results
No false positives found (manual verification)
No exact knowledge about false negatives, but
Each method has a small number of false
negatives compared with the other

38
Experiment II - results
Detected by both / Color Histograms & LSH only / SIFT Features & Min Hash only

39
Conclusions
Color Histograms & LSH
Sensitive to occlusion
Fairly insensitive to
Compression / digitalization artifacts
Noise
Image blur
SIFT Features & Min Hash
Tolerates occlusion that preserve a sufficiently high
percentage of visual words
Sensitive to all deformations, increasing or decreasing the
number of features like noise, Image blur and strong
artifacts
TRECVID 2008 Content-based
Copy Detection (CBCD)
A pilot task with synthetic queries
Audio handled in a separate condition
Task has both a detection and localization component
Detection measure based on error rates
Weighted trade-off of false alarms and misses
Content-based image and video retrieval 40

CBCD Task Overview
Goal:
Build a benchmark collection for video copy
detection methods
Task:
Given a set of reference video collection and a set
of 2000 queries,
determine for each query if it contains a copy of
video from the reference collection
and if so, from where in the reference collection
the copy comes
Three main task types were derived: Video-only,
audio-only, video + audio
Content-based image and video retrieval 41

Datasets and Queries
Dataset:
Reference video collection: TV2007 and TV2008 sound &
vision data (~200 hr)
Non-reference video collection : TV2007 BBC rushes data
Query types:
Type 1: composed of a reference video only. (1/3)
Type 2: composed of a reference video embedded in a
non-reference video. (1/3)
Type 3: composed of a non-reference video only. (1/3)
Number of queries:
201 total original queries were created
67 queries for each type
Content-based image and video retrieval 42

Datasets and Queries
After creating the queries, each was transformed:
10 video transformations
7 audio transformations
Yielding:
10 * 201 = 2010 video queries
7 * 201 = 1407 audio queries
10 * 7 * 201 = 14070 audio+video queries
Content-based image and video retrieval 43
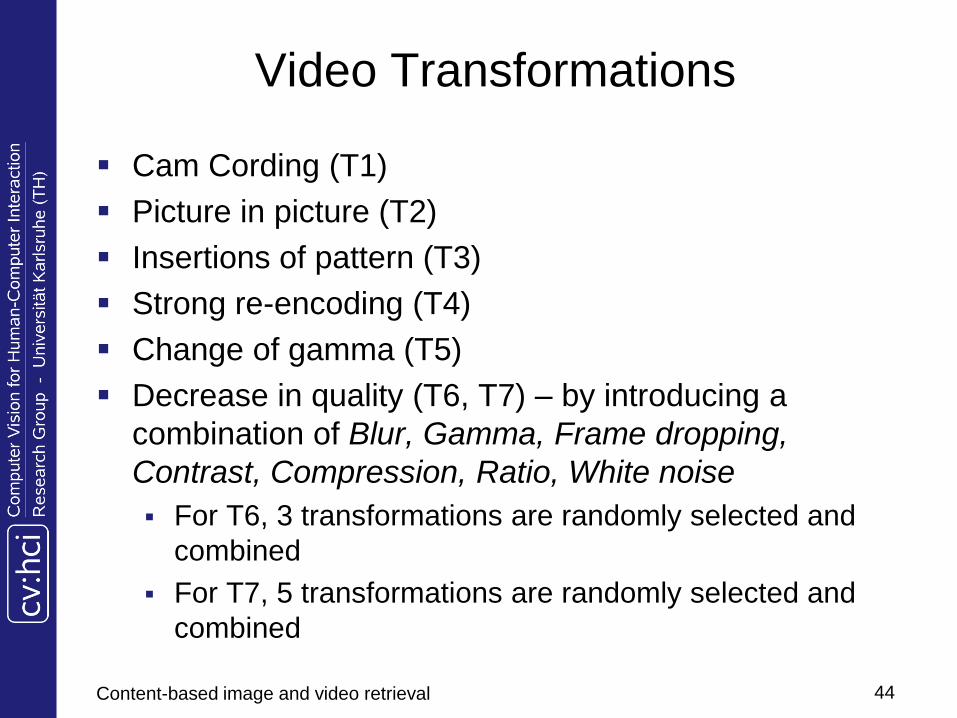
Video Transformations
Cam Cording (T1)
Picture in picture (T2)
Insertions of pattern (T3)
Strong re-encoding (T4)
Change of gamma (T5)
Decrease in quality (T6, T7) – by introducing a
combination of Blur, Gamma, Frame dropping,
Contrast, Compression, Ratio, White noise
For T6, 3 transformations are randomly selected and
combined
For T7, 5 transformations are randomly selected and
combined
Content-based image and video retrieval 44
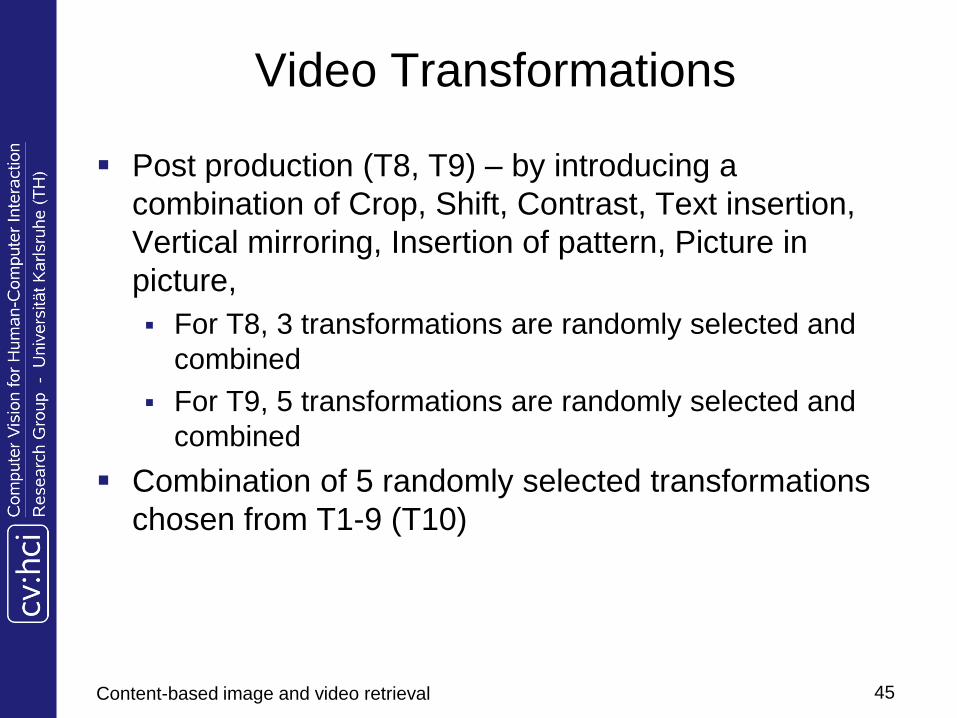
Video Transformations
Post production (T8, T9) – by introducing a
combination of Crop, Shift, Contrast, Text insertion,
Vertical mirroring, Insertion of pattern, Picture in
picture,
For T8, 3 transformations are randomly selected and
combined
For T9, 5 transformations are randomly selected and
combined
Combination of 5 randomly selected transformations
chosen from T1-9 (T10)
Content-based image and video retrieval 45

Video Transformations Examples
Content-based image and video retrieval 46
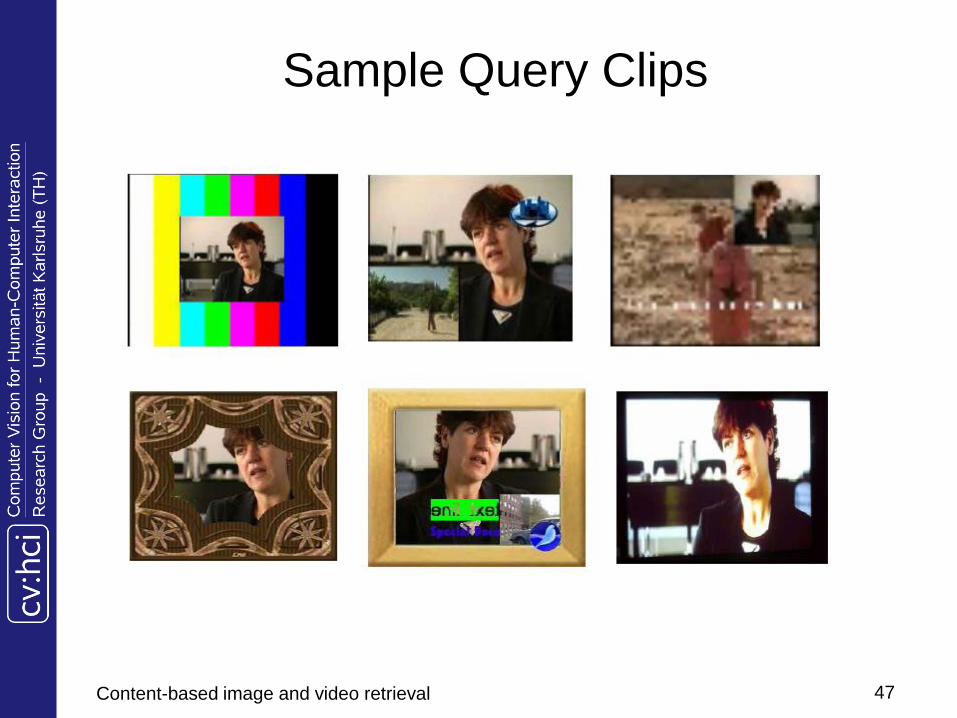
Sample Query Clips
Content-based image and video retrieval 47

Evaluation
22 participant teams
55 submitted runs (48 runs for video-only, 1 run for
audio-only and 6 runs for mixed).
Criterias:
How many queries they find the reference data or
correctly tell there is none to find
When a copy is detected, how accurately the run
locates the reference data in the test data
How much time is required for query processing
Content-based image and video retrieval 48
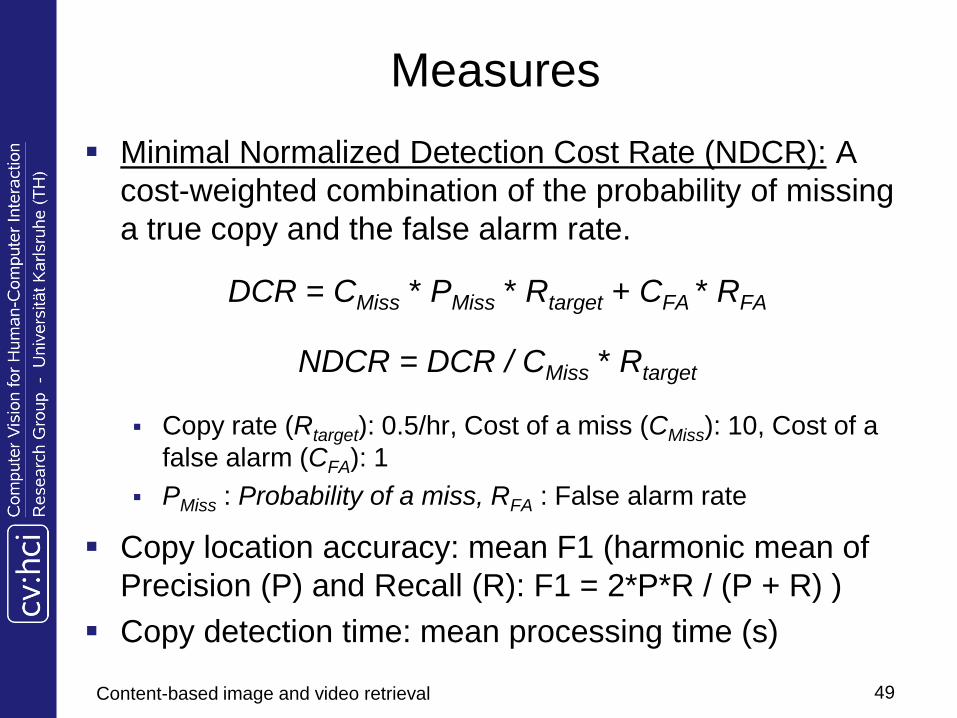
Measures
Minimal Normalized Detection Cost Rate (NDCR): A
cost-weighted combination of the probability of missing
a true copy and the false alarm rate.
DCR = CMiss * PMiss * Rtarget + CFA * RFA
NDCR = DCR / CMiss * Rtarget
Copy rate (Rtarget): 0.5/hr, Cost of a miss (CMiss): 10, Cost of a
false alarm (CFA): 1
PMiss : Probability of a miss, RFA : False alarm rate
Copy location accuracy: mean F1 (harmonic mean of
Precision (P) and Recall (R): F1 = 2*P*R / (P + R) )
Copy detection time: mean processing time (s)
Content-based image and video retrieval 49

Top 10 Min. NDCR Performance
Content-based image and video retrieval 50

Top 10 F1 Performance
Content-based image and video retrieval 51

Top 10 sites per transformation (Min. NDCR)
Content-based image and video retrieval 52

INRIA-LEAR’s Video Copy Detection System
Matthijs Douze, Adrien Gaidon, Herve Jegou,
Marcin Marszalek, Cordelia Schmid
Content-based image and video retrieval 53
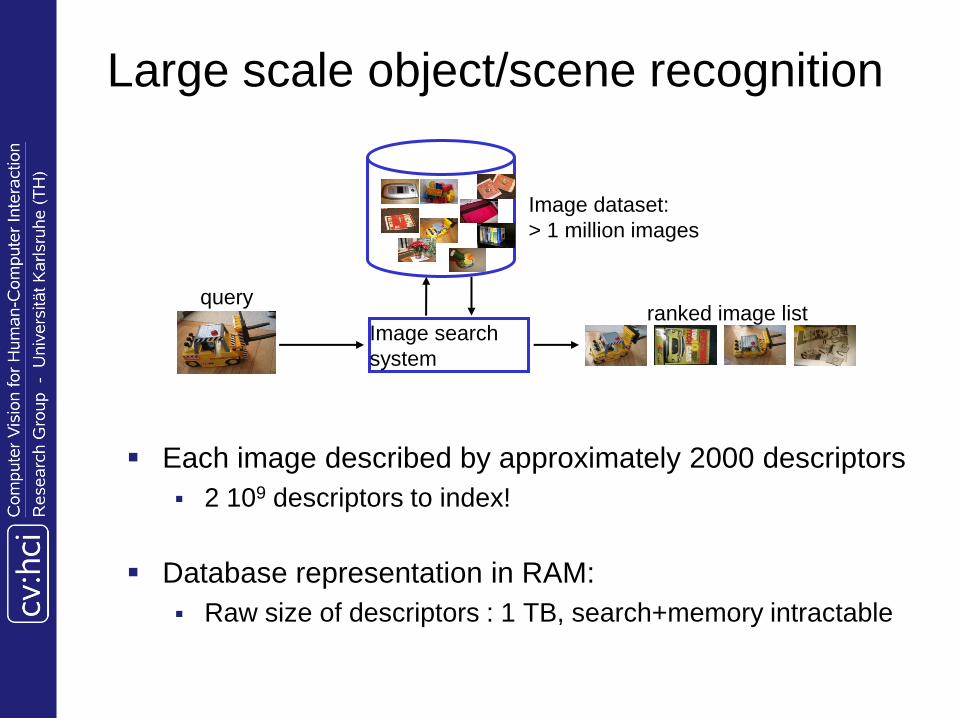
Large scale object/scene recognition
Each image described by approximately 2000 descriptors
2 109 descriptors to index!
Database representation in RAM:
Raw size of descriptors : 1 TB, search+memory intractable
Image search
system
ranked image list
Image dataset:
> 1 million images
query

State-of-the-art: Bag-of-words [Sivic & Zisserman’03]
Hessian-Affine
regions + SIFT descriptors
Bag-of-features
processing
+tf-idf weighting
querying
sparse frequency vector
centroids
(visual words)
Inverted
file
[Mikolajezyk & Schmid 04]
[Lowe 04]
ranked image
short-list
Set of SIFT
descriptors
Query
image
Geometric
verificationRe-ranked
list
[Lowe 04, Chum & al 2007]
“visual words”:
1 “word” (index) per local descriptor
only images ids in inverted file
=> 8 GB fits!
[Nister & al 04, Chum & al 07]

Two Main Contributions
Hamming Emdedding
Weak Geometry Consistency
Content-based image and video retrieval 56

Overview of INRIA-LEAR Copyright Detection System
Content-based image and video retrieval 57

Frame Extraction
Uniform subsampling:
A fixed number of frames per time unit is extracted (2.5 frames
per second). Used in STRICT and SOFT runs
Stable keyframes:
Only a few representative keyframes per shot is extracted (1
frame every 6 seconds on average)
In the preliminary experiments, it is observed that the stable
keyframe selection caused an insufficient number of frame
matches, therefore for the KEYSADVES run, an assymetric
sampling strategy is used:
Stable keyframes are extracted on the dataset side
The query frames are extracted using uniform subsampling
Content-based image and video retrieval 58

Feature Extraction
Content-based image and video retrieval 59
Compact descriptors:
Bag-of-features-like
representation

First Issue with Bag-of-Features
Representation
The intrinsic matching scheme performed by BOF is weak
for a “small” visual dictionary: too many false matches
for a “large” visual dictionary: many true matches are missed
No good trade-off between “small” and “large” !
either the cells are too big
or these cells can’t absorb the descriptor noise

20K visual word: false matches

200K visual word: good matches missed

Hamming Embedding
Representation of a descriptor x
Vector-quantized to q(x) as in standard BOF
+ short binary vector b(x) for an additional localization in the cell
Two descriptors x and y match iif
where h(a,b) is the Hamming distance, t is a threshold
q( x ) = q( y )
h ( b( x ) ; b( y ) ) < t
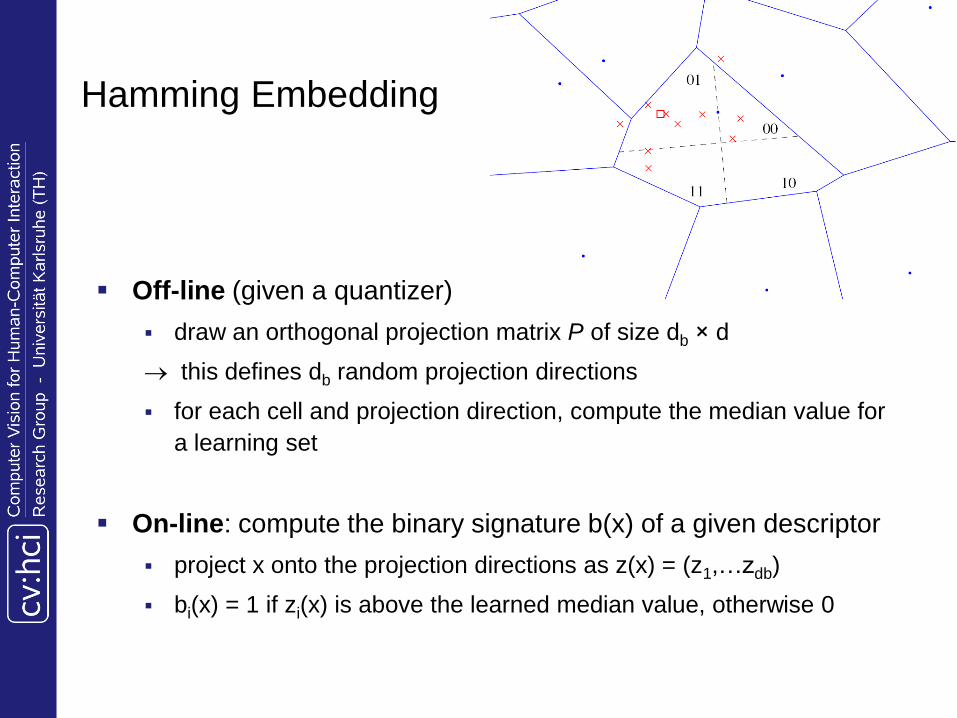
Hamming Embedding
Off-line (given a quantizer)
draw an orthogonal projection matrix P of size db × d
this defines db random projection directions
for each cell and projection direction, compute the median value for
a learning set
On-line: compute the binary signature b(x) of a given descriptor
project x onto the projection directions as z(x) = (z1,…zdb)
bi(x) = 1 if zi(x) is above the learned median value, otherwise 0

Hamming Embedding: Example
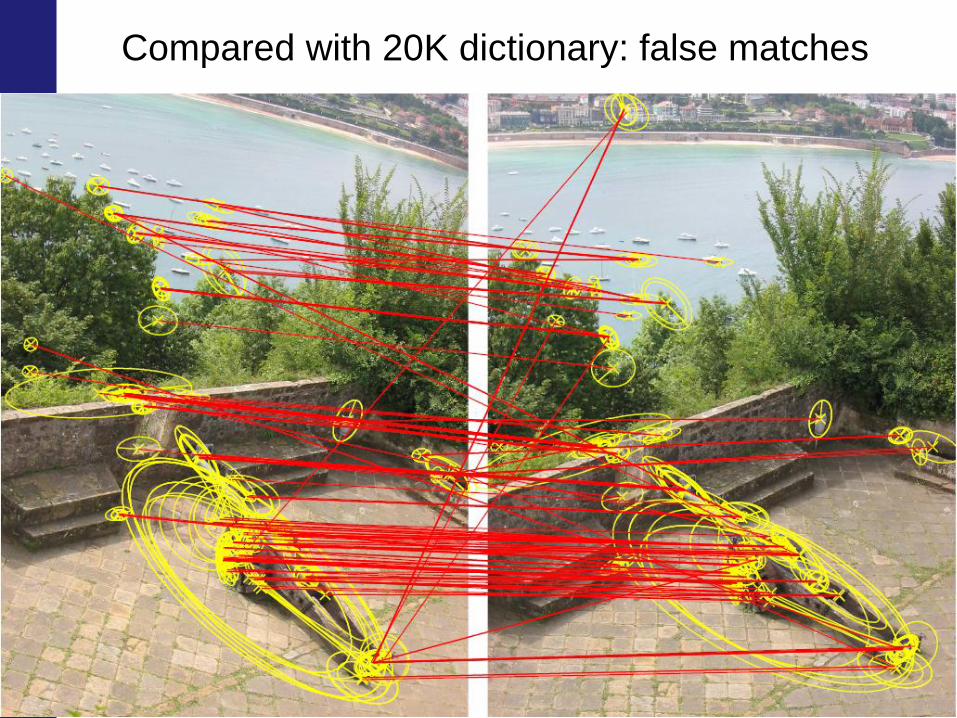
Compared with 20K dictionary: false matches

Hamming Embedding: Example

Compared with 200K visual word: good matches missed

Re-ranking based on full geometric verification
works very well
but performed on a short-list only (typically, 100 images)
for very large datasets, the number of distracting images is
so high that relevant images are not even short-listed!
Content-based image and video retrieval 69
Second Issue with Bag-of-Features
Representation

Weak Geometry Consistency
Weak geometric information used for all images (not only the
short-list)
Each invariant interest region detection has a scale and rotation
angle associated, here characteristic scale and dominant
gradient orientation
Scale change 2
Rotation angle ca. 20 degrees
Each matching pair results in a scale and angle difference
For the global image scale and rotation changes are roughly consistent

Max = rotation angle between images
WGC: Orientation consistency

WGC: Scale consistency

Weak Geometry Consistency
Integrate the geometric verification into the BOF
representation
Only matches that do agree with the main difference of
orientation and scale will be taken into account in the
final score
Re-ranking using full geometric transformation still adds
information in a final stage
Experimental results
Evaluation for the INRIA holidays dataset, 1491 images
500 query images + 991 annotated true positives
Most images are holiday photos of friends and family
1 million distractor images from Flickr
Dataset size 1. 001. 491 images
Vocabulary construction on a different Flickr set
Almost real-time search speed,
Evaluation metric: mean average precision (in [0,1], bigger
= better)
Average over precision/recall curve

Holiday dataset – example queries
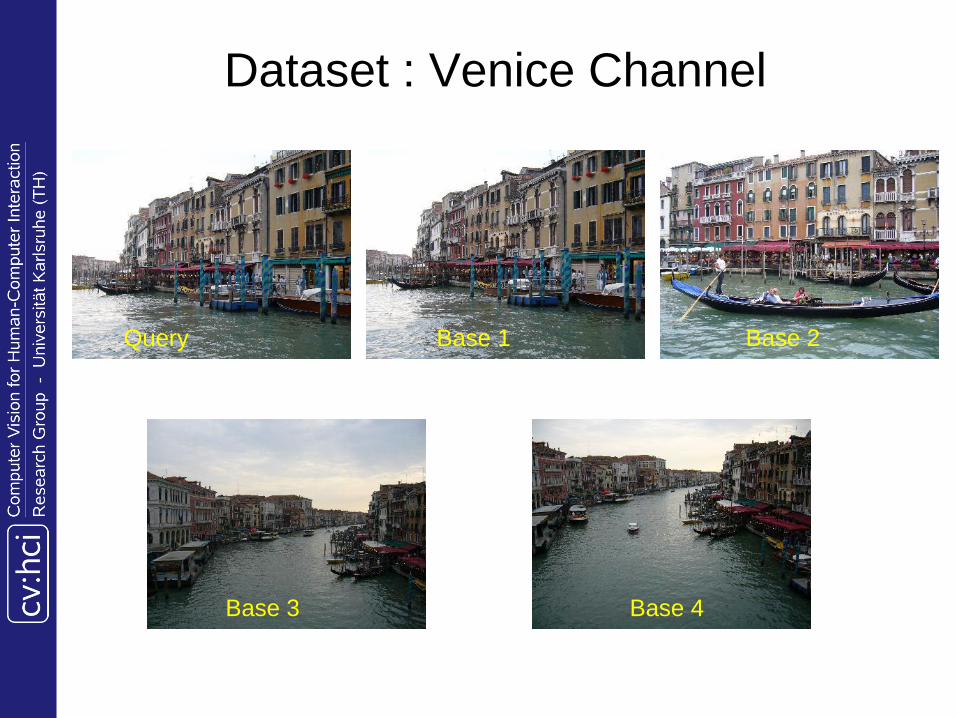
Dataset : Venice Channel
Query
Base 4Base 3
Base 2Base 1

Dataset : San Marco square
Query Base 1 Base 3Base 2
Base 9Base 8
Base 4 Base 5 Base 7Base 6
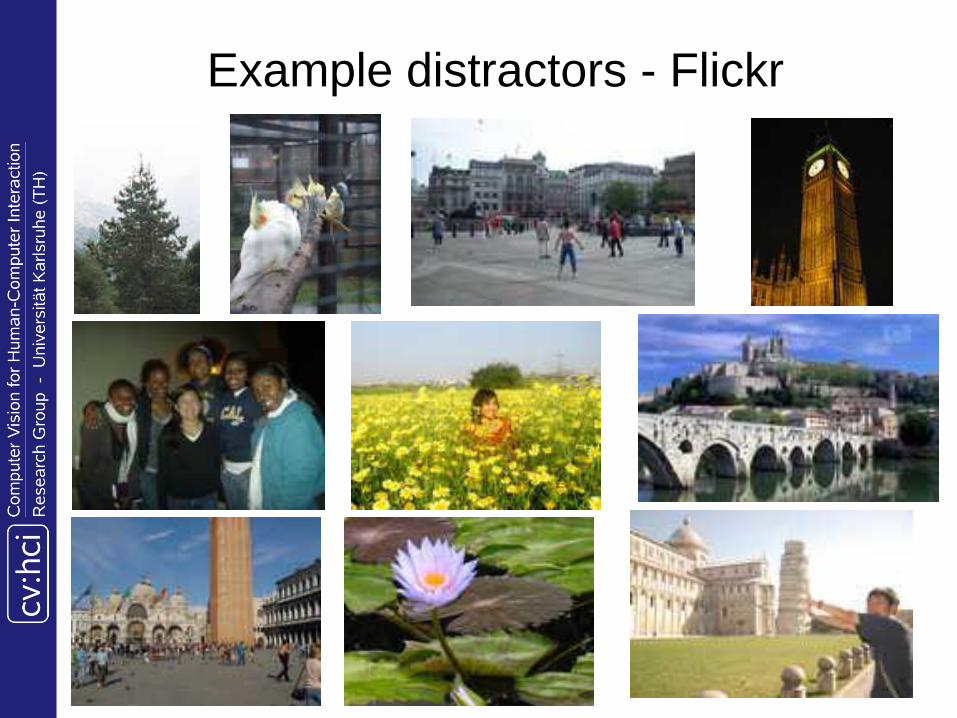
Example distractors - Flickr

Comparison with state-of-the-art
Evaluation on the holidays dataset, 500 query images, 1
million distracter images
Metric: mean average precision
Average query time (4 CPU
cores)
Compute descriptors 880 ms
Quantization 600 ms
Search – baseline 620 ms
Search – WGC 2110 ms
Search – HE 200 ms
Search – HE+WGC 650 ms
mA
P
0
0.1
0.2
0.3
0.4
0.5
0.6
0.7
0.8
0.9
1
1000000100000100001000
database size
baselineWGC
HEWGC+HE
+re-ranking
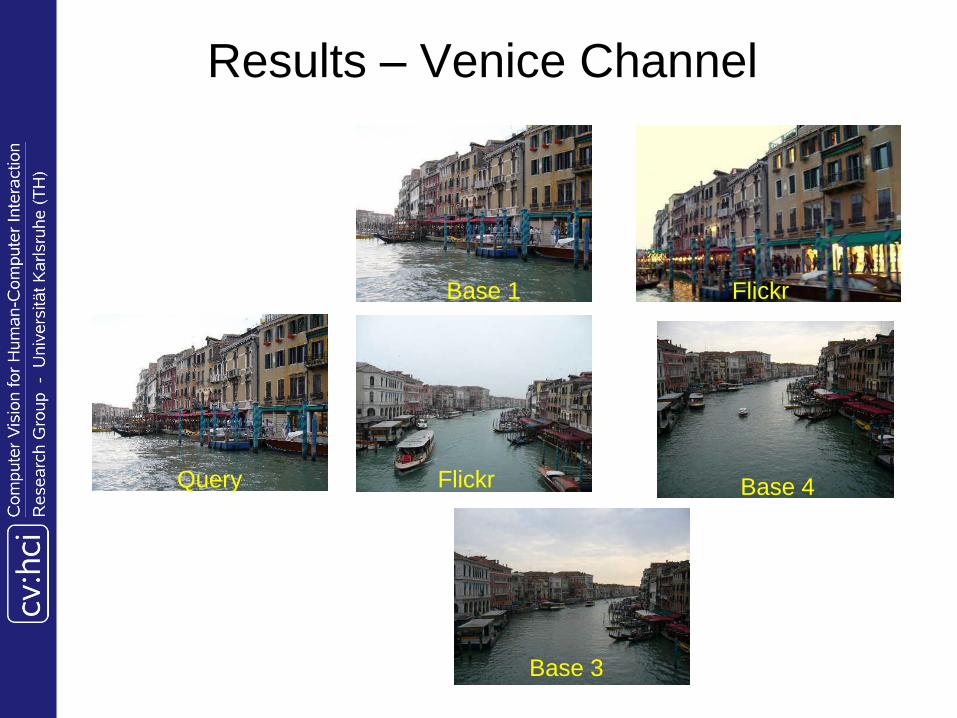
Results – Venice Channel
Base 1 Flickr
Flickr Base 4
Base 3
Query

Results – San Marco
Query
Base 01 Base 03
Base 02 Base 06
Flickr Flickr

82
References
D. Lowe. Distinctive image features from scale-invariant
keypoints. IJCV, 60(2):91-110, 2004
TRECVID. http://trecvid.nist.gov
M. Datar, N. Immorlica, P. Indyk and V. Mirrokni.
Locality-sensitive hashing scheme based on p-stable
distributions. In SCG, pages 253-262, 2004


![arXiv:1606.02894v1 [cs.CV] 9 Jun 2016Mostafa Mehdipour Ghazi Faculty of Engineering and Natural Sciences Sabanci University, Istanbul, Turkey mehdipour@sabanciuniv.edu Hazım Kemal](https://static.fdocuments.us/doc/165x107/5f07b3847e708231d41e4e44/arxiv160602894v1-cscv-9-jun-2016-mostafa-mehdipour-ghazi-faculty-of-engineering.jpg)