Coppicing evaluation in the Southeast U.S. to determine ... Gallangher for santiago.… · Short...
30
Coppicing evaluation in the Southeast U.S. to determine harvesting methods for bioenergy production Auburn University, Department of Forestry and Wildlife Sciences Rafael Santiago – Master’s student Tom Gallagher – Professor Mathew Smidt - Professor Dana Mitchell – Project leader USFS
Transcript of Coppicing evaluation in the Southeast U.S. to determine ... Gallangher for santiago.… · Short...

Coppicing evaluation in the Southeast U.S. todetermine harvesting methods for bioenergy production
Auburn University, Department of Forestry and Wildlife Sciences Rafael Santiago – Master’s studentTom Gallagher – ProfessorMathew Smidt - ProfessorDana Mitchell – Project leader USFS

Coal 18%
Natural gas28%
Nuclear 9%
Petroleum35%
Renewables 10%
U.S. Energy consumption (2014): 98.3 Quadrillion BTU
Biomass 50%
Geothermal2%
Solar 4%
Wind, 18%
Hydropower25%
U.S. Renewable Consumption: 9.6 Quadrillion BTU
Source: NREL 2014

Short rotation woody crops (SRWC)
Plantations established to grow lignocellulosic material (wood) for energy production purposes.
Intensively-managed plantations
Rotations can be shortened to as little as 3 years due to the ability to coppice. (U.S. Department of Energy, 2011).

Coppice ability:

Challenge: Harvesting multi-stem trees:
• Current absence of specialized machinery.• Generally time consuming
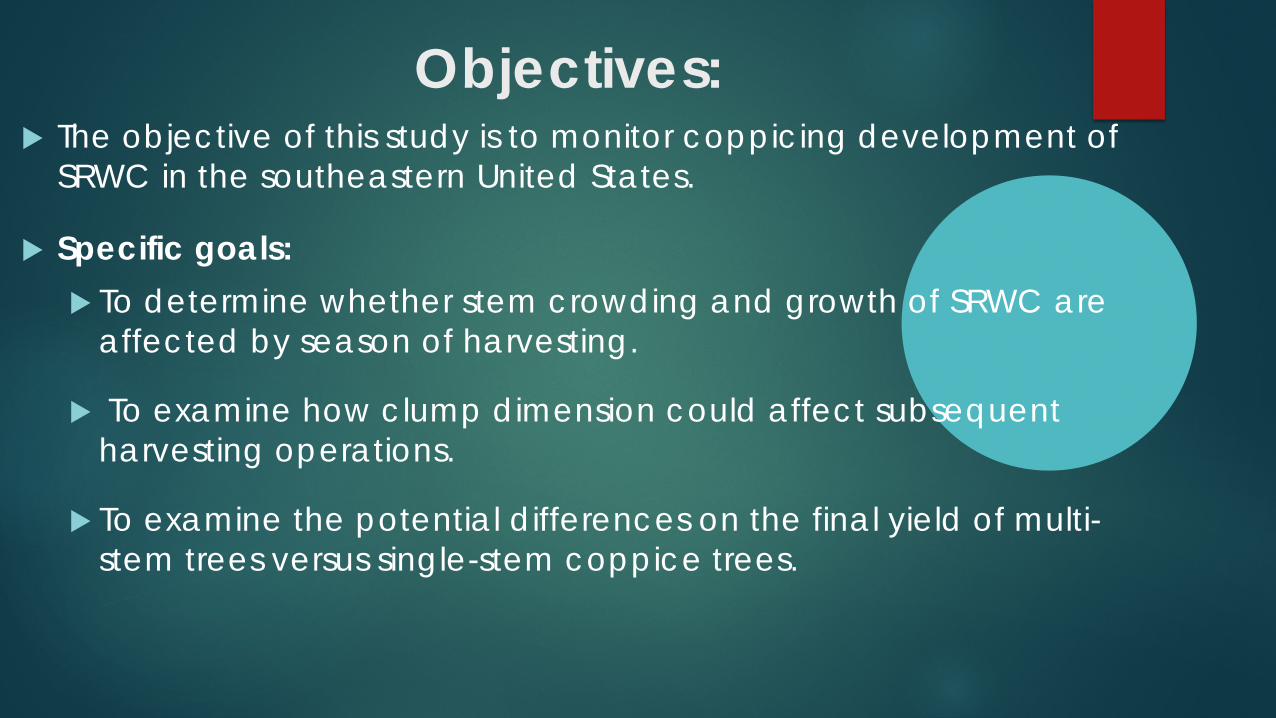
Objectives: The objective of this study is to monitor coppicing development of
SRWC in the southeastern United States.
Specific goals: To determine whether stem crowding and growth of SRWC are
affected by season of harvesting.
To examine how clump dimension could affect subsequent harvesting operations.
To examine the potential differences on the final yield of multi-stem trees versus single-stem coppice trees.
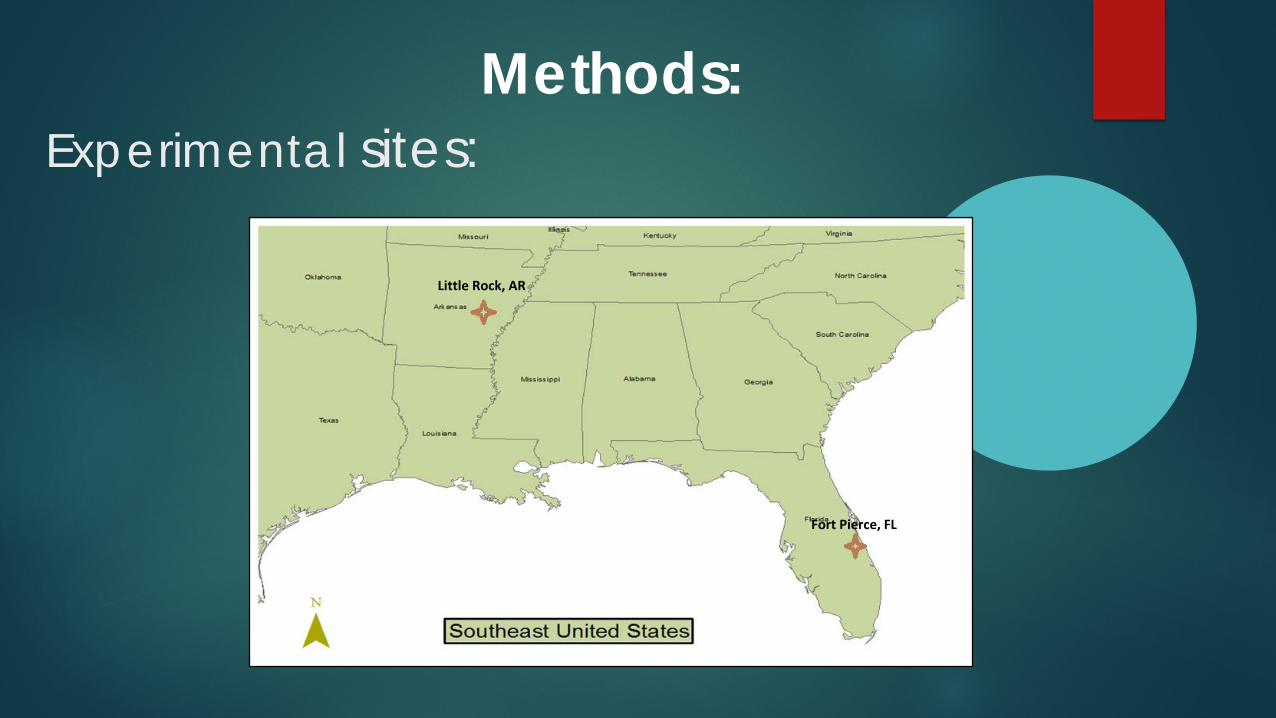
Experimental sites:
Fort Pierce, FL
Little Rock, AR
Methods:

Eucalyptus urograndisEucalyptus
Populus deltoidesCottonwood

Site description:Eucalyptus (Florida):
Density: 1820/ha
Size: 0.8 ha ~2 acres
Age of trees when harvested: 2 years
Harvesting dates:
(Winter plot): December,2013;
(Summer plot): May, 2014
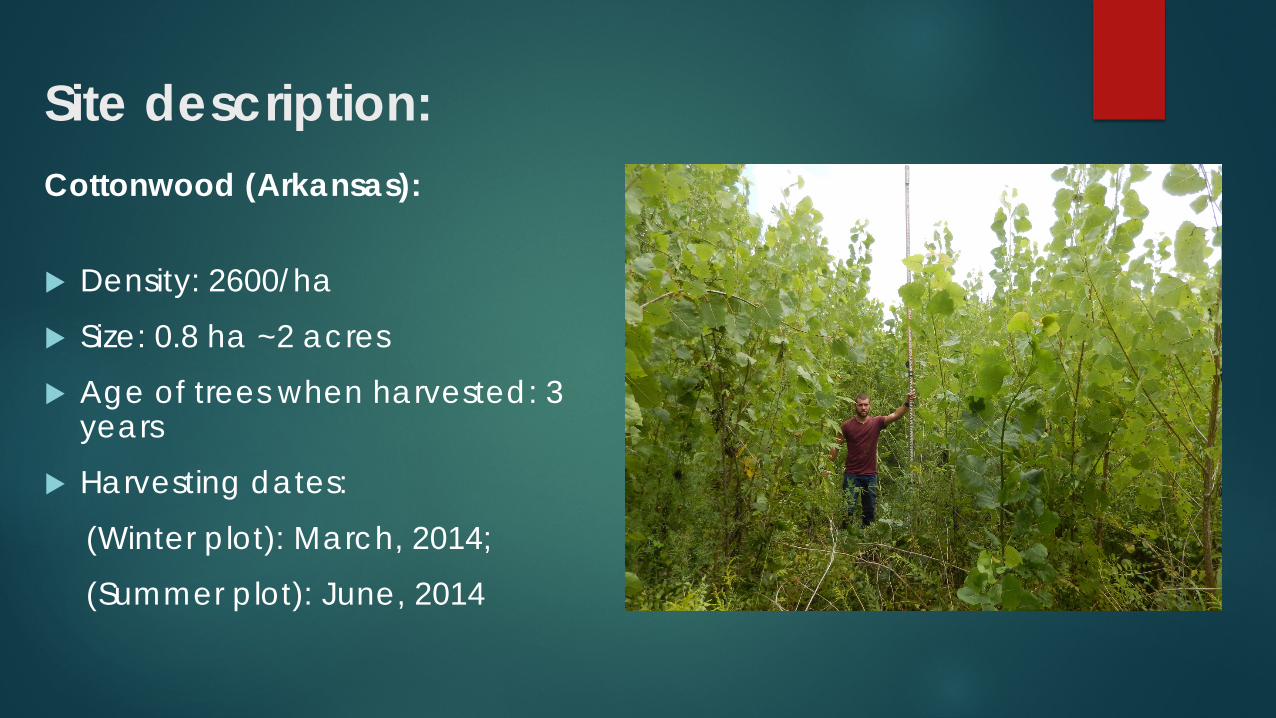
Cottonwood (Arkansas):
Density: 2600/ha
Size: 0.8 ha ~2 acres
Age of trees when harvested: 3 years
Harvesting dates:
(Winter plot): March, 2014;
(Summer plot): June, 2014
Site description:

Evaluation schedule: Growing degree days (GDD)Assessments Location Species GDD ≈ Months
(summer plots)
GDD ≈ Months
(winter plots)
1st
Evaluation
Florida E. urograndis 5460 ≈ 6 2935 ≈ 5
Arkansas P. deltoides 3760 ≈ 7 4440 ≈ 7
2nd
Evaluation
Florida E. urograndis 17,630 ≈ 24 17,190 ≈ 24
Arkansas P. deltoides 11,073 ≈ 23 11,201 ≈ 22
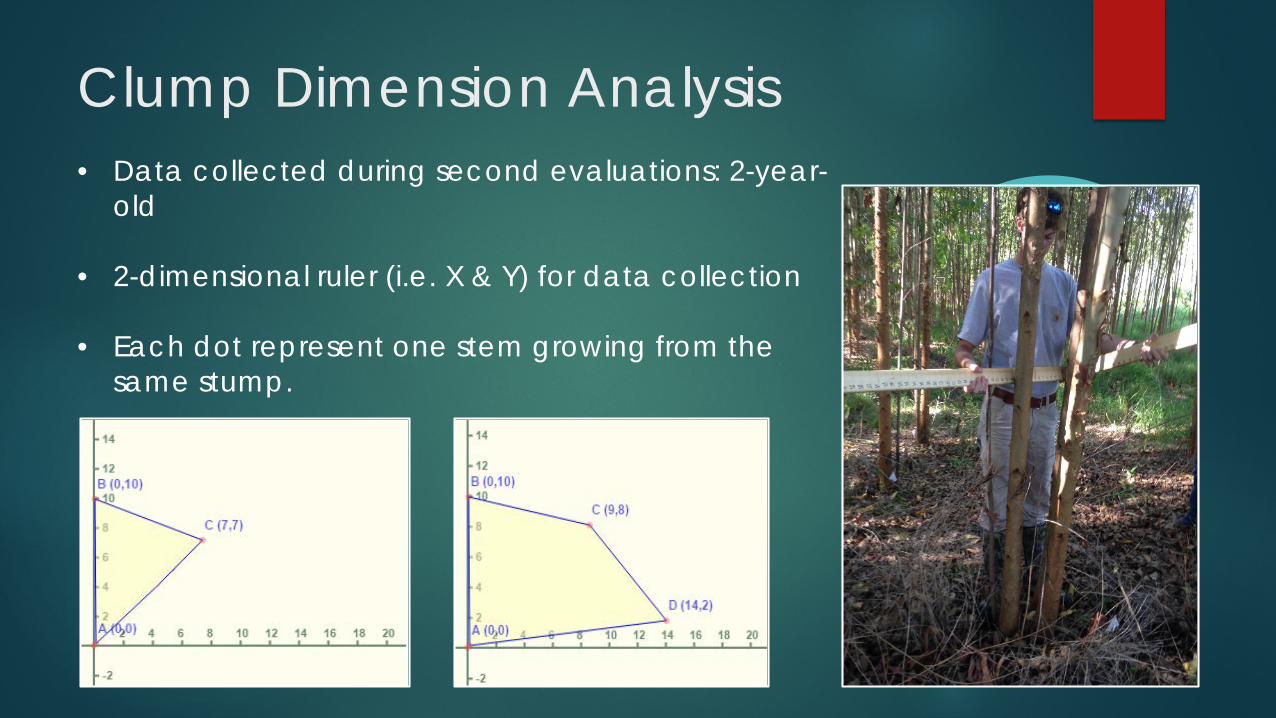
Clump Dimension Analysis• Data collected during second evaluations: 2-year-
old
• 2-dimensional ruler (i.e. X & Y) for data collection
• Each dot represent one stem growing from the same stump.
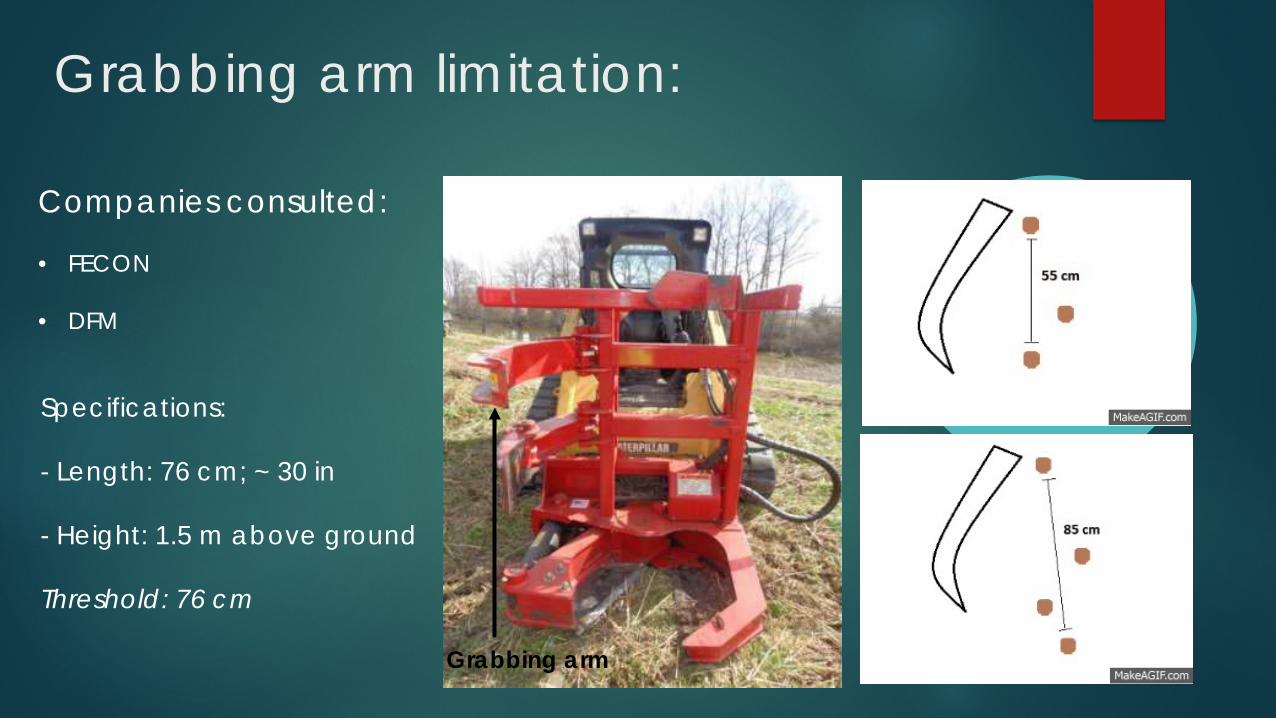
Grabbing arm limitation:
Grabbing arm
Specifications:
- Length: 76 cm; ~ 30 in
- Height: 1.5 m above ground
Threshold: 76 cm
Companies consulted:
• FECON
• DFM

Data collection:
Growth parameters: Height and DBH
Stump survival
Stem crowding and mortality of stems
Stump damage and stump diameter

Stump mortality
Winter harvest Summer harvest
Age Live stumps
Live stems
Harvesting 431 431
6-month-old
395 1673
2-year-old 393 1042
Age Live stumps
Live stems
Harvesting 435 435
6-month-old
331 1515
2-year-old 329 835
Eucalyptus urograndis:
~10% mortality ~25% mortality~0% mortality ~0% mortality
Results:

Stump mortality
Winter harvest Summer harvest
Age Live stumps
Live stems
Harvesting 401 401
6-month-old
386 1047
2-year-old 383 497
Age Live stumps
Live stems
Harvesting 425 425
6-month-old
207 566
2-year-old 196 288
Populus deltoides:
~10% mortality ~50% mortality~0% mortality ~5% mortality

Stem crowding
Eucalyptus urograndis:
Winter harvest plot Summer harvest plotSINGLE-STEM
10%
DUAL-STEM36%
MULTIPLE54%
SINGLE-STEM DUAL-STEM MULTIPLE
SINGLE-STEM13%
DUAL-STEM36%
MULTIPLE51%
SINGLE-STEM DUAL-STEM MULTIPLE
Stem crowding
Populus deltoides:
Winter harvest plot Summer harvest plot
SINGLE-STEM77%
DUAL-STEM18%
MULTIPLE5%
SINGLE-STEM DUAL-STEM MULTIPLE
SINGLE-STEM64%
DUAL-STEM28%
MULTIPLE 8%
SINGLE-STEM DUAL-STEM MULTIPLE

Clump dimension
Eucalyptus urograndis:
ChallengeCriteria Stump counting> 76 cm 4
Percentage 1%
Operation Distance apart (cm)Max 118
Median 33Mean 34Mode 25
Summer harvest plot
Operation Distance apart (cm)
Max 135Median 33Mean 35Mode 25
ChallengeCriteria Stump counting> 76 cm 4
Percentage 1%
Winter harvest plot

Clump dimensionPopulus deltoides:
Summer harvest plotWinter harvest plotOperation Distance apart (cm)
Max 69Median 23Mean 27Mode 23
Operation Distance apart (cm)Max 116
Median 30Mean 32Mode 30
ChallengeCriteria Stump counting> 76 cm 0
Percentage 0%
ChallengeCriteria Stump counting> 76 cm 2
Percentage 1%

Species Harvesting season
Total no
stems DBH (cm) Height (m) SD. DBH SD. Height
E. urograndisSummer 835 5.50 ± 0.16 10.94 ± 0.19 2.40 2.85
Winter 1042 5.73 ± 0.13 12.7 ± 0.19 2.20 3.16
P. deltoidesSummer 288 2.01 ± 0.15 3.70 ± 0.14 1.27 1.23Winter 497 3.03 ± 0.10 5.27 ± 0.12 1.24 1.38
*CI of means generated at α = 0.05
DBH and height means of stems by harvesting season at age 2:
Growth Parameters & Yield

Species Harvesting season
Final yield (m3/hectare) Mean (m3/stem) Mean
(m3/stump)
E. urograndisSummer 32.82 0.0159 ± 0.0009 0.0403 ± 0.0029
Winter 48.19 0.0187 ± 0.0008 0.0496 ± 0.0026
P. deltoidesSummer 1.68 0.0025 ± 0.0001 0.0036 ± 0.0003
Winter 4.67 0.0037 ± 0.0001 0.0049 ± 0.0002
Growth Parameters & Yield
*CI of means generated at α = 0.05
Yield results per species and season of harvesting:

Yield at stump level
0.02540.0393
0.04940.0620
0.0785
0
0.02
0.04
0.06
0.08
0.1
1 2 3 4 5
Vol
ume
per
Stu
mp
(m
3)
Stem Crowding Classes (stems per stump)
E. urograndis
Least Squares Means for effect stems_stumpPr > |t| for H0: LSMean(i)=LSMean(j)Dependent Variable: Volume/stump
i/j 1 2 3 4 51 0.0002 <.0001 <.0001 <.00012 0.0002 <.0001 <.0001 <.00013 <.0001 <.0001 0.0001 0.00054 <.0001 <.0001 0.0001 0.16785 <.0001 <.0001 0.0005 0.1678
*The p-values found at the encounter of columns i and j represent the significance of the means being compared. That is, if p-value > 0.05, the means from the classes in each column being compared are not statistically different.

Yield at stump level
0.0034
0.0065
0.0095
0.0123
0.000
0.003
0.006
0.009
0.012
0.015
1 2 3 4
Vol
ume
per
Stu
mp
(m
3)
Stems Crowding Classes (stems per stump)
P. deltoides
*The p-values found at the encounter of columns i and j represent the significance of the means being compared. That is, if p-value > 0.05, the means from the classes in each column being compared are not statistically different.
Least Squares Means for effect stems_stumpPr > |t| for H0: LSMean(i)=LSMean(j)Dependent Variable: Volume/stump
i/j 1 2 3 4
1 <.0001 <.0001 <.0001
2 <.0001 <.0001 <.00013 <.0001 <.0001 0.0015
4 <.0001 <.0001 0.0015

Yield at stem level
0.02540.0196
0.0165 0.0155 0.0151
00.0050.01
0.0150.02
0.0250.03
0.0350.04
1 2 3 4 5Vol
ume
per
stem
(m3)
Stems Crowding Classes (stems per stump)
E. urograndis
Least Squares Means for effect stems_stumpPr > |t| for H0: LSMean(i)=LSMean(j)Dependent Variable: Volume/stem
i/j 1 2 3 4 51 0.0002 <.0001 <.0001 0.0095
2 0.0002 0.0051 0.0058 0.5545
3 <.0001 0.0051 0.9322 0.9918
4 <.0001 0.0058 0.9322 1
5 0.0095 0.5545 0.9918 1
*The p-values found at the encounter of columns i and j represent the significance of the means being compared. That is, if p-value > 0.05, the means from the classes in each column being compared are not statistically different.

Yield at stem level
0.0034 0.0032 0.0032 0.0030
0.000
0.001
0.002
0.003
0.004
0.005
1 2 3 4
Vol
ume
per
stem
(m
3)
Stems Crowding Classes (stems per stump)
P. deltoides
Least Squares Means for effect stems_stumpPr > |t| for H0: LSMean(i)=LSMean(j)Dependent Variable: Volume/stump
i/j 1 2 3 4
1 0.7595 0.8956 0.8075
2 0.7595 0.9961 0.94643 0.8956 0.9961 0.9871
4 0.8075 0.9464 0.9871
*The p-values found at the encounter of columns i and j represent the significance of the means being compared. That is, if p-value > 0.05, the means from the classes in each column being compared are not statistically different.

Conclusions:
Once successfully coppiced, stump mortality is minimal.
Higher above ground volume in winter plots of both species.
Season of harvest did not affect stem crowding nor clump dimension.

With both species and seasons of harvest we noted that harvesting multi-stem coppiced trees with current technology is feasible.
Yield results showed that the accumulation of stems per stump will increase the final volume, without necessarily decreasing the size of the stems.
Conclusions:

Acknowledgments:

Questions: