Coping Rising Food Prices: Policy Dilemmas in the ...iiep/assets/docs/papers/Lustig...Coping with...
42
Institute for International Economic Policy Working Paper Series Elliott School of International Affairs The George Washington University Coping with Rising Food Prices: Policy Dilemmas in the Developing World IIEPWP20094 Nora Lustig George Washington University February 15 2009 Institute for International Economic Policy 1957 E St. NW, Suite 501 Voice: (202) 994‐5320 Fax: (202) 994‐5477 Email: [email protected] Web: www.gwu.edu/~iiep
Transcript of Coping Rising Food Prices: Policy Dilemmas in the ...iiep/assets/docs/papers/Lustig...Coping with...

Institute for International Economic Policy Working Paper Series Elliott School of International Affairs The George Washington University
Coping with Rising Food Prices: Policy Dilemmas in the Developing World
IIEPWP20094
Nora Lustig
George Washington University
February 15 2009
Institute for International Economic Policy 1957 E St. NW, Suite 501 Voice: (202) 994‐5320 Fax: (202) 994‐5477 Email: [email protected] Web: www.gwu.edu/~iiep

1
Coping with Rising Food Prices: Policy Dilemmas in the Developing World1
Nora Lustig2 February 15, 2009
1 This paper is based on “Thought for Food: the Challenges of Coping with Soaring Food Prices,” Working Paper 155, Center for Global Development, November 2008. The author is very grateful to Nancy Birdsall, Alain de Janvry, Kim Elliott, Alain Ize, Steve Kamin, Will Martin, Darryl McLeod and Peter Timmer for their comments on the latter. Needless to say, they do not bear any responsibility for any omissions, errors or mistakes. The author is also very grateful to Maria Davalos and Anna Rakhman for their excellent research assistantship. 2 Nora Lustig is Shapiro Visiting Professor of International Affairs at the Elliott School of International Affairs, George Washington University, Visiting Fellow at the Center for Global Development and Research Associate at El Colegio de Mexico.

2
Abstract
This paper examines the policy dilemmas and challenges faced by developing country governments when confronted with rising food prices, especially when it comes to the prices of basic foods such as rice and corn. One option for governments is to let domestic prices adjust to reflect the full change in international prices. However, this generates inflationary pressures, and if poor households lack savings or access to credit and social safety nets are inadequate, high food prices can cause severe hardship. Countries with large international reserves could mitigate these effects by appreciating their currency. But an exchange rate appreciation hurts the tradable sector and may cause macroeconomic imbalances down the road. Alternatively, governments can use food subsidies or export restrictions to stabilize domestic prices, shifting the burden of adjustment back on to international markets. The former measures exacerbate global food price fluctuations, hence are a “beggar-thy-neighbor” policy response which undermines a rules-based trading system and reduces welfare particularly in food importing countries. Without a multilateral solution to food price volatility in international markets, however, it is not surprising that developing countries pursue what is perceived as best for them even if the rest of the world is made worse off. With the introduction of biofuels, food commodity prices are likely to behave more like industrial commodity prices, so episodes of rapidly rising food commodity prices are bound to happen more frequently in the future. Biofuels not only lead to a rise in the long-term price of food staples but will also make food prices much more sensitive to the business-cycle much more than in the past. “Beggar-thy-neighbor” policies will become a common practice every time nonrenewable energy prices go up. Key Words: Food Prices, Inflation, Poverty, Policy Dilemmas, Safety Nets

3
World prices of food commodities rose sharply from January 2002 until June 2008.
(Figure 1) The IMF’s index of internationally traded food commodities prices increased 130
percent and individual agricultural commodities show even more pronounced increases. 3
(Figures 2) Price increases accelerated since 2004 and especially between mid-2007 and mid-
2008. Since July 2008, food commodities prices started to fall. From June until October 2008,
they declined by 27 percent but they were still higher than in January 2007. Although domestic
food prices have not risen as rapidly as international ones, in many poor countries food inflation
increased quite sharply. For example, in Sub-Saharan Africa food inflation increased to more
than 17.7 percent and reached 80 percent in Ehiopia.4 In Bolivia, Azerbaijan, Bulgaria and
Costa Rica it increased to 20 percent and it reached 30 percent in the Kyrgyz Republic and Sri
Lanka for a similar period.5
When confronted with rising food prices governments in developing countries face
difficult policy dilemmas, especially when it comes to the prices of basic foods such as rice and
corn. One option is to let domestic prices adjust to reflect the full change in international prices,
shifting the burden of adjustment to their own private sector. Since food represents a relatively
large share of developing countries’ consumption baskets, this causes inflationary pressures and
hurts the living standards of poor net consumers.6 Countries with large international reserves
could mitigate these effects by appreciating their currency. However, an exchange rate
appreciation hurts the tradable sector7 and may cause macroeconomic imbalances down the
road. Governments could also use safety nets to protect the poor from rising prices. However, in
many developing countries safety nets are lacking or inadequate. In addition, safety nets for the
poor do not help contain inflationary pressures or protect households in the middle of the
distribution who are hurt by high food prices too. Alternatively, governments can use food
subsidies or export restrictions to stabilize domestic prices, shifting the burden of adjustment
back on to international markets. The former measures exacerbate global food price
fluctuations, hence are a “beggar-thy-neighbor” policy response which undermines a rules-
based trading system. While administrative measures have costs for the countries that
implement them, these may be smaller than the alternative, particularly when prices are subject
to large fluctuations within short time periods. Without a multilateral solution to food price
3 For example, from January 2002 to June 2008 the international price of corn, wheat, rice and soybeans rose by 190, 162, 318 and 246 percent, respectively. Data from IMF Primary Commodity Prices Database. Prices for corn refer to Maize (corn), U.S. No.2 Yellow, FOB Gulf of Mexico, U.S. price, US$ per metric tone; for wheat to Wheat, No.1 Hard Red Winter, ordinary protein, FOB Gulf of Mexico, US$ per metric tonne; for rice to Rice, 5 percent broken milled white rice, Thailand nominal price quote, US$ per metric tonne; finally, for soybeans to Soybeans, U.S. soybeans, Chicago Soybean futures contract (first contract forward) No. 2 yellow and par, US$ per metric tonne. 4 From January until September 2008. 5 World Bank (2008b, 2008c). 6 This option, however, benefits net-sellers including those who are poor. 7 The so-called “Dutch Disease.”
4
volatility in international markets, it is not surprising that developing countries pursue what is
perceived as best for them even if the rest of the world is made worse off.
Using the recent period of rising food commodities prices, this paper examines the
policy dilemmas and challenges faced by developing country governments when confronted
with volatile food prices. It starts with an overview of the main drivers of the acceleration in
food price increases especially since 2004. The paper goes on to show that rising food prices
caused significant inflationary pressures and increased poverty. Section 3 presents a sample of
the complex policy dilemmas and challenges that governments in developing countries face.
Section 4 presents concluding remarks.
1. The Causes of Food Commodities Price Volatility
Table 1 presents a summary of the factors that have been identified as potentially significant
in explaining the phenomenon of rising food prices. Not all of them have survived a closer
scrutiny, though. A review of the literature suggests that--in addition to temporary idiosyncratic
factors such as bad weather and higher costs linked to energy prices—a key driver of the
acceleration in food commodities price increases since 2004 was the shift in demand for
industrial use due to the surge in the production of biofuels in advanced countries. Since mid-
2007 and until mid-2008, price increases accelerated even further and fell sharply since. While
the market dynamics during this period are still not well understood, a combination of
macroeconomic factors such as the depreciation of the dollar and lower interest rates in the
United States, and export-restricting policies on the part of developing countries seem to have
played an important role.8
By and large, the performance of agriculture over the past twenty five years has been
viewed as a success story. Between 1980 and 2004, output grew at an average of 2 percent per
year and prices fell at an average of 1.6 percent.9 Due to supply-side constraints arising from
land and water scarcity and slow technical progress, 10 this success story was about to come to
8 Given the methodological difficulties involved, however, an attempt to estimate the exact contribution of each of these factors using econometrics or a comprehensive simulation model would be an impossible task. 9 World Bank (2007), p. 51. Low prices were also the consequence of agricultural support policies in the European Union and the United States (IFPRI, 2003). 10 In the more densely populated areas of the world—primarily Asia-- the land frontier has been exhausted. In Latin America there is still room for land expansion but this often comes at the expense of tropical and subtropical forests. While in Sub-Saharan Africa there is great potential for land expansion, this would require large investments in infrastructure, human capital and agricultural extension. Water is likely to become increasingly scarce and irrigated agriculture would have to compete with the demand from larger and larger industrial sectors and urban centers. Climate change is likely to worsen the availability of arable land and water for agricultural use. Slowed R&D spending cautions one to expect technological breakthroughs any time soon. The supply-side constraints had already started to manifest themselves as a decline in the growth rates of yields of major cereal crops in developing countries.

5
an end. Analysts at IFPRI (International Food Policy Research Institute) and the FAO predicted
that food prices would rise by 0.26 percent per year until 2030 and 0.82 percent per year from
2030 to 2050.11 However, in the first years of this decade, the increase was much larger. From
January 2002 to July 2008, the price index of internationally traded food commodities prices
increased by about 20 percent per year or 100 times more than the predictions of the “business
as usual” scenarios (!).
A closer analysis of what happened to demand and supply in the markets for grains and
oilseeds from 2000 onwards may help explain this unexpected hike in prices. Table 2
summarizes the trends in harvested area, yields, food consumption, industrial use and stocks-to-
use ratios for corn, rice, wheat and oilseeds. Evidence suggests that there was a steady decline in
harvested area (for corn and wheat in particular) at the beginning of the decade, a likely result of
low prices in the past.12 Bad weather had a negative impact on yields and, in specific years, the
yields fell below trend for wheat and rice in particular. However, the harvested area for corn, for
example, rose sharply in response to higher prices and by mid-decade there were record global
crops for corn and oilseeds. These trends seem to indicate that supply was gradually responding
to incentives and bad weather was neither generalized nor persistent. Between 2000 and 2007,
for all grains, harvested area grew at 0.4 percent and yield grew at 1.3 percent per year, which
equals a 1.7 percent annual growth in supply.13
On the demand side, consumption for food (including animal feed) of corn, wheat and
rice was for the most part on trend. There were no surges in consumption on the part of China
or India (or by developing countries in the aggregate) for corn, wheat or rice. The exception is
oilseeds (soybeans in particular) for which the demand from China increased above trend.
Demand for food consumption (including animal feed) for all grains grew at 1.7 percent per
year from 2000 to 2007.14 Hence, excluding the demand for industrial use (biofuels), supply and
demand grew at the same pace.
In contrast, after legislation on mandates, tariffs, and subsidies was passed in the EU
and the US15, the demand for corn and vegetable oils for industrial use (biofuels) rose above
trend and at an increasing rate. (Figure 3) The use of corn for ethanol grew rapidly from 2004 to
2007. Feed use of maize, which accounts for 65 percent of global maize use, grew by only 1.5
percent per year from 2004 to 2007 while ethanol use grew by 36 percent per year and used 70
11 World Bank (2007), p. 62. 12 Timmer (2008) estimates that lower prices in the previous decade explain around 53 percent of the increase. On the harvested area and yield by crop see, for example, Abbott et al. (2008). Also, see Naylor and Falcon (2008). 13 Mitchell (2008). 14 Ibid. 15 Legislation was passed in 2005 and implemented in 2006.

6
percent of the increase in global corn production.16 Industrial use of vegetable oils (which
includes biodiesel) grew by 11 percent per annum from 2004 to 2007, compared with 3 percent
per annum for food use.17 It is estimated that about one-third of the increase in consumption
from 2004 to 2007 was due to biodiesel. In Figure 4 we can observe how price increases of corn
and soybeans accelerated after the demand for corn-based ethanol experienced its rapid
increase.
In quantitative terms, the contribution of biofuels to the rise in food commodities prices
has been estimated or calculated using different time periods and prices, different coverage of
food products, and different methodologies.18 The general conclusion that emerges from these
exercises is that the contribution of the expansion of biofuels to observed price increases is
quantitatively significant. Collins (2008) estimated that around 60 percent of the increase in
maize prices from 2006 to 2008 may have been due to the increase in maize used in ethanol.19
Mitchell (2008) concludes that 70-75 percent increase in food commodities prices was due to
biofuels and factors such as low grain stocks, large land use shifts, speculative activity and
export bans.20 Using a general equilibrium model, Rosegrant, et al. (2008) estimated the impact
of the acceleration in biofuel production on weighted cereal prices from 2000 to 2007 to be 30
percent in real terms.21
How much of the increase in food commodities prices was caused by policy-induced
increases in demand for biofuels as opposed to market forces such as higher gasoline prices
(derived from higher oil prices)? According to McPhail and Babcock (2008) eliminating
federal22 tax credits (for blending ethanol in gas) and tariffs—and, to a much lesser extent,
mandates—in the United States would reduce ethanol production by 18.6 percent and the price
of corn would decline by 14.5 percent. While significant, this leaves a large portion of the
increase unexplained. If gasoline prices are sufficiently high, the production of biofuels may be
profitable even without the mandates, tax credits and the like. According to McPhail and
Babcock (2008)23, even if government support policies at the federal level are eliminated, if gas
prices equal 3 dollars per gallon or higher, ethanol production would rise from the current levels
16 Ibid. 17 Author’s calculations based on data from the PSD Database, USDA. 18For example, computable general equilibrium models (Rosegrant et al., 2008) or partial equilibrium analysis (Collins, 2008) or estimated as an accounting residual (Mitchell, 2008). 19 Mitchell (2008), p. 4. 20 Ibid., p. 16. 21 Also, in the short-run, the IMF estimated that the increased demand for biofuels accounted for 70 percent of the increase in maize prices and 40 percent of the increase in soybean prices (Lipsky, May 8, 2008). A recent OECD report (OECD, 2008) calculates that “current biofuel support measures are estimated to increase average wheat, maize and vegetable oil prices by about 5%, 7% and 19%, respectively, in the medium term” (p.9). 22 In addition to policies at the federal level, there are mandates and other policies at the state level which also affect ethanol and biodiesel production. (Elliott, 2008) 23 http://www.econ.iastate.edu/research/webpapers/paper_12943.pdf.

7
of 6.5 billion gallons to 14 billion gallons and corn price would stay at 4 dollars a bushel24 (until
recently prices were around 7 dollars a bushel). In fact, as Elliott (2008) shows the mandated
levels required by the Energy Policy Act of 200525 in the United States were apparently non-
binding. (Figure 5)26
Markets were “stressed” before the expansion of biofuels production. 27 However, in its
absence, the price increases would have been more moderate, especially for corn. In particular,
one would have expected the price increases to subside in 2004/05 when there were record
global harvests in corn and oilseeds. Instead, price increases for corn accelerated. Between
January 2002 and January 2004, for example, the monthly rate of growth for corn prices was 1
percent on average while between January 2005 and June 2007 the monthly rate of growth rose
to 2.4 percent on average. With rising oil prices, consumers were willing to pay higher prices
for biofuels and since global agricultural markets are highly interconnected, rising corn prices
pushed other prices up through adjustments in behavior on the demand and supply side and
arbitrage conditions. 28
While the factors—if not the exact orders of magnitude—behind the reversal of the
trend in food commodities prices since 2002 are more or less understood, a convincing
explanation of the market dynamics of commodity prices from mid-2007 onwards remains
elusive.29 The increase in prices of food commodities—along with other commodities—
accelerated from mid-2007 up until mid-2008 when they began to fall at a fast pace: a third of
the increase between 2002 and mid-2008 occurred during this twelve-month period (equivalent
to 15 percent of the time). Understanding the market dynamics of commodity prices during this
period remains elusive. Three elements might have contributed to these fluctuations:
24 A bushel is equal to 56 pounds. 25 Signed into law (Public Law 109-58) by President Bush on August 8th of 2005. 26 This is not proof that the same increase in biofuels production would have existed without government support. It is still possible that without the tax credits or protection from imports, the production of biofuels at those same prices would have been lower. According to Naylor and Falcon (2008), in the absence of government support policies, oil prices would have to be high enough and corn prices low enough to make ethanol production profitable at 65 percent the price of gas . “…[E]thanol has only about two-thirds the energy of gasoline. In other words, rational consumers would pay only about 65% of the price of gasoline for their ethanol, since their cars would go only about 65% as far on a tank of fuel. Since ethanol must be shipped and stored separately, substantial new infrastructure would be needed to make it a large-scale choice for fuel, and autos would require so-called “flex” technology to use fuel containing high percentages of ethanol.” 27 For an estimate of the order of magnitude of the impact of past prices on current prices see Timmer (2008). 28 For example, in 2007 harvested area for corn in the US rose by 23 percent “… in response to high maize prices and rapid demand growth for maize for ethanol production. This expansion resulted in a 16 percent decline in soybean area … which reduced soybean production and contributed to a 75 percent rise in soybean prices between April 2007 and April 2008.” (Mitchell, 2008, p. 10) See Naylor and Falcon (2008) for a description of the interaction between ethanol and corn, soybean and wheat price. 29 One of the reasons of why this is important is because if the factors are other than the fundamentals of demand and supply (inflationary expectations or a “bubble”), the behavior of commodity prices during the first half of 2008 would have been misleading. Their rapid increase was interpreted as a validation of the “decoupling” theory (that the rest of the world would not be seriously affected by the US slowdown) and let to the implementation of anti-inflationary measures when the world was on the verge of a big collapse in demand.

8
macroeconomic factors such as the depreciation of the dollar and lower interest rates in the
United States, speculation, and interventionist policies on the part of developing countries since
mid-2007.
There is casual evidence that the price index of non-oil dollar commodities and the real
value of the dollar have been inversely related.30 (Figure 6) As shown in Figure 7, however,
commodity prices rose in all major currencies. This is an indication that factors other than the
depreciation of the dollar played a significant role. However, it is quite possible that the
depreciation of the dollar may have affected the short-run dynamics of commodity prices
because of higher demand stemming from countries whose currencies appreciated vis-à-vis the
dollar. Available estimates put the commodity price elasticity with respect to the real value of
the dollar between 0.5 and 1.0.31 Using the mid-point of these elasticities and the trade-weighted
depreciation of the dollar, Mitchell (2008) argues that the contribution of dollar weakness to the
increase in commodity prices between January 2000 and June 2008 could be of the order of 20
percent (.75 times 26 percent).32 However, the selection of the mid-point is as good as any
other; based on the above elasticities the range would go from 13 to 26 percent.
Since the acceleration in commodity price increases coincided with the onset of the
sub‐prime crisis in mid‐2007, could the two events be related? Frankel (2008b) argues that
the fact that commodity prices rose across the board calls for some macroeconomic explanation.
For a while, the most popular macro explanation was rapid growth in the world economy.
However, since mid-2007 (and until mid-2008) price rises accelerated even though the global
economy was slowing down.33 According to Frankel (2006), Calvo (2008) and others, one of
the explanations may be the Federal Reserve’s decision to lower interest rates since mid-2007.
Lower interest rates increase the demand for or reduce the supply of storable commodities
30 According to Mundell (2002): “[A] casual reading of the statistics suggests that this relationship is quite close. Thus the index of non-oil dollar commodities tripled in the 1970s when the dollar was depreciating sharply relative to the SDR; it then fell by more than 20 per cent from 1980 to 1986 when the dollar was soaring; then it rose by 50 per cent from 1986 to 1995 when the dollar was again depreciating; and it has fallen by 30 per cent since 1995 when the dollar has been appreciating. There is therefore a very pronounced association of the cycle of the dollar against other major currencies (as measured by the SDR) with the cycle of dollar commodity prices.” 31 Gilbert (1989) and Baffes (1997).
32 We must bear in mind, also, that causality runs both ways. A productivity boost generated by all-purpose technology such as the IT “revolution” would result in an appreciation of the currency of the leader in the use of such technology and a reduction of commodity prices. On the contrary, an exogenous increase in commodity prices will put downward pressure (i.e., towards depreciation) on the currency of importing countries. If part of the increase in commodity prices (food and nonfood) is determined by exogenous factors (such as rapid growth in China), this would have put downward pressure on the dollar. However, this would have been countered by the rise in prices of commodities where the US is a major exporter. But because the US is a net importer of commodities, it suffered a decline in its terms of trade of about 7.5 percent between 2002 and 2007.
33 The IMF reduced predicted growth rates for the world in 2008 from 5.2 percent in July 2007 to 4.1 percent in January 2008 (IMF World Economic Outlook Updates for July 2007 and January 2008). The WEO Update for July 2008 has kept the 4.1 percent projection for world output growth.
9
through a variety of channels: by decreasing the incentive for pumping oil, mining gold, logging
forests, culling cattle, etc. today rather than tomorrow; by increasing the desire to hold
inventories; and, by encouraging investors (or speculators if you wish) to shift out of Treasury
Bills and into other assets such as foreign currencies, emerging market stocks, other securities,
and commodities—including food commodities.34
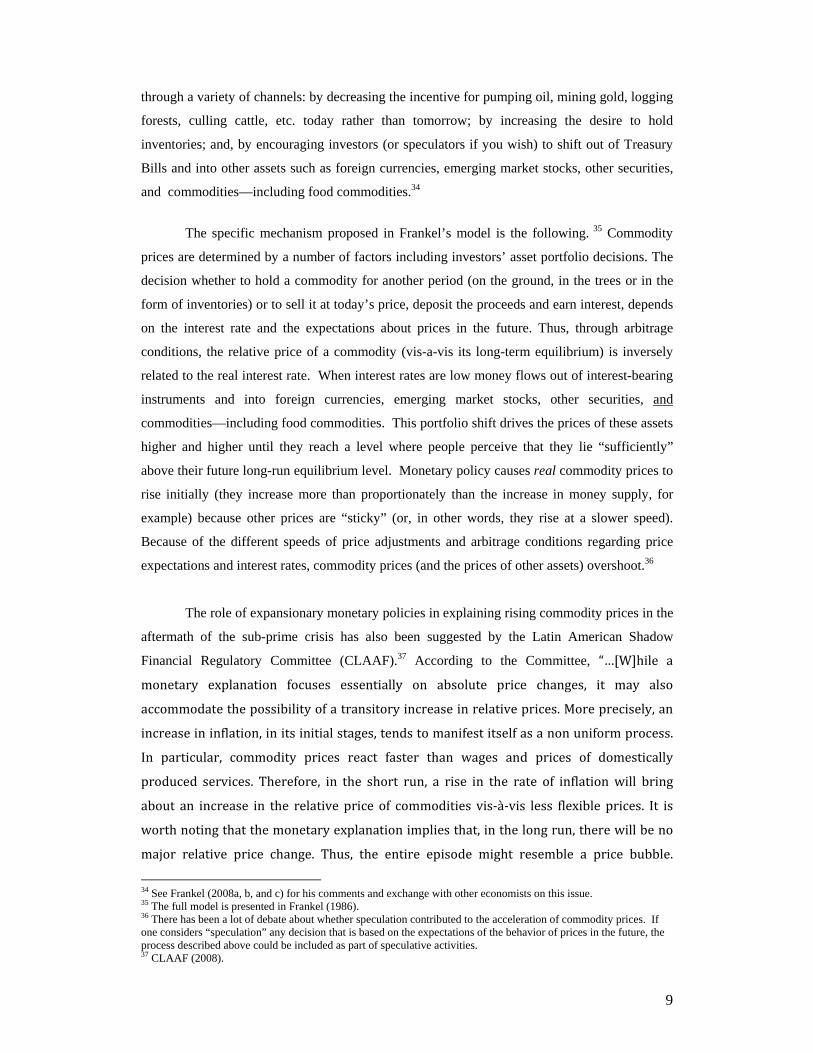
The specific mechanism proposed in Frankel’s model is the following. 35 Commodity
prices are determined by a number of factors including investors’ asset portfolio decisions. The
decision whether to hold a commodity for another period (on the ground, in the trees or in the
form of inventories) or to sell it at today’s price, deposit the proceeds and earn interest, depends
on the interest rate and the expectations about prices in the future. Thus, through arbitrage
conditions, the relative price of a commodity (vis-a-vis its long-term equilibrium) is inversely
related to the real interest rate. When interest rates are low money flows out of interest-bearing
instruments and into foreign currencies, emerging market stocks, other securities, and
commodities—including food commodities. This portfolio shift drives the prices of these assets
higher and higher until they reach a level where people perceive that they lie “sufficiently”
above their future long-run equilibrium level. Monetary policy causes real commodity prices to
rise initially (they increase more than proportionately than the increase in money supply, for
example) because other prices are “sticky” (or, in other words, they rise at a slower speed).
Because of the different speeds of price adjustments and arbitrage conditions regarding price
expectations and interest rates, commodity prices (and the prices of other assets) overshoot.36
The role of expansionary monetary policies in explaining rising commodity prices in the
aftermath of the sub-prime crisis has also been suggested by the Latin American Shadow
Financial Regulatory Committee (CLAAF).37 According to the Committee, “…[W]hile a
monetary explanation focuses essentially on absolute price changes, it may also
accommodate the possibility of a transitory increase in relative prices. More precisely, an
increase in inflation, in its initial stages, tends to manifest itself as a non uniform process.
In particular, commodity prices react faster than wages and prices of domestically
produced services. Therefore, in the short run, a rise in the rate of inflation will bring
about an increase in the relative price of commodities vis‐à‐vis less flexible prices. It is
worth noting that the monetary explanation implies that, in the long run, there will be no
major relative price change. Thus, the entire episode might resemble a price bubble.
34 See Frankel (2008a, b, and c) for his comments and exchange with other economists on this issue. 35 The full model is presented in Frankel (1986). 36 There has been a lot of debate about whether speculation contributed to the acceleration of commodity prices. If one considers “speculation” any decision that is based on the expectations of the behavior of prices in the future, the process described above could be included as part of speculative activities. 37 CLAAF (2008).

10
Furthermore, the increase in commodity prices becomes a leading indicator of future
generalized inflation.”38 This process relies entirely on the assumption that prices adjust at
different speeds, an assumption that empirical evidence suggests it is valid.
Frankel (2006) provides econometric evidence in support of the inverse relationship
between commodity prices and real interest rates in the US dating back to the 1950s which is
generally robust.39 Casual observation (Figure 8) suggests that the decisions to lower interest
rates by the Federal Reserve in mid-2007 were followed by an acceleration in the price
increases. However, after mid‐2007 commodity prices have fallen in tandem with interest
rates: between June 2008--when the IMF’s Food Commodity Price Index peaked—and October
2008 prices fell by 27 percent. This casts some doubt on the theory that commodity prices
increased due to inflationary expectations caused by the Fed’s decision to lower interest
rates. This is an area that deserves further research. 40
The sharp decline in nominal commodity prices observed since mid‐2008 is also
consistent with the presence of a price bubble incentivized by lower interest rates in the
United States. The importance of expansionary monetary policy or financial speculation as a
cause of the acceleration of the commodity price increases has been dismissed because, if that
were the case, one would have observed an increase in stocks of commodities—including food
commodities.41 However, in the case of certain commodities such as oil or metals, stocks can be
accumulated in “invisible” ways: by drilling or mining less. In the case of agricultural
commodities, this option does not really exist because one cannot accumulate them by simply
not harvesting a crop. But, as Calvo (2008) has argued, in the face of highly inelastic demand,
the desired level of stocks may increase, but given the short run inelastic nature of supply, this
may express itself through rising prices rather than higher stocks.42 Furthermore, it is probably
naïve to think that stocks accumulated by sovereign governments are public knowledge in full.43
Finally, because of the recently created link between food commodities and fossil fuels through 38 Also, see Rojas-Suarez (2008). 39 Frankel (2006). 40 Another factor which has been mentioned to explain the acceleration in commodity price increases since mid-2007 is speculation in financial markets and the rise in the participation of index funds. So far, the evidence for this is very limited. World Bank (2008c) 41 See, for example, Krugman (2008). 42 Note, by the way, that government interventions to restrict exports and expand subsidies contributed to the inelasticity of supply and demand. 43 In addition, in the case of agricultural commodities in particular, accumulation of stocks may be “invisible” because it is done by millions of consumers buying additional amounts which although small individually, can add up and put upward pressure on prices. If, for example, if we take half of the population of India, China, Indonesia and Bangladesh (a total of 1,428,658,500 persons, WEO data) and assume an increase in the amount of rice bought by consumers of 10 kilos per year per person, this would result in an increase in demand in the order of 14,286,585,000 kilos or 14,286,585 tons. With world rice production at 430.72 million tons in 2008 (USDA) this represents 3.3% of world production or 5% of the production in these four countries (which in 2008/2009 is estimated at 292 million tons, USDA). In addition, export restrictions imposed by governments are tantamount to a form of speculation because they also restrict supply available in world markets.

11
the biofuels nexus, part of the impact of lower interest rates on food commodities prices may be
indirect (that is, there is no need to observe an accumulation of their inventories). 44
The pattern of a sharp increase followed by a sharp fall in commodity prices is also
consistent with changes in fundamentals. While investors expected the world economy to
continue growing despite the US slowdown, they also expected the returns to non‐US
assets, including commodities, to rise. When in mid‐2008 investors started to realize that
the economic slowdown would be much more severe and global, the expectations went
into the opposite direction and commodity prices began to fall.
It is important to bear in mind that the explanations of the acceleration in commodity
price increases based on real vs. monetary factors, though clearly distinct, are not mutually
exclusive. The explanation which emphasizes the workings of physical demand and supply for
commodities, considers inflation a consequence of these persistent relative price changes. In
contrast, for the monetary explanation, the increase in the relative price of commodities is partly
endogenous: a consequence of expansionary monetary policy. But both may be and are likely to
have been at play.
Starting in the last quarter of 2007, developing country governments introduced
administrative measures to ban or restrict exports and put bids on purchases of food
commodities. (Figures 9a and 9b) These measures exacerbated the upward pressure of food
commodities prices in international prices.45 The impact was particularly strong in the case of
rice.46 In Figure 10 one can observe how acceleration in the price increases of rice coincided
with some key countries introducing administrative measures that affected supply or demand. In
Africa, the domino effect on other prices did not wait; with rice and other imported cereals in
short supply, the price of locally grown crops such as millet and sorghum rose.47 In an attempt
to quantify the impact of administrative measures on world prices, Ivanic, Martin, Mattoo and
Subramanian (2008) show that if developing countries try to offset a fifty percent increase in the
world prices of rice, corn, wheat and soybeans applying policy responses aimed at restoring
individual countries' domestic prices, world market prices will rise by 10 to 30 percentage
points.
44 However, correlation is not proof of causality. The spike in prices could also be explained by the nonlinearities present in tight commodity markets which were subject to additional shocks such as the administrative decisions mentioned above (export bans, export taxes, etc.). And the recent fall could be explained by the expected downward pressure on prices resulting from a slowdown in global growth. In addition, the inverse relation between commodity prices and interest rates does not always hold empirically. 45 See Ivanic , Martin, Mattoo and Subramanian (2008). 46 See Slayton and Timmer (2008), Naylor and Falcon (2008). 47 Naylor and Falcon (2008) and the article by Fleshman (2008).

12
The fact that food commodities have become a profitable alternative for the production
of fossil fuel energy substitutes has important implications.48 In contrast to food being used for
consumption purposes whose income-elasticity is below unity (Engel’s Law), the income
elasticity for food commodities for industrial purposes could equal unity or more.49 This turn of
events significantly alters the forces at play in food commodities markets and--depending on
what happens to oil prices, biofuels subsidies and mandates and research on the agricultural
frontier--food could become permanently more expensive in a nontrivial way. Von Braun
(2008a) argues that with the current growth path of biofuel production, i.e. with the actual
expansion plans for biofuels, oilseeds and corn prices would increase by 18 and 26 percent,
respectively, by 2020. 50 In contrast, the “business as usual”—that is, without biofuels--scenario
mentioned above predicted an increase in food commodities prices of .26 percent per year or
around 5 percent by 2020. In addition, the new link between the prices of food commodities and
the prices of energy commodities makes the prices of the former much more sensitive to the
business cycle and the vicissitudes of financial markets. While it is too early to test the latter
using econometric techniques, the (de-trended) correlation between oil prices and corn prices
since 2004, for example, is much higher than it was in the previous decades: it rose from .36
during the period 1957-2003 to .65 during the period 2004-2008.51
2. Rising Food Prices, Inflation and Poverty
For developing countries, the impact of rising food commodities prices on inflation and
poverty are of particular concern. Although domestic food prices have not risen as rapidly as
international prices,52 IMF (2008) estimates found that—between December 2007 and March
2008-- the median 12-month rate of food price inflation for a sample of 120 non-OECD
countries rose from 10 percent to 12 percent, almost twice the median food price inflation rate
of 2006. (Figure 11) Similarly, World Bank (2008b) found that food inflation rose by around
20% in Bolivia, Azerbaijan, Bulgaria and Costa Rica and reached 30% in countries like Kyrgyz
Republic and Sri Lanka in the same period. According to World Bank (2008c) headline
inflation in developing countries rose by 5 percentage points between 2006 and 2008 and more
48 By this we mean the use of food commodities to produce energy for cars and machines. 49 The long-run income elasticity of energy and oil has been estimated at approximately 1.0 for the non-OECD countries (Gately and Huntington, 2001). 50 According to OECD (2008) estimates, a full implementation of the recently enacted US Energy Independence and Security Act and the currently proposed new EU Directive for Renewable Energy, close to 20% of global vegetable oil production and more than 13% of world coarse grain output could shift to biofuels production”. The EU directives were revised so their impact needs to be re-estimated. 51 Correlations were estimated using the de-trended monthly series of commodity prices published by the International Monetary Fund in the International Financial Statistics. 52 The World Bank (2008c) finds that among 73 countries for which monthly consumer price index and household survey data are available, the majority had real food price increases of 12 percent or less.

13
than 30 developing countries featured double digit inflation rates. With the fall in commodity
prices, headline inflation is declining in the second half of 2008.
The fact that rising food commodities prices cause inflationary pressures in poorer
countries should not come as a surprise since food represents such a high percentage of their
consumption basket. For example, in Nigeria, about 70 percent of income is spent on food, 75
percent in Vietnam, and 50 percent in Indonesia compared with 12 percent in the United States.
However, inflationary pressures affected middle-income countries with very diverse policy
regimes: Chile, Venezuela, and several Eastern European and Central Asian countries. This is
an area that deserves further research.
It is important to bear in mind that since the reported numbers refer to actual inflation
rates, they do not necessarily reflect the “true” inflationary pressures stemming from higher
international food commodities prices. Actual inflation not only reflects inflationary dynamics
but also the policy measures that governments take to respond to them. These policies can
range from restrictive monetary and fiscal policies to interventions in specific markets (e.g.,
price controls, export bans, consumer subsidies and so on). An indicator that governments
faced important inflationary pressures is that several monetary authorities increased interest
rates by 25 basis points or more53 despite its dampening effect on output. Another indicator is
that, as mentioned in the previous section, many governments implemented trade, fiscal and
administrative policies to contain the increase in domestic food prices. In the absence of these
policies, inflation would have been even higher than what was observed.
What is the impact of higher food commodities prices on poverty? Since the poor
include both net consumers and net sellers of food commodities, a change in their price in either
direction will inevitably hurt some of the poor and benefit some of the poor at the same time.
Small poor farmers tend to benefit from higher food prices. However, the poor in urban areas
and those in rural areas with little or no access to land are hurt, and hurt badly, when food prices
increase. This contradictory impact of food prices on the poor has been known as the “food
price dilemma.”54 This dilemma has been the source of a futile debate regarding when the poor
are better off: when food prices go up or when they go down? Policymakers should simply
accept that if food prices rise (fall) poor net buyers (net sellers) will need help and poor net
sellers (net buyers) will be better off. In either case, safety net programs will have to be
53 This happened in Brazil, Indonesia, Mexico, the Philippines, South Africa, and Thailand. (World Bank, 2008c) 54 Timmer, Falcon and Pearson (1983), Chapter 1. This dilemma has been analyzed empirically for a number of countries. See, for example, Ackah and Appleton (2007); Barrett and Dorosh (1996); Deaton (1989); Lustig (1986); Mellor (1978); Pinstrup-Andersen (1987); Ravallion and van de Walle (1991); Ravallion (1990); Trairatvorakul (1984).

14
expanded in coverage and size to compensate the group of the poor who get hurt. In addition,
when food commodities prices increase, there is an opportunity to help poor net sellers translate
this windfall into a more long-term improvement in living standards. With respect to the net
impact on poverty (i.e., on summary measures such as the headcount ratio, the poverty gap ratio
and the poverty gap ratio square), available evidence suggests that among the poorest
households, the decline in living standards of net consumers caused by higher food prices
outweighs the benefits accruing to net sellers in the majority of countries that have been
analyzed so far. 55
As a general proposition, the impact on poverty generated by an increase in the price of
food will depend on: i. the relative importance of different food commodities in the production
set and consumption basket of different households and the difference between the two56; ii. the
magnitude of the relative price change; iii. households’ ability to substitute between food items;
and, iv. the degree to which households are compensated for the price shocks by changes in
their income (i.e., by the indirect effect on wages and employment originated by the price
change). 57 Evidence suggests that the poor spend between 50 and 70 percent of their income on
food on average58, the proportion of poor people who are net buyers of food tends to dominate
over the share of net sellers, the increase in domestic food price—though much lower than that
observed for international prices-- has been significant, although households do substitute more
expensive for less expensive food in the case of basic staples this substitution is limited, and the
positive effects on wages take time.
Table 3 presents a summary of the estimates obtained by a series of recent studies
which use different methods, poverty lines and assumptions about price increases, pass-through
to domestic prices, substitution effects, and wage effects. Also, some include net sellers while
others don’t. The orders of magnitude of the estimated short-term impact of higher food prices
on poverty are significant. Ivanic and Martin (2008a) show that about 105 million people in the
least developed countries have been added to the world’s poor since 2005 because of rising food
prices. This is equivalent to about 10 percent of the people living on less than a dollar a day
55Aksoy and Isik-Dikmelik (2008), for example, argue that many of the poor are net sellers of food commodities so that higher prices is a benefit to them. While this is true, the studies that estimate the full impact (i.e., on net sellers and net buyers), find that higher food prices result in an increase in the headcount and poverty gap ratios in the overwhelming majority of cases (Ivanic and Martin, 2008a; Wodon et al., 2008; Robles et al., 2008; CEPAL, 2008). 56 For poor farmers, the difference is often positive indicating that they benefit from a price increase. In contrast, poor urban households or landless agricultural workers are net consumers of food commodities and get hurt by an increase in their price. 57 To estimate the latter, one must be able to estimate the spillover effects; this has been done using multi-sectoral and full-fledged computable general equilibrium models. Some CGEs are Walrasian, that is, all markets clear via prices and there is no unemployment. Others are more heterodox: they assume flexible prices in some markets but in others prices are determined as a mark-up above costs and total employment is endogenously determined by the level of aggregate demand. 58 World Bank (2008c), p. 119.

15
and, according to the authors, equivalent to approximately seven lost years of progress in
poverty reduction. Even middle-income Latin America has not remained impervious: Robles et
al.( 2008) estimate that the increase in world food prices between January 2006 and March 2008
resulted in an increase of 4.3 percentage points in the headcount ratio or 21 million additional
poor individuals.59 CEPAL (2008)—the UN Economic Commission for Latin America and the
Caribbean-- estimates that the ranks of the extremely poor and the moderately poor increased by
10 million each. 60 The Asian Development Bank (2008) suggests that a 20% increase in food
prices would raise the number of poor individuals by 5.65 and 14.67 million in Philippines and
Pakistan, respectively.61 62 So, in spite of all the differences in methodology and assumptions,
these studies suggest that in the majority of countries, higher food commodities prices increase
poverty. Although poverty increases considerably more in urban areas, with the exception of a
few cases rural poverty goes up as well.63
Research on specific countries re-enforces this result. Haq et al. (2008) found that food
price increases in Pakistan might have increased urban poverty by 44.6 percent and rural
poverty by 32.5 percent. Valero-Gil and Valero (2008) find that the spike in food prices during
2008 had a significant effect on poverty even after taking into account the positive effects of
reduced taxes and tariffs and higher cash transfers to the poor. According to them, moderate
consumption poverty increased from 25 to 33.5 percent and extreme poverty from 10.58 to
15.95 percent. Warr (2008) finds that higher food prices, especially staple grains, worsen
poverty incidence in Thailand despite the presence of large numbers of poor farmers, many of
whom benefit from higher prices.
3. Policy Dilemmas caused by Rising Food Prices
Given their impact on inflation and poverty, rising food commodities prices pose
significant policy dilemmas to developing countries. The conventional wisdom among
59 Regional numbers for Latin America are own calculations based on Robles et al. (2008) country-by-country estimations for net increase in poverty. 59 60 CEPAL (2008) assumes that incomes rose at the same pace as the consumer price index. 61 For a more extreme scenario of 30% increase in food prices, the number of poor people increases by 8.85 and 21.96 million in Philippines and Pakistan, respectively. 62 It is important to point out that these estimates on the poverty impact of higher food prices do not take into account the positive effect that higher food commodities prices has had on economic growth in net exporting countries. In these countries, the net effect of the commodity boom may well be a reduction in poverty. At present none of the estimates account for this impact. Since net exporters are fewer and richer than the net importers, the overall impact on poverty may not change much even if the commodity boom-driven growth dividend for net exporters is taken into account. However, future research should also estimate the reduction in poverty caused by commodity-boom induced growth in net exporters. In addition to their impact on macroeconomic performance and poverty, rising food prices were a source of social unrest and created severe budgetary difficulties for food aid programs and made planning for food relief excruciatingly difficult. 63 World Bank (2008c), p. 116.

16
economists is that short-run problems associated with high prices of staple foods are best dealt
with by appropriate macroeconomic instruments and targeted safety nets. However, as we shall
see below, the policy dilemmas and challenges faced by governments in developing countries
are substantial.
To fend off inflationary pressures, monetary authorities have two options: to
accommodate the price increases as a one-time spike in the rate of inflation or to stick to the
inflation target through tight monetary policy. Tight monetary policy has a dampening effect on
economic activity. However, accommodation puts the hard-won credibility of central banks at
risk and this risk has to be weighed against the costs of tight monetary policy in terms of
foregone output. Also, for countries in which wage and price indexation is common, it will be
hard to prevent the initial increase in inflation from becoming entrenched. But given that
fulfilling the inflation targets may mean that nonfood prices must fall in nominal terms,
governments find it hard not to acquiesce to some degree of accommodation. 64 Without it
losses in economic activity are likely and this, in turn, would exacerbate the impact on poverty.
In addition, the recessionary impact of tight monetary policy might reduce the fiscal resources
available to compensate the poor through targeted safety nets.
In countries with large international reserves and sound fiscal and external stances,
monetary authorities could use part of the reserves to encourage an appreciation of the currency
which would immediately reduce the impact of higher international food commodities prices on
domestic prices. However, relying on a macroeconomic price such as the exchange rate to
deflect inflationary pressures has its costs. It creates disincentives to exporters and hurts import-
competing sectors and, in more extreme cases, it can slow down growth.
The uncertainty regarding the causes and duration of rising food prices make the
dilemmas even more complex. In the case where the former are the result of global inflationary
pressures associated with US monetary policy, an appreciation of the currency—whenever
feasible—is an appropriate response. However, as it was mentioned in section 2, if food
commodities price increases are subject to overshooting or are caused by a price bubble, then
international prices are reflecting a transient distortion. Under such circumstances, using the
heavy artillery of higher interest rates or an appreciation of the currency would result in
“overkill.” The problem is that in the midst of the process nobody can be sure if the price
increases are temporary or what portion of their acceleration reflects a distortion versus global
inflation or changes in fundamentals.
64 Even the IMF (2008) has recognized that inflation targets might have to be missed in order to avoid an excessive reduction in output or output growth. Also, see Dervis (2008).

17
Suppose now that governments accept the conventional wisdom and want to focus on
protecting the poor from the impact of higher domestic food prices. Are developing countries
ready? In particular, do safety net programs exist and can they be easily expanded? Do
governments have the fiscal space to accommodate the additional resources needed to fund the
safety net? Figure 12 presents the safety net programs available in low and middle-income
countries by category: cash transfers, food for work, food ration/stamp and school feeding
programs. Unfortunately, according to this information, 19 (out of 49) low-income and 49 (out
of 95) middle-income countries do not have safety net programs of any kind.
Moreover, given the characteristic of the adverse shock—i.e., an increase in the price of
a good that takes up a substantial portion of a poor person’s budget—the most adequate safety
net is to compensate the affected population for their loss in purchasing power in cash.65
Although cash transfer programs (conditional and unconditional) are increasingly more
common, they are still not pervasive. According to Figure 12 there are 16 (out of 49) low-
income and 37 (out of 95) middle-income countries that have cash transfer programs. In the
absence of cash transfer programs, countries could resort to school feeding programs. While
they will not compensate the poor for the loss of purchasing power associated with higher food
prices, school feeding programs can insulate (at least in part) children of poor households from
suffering a cut in their food intake as a result of higher food prices. School feeding programs
are a bit more common in low-income countries than cash transfer programs but still only 24
low-income countries have them.
In addition to the fact that there are many low- and middle-income countries which do
not have safety net programs, those which exist may be too limited in coverage. In the case of
Latin America and the Caribbean, for example, the coverage of cash transfer programs exceeds
25 percent of the population living in poverty in 8 out of 26 countries: Brazil, Colombia, Chile,
Ecuador, Honduras, Jamaica, Mexico and Panama. The good news is that the two largest
countries with the highest number of poor people in the region, Brazil and Mexico, have among
the best functioning cash transfer programs in the world.66 The poorest countries in the region,
however, either do not have programs or have them in a limited scale.
Furthermore, most of these programs do not have a mechanism to incorporate the “new”
poor or increase the size of the benefits in the face of adverse shocks as part of their design.
65 Since the problem is loss in purchasing power and not in employment, expanding food-for-work or cash-for-work programs is not the most adequate response and could potentially introduce distortions in the allocation of labor supply on the part of poor households. However, increasing the wage paid in cash-for-work programs is. 66 Bolsa Familia in Brazil and Oportunidades in Mexico.
18
Some governments (Brazil and Mexico, for example) have increased the transfer to compensate
for the loss in its purchasing power. However, the programs have not incorporated as
beneficiaries those who became poor as a result of the food price increase. So far it is not clear
how many of the countries with cash transfer programs have increased the amount of the
transfer and incorporated the “new” poor into the program (or implemented a complementary
program).67
In sum, the existing safety net systems in developing countries leave much to be
desired. In too many countries it is either inexistent or small; and, even in countries in which
cash transfer programs are large and effective in addressing chronic poverty, they are not
designed to respond to shocks. This means that the majority of the poor who have been hurt or
those who have become poor as a result of higher food prices were not being protected from the
impact of higher food prices on their living standards. In cases in which these programs were
expanded, this was done as an ad hoc measure implemented many months (or even years) after
food price increases appeared on the scene. In addition, low-income countries in particular may
not have the fiscal space to finance an expansion let alone launch new safety net programs.
There is no available data in the public domain as to how many countries may be in such
position.68
Confronted with lacking or inadequate safety nets, unpalatable macroeconomic choices,
and uncertainty about the evolution of international food commodities prices, governments
throughout the developing world implemented a series of administrative policies designed to
insulate domestic food prices from their fluctuations in world markets. More than 80 developing
countries for which data is available put in place at least one of the following: reduced import
tariffs or other taxes, relaxed import restrictions, increased general consumer subsidies, raised
export taxes, or introduced price controls, export restrictions or outright bans. (Figure 9a) The
World Bank surveyed 118 countries and found that the most frequently adopted policies were
food price controls, reduced food taxes, and consumption subsidies. 69 (Figure 9b) Also, about a
third of the countries implemented export restrictions. These measures were implemented even
by countries with adequate safety net programs.70 This should not come as a surprise. Targeted
safety nets do not help contain inflationary pressures or social discontent among low-income
67 There is evidence that Ethiopia increased the wage rate in its cash-for-work program and that other poor countries have relied on food-for-work, food distribution and school feeding programs to transfer resources to the poor. For a discussion on this see Revenga (2008). 68 IMF (2008) indicates which countries need the IMF because of balance of payments vulnerability but there is no indication how many countries may need it to expand or implement a safety net. 69 See, for example, Revenga (2008), Ivanic and Martin (2008b) and Wodon and Zaman (2008). 70 Mexico, for example, increased the size of the transfers in its cash transfer program but it also lowered tariffs on agricultural goods and inputs, implemented some forms of “soft” price controls and increased general subsidies on some food staples.
19
urban workers who are not poor enough to be included in the safety net system but are hurt by
rising food prices.
With the exception of import-liberalizing and tax reducing policies, the rest has elicited
quite a bit of criticism from multilateral institutions. The former are more acceptable to the
mainstream because they are considered to be efficiency-enhancing and consistent with a rules-
based trading system. Heterodox measures such as export restrictions, general subsidies or price
controls raise concern because they distort producers’ and consumers’ response, defer and may
worsen inflationary pressures, and can channel large amounts of scarce government resources to
the non-poor. However, reducing tariffs and taxes also lowers government revenues which may
not be desirable for countries facing fiscal imbalances. It addition, it is not infrequent that
countries face political resistance to apply an ad valorem tax on food staples so once they are
lowered it may be very difficult to raise them in the future. All of these administrative
measures—including reducing import tariffs and other taxes on food items--exacerbate the
upward pressure on commodity prices hurting food commodity importers and, in the extreme,
can be self-defeating. However, an appreciation of the currency, a policy that has been
recommended by some mainstream macroeconomists, could also exacerbate the upward
pressure on international prices.71
The “best” policy option for individual countries will depend on two crucial factors:
what the government’s objective function is and where it enjoys the most degrees of freedom.
If a government is concerned about containing inflation and at the same preserving the
credibility of the central bank, it may choose a policy path that is different from that of a
government whose objective is to minimize the impact on the poor or to maintain social and
political stability in the urban areas under limited fiscal and institutional resources. Countries
with large international reserves, robust safety nets and fiscal space will choose a policy mix
that is different from countries that have none of these. The fact that so many governments—
from populist Argentina to conservative Mexico to pragmatic China, for example-- chose to use
administrative measures may be an indication that—despite their costs—they were viewed as
the best option under the circumstances.72
71 Even safety nets to the poor could put upward pressure on international prices. However, the increase in demand for food resulting from an expansion of safety nets is bound to be lower than, for instance, general consumption subsidies or price controls. In addition, safety nets do not lower the price to the supplier allowing for a positive response on their part to take place. 72 The choice of which specific administrative measures to use should be based on “common sense” criteria. For example, governments should choose those price policy interventions which are more easily reversed (that is, they do not become hijacked by special interest groups), least distortionary, least regressive, more consistent with a rules-based trading system, simple to implement from an administrative point of view and do not cause unsustainable fiscal imbalances. In this process government are likely to face complex and difficult to quantify trade-offs.

20
4. Concluding remarks
Starting in 2002, international food commodities prices experienced large fluctuations.
When prices were rising, developing countries faced significant policy dilemmas. Confronted
with inflationary pressures, increasing poverty and social unrest, the vast majority of
governments introduced beggar-thy-neighbor policies that reduced the welfare of particularly
food-importing countries and undermined a rules-based trading system. This elicited substantial
criticism from multilateral organizations and mainstream economists. Rather than trying to
insulate domestic prices—it is argued—, governments should let prices adjust to reflect the
change in international prices and use targeted safety nets to compensate the poor. However, as
we saw above, safety nets in many developing countries are lacking or inadequate. If they are
to be used in future episodes of rising food prices, they need to be put in place now. In
particular, multilateral organizations should work with governments to implement cash transfer
programs so that the poor can quickly and efficiently be compensated for the loss in purchasing
power when food prices rise. It is essential that the new or existing programs are designed in
such a way so that they can increase (decrease) the size of the transfer and the number of
beneficiaries when the shock occurs (unwinds). That is, they should include an “insurance”
component; this is not a feature which current programs have.73 In addition, governments
should have mechanisms in place to ensure than when cash transfers need to be expanded, they
will have the required fiscal space.
Even if adequate safety nets are in place, however, governments in developing countries
would still need to cope with inflationary pressures and social discontent among urban
households who are not poor enough to be included in the safety net programs but are hurt by
higher food prices. Thus, the temptation to insulate domestic prices with beggar-thy-neighbor
administrative measures will continue to exist. Moreover, these measures may not be
inadequate if food price volatility in international markets is reflecting transient distortions
resulting from global inflationary pressures or a food commodities price bubble. Among
interventionist measures, however, some may be less problematic than others. The conventional
wisdom in economics is that using taxes, subsidies and tariffs is better than price controls and
export bans. But the availability of fiscal resources and political economy dynamics may change
the ranking of policies.
73For a discusión on how the cash transfer programs can be adapted to incorporate an “insurance” component, see De Janvry et al. (2008).

21
As long as food commodities prices are subject to large fluctuations in international
markets, it will be difficult to persuade developing countries not to implement measures that
exacerbate the upward pressure on them. This will be particularly so in periods of high
volatility, when price increases accelerate and governments in developing countries find it
difficult to address the challenges to price stability, poverty reduction and social peace that
soaring food prices cause. These welfare-decreasing measures could be avoided if international
food commodities prices could be stabilized. The international community through a
multilateral organization such as the World Food Program should explore how to create a public
reserve of food staples to reduce price volatility.74 Recognizing that such an initiative would be
costly and difficult to manage, these costs should be weighed against the benefits in terms of
poverty reduction, nutrition and social stability that it would bring. In addition, public reserves
could also help correct transient market distortions caused by hoarding, price bubbles or global
inflationary pressures.75
74 See the proposal made by Lin (2008), for example. 75 Dealing with secular upward pressures on international food commodities prices caused by the surge in the production of biofuels will require a different approach. Certainly subsidies for biofuels production in advanced countries should be eliminated. However, if the price of gasoline gets to be high enough, it will be profitable to produce them without subsidies. In this case, countries may have to consider a tax on biofuels production. Otherwise, it will be increasingly difficult to protect the poor in developing countries from the impact of rising food prices.

22
Table 1. Causes of Rising Food Commodities Prices: A Summary of the Literature
Excessively low prices in the past; market‐ and agricultural
support and R&D policy driven
Excessively low prices in the past; market‐ and
agricultural support and R&D policy driven
Diversion of food to biofuels production; market
and biofuels policy driven
Soaring energy prices; market and oil policy driven
Dollar depreciation; macroeconomic policySlowdown in output growth of agricultural
commodities; sectoral and R&D policy driven
Reduction in US interest rates; macroeconomic policy
Bad weather and crop disease; natural causes and
policy(climate‐change and disease‐prevention)
driven
Expansive macroeconomic policies resulting in too high
global economic growth; macroeconomic policy
Export bans and export taxes; defensive policy
response which exacerbates pressure on tight
markets
Increase in food demand due to rising living standards;
market‐driven
Diversion of food to biofuels production; market
and biofuels policy driven
Excessively low prices in the past; market‐ and agricultural
support and R&D policy driven
Excessively low prices in the past; market‐ and
agricultural support and R&D policy driven
Speculation; market‐driven and regulatory policy Soaring energy prices; market and oil policy driven
Food hoarding and panic buying; defensive response which
exacerbates pressure on tight markets
Policy Driven
Market Driven
Demand Supply
General subsidies, price controls, reduction of import
barriers and out‐of‐the ordinary purchases on the part of
governments in developing countries; defensive policy
response which exacerbates pressure on tight markets

23
Table 2. World Demand and Supply Summary: Corn, Wheat, Rice and Soybeans CORN RICE WHEAT OILSEEDS
Below trend 2005/06
and 2006/07, but on
trend for the rest
Below trend 2002/03,
2003/04, 2004/05 but on
trend for rest
Below trend in 2006/07
and 2007/08 but on trend
for rest
Below trend in 2007/08
On trend (feed
consumption)On trend On trend
Grew at 2.1% per year
in 2000‐07 and 2.6%
per year in 1995‐00*
Grew at 1% per year in 2000‐
07 and 1.4% per year in 1995‐
00*
Grew at 0.8% per year in
2000‐07 and 1.4% per
year in 1995‐00*
Above trend and
increasingly so since
04/05b
Above trend for rapeseed and palm since
2000/01 and soybeans since 2004/05.
Use of maize for
ethanol from 2004 to
2007 was 70% of the
increase in global
maize production*
7% of global vegetable oil supplies were
used for biodiesel production in 2007
and about one‐third of the increase in
consumption from 2004 to 2007 was due
to biodiesel*.
Industrial uses of vegetable oils grew by
15% per annum from 2004 to 2007,
compared with 4.2% per annum for food
use*.
The share of industrial use of total use
rose from 14.4% in 2004 to 18.7% in
2007*.
CHINA AND INDIA
No consumption surge
and no significant role
in international
markets
No consumption surge;
China trades very little. India
was 14% of world exports
but fell to 7‐9% in 07/08 and
08/09. India’s ban of rice
exports (Oct 2007) probably
had an effect on world prices
No consumption surge (in
China, consumption
actually fell) and no
significant role in
international markets
China’s imports of palm oil and soybean
oil rose more sharply since 02/03
HARVESTED AREA
(For all grains grew at 0.4% per
year between 2000‐07*)
YIELD
(For all grains grew at 1.3% per
year between 2000‐07*)
FOOD CONSUMPTION
(For all grains grew at 1.7% per
year between 2000‐07*)
Above trend due to increased demand in
China for animal feed purposes and rise
in human consumption of fats.
Increased 15% from
2002/03 to 2007/08
Declined by 10.4%
between 1980/81 to
2006/07 but recovering
Declined after 2005/06 but estimated to
rise again in 2008/09; land used for corn
(biofuels) in US; corn for in the US
increased 37% from 2007 to 2008
Lowest in 2004/05 since 1970s
INDUSTRIAL USE (biofuelsa) Not used for biofuels Not used for biofuels
STOCKS‐TO‐USE RATIO IN %Lowest in 2008/09
since 1973/74
Declined to levels similar to
1970s in 2004/05 and
subsequently leveled off
Lowest in 2007/08 since
1960/61
Feed use of maize
grew by 1.5% per year
from 2004 to 2007
while ethanol use grew
by 36% per year*
Source: Author’s elaboration based on “*” Mitchell (2008), Abbott et al. (2008) and own calculations based on USDA data. a. Ethanol is produced from sugar crops, such as sugar cane or beets, or starchy crops such as maize. Biodiesel is produced from vegetable oils or animal fats. b. The United States is the largest producer of ethanol from maize and is expected to use about 81 million tons for ethanol in the 2007/08 crop year. Canada, China and the European Union used roughly an additional 5 million tons of maize for ethanol in 2007 (USDA 2008a), bringing the total use of maize for ethanol to 86 million tons, about 11% of global maize production. The U.S. accounts for about one-third of global maize production and two-thirds of global exports and used 25 percent of its production for ethanol in 2007/08. The largest biodiesel producers were the European Union, the United States, Argentina, Australia, and Brazil, with a combined use of vegetable oils for biodiesel of about 8.6 million tons in 2007 compared with global vegetable oils production of 132 million tons. (Mitchell, 2008)

24
Table 3. Poverty Impacts of Recent Increases in Food Prices: A Summary of Available Studies
Ivanic and Martin (2008) Wodon et al. (2008) ADB (2008) IADB (2008) CEPAL (2008)
RESULTS
Poverty increases in all countries with the
exception of Peru. The 2005-2008Q1 price increase scenario
increases national poverty rates by 4.5 percentage
points on average (calculating estimates for all low income countries:
additional 105 million people in poverty).
Poverty increases. A 50% increase in prices leads to an average increase of the headcount poverty of 4.4 percentage points (or 2.5
with producer impacts). An average increase of 3.5 percentage points at the
national level in SSA would lead to to around 30 million
people in poverty
Poverty and inequality increase in the short-term. In the medium-term it
depends. A 20% food price increase in Philippines and
Pakistan increases the number of poor by 5.65 and 14.67
million, respectively.
Poverty increases by 4.3 percentage points
or 21 million additional poor individuals (net effect)*. For example, total income poverty
increases by 8 percentage points in Guatemala (net effect of intl. price increase), 6.9 in Mexico and 6.5
in El Salvador
Indigence increases from 12.7 (68.5 million people) to 14.7 (79.1 million people) with
income effects. Poverty increases
from 35.1 (189.5 million people) to 37 (199.6 million) with
income effects
COUNTRIES
Bolivia, Cambodia, Madagascar, Malawi, Nicaragua, Pakistan,
Peru, Vietnam and Zambia
Burkina Faso, DRC, Ghana, Gabon, Guinea, Liberia,
Mali, Niger, Nigeria, Senegal, Sierra Leone, Togo
Short-term Pakistan and Philippines;
medium-term China and Indonesia
Nineteen countries in LAC
Estimates are for Latin America and the Caribbean as a whole
METHODShort-term impact;
Deaton's framework and GTAP for wage effects
Short-term impact; Deaton's framework
Short-term/partial application of
Deaton's framework with budget shares only and no income
shares; medium term impacts with CGE
model which incorporates supply
response
Upper bound increase poverty line by 30%
(multiplication of increase in world
prices of commodities (.68) times average
share of six food commodities (.435)
while rest of prices are assumed unchanged). Lower bound assumes
an increase in agricultural workers'
income equal to world price increases
Not described in note (will be published
shortly)
INCLUDES NET SELLERS
Yes
Upper bound estimates include net-buyers only; lower bound estimates
assume net-sellers receive price increase in full
Short-term estimates includes buyers only;
medium-term CGE should include effects
on net sellers
No No
WAGE EFFECTS Yes NoMedium-term CGE
yesAssumes agricultural workers' incomes rise
Assumes everybody's income rose 5%
SUBSTITUTION EFFECT
No NoMedium-term CGE
yesNo No
PRICE INCREASE
Three simulations: 1. 10% uniform increase/pass through equal to 1; 2.
2005-07 actual FAO/pass through .66; 3. 2005-
2008Q1**
Simulate price increases of 25% and 50%; price
increases are the same for all countries and all food
items
Simulate food price increases of 10%,
20% and 30%
Simulates the impact of the IFS estimate of
price increases for six commodities from Jan
06 to March 08 (68.1%); full pass
through to domestic prices. Also, simulates
price increases estimated by central
banks
Assumes a 15% increase in food
prices
POVERTY LINE 1 dollar a day in PPP 1 dollar a dayCountry-specific
poverty linesCountry-specific
poverty lines
Country-specific poverty lines for moderate and
extreme poverty
POVERTY MEASURE
Headcount ratio and poverty gap ratio
Headcount ratioChange in absolute number of poor; Gini
coefficient
Headcount ratio and poverty gap ratio
Headcount ratio and number of poor
individuals
ROBUSTNESS CHECKS
Poverty line; price increases; labor market
segmentation
Simulation of two levels of price increases and upper
and lower bounds
Simulation of three levels of price
increases
None that are mentioned
None that are mentioned
* Own calculations based on the paper. ** For the 2005 to 2008.Q1 authors attempted to at what had actually happened to domestic prices. If a currency had appreciated against the USD, then the domestic price increase for these commodities was assumed to be smaller than the increase in $ and we first made that adjustment. If other prices had increased, and we tracked this using inflation over the period, then the increase in food prices had to be compared relative to that increase in prices. So there were two adjustments-- one for the exchange rate and one for increases in the general price level.

25
Figure 1. Food Commodity Price Index (2005=100), January 2002-November 2008
60
80
100
120
140
160
180
200
2002M
1
2002M
4
2002M
7
2002M
10
2003M
1
2003M
4
2003M
7
2003M
10
2004M
1
2004M
4
2004M
7
2004M
10
2005M
1
2005M
4
2005M
7
2005M
10
2006M
1
2006M
4
2006M
7
2006M
10
2007M
1
2007M
4
2007M
7
2007M
10
2008M
1
2008M
4
2008M
7
2008M
10
Sept 07 June 08
Source: IMF Primary Commodity Prices Database.

26
Figure 2. Food Commodities Prices, January 2002-November 2008
0
200
400
600
800
1000
1200
0
100
200
300
400
500
600
2002M1
2002M4
2002M7
2002M10
2003M1
2003M4
2003M7
2003M10
2004M1
2004M4
2004M7
2004M10
2005M1
2005M4
2005M7
2005M10
2006M1
2006M4
2006M7
2006M10
2007M1
2007M4
2007M7
2007M10
2008M1
2008M4
2008M7
2008M10
US$
per metric tonne, Rice
US$
per metric tonne
Corn Soybeans Wheat Rice
Source: IMF Primary Commodity Prices Database. Commodity prices refer to: Maize (corn), U.S. No.2 Yellow, FOB Gulf of Mexico, U.S. price, US$ per metric tonne; Rice, 5 percent broken milled white rice, Thailand nominal price quote, US$ per metric tonne; Soybeans, U.S. soybeans, Chicago Soybean futures contract (first contract forward) No. 2 yellow and par, US$ per metric tonne; Wheat, No.1 Hard Red Winter, ordinary protein, FOB Gulf of Mexico, US$ per metric tonne.

27
Figure 3. Demand of Corn for Fuel in the United States and Evolution of Corn prices
0
50
100
150
200
250
300
0
5
10
15
20
25
30
35
1995 1996 1997 1998 1999 2000 2001 2002 2003 2004 2005 2006 2007 2008
US$
per metric tonne
Percent
Corn for fuel (US share) Corn price
US increases use of renewable fuels of 7.5 billion/g by 2012
US raises use of ethanol to 36 billion/g by 2022 and 1 billion biodiesel by 2012
EU increases biofuelshare in transport by
2010 and 2020
Source: Author's construction based on the IMF Primary Commodities Database and USDA Feedgrains Database. Information for mandates is from Table 3. Notes: Prices refer to Maize (corn), U.S. No.2 Yellow, FOB Gulf of Mexico, U.S. price (average of daily quotations). Calculations of corn for fuel are for the United States. Corn prices for 2008 are averages from January 2008 to July 2008.
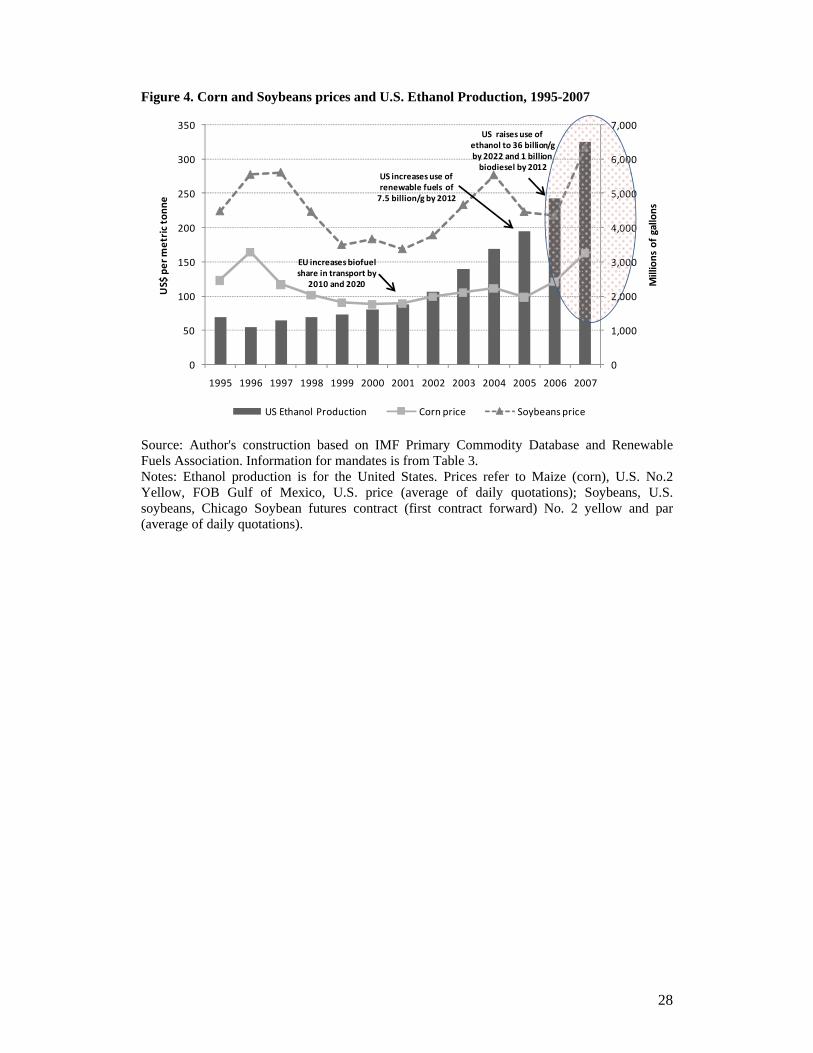
28
Figure 4. Corn and Soybeans prices and U.S. Ethanol Production, 1995-2007
0
1,000
2,000
3,000
4,000
5,000
6,000
7,000
0
50
100
150
200
250
300
350
1995 1996 1997 1998 1999 2000 2001 2002 2003 2004 2005 2006 2007
Millions of gallons
US$
per metric tonne
US Ethanol Production Corn price Soybeans price
US raises use of ethanol to 36 billion/g by 2022 and 1 billion biodiesel by 2012
US increasesuse of renewable fuels of 7.5 billion/g by 2012
EU increases biofuelshare in transport by
2010 and 2020
Source: Author's construction based on IMF Primary Commodity Database and Renewable Fuels Association. Information for mandates is from Table 3. Notes: Ethanol production is for the United States. Prices refer to Maize (corn), U.S. No.2 Yellow, FOB Gulf of Mexico, U.S. price (average of daily quotations); Soybeans, U.S. soybeans, Chicago Soybean futures contract (first contract forward) No. 2 yellow and par (average of daily quotations).

29
Figure 5. Gasoline prices and U.S. ethanol production, 1995-2007
Source: Elliott (2008).
0
1000
2000
3000
4000
5000
6000
7000
1995 1996 1997 1998 1999 2000 2001 2002 2003 2004 2005 2006 2007
Million gallons
0
0.5
1
1.5
2
2.5
3
$/gallon
Ethanol production Unleaded regular
Indicates 2005 Energy Act biofuel mandate level
California, NY begin to phase out/ban MTBE in gasoline

30
Figure 6. The Dollar and Food Commodities Prices, January 2000-October 2008
30
70
110
150
190
230
M1 2000
M4 2000
M7 2000
M10 2000
M1 2001
M4 2001
M7 2001
M10 2001
M1 2002
M4 2002
M7 2002
M10 2002
M1 2003
M4 2003
M7 2003
M10 2003
M1 2004
M4 2004
M7 2004
M10 2004
M1 2005
M4 2005
M7 2005
M10 2005
M1 2006
M4 2006
M7 2006
M10 2006
M1 2007
M4 2007
M7 2007
M10 2007
M1 2008
M4 2008
M7 2008
M10 2009
Food prices REER
Source: Author’s construction based on data from the International Financial Statistics, IMF. Notes: The real effective exchange rate (RER) refers to the US real exchange rate (2000=100) based on RNULC (Relative Normalised Unit Labour Cost). Food prices refer to a food commodities price index (2000=100).

31
Figure 7. Non-fuel Commodity Prices in Major Currencies, January 2000-October 2008
60
80
100
120
140
160
180
200
220
Jan‐00
May‐00
Sep‐00
Jan‐01
May‐01
Sep‐01
Jan‐02
May‐02
Sep‐02
Jan‐03
May‐03
Sep‐03
Jan‐04
May‐04
Sep‐04
Jan‐05
May‐05
Sep‐05
Jan‐06
May‐06
Sep‐06
Jan‐07
May‐07
Sep‐07
Jan‐08
May‐08
Sep‐08
US dollars Euros Yen Canadian dollars
Source: Author’s construction with data from IFS, IMF for prices and OECD Stat for exchange rates.

32
Figure 8. Monetary Policy in the U.S. and Food Commodities Prices, June 2006- November 2008
100
150
200
250
300
350
400
450
500
550
Jun‐06
Jul‐06
Aug‐06
Sep‐06
Oct‐06
Nov‐06
Dec‐06
Jan‐07
Feb‐07
Mar‐07
Apr‐07
May‐07
Jun‐07
Jul‐07
Aug‐07
Sep‐07
Oct‐07
Nov‐07
Dec‐07
Jan‐08
Feb‐08
Mar‐08
Apr‐08
May‐08
Jun‐08
Jul‐08
Aug‐08
Sep‐08
Oct‐08
Nov‐08
US$
per metric tonne
Maize Soybeans Wheat
Oct31 0.25 ↓
Jan210.75 ↓Jan300.5 ↓
Dec11 0.25 ↓
Mar16 0.25 ↓Mar18 0.75 ↓
Apr300.25 ↓
Sep180.5 ↓
Aug170.5 ↓
Oct 080.5 ↓Oct 290.5 ↓
Source: Author’s construction based on data from the IMF Primary Commodity Prices Database and Federal Reserve. Notes: Vertical lines shows periods in which the Fed's primary credit rate was lowered as specified in the graph's text. The primary credit rate fell from 6.25 in June 2007 to 2.25 in June 2008 and further to 1.25 at the end of October (the discount rate is the interest rate charged by the Fed to commercial banks and other depository institutions on short-term loans (overnight)). The federal funds rate started to fall in August 2007 (after stability since mid-2006) from 5.02 to 2.01 by July 2008; at the end of October 2008 it was 1.00 (“the federal funds rate is the interest rate at which depository institutions lend balances at the Federal Reserve to other depository institutions overnight”; for more information visit www.federalreserve.gov). IMF prices for each product refer to: (i) Maize (corn), U.S. No.2 Yellow, FOB Gulf of Mexico, U.S. price (average of daily quotations); (ii) Soybeans, U.S. soybeans, Chicago Soybean futures contract (first contract forward) No. 2 yellow and par (average of daily quotations); (iii) Wheat, No.1 Hard Red Winter, ordinary protein, FOB Gulf of Mexico (average of daily quotations).

33
Figure 9a. Policy Measures to Contain Price Increases
Source: Author’s construction with information from the World Bank (2008d) and expanded with Trostle (2008), ADB (2008) and World Bank (2008e). Figure 9b. Policy Measures to Contain Price Increases: Sub-Saharan Africa and Rest of the World
Figure 3. Food Price Policies of African countries and the rest of the world
0%
10%
20%
30%
40%
50%
Reducefoodgrain taxes
Increasefoodgrain stocks
Exportrestrictions
Price controls/consumersubsidies
None
Source: Data based on responses from 118 country teams
Per
cent
age
of c
ount
ries
% of 47 African countries % of 71 countries outside of Africa
Source: Wodon and Zaman (2008)
56
34
55
Reduced taxes/tariffs or relaxed import restrictions
Export bans, restrictions and taxes
Price Controls/Consumer Subsidies

34
Figure 10. Export Restrictions and the Price of Rice, June 2007-July 2008
200
400
600
800
1000
Jun‐07
Jul‐07
Aug‐07
Sep‐07
Oct‐07
Nov‐07
Dec‐07
Jan‐08
Feb‐08
Mar‐08
Apr‐08
May‐08
Jun‐08
Jul‐08
US$
per metric tonne
India imposes export restrictions
Vietnam tightensexport restrictions
Philippines March tender>$700/ton
Philippines April tender>$1,100/ton
Japan announces release of rice
stocks
Source: IMF Primary Commodity Prices Database. Export policies from Slayton and Timmer (2008) and Timmer (2008). Based on a graph by Slayton and Timmer (2008).

35
Figure 11. Median Inflation in 120 non-OECD countries (y-o-y, in percent)
Source: IMF (2008).

36
Figure 12. The Food Crisis: Safety Nets in Low and Middle-Income Countries
Source: Author’s construction with information from the World Bank (2008d) and expanded with ADB (2008) and World Bank (2008e). Income classification data from the World Bank. The World Bank classifies 49 countries as low-income and 95 as middle-income; in the graph are those countries that implemented one or more programs (30 low income and 46 middle income countries ).
16
21
8
24
37
812
31
53
29
20
55Cash Transfer
Food for Work
Food ration/stamp
School feeding
Cash Transfer
Food for Work
Food ration/stamp
School feeding
Cash Transfer
Food for Work
Food ration/stamp
School feeding
LOW INCOME MIDDLE INCOME TOTAL

37
References
Abbott, Philip C.; Christopher Hurt and Wallace E. Tyner (2008) “What’s Driving Food Prices”. Issue Report, Farm Foundation.
Ackah, Charles and Simon Appleton (2007) "Food Price Changes and Consumer Welfare in Ghana in the 1990s." Discussion Papers 07/03, University of Nottingham, CREDIT.
Asian Development Bank (2008) “Food Prices and Inflation in Developing Asia: Is Poverty Reduction Coming to an End?” Special Report, Asian Development Bank.
Aksoy, M. Ataman and Aylin Isik-Dikmelik (2008) “Are Low Food Prices Pro-Poor? Net Food Buyers and Sellers in Low-Income Countries.” Policy Research Working Paper 4642, The World Bank.
Baffes, John (1997) “Explaining Stationary Variable with Non-stationary Regressors.” Applied Economics Letters, 4(1997):69-75.
Barrett, Christopher B. and Paul A. Dorosh (1996) “Farmers' Welfare and Changing Food Prices: Nonparametric Evidence from Rice in Madagascar.” American Journal of Agricultural Economics, Vol. 78, No. 3: 656-669.
Calvo, Guillermo (2008) “Exploding commodity prices, lax monetary policy, and sovereign wealth funds.” VOX, June 20th. Available at: http://www.voxeu.org/index.php?q=node/1244.
Comision Economica para America Latina y el Caribe, CEPAL (2008) “Latin America and the Caribbean in the New International Economic Environment.” Report of the Comision Economica para America Latina y el Caribe (Economic Commission for Latin America and the Caribbean.)
Collins, Keith (2008) “The Role of Biofuels and Other Factors in Increasing Farm and Food Prices: A Review of Recent Development with a Focus on Feed Grain Markets and Market Prospects.” Supporting material for a review conducted by Kraft Foods Global, Inc. of the current situation in farm and food markets, June. Unpublished document.
Deaton, Angus (1989) “Rice Prices and Income Distribution in Thailand: A Non-Parametric Analysis.” The Economic Journal, Vol. 99, No. 395, Supplement: Conference Papers: 1-37.
De Janvry, Alain, Sadoulet, Elisabeth and Vakis, Renos (2008) “Protecting Vulnerable Children from Uninsured Risks: A New Role for Conditional Cash Transfer Programs?,” University of California at Berkeley and The World Bank, December, mimeo. Dervis, Kemal (2008) “Q & A with Kemal Dervis, head of the UN Development Program.” In “Managing Globalization” (Blog) by Daniel Altman, August 13th, International Herald Tribune. Dessus, Sebastien, Santiago Herrera, and Rafael de Hoyos (2008) “The Impact of Food Inflation on Urban Poverty and Its Monetary Cost: Some Back-of-the-Envelope Calculations?,” World Bank Policy Research Working Paper 4666, Washington, DC.
Elliott, Kimberly (2008) “Biofuels and the Food Price Crisis: A Survey of the Issues.” Working Paper Number 151, Center for Global Development.

38
Fleshman, Michael (2008) “Africa struggles with soaring food prices. From emergency reactions to farming investments.” Africa Renewal, Vol.22 #2 (July): 12. Available at: http://www0.un.org/ecosocdev/geninfo/afrec/vol22no2/222-africa-struggles-with-food-prices.html.
Frankel, Jeffrey (2006) “The Effect of Monetary Policy on Real Commodity Prices.” Working Paper 12713, National Bureau of Economic Research.
Frankel, Jeffrey (1986) “Expectations and Commodity Price Dynamics: The Overshooting Model." American Journal of Agricultural Economic, 68, no. 2: 344-348.
Frankel, Jeffrey (2008a) “Fed Modesty Regarding Its Role in High Commodity Prices.” Jeff Frankel’s Weblog, May 21st. Available at: http://content.ksg.harvard.edu/blog/jeff_frankels_weblog/category/commodities/.
Frankel, Jeffrey (2008b) “An Explanation for Soaring Commodity Prices.” VOX, March 25th. Available at: http://www.voxeu.org/index.php?q=node/1002.
Frankel, Jeffrey (2008c) “Monetary policy and commodity prices.” VOX, March 29th. Available at: http://www.voxeu.org/index.php?q=node/1178.
Gately, Dermot and Hillard G. Huntington (2001) “The Asymmetric Effects of Changes in Price and Income on Energy and Oil Demand.” Economics Research Report, C.V. Starr Center for Applied Economics, New York University.
Gilbert, Christopher (1989) “The Impact of Exchange Rate Changes and Developing Country Debt on Commodity Prices.” Economic Journal, 99:773-784.
Haq, Zahoor ul; Nazli, Hina; Meilke, Karl (2008) “Implications of high food prices for poverty in Pakistan,” Agricultural Economics, Volume 39, Supplement 1, Special issue on the world food crisis, pp. 477-484(8).
International Food Policy Research Institute (2003) “A Level Playing Field for Poor Farmers.” Ifpri Forum, March.
International Monetary Fund (2008) “Food and Fuel Prices—Recent Developments, Macroeconomic Impact, and Policy Responses.” Prepared by the Fiscal Affairs, Policy Development and Review, and Research Departments. International Monetary Fund Report.
Ivanic, Maros and Will Martin (2008a) “Implications of higher global food prices for poverty in low-income countries.” Policy Research Working Paper Series 4594, The World Bank.
Ivanic, Maros and Will Martin (2008b) “The Food Price Crisis, Poverty and Agricultural Trade Policy,” mimeo, World Bank, October.
Ivanic , Marcos, Will Martin, Aaditya Mattoo and Arvind Subramanian (2008) “Likely Consequences of Attempted Price Insulation in the Global Agricultural Markets,” mimeo, World Bank.
Krugman, Paul (2008) “Commodities and speculation: metallic (and other) evidence.” New York Times’ Blog, April 20th.
Latin American Shadow Financial Regulatory Committee, CLAAF (2008) “Sailing in a Stormy Sea: Latin America’s Response to Global Financial Turmoil and the Food Price Crisis.” CLAAF Statement 18, May 21st.

39
Lin, Justin (2008) Remarks presented at “Preparing For The Next Global Food Price Crisis,” Center For Global Development, Washington, Dc, October 6. Lipsky, John (2008) “Commodity Prices and Global Inflation.” Remarks at the Council on Foreign Relations, New York City, May 8. Lustig, Nora (1986) “Food Subsidy Programs in Mexico.” Working Paper No. 3, International Food Policy Research Institute, Washington, D.C., January. Lustig, Nora (2008) “Thought for Food: the Causes and Consequences of Rising Food Prices,” Working Paper 155, Center for Global Development, Washington, DC. McPhail, Lihong Lu and Bruce A. Babcock (2008) “Short-Run Price and Welfare Impacts of Federal Ethanol Policies.” Working Paper 08-WP 468, Center for Agricultural and Rural Development, Iowa State University. Mellor, J. W. (1978) “Food Price Policy and Income Distribution in Low-Income Countries.” Economic Development and Cultural Change, 1: 1-26. Mitchell, Donald (2008) “A Note on Rising Food Prices”. Policy Research Working Paper 4682. The World Bank. Mundell, Robert (2002) “Commodity Prices, Exchange Rates and the International Monetary System.” Consultation on Agricultural Commodity Price Problems, Food and Agriculture Organization. Naylor, Rosamond L. and Walter P. Falcon (2008) “A New Variety of Food Crisis.” Unpublished document. Organization for Economic Co-operation and Development (2008) “Economic Assessment of Biofuel Support Policies.” Report of the Directorate for Trade and Agriculture, Organization for Economic Co-operation and Development. Pinstrup-Andersen (1987) “Food Prices and the Poor.” In J. Price Gittinger, Joanne Leslie and Caroline Joisington “Food Policy. Integrating Supply, Distribution and Consumption”, Johns Hopkins University Press. Ravallion, M. (1989) "Do Price Increases for Staple Foods Help or Hurt the Rural Poor." PPR working Paper WPS 167, World Bank, Washington D.C. Ravallion, M., and D. van de Walle (1991) “The impact on poverty of food pricing reforms: A welfare analysis for Indonesia.” Journal of Policy Modeling 13 (2): 281–299. Ravallion, Martin (1990) “Rural Welfare Effects of Food Price Changes Under Induced Wage Responses: Theory and Evidence for Bangladesh.” Oxford Economic Papers. Oxford: Jul 1990. Vol. 42, Iss. 3: 574 (12 pages). Revenga, Ana (2008) “Rising food prices: Policy options and World Bank response,” World Bank, mimeo. http://www.google.com/search?q=revenga+food+prices&ie=utf-8&oe=utf-8&aq=t&rls=org.mozilla:en-US:official&client=firefox-a Robles, Marcos; Jose Cuesta; Suzanne Duryea; Ted Enamorado; Alberto Gonzales, and Victoria Rodríguez (2008) “Rising Food Prices and Poverty in Latin America: Effects of the 2006-2008 Price Surge.” Inter-American Development Bank.

40
Rojas-Suarez, Liliana (2008) “The Right Response in Latin America to Oil and Food Price Pressures: Fight Inflation Now!” Essay, Center for Global Development.
Rosegrant, Mark W.; Tingju Zhu; Siwa Msangi; Timothy Sulser (2008) “Biofuels and Cereal Prices: How Much has Growth in Biofuel Production Influenced World Cereal Prices?” International Food Policy Research Institute. Unpublished document.
Slayton, Tom and Peter Timmer (2008) "Japan, China and Thailand Can Solve the Rice Crisis-but US leadership is needed." CGD Notes, Center for Global Development.
Timmer, C.; W. Falcon, and S. Pearson (1983) “Food Policy Analysis.” Johns Hopkins University Press, 1983: 1- 301.
Timmer, Peter (2008) “The causes of high food prices.” Unpublished document.
Trairatvorakul (1984) “The Effects on Income Distribution and Nutrition of Alternative Rice Price Policies in Thailand.” Research Report 46, International Food Policy Research Institute, November 1984.
Valero-Gil, Jorge N. and Magali Valero (2008) “The effects of rising food prices on poverty in Mexico,” Agricultural Economics, Volume 39, Supplement 1, Special issue on the world food crisis pp. 485-496(12). Von Braun, Joachim (2008a) “Biofuels, International Food Prices, and the Poor.” International Food Policy Research Institute, Testimony to the United States Senate Committee on Energy and Natural Resources, June 12th. Von Braun, Joachim (2008b) “High Food Prices and the Impacts on the Poor in Latin America.” Presentation at the Inter-American Dialogue, Washington D.C., July 21, International Food Policy Research Institute.
Von Braun, Joachim et al. (2008a) “High Food Prices: The What, Who, and How of Proposed Policy Actions.” Policy Brief, International Food Policy Research Institute.
Von Braun, Joachim et al. (2008b) “Rising Food Prices: What Should Be Done?” Policy Brief, International Food Policy Research Institute.
Warr, Peter (2008) “World food prices and poverty incidence in a food exporting country: a multihousehold general equilibrium analysis for Thailand” Agricultural Economics, Volume 39, Supplement 1, Special issue on the world food crisis, pp. 525-537(13). Wodon, Quentin et al. (2008) “The Food Price Crisis in Africa: Impact On Poverty And Policy Responses.” World Bank (mimeo).
Wodon, Q. and Zaman, H. (2008), ‘Poverty impact of higher food prices in sub-Saharan Africa and policy responses’ Mimeo, World Bank.
World Bank (2007) “World Development Report 2008: Agriculture for Development.” World Development Report, The World Bank.
World Bank (2008a) “Rising Global Food Prices.” The World Bank’s Latin America and Caribbean Region Position Paper. Washington, DC: World Bank.
World Bank (2008b) “Addressing the Food Crisis: The Need for Rapid and Coordinated Action.” Background Paper for the G8 Ministers of Finance Meeting. Washington, DC: World Bank.

41
World Bank (2008c) Global Economic Prospects 2009. Commodities at a Crossroads, Washington, DC.
World Bank (2008d) “Double Jeopardy: Responding to High Food and Fuel Prices.” G8 Hokkaido-Toyako Summit. Washington, DC: World Bank.
World Bank (2008e) "Food Price Inflation and its Effects on Latin America and the Caribbean." Washington, DC: World Bank.