Chapter 10 Inference on Two Samples 10.4 Inference on Two Population Standard Deviations.
Upload
travon-hallingCategory
view
214download
0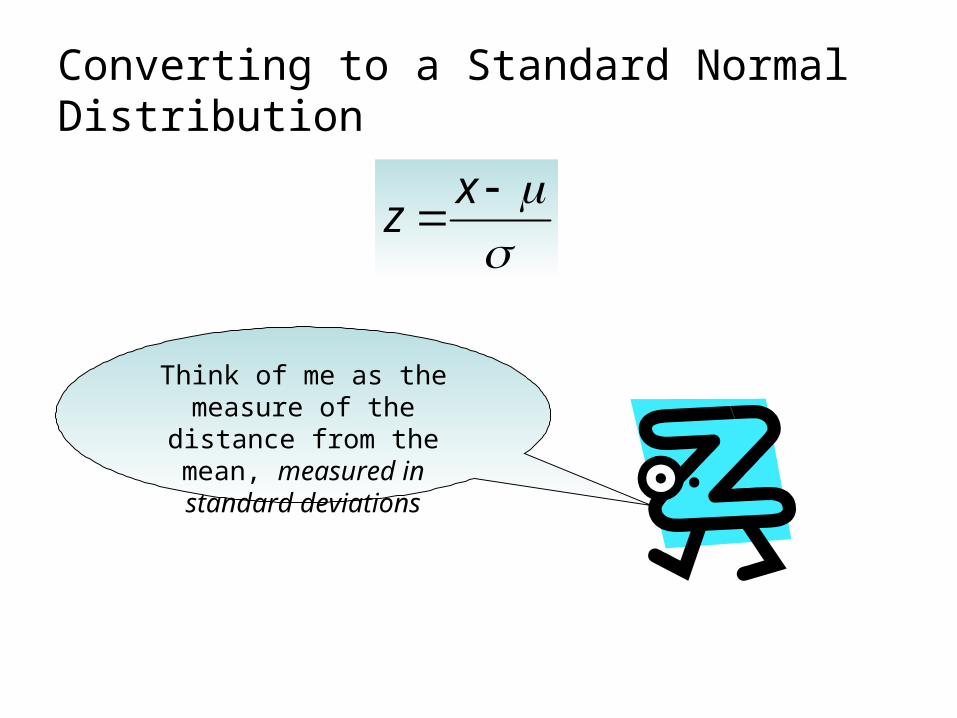
Converting to a Standard Normal Distribution
x
z
Think of me as the measure of the distance
from the mean, measured in standard deviations

is used to compute the is used to compute the zz value value given a cumulative probability.given a cumulative probability.
is used to compute the is used to compute the zz value value given a cumulative probability.given a cumulative probability.
NORMSINVNORMSINVNORMSINVNORMSINVNORM S INVNORM S INV
is used to compute the cumulativeis used to compute the cumulative probability given a probability given a zz value. value.
is used to compute the cumulativeis used to compute the cumulative probability given a probability given a zz value. value.NORMSDISTNORMSDISTNORMSDISTNORMSDISTNORM S DISTNORM S DIST
Using Excel to ComputeUsing Excel to ComputeStandard Normal ProbabilitiesStandard Normal Probabilities
Excel has two functions for computing Excel has two functions for computing probabilities and probabilities and zz values for a values for a standardstandard normal distribution:normal distribution:
(The “S” in the function names reminds(The “S” in the function names remindsus that they relate to the us that they relate to the standardstandardnormal probability distribution.)normal probability distribution.)

Formula WorksheetFormula Worksheet
Using Excel to ComputeUsing Excel to ComputeStandard Normal ProbabilitiesStandard Normal Probabilities
A B12 3 P (z < 1.00) =NORMSDIST(1)4 P (0.00 < z < 1.00) =NORMSDIST(1)-NORMSDIST(0)5 P (0.00 < z < 1.25) =NORMSDIST(1.25)-NORMSDIST(0)6 P (-1.00 < z < 1.00) =NORMSDIST(1)-NORMSDIST(-1)7 P (z > 1.58) =1-NORMSDIST(1.58)8 P (z < -0.50) =NORMSDIST(-0.5)9
Probabilities: Standard Normal Distribution

Value WorksheetValue Worksheet
Using Excel to ComputeUsing Excel to ComputeStandard Normal ProbabilitiesStandard Normal Probabilities
A B12 3 P (z < 1.00) 0.84134 P (0.00 < z < 1.00) 0.34135 P (0.00 < z < 1.25) 0.39446 P (-1.00 < z < 1.00) 0.68277 P (z > 1.58) 0.05718 P (z < -0.50) 0.30859
Probabilities: Standard Normal Distribution

Formula WorksheetFormula Worksheet
Using Excel to ComputeUsing Excel to ComputeStandard Normal ProbabilitiesStandard Normal Probabilities
A B
12 3 z value with .10 in upper tail =NORMSINV(0.9)4 z value with .025 in upper tail =NORMSINV(0.975)5 z value with .025 in lower tail =NORMSINV(0.025)6
Finding z Values, Given Probabilities

Value WorksheetValue Worksheet
A B
12 3 z value with .10 in upper tail 1.284 z value with .025 in upper tail 1.965 z value with .025 in lower tail -1.966
Finding z Values, Given Probabilities
Using Excel to ComputeUsing Excel to ComputeStandard Normal ProbabilitiesStandard Normal Probabilities
Example: Pep Zone• Standard Normal Probability Distribution
Pep Zone sells auto parts and supplies
including a popular multi-grade motor
oil. When the stock of this oil drops to
20 gallons, a replenishment order is
placed.
PepZone5w-20Motor Oil

Example: Pep ZoneExample: Pep Zone
Standard Normal Probability DistributionStandard Normal Probability Distribution
The store manager is concerned that The store manager is concerned that sales are being lost due to stockouts while sales are being lost due to stockouts while waiting for an order. It has been determined waiting for an order. It has been determined that demand during replenishment lead time is that demand during replenishment lead time is normally distributed with a mean of 15 gallons normally distributed with a mean of 15 gallons and a standard deviation of 6 gallons. and a standard deviation of 6 gallons.
The manager would like to know the The manager would like to know the probability of a stockout, probability of a stockout, PP((xx > 20). > 20).
PepZone5w-20
Motor Oil
Solving for Stockout Probability PepZone5w-20
Motor Oil
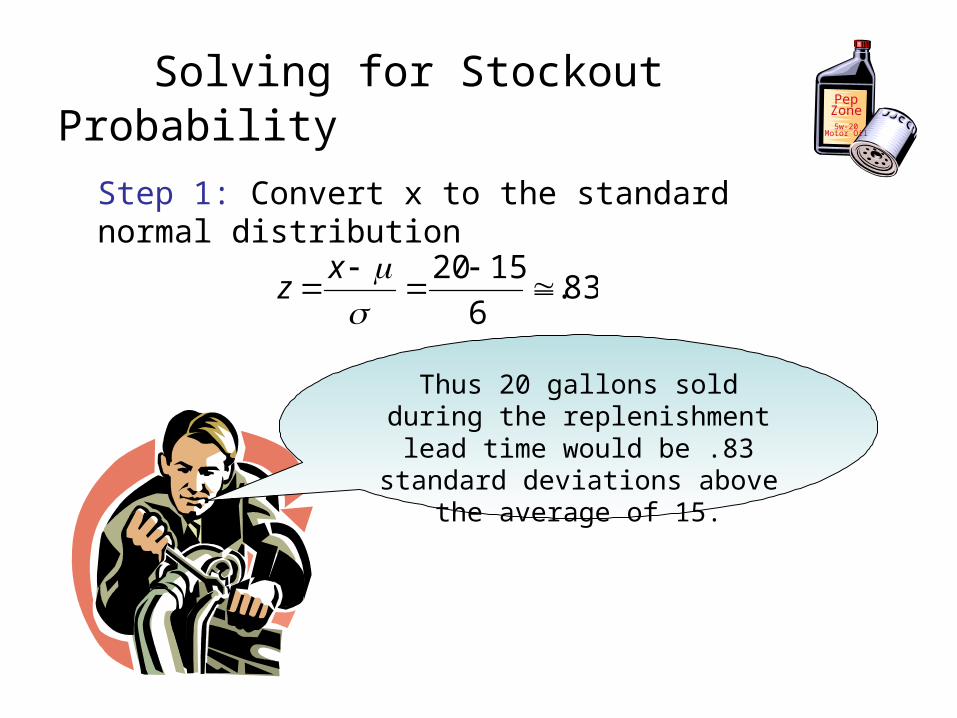
Step 1: Convert x to the standard normal distribution
83.6
1520
x
z
Thus 20 gallons sold during the replenishment lead time would be .83 standard deviations above the
average of 15.

Solving for Stockout Probability:Step 2 Pep
Zone5w-20
Motor Oil
Now we need to find the area under the curve to the left of z
= .83. This will give us the probability that x ≤ 20 gallons.
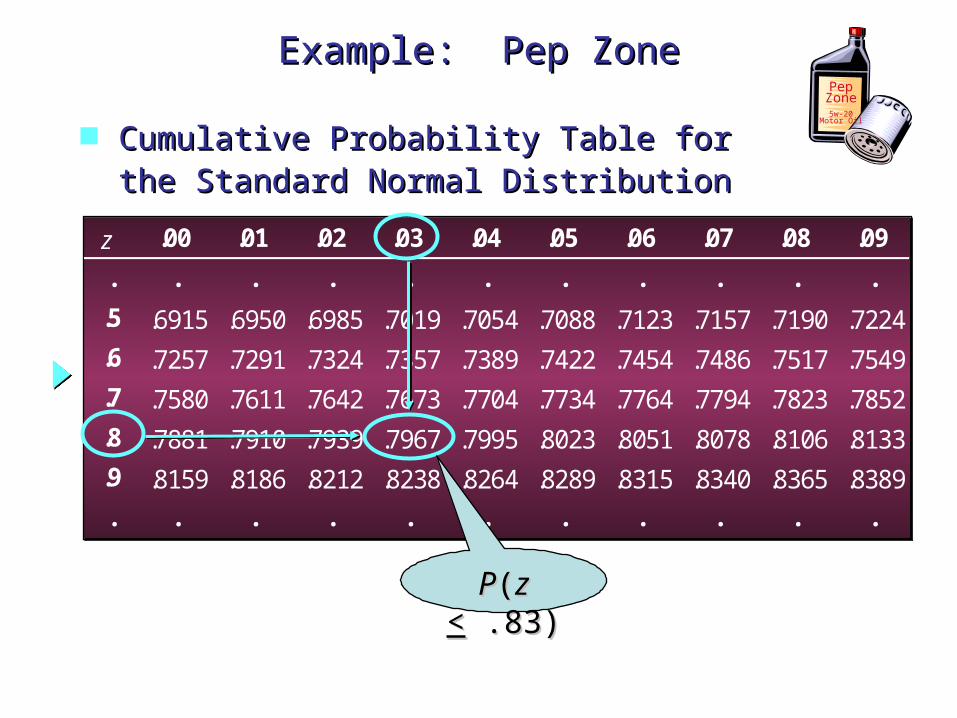
Cumulative Probability Table for Cumulative Probability Table for the Standard Normal Distributionthe Standard Normal Distribution
z .00 .01 .02 .03 .04 .05 .06 .07 .08 .09
. . . . . . . . . . .
.5 .6915 .6950 .6985 .7019 .7054 .7088 .7123 .7157 .7190 .7224
.6 .7257 .7291 .7324 .7357 .7389 .7422 .7454 .7486 .7517 .7549
.7 .7580 .7611 .7642 .7673 .7704 .7734 .7764 .7794 .7823 .7852
.8 .7881 .7910 .7939 .7967 .7995 .8023 .8051 .8078 .8106 .8133
.9 .8159 .8186 .8212 .8238 .8264 .8289 .8315 .8340 .8365 .8389
. . . . . . . . . . .
Example: Pep ZoneExample: Pep ZonePep
Zone5w-20
Motor Oil
PP((zz << .83) .83)

PP((z z > .83) = 1 – > .83) = 1 – PP((zz << .83) .83) = 1- .7967= 1- .7967
= .2033= .2033
PP((z z > .83) = 1 – > .83) = 1 – PP((zz << .83) .83) = 1- .7967= 1- .7967
= .2033= .2033
Solving for the Stockout ProbabilitySolving for the Stockout Probability
Example: Pep ZoneExample: Pep Zone
Step 3: Compute the area under the standard normalStep 3: Compute the area under the standard normal curve to the right of curve to the right of zz = .83. = .83.Step 3: Compute the area under the standard normalStep 3: Compute the area under the standard normal curve to the right of curve to the right of zz = .83. = .83.
PepZone5w-20
Motor Oil
ProbabilityProbability of a of a
stockoutstockoutPP((xx > > 20)20)

Solving for the Stockout ProbabilitySolving for the Stockout Probability
Example: Pep ZoneExample: Pep Zone
00 .83.83
Area = .7967Area = .7967Area = 1 - .7967Area = 1 - .7967
= .2033= .2033
zz
PepZone5w-20
Motor Oil
If the manager of Pep Zone wants the probability of a stockout to be no more than .05, what should the reorder point be?
Example: Pep Zone PepZone5w-20
Motor Oil

Solving for the Reorder PointSolving for the Reorder Point
Example: Pep ZoneExample: Pep ZonePep
Zone5w-20
Motor Oil
00
Area = .9500Area = .9500
Area = .0500Area = .0500
zzzz.05.05
Solving for the Reorder PointSolving for the Reorder Point
Example: Pep ZoneExample: Pep ZonePep
Zone5w-20
Motor Oil
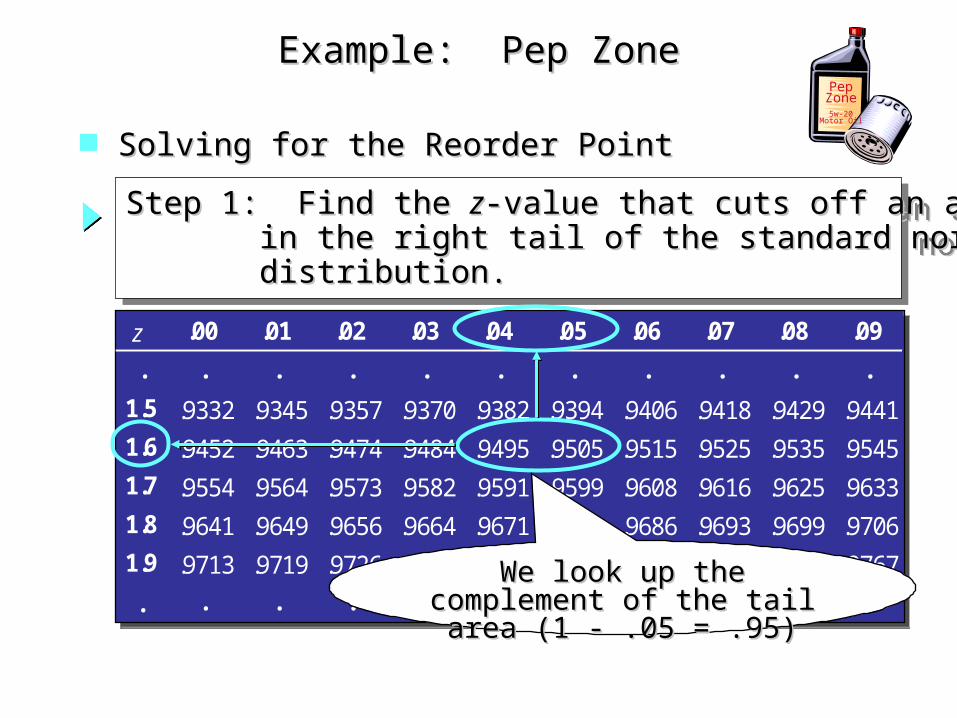
Step 1: Find the Step 1: Find the zz-value that cuts off an area of .05-value that cuts off an area of .05 in the right tail of the standard normalin the right tail of the standard normal distribution.distribution.
Step 1: Find the Step 1: Find the zz-value that cuts off an area of .05-value that cuts off an area of .05 in the right tail of the standard normalin the right tail of the standard normal distribution.distribution.
z .00 .01 .02 .03 .04 .05 .06 .07 .08 .09
. . . . . . . . . . .
1.5 .9332 .9345 .9357 .9370 .9382 .9394 .9406 .9418 .9429 .9441
1.6 .9452 .9463 .9474 .9484 .9495 .9505 .9515 .9525 .9535 .9545
1.7 .9554 .9564 .9573 .9582 .9591 .9599 .9608 .9616 .9625 .9633
1.8 .9641 .9649 .9656 .9664 .9671 .9678 .9686 .9693 .9699 .9706
1.9 .9713 .9719 .9726 .9732 .9738 .9744 .9750 .9756 .9761 .9767
. . . . . . . . . . .
z .00 .01 .02 .03 .04 .05 .06 .07 .08 .09
. . . . . . . . . . .
1.5 .9332 .9345 .9357 .9370 .9382 .9394 .9406 .9418 .9429 .9441
1.6 .9452 .9463 .9474 .9484 .9495 .9505 .9515 .9525 .9535 .9545
1.7 .9554 .9564 .9573 .9582 .9591 .9599 .9608 .9616 .9625 .9633
1.8 .9641 .9649 .9656 .9664 .9671 .9678 .9686 .9693 .9699 .9706
1.9 .9713 .9719 .9726 .9732 .9738 .9744 .9750 .9756 .9761 .9767
. . . . . . . . . . .We look up the We look up the
complement of the tail complement of the tail area (1 - .05 = .95)area (1 - .05 = .95)
Solving for the Reorder Point
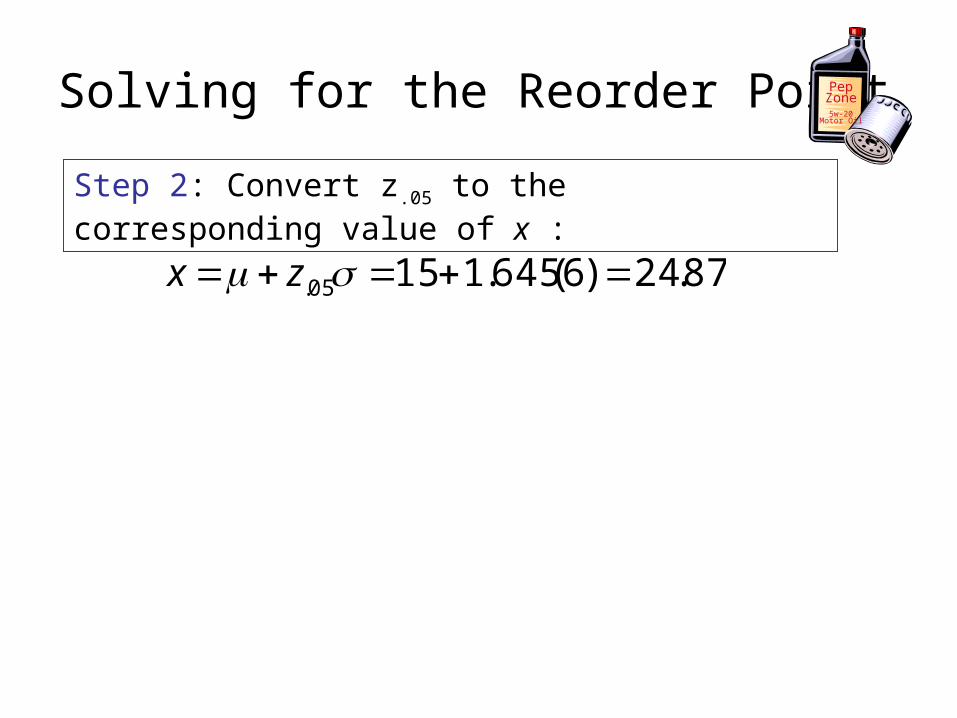
Step 2: Convert z.05 to the corresponding value of x :
87.24)6(645.11505. zx
PepZone5w-20
Motor Oil
Solving for the Reorder Point
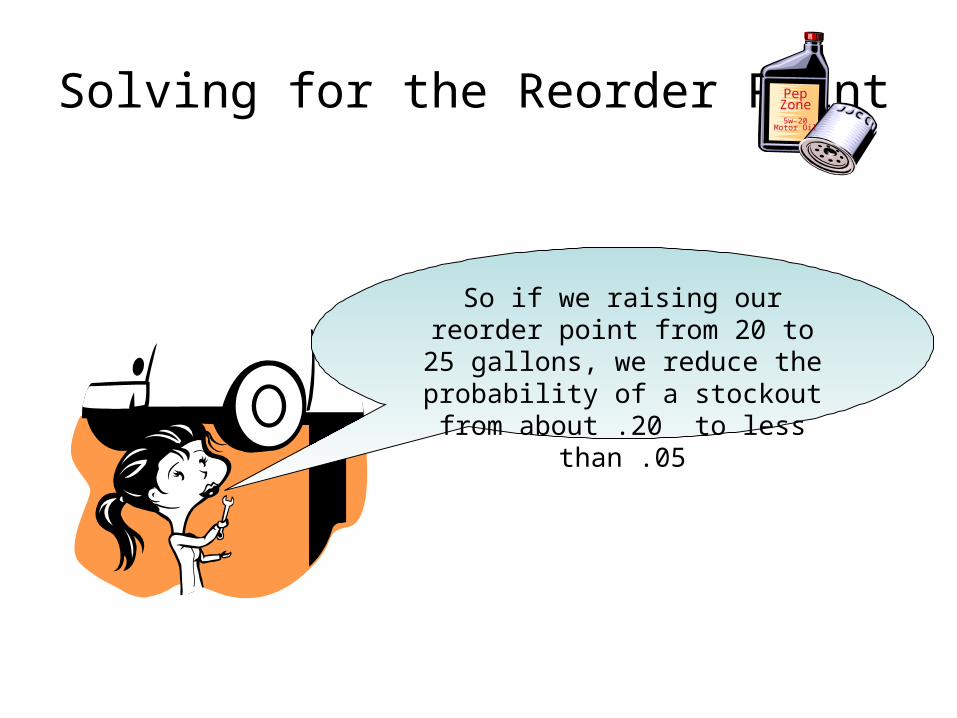
So if we raising our reorder point from 20 to 25 gallons, we reduce the probability of a stockout from
about .20 to less than .05
PepZone5w-20
Motor Oil

Using Excel to ComputeUsing Excel to ComputeNormal ProbabilitiesNormal Probabilities
Excel has two functions for computing Excel has two functions for computing cumulative probabilities and cumulative probabilities and xx values for values for anyany normal distribution:normal distribution:
NORMDISTNORMDIST is used to compute the cumulative is used to compute the cumulativeprobability given an probability given an xx value. value.NORMDISTNORMDIST is used to compute the cumulative is used to compute the cumulativeprobability given an probability given an xx value. value.
NORMINVNORMINV is used to compute the is used to compute the xx value given value givena cumulative probability.a cumulative probability.NORMINVNORMINV is used to compute the is used to compute the xx value given value givena cumulative probability.a cumulative probability.
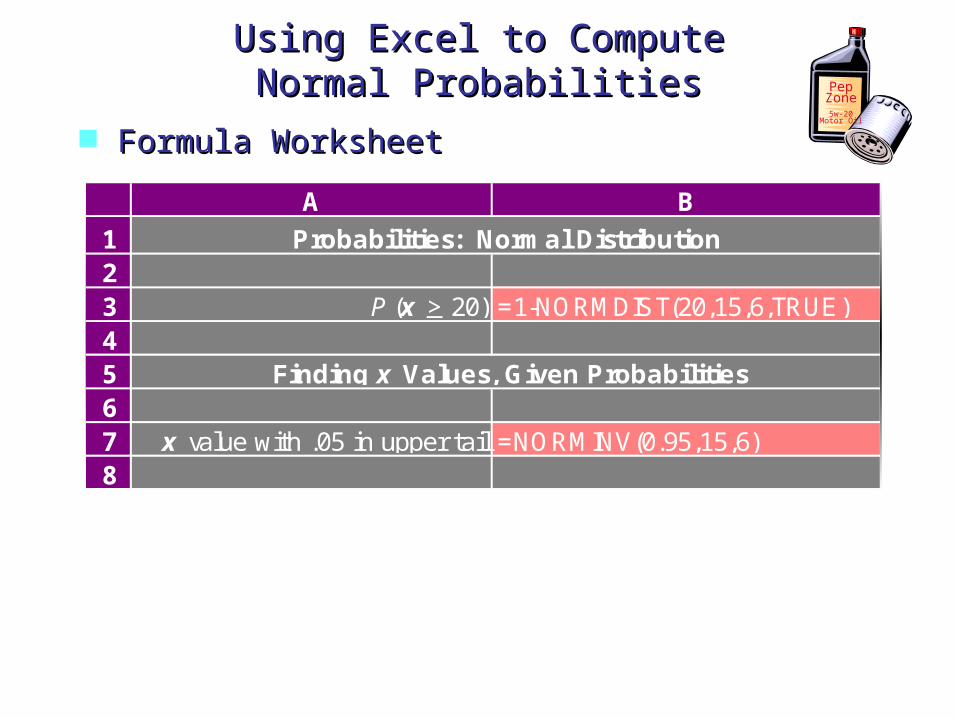
Formula WorksheetFormula Worksheet
Using Excel to ComputeUsing Excel to ComputeNormal ProbabilitiesNormal Probabilities
A B
12 3 P (x > 20) =1-NORMDIST(20,15,6,TRUE)4 56 7 x value with .05 in upper tail =NORMINV(0.95,15,6)8
Probabilities: Normal Distribution
Finding x Values, Given Probabilities
PepZone5w-20
Motor Oil

Value WorksheetValue Worksheet
Using Excel to ComputeUsing Excel to ComputeNormal ProbabilitiesNormal Probabilities
Note: P(Note: P(xx >> 20) = .2023 here using Excel, while our 20) = .2023 here using Excel, while our previous manual approach using the previous manual approach using the zz table yielded table yielded .2033 due to our rounding of the .2033 due to our rounding of the zz value. value.
A B
12 3 P (x > 20) 0.20234 56 7 x value with .05 in upper tail 24.878
Probabilities: Normal Distribution
Finding x Values, Given Probabilities
PepZone5w-20
Motor Oil

Exercise 18, p. 261
The average time a subscriber reads the Wall Street Journal is 49 minutes. Assume the standard deviation is 16 minutes and that reading times are normally distributed.
a) What is the probability a subscriber will spend at least one hour reading the Journal?
b) What is the probability a reader will spend no more than 30 minutes reading the Journal?
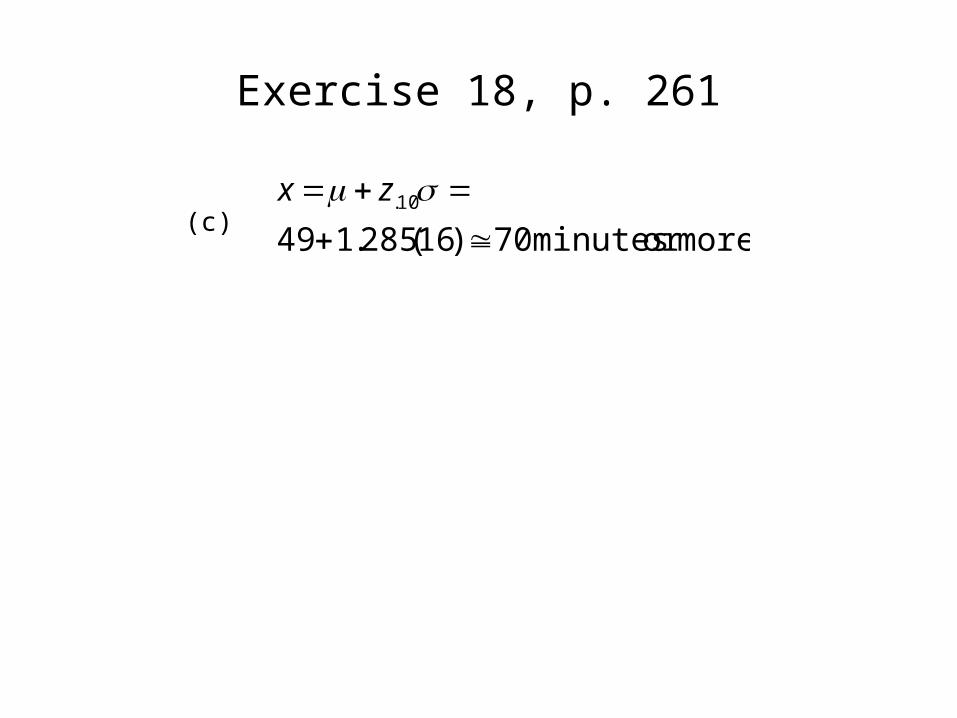
c) For the 10 percent who spend the most time reading the Journal, how much time do they spend?

Exercise 18, p. 261
6875.16
4960
x
z
a) Convert x to the standard normal distribution:
Thus one who read 560 minutes would be .69 from the mean. Now find P(z ≤ .6875). P(z ≤ .69)= .7549.Thus P(x > 60 minutes) = 1 - .7549 = .2541.
b) Convert x to the standard normal distribution
19.116
4930
z

P(x ≤ 30 minutes)P(x ≤ 30 minutes)
00zz
1.191.19-1.19-1.19
Red-shaded area is equal to blue shaded area
117.8830.1
)19.1(1)19.1(
zPzP
Thus:
P(x < 30 minutes) = .117
Exercise 18, p. 261
moreor minutes 70)16(285.14910.
zx
(c)