
CONVERTIBLES EUROPE RESPONSABLE
37
Annual report and audited financial accounts as at 31 December 2014 CONVERTIBLES EUROPE RESPONSABLE FCP – Mutual Fund under French law
Transcript of CONVERTIBLES EUROPE RESPONSABLE
Annual report and audited financial accounts
as at 31 December 2014
CONVERTIBLES EUROPE RESPONSABLE
FCP – Mutual Fund under French law

CONVERTIBLES EUROPE RESPONSABLE Annual report
Subscriptions are only valid if made on the basis of the current prospectus, the Key Investor Information Document (KIID), accompanied by the latest annual report and the most recent half-yearly report, if the latter was published after the annual report.
No party may provide information other than that appearing in this prospectus, or in the other documents referred to in the prospectus and which is available to the public.
CONVERTIBLES EUROPE RESPONSABLE Annual report
3
Contents
CONVERTIBLES EUROPE RESPONSABLE
Information concerning investments and management 4
Changes concerning the Fund 10
Management report 11
Regulatory information 15
Report of the statutory auditor 16
Annual Accounts
Balance sheet - Assets 19
Balance sheet - Liabilities 20
Off-balance sheet 21
Profit and loss statement 22
Notes to the annual accounts 23
ADDITIONAL INFORMATION FOR INVESTORS IN THE FEDERAL REPUBLIC OF GERMANY 38
4
CONVERTIBLES EUROPE RESPONSABLE Annual report
Information concerning investments and management
LEGAL FORM Fonds Commun de Placement (FCP) – mutual fund under French law.
CLASSIFICATION Diversified.
ALLOCATION OF DISTRIBUTALBE INCOME
Units Allocation of distributable income
Accumulation of net income and net realized gains AC (EUR)
AHC (CHF) Accumulation of net income and net realized gains
MANAGEMENT OBJECTIVE The management objective is to enable the investor to benefit from the specific risk/return ratio of convertible bonds from the eurozone meeting environmental or socially responsible criteria. The convertible bonds have an asymmetric risk/return profile: all things being equal, for a given change in the underlying shares, upside participation is greater than downside participation. A convertible bond usually has a lower yield than a normal bond issued by the same issuer. However, a decline in the price of the underlying share will result in the value of the convertible bond decreasing to a lesser extent. The Fund will therefore benefit more from increases in European equity markets than it will suffer from
declines, all things being equal. This special risk/return ratio may be altered by fluctuations in interest rates, credit spreads and implied
volatility. Besides this asymmetric behaviour of convertibles, the aim is also to benefit from a portfolio with an average
ISR rating higher than its benchmark as assessed by FEDERIS GESTION D’ACTIFS.
BENCHMARK Thomson Reuters Global Convertibles Indices Europe Hedged (EUR). The Thomson Reuters Global Convertibles Indices Europe Hedged (EUR) index is a European convertible
bonds index. The performance of the Thomson Reuters Global Convertibles Indices Europe Hedged (EUR) index includes
coupons and/or dividends generated by the convertible bonds that make up the indicator.
INVESTMENT STRATEGY
1. Strategies used
The management policy is based on a fundamental and discretionary management of asset allocation and on
a selection of convertible or equivalent bonds meeting environmental or socially responsible criteria.
The management company relies on external expertise and the ISR rating matrix of the management company, Fédéris Gestion d'Actifs, regarding extra-financial analysis to select European convertible bonds
that meet environmental, social and governance (ESG) criteria according to a ‘Best in Class’ approach.
The management company’s investment process has six steps:
1- The ISR filter via the FEDERIS GESTION D’ACTIFS ISR rating matrix: The Fund's "Best-In-Class" management approach is to select within each business sector those companies
5
CONVERTIBLES EUROPE RESPONSABLE Annual report
most committed to sustainable development. This rating is produced in-house by Fédéris Gestion d’Actifs, which relies on analyses of the specialised agencies Eiris and Vigeo. The ISR rating evaluates companies based on their ESG (Environmental, Social and Governance) behaviour, from the Fédéris Gestion d’Actifs in-house matrix, which weights according to the specific challenges facing each sector, within the following six fields: Human Resources, Environment, Customers and Suppliers, Governance, Social Commitment and Human Rights. Companies with an ISR rating placing them in the fourth quartile will be excluded from the investment universe.
An exclusion approach shall be added to the ‘Best-in-Class’ approach in order to avoid investments in businesses in sectors such as prostitution, unsafe atomic energy and the production of anti-personnel mines.
From this investment universe, the management company will at different stages:
2- Filter the universe in terms of liquidity and issue size to eliminate less liquid securities. Liquidity changes according to market conditions.
3- Evaluate the credit quality of the issuer and estimate the implied volatility of the convertible, exchangeable or indexed bond, or bond redeemable in international equities, in order to position the relative cost of each
convertible bond in its universe and in relation to the other available implied volatilities (options, etc.);
4- Analyse the underlying stock and its earnings prospects;
5- Consolidate individual data and portfolio construction;
6- In accordance with the managers’ expectations, perform positioning and overall management of the exposures to equities, interest rates and credit.
The Fund’s exposure to equity risk will depend on: - on the one hand, the characteristics of convertible bonds, exchangeable bonds, redeemable bonds, etc., available on the market,
- on the other, expectations of the management company concerning market fluctuations. Thus, the equity exposure of the portfolio may vary in significant proportions over time; the equity exposure measuring the change of the convertible bond compared with a 1% change in the underlying share. For example, when the underlying equity increases by 1% and the convertible by 0.45% then the equity sensitivity of the convertible will be 45% (0.45%/1%). The equity sensitivity of the sub-fund is mostly balanced by the delta weighting of each line.
The Fund’s sensitivity to interest-rate risk will depend on: - on the one hand, the characteristics of convertible bonds, exchangeable bonds, redeemable bonds, etc., available on the market, - on the other, our expectations concerning market fluctuations. Thus, sensitivity may change significantly over time.
The Fund’s sensitivity to credit risk will depend on: - the characteristics of convertible bonds, exchangeable bonds, redeemable bonds, etc., available on the market. "Credit spreads", i.e. the difference between the yield at maturity from the security and the swap rate
for an equivalent period, may change significantly over time. - positions taken on the credit derivatives market.
6
CONVERTIBLES EUROPE RESPONSABLE Annual report
The management company may take positions on French and foreign regulated futures markets in order to expose and/or hedge the portfolio to/against the investment zone indices or to the underlying securities in order to pursue the management objective and take advantage of market variations.
The Fund may be exposed up to 100% to the equity markets (due to the nature of convertible bonds and the investment process) with an average exposure of between 10% and 60% inclusive.
Exchange rate risk will be systematically hedged. The hedging may include indirect exchange risk (the case of a security denominated in a currency whose underlying risk is in another currency). The objective of the
hedging is to have a residual direct exposure which is less than 10%.
For all units denominated in a currency other than EUR, the exchange rate risks of the unit’s currency shall be systematically hedged with respect to the fund’s benchmark currency. However, due to the technical difficulties in carrying out such hedging units denominated in currencies other than the EUR may possibly be exposed to a minor exchange rate risk due to changes in liability (subscriptions/redemptions) or assets (change in the value of hedged assets). All the costs and risks resulting from exchange rate hedging
operations shall be at the charge respectively of the units denominated in currencies other than the EUR.
The overall sensitivity range of the Fund shall be between 0 and 6.
2. The assets
The Fund will invest in rated or unrated assets, according to the analyses of the management company, where the underlying security and/or the issuer is a company having its registered office in a member country of the OECD or listed on a European market, with a predominant weighting in European countries. Thus, the
Fund may be exposed to High Yield securities.
Convertible bonds:
The Fund invests at all times at least two thirds of its total assets in:
- convertible bonds and/or
- exchangeable bonds and/or
- bonds redeemable in shares and/or
- bonds with subscription warrants and/or
- bonds indexed on shares and/or
- French “titres participatifs” (securities without voting rights but which provide an income of which one part is guaranteed and the other variable, depending on parameters linked to the company) and/or
- equivalent securities.
Debt securities and money market instruments and bonds:
The Fund may also be exposed to negotiable debt securities, borrowings, whatever their maturity or the issuer's rating (private or public), up to a maximum of 33% of its assets both as a performance driver and for
cash management.
Equities:
The Fund may invest up to 10% of its assets in European equity market capitalisation of all sizes; these shares can only be the result of the conversion or exchange of a convertible bond or equivalent security.
Their presence in the portfolio may not exceed one month.
Investment in units or shares in other UCITS, AIFs (Alternative Investment Fund) and/or foreign investment funds:
In order to achieve its management objective or to manage its cash flow, the Fund may invest up to 10% of its assets in shares of French or European UCITS or AIFs of any classification, which respect the four criteria set out in article R.214-13 of the French Monetary and Financial Code. These UCITS and AIFs may be managed by UBI or other management entities.
7
CONVERTIBLES EUROPE RESPONSABLE Annual report
When the Fund invests in units of UCITS and/or AIFs managed directly or indirectly by UBI or by a company to which it is linked through common management or control, or through a direct or indirect shareholding of more than 10% of the capital or votes, no subscription or redemption fee may be charged to the Fund for
investment in these UCITS or AIFs, with the exception of the commissions retained by the UCITS or AIFs.
For investments made by the Fund in a UCITS or AIF or eligible investment funds linked to UBI as described above, there will not be any duplication of the management fees invoiced by UBI and the UCITS or the AIF or any other eligible investment fund concerned. Accordingly the manager shall invest in units/shares of Group UCITS, AIFs or other eligible investment funds without incurring fees. In default of this, the assets invested in Group UCITS and/or AIFs or other eligible investment funds shall be
deducted from the base of management fees charged by the management company.
3. Derivative instruments
The Fund may take positions in forward financial instruments traded on regulated markets in France and abroad, and conduct over-the-counter transactions on financial instruments, including interest-rate or currency swaps, without seeking overexposure.
In this context, the manager may take positions in order to expose and/or hedge the portfolio to/against the indices of the investment zone or the underlying securities in order to pursue the management objective, take advantage of market variations and generally to manage the portfolio’s exposure to the equity, bond and interest-rate markets (see investment process above).
These transactions will be limited to a maximum exposure of 100% of the assets.
Markets invested in: - French and foreign regulated futures markets - Over-the-counter markets. Risks to which the manager seeks exposure: - Interest rates - Equities and equivalent securities - Market indices - Foreign exchange - Credit. Instruments used for both exposure and hedging: - Interest-rate swaps - Currency swaps - Forward foreign exchange contracts - Futures - Options - Credit Default Swaps.
4. Securities with embedded derivatives (up to 100% of net assets)
The Fund may use securities such as convertible bonds and similar securities with embedded derivatives of the type mentioned in paragraph “2. Assets”, up to the limit of 100% of net assets. The strategy of using securities with embedded derivatives is the same as that described for the use of derivative instruments.
5. Cash deposits
The Fund may make cash deposits in order to optimize its cash management.
8
CONVERTIBLES EUROPE RESPONSABLE Annual report
6. Cash borrowings
It is not the aim of the Fund to borrow cash, but it may find itself in a debtor liability position owing to transactions linked to its cash flow (ongoing investments and divestments, subscription/redemption transactions, etc.), within a limit of 10% of the net assets.
7. Sale and repurchase agreements
The Fund does not engage in this type of transaction.
RISK PROFILE Your money will be invested mainly in financial instruments selected by the Management Company. These instruments are subject to the fluctuations and risks of the market. The prices of convertible bonds are subject to a number of influences:
- the general level of interest rates - Interest-rate risk - the price of the underlying share - Equity risk - the level of the issuer’s credit risk - Credit risk - the volatility of the conversion option - Volatility risk
The level of these risks varies greatly over time. Furthermore, the general level of the markets has a significant influence on all these parameters.
Interest-rate risk: The interest rate risk associated with the inherent nature of convertible bonds is the risk that bond market rates will rise, causing a decline in bond prices and a fall in the net asset value of the Fund. Equity risk: Your investment may be subject to a maximum 100% exposure to the equity market, because of the inherent nature of convertibles and our investment process. A fall in the equity markets can cause a fall in the net asset value of the Fund. Credit risk: The Fund may be subject to the risk of a downgrading of the credit rating of a debt or of default by an issuer. This risk can affect an individual bond or the entire portfolio if there is a general worsening of credit spreads. The occurrence of such risk may cause a fall in the net asset value of the Fund. Volatility risk: Given an investment strategy consisting mainly of investments in convertible bonds, the net asset value of the Fund is liable to vary with changes in the value of the conversion option (i.e. the possibility of converting the bond into a share). These risks mean that the performance of the Fund does not depend solely on market trends; it is therefore possible that the value of the assets may fall at a time when equity markets are rising. Capital loss risk: The Fund carries no guarantee or protection, and the capital initially invested may not be returned.
Risk associated with investment in speculative securities: The attention of subscribers is drawn to the fact that investment in speculative securities, which have a low rating and are traded on markets whose operations, in terms of transparency and liquidity, may differ substantially from the standards accepted on European stock markets or regulated markets. Downward movements in the price of these securities may be faster and larger than for non-speculative securities.
9
CONVERTIBLES EUROPE RESPONSABLE Annual report
Risk associated with stock selection according to ESG criteria: This selection may lead to not selecting the best-performing stocks and be a source of deviance from the benchmark. Liquidity risk: This risk corresponds to the potential difficulty in selling assets due to a lack of sufficient volume in the market. It may occur due to a sharp rise in risk aversion or disruption in the markets. This risk may affect convertible bonds and equivalent securities which are mainly traded on over-the-counter markets. Counterparty risk: The Fund uses forward financial instruments traded on over-the-counter markets. These transactions, which are concluded with one or more eligible counterparties, potentially expose the Fund to a risk of default by one or other of these counterparties, which may lead to a payment default and to a subsequent decrease in the net asset value.
Residual exchange-rate risk: The Fund may invest in securities denominated in currencies other than the EUR, which are systematically hedged against exchange rate risk. A residual risk may remain due to the fluctuation of securities denominated in other currencies.
SUBSCRIBERS CONCERNED AND TYPICAL INVESTOR PROFILE Subscribers concerned
Units Subscribers concerned
AC (EUR) All subscribers
AHC (CHF) All subscribers
The attention of subscribers is drawn to the information relating to non-authorised investors mentioned in the general characteristics.
Typical investor profile:
The Fund is aimed at customers who want to benefit from the performance of European convertible bonds selected on the basis of ESG criteria.
AC (EUR) units are aimed at subscribers who wish to subscribe in EUR. AHC (CHF) units are aimed at subscribers who wish to subscribe in CHF.
The amount it is reasonable to invest in this Fund depends on the personal situation of each individual investor. To determine a reasonable amount, personal wealth, current needs and the recommended three-year duration of the investment need to be taken into account; however, attention must also be paid to the willingness to take risks, because of the inherent volatility of the equity markets, and the dynamic strategy of the Fund.
It is also recommended that investments be sufficiently diversified so as not to expose them solely to the risks
of a single UCI.
Recommended investment horizon: 3 years
10
CONVERTIBLES EUROPE RESPONSABLE Annual report
Changes concerning the Fund
MODIFICATIONS CARRIED OUT TO THE CONVERTIBLES EUROPE RESPONSIBLE FUND DURING THE 2014 FINANCIAL YEAR The prospectus of the Convertibles Europe Responsible Fund was modified on 21/08/2014 following a compliance update to the 21 February 2014 version of the AMF n° 2011-19 instruction.
On the 5th of September 2014, the benchmark index of the Fund, which was UBS Global Convertibles Indices Europe Hedged (EUR) was replaced by Thomson Reuters Global Convertibles Indices Europe Hedged (EUR). On the 19th of December 2014, new modifications were added to the prospectus of the Fund henceforth dated as December 2014. The modifications are as follows:
1. Investment strategy In the section related to assets, a new paragraph was insterted. It reads as follows: “Securities’ Markets and Stock Exchanges: You are reminded that the Fund may invest in any eligible financial security or money market instrument traded on a regulated market or other regulated market situated in an EU state or a state which is party to the European Economic Area agreement, or officially listed on a stock market of a third country to the European Union or European Economic Area, or traded on another market of a third country according to the conditions laid down in Article R.214-11 of the Monetary and Financial Code. Accordingly, the management company does not exclude any stock or securities market in Europe, the Middle East, Africa, Americas, Asia, Pacific. The securities in the portfolio may therefore by issued under any law, including securities issued under the regulations known as REG S or 144A, in respect of the investment
strategy of the above fund.”
2. Fees and commissions The paragraph related to the procedure for selecting intermediaries has been modified as follows: « In accordance with Article 314-75 of the AMF General Regulations, the management company has set up a “best selection/best execution” policy for selecting intermediaries and counterparties, which is available to investors on the website of the management company www.ubgi.fr. The objective of this policy is to select traders and intermediaries based on predefined criteria and whose execution policy will ensure the best
execution of orders.»
3. Creation of units Newly created units ZC (EUR) and ZD (EUR) are reserved to mutual funds, AIFs, investment funds or institutional investors which have entered into a specific remuneration agreement with Union Bancaire Privée, UBP SA or any other member of the Group.
11
CONVERTIBLES EUROPE RESPONSABLE Annual report
Management Report
The United States stands out
The acceleration in global activity expected by most observers at the beginning of 2014 was not really realised (the rise in GDP being similar to that of 2013), but the US economy strongly confirmed that it has become again the main engine of growth, while the level of activity in most other regions was rather disappointing. After a difficult beginning of the year due to the cold spell which struck the US, the improvement in US economic indicators - such as the sharp rise in PMI indicators and the regular increases in job creation numbers - showed over time a return to a pace of growth greater than 3%. The contrast with Eurozone dynamics was striking: if the beginning of the year had some good news giving rise to hopes of a sustainable return to growth, the optimists were quickly disillusioned. The worsening of the Ukrainian crisis certainly weighed on confidence, but that does not explain by itself the near stagnation of the Eurozone in 2014. Spain was one of the rare countries in the region which posted generally satisfactory economic results and this was probably due to the fact that the structural reforms necessary for growth were put in place there more quickly than elsewhere. The return of Japan to recession in the third quarter caused general astonishment: in fact, despite all the efforts by the authorities to revive growth, private consumption did not recover after the sharp slowdown which resulted from the increase in VAT in April, and exports stagnated despite the sharp fall in the Yen.
The rebalancing of growth between the emerging and developed countries continued in 2014. The signs of a structural slowdown in China continued to accumulate, which encouraged the authorities to opt for measures targeted on specific sectors, before announcing a surprise reduction in interest rates in November. The weakening of Chinese growth had a significant impact on many emerging economies as it contributed to the fall in commodity prices. Copying Brazil, some countries had to tighten monetary policy in order to limit capital outflows and the fall in their exchange rate which was feeding inflation. This impacted their growth rates. The case of Russia is obviously extreme: in addition to its high dependence on oil, it also suffered from Western sanctions.
One of the most striking things about the year - which had major political and economic consequences - was the fall of almost 50% in the price of oil in the second half. This reflected the weakness in global demand, the major increase in supply in the US as well as a complete change of strategy on the part of OPEC. This significantly lowered inflation expectations in the developed economies allowing monetary policy to remain very expansionary. As announced, the Fed ended its third programme of quantitative easing in October, but maintained a very conciliatory tone. Elsewhere, after a long wait, the ECB finally became very active, with two cuts to interest rates (deposit rates moving into negative territory) and numerous other measures (TLTRO, purchases of covered bonds and ABS), without forgetting the announcement of its intention to see the balance sheet of the institution rising to early 2012 levels. This left the door wide open for the purchase of sovereign bonds. For its part, the Japanese central bank again increased its asset purchase programme in October.
Bond markets: European long rates crushed
Disappointments over global growth and the fall in inflation expectations, combined with abundant liquidity, gave rise to a very clear flattening of the rate curves in the developed economies, which made for a very favourable environment for fixed rate instruments. Contrary to expectations, ten-year rates fell significantly in the US (-85 bp to 2.17%) and even further in Europe (-130bps in Germany, -170bps in France, -220bps in Italy and -250bps in Spain, compared to -75bps in Switzerland) The performance of peripheral sovereign bonds was thus particularly solid (15.6% on average according to BofA Merril Lynch) with, in addition, very honourable performances for their British (+14.7%), German (+10.4%) and Swiss (+8.9%) counterparts. US treasury bonds rose more modestly (6%) due to a more moderate fall in long rates, but also a slight rise in short rates. Credit spreads had diverse fortunes in the second half, due in particular, to greater exposure of US indices to the energy sector. Over the year EUR investment grade corporate bonds saw their risk premiums fall on average, while those for USD issues rose, but not as markedly as for the high yield segment. Credit spreads on emerging sovereign debt also widened.
Currencies and commodities
On the forex market, the significant event of the second half was undoubtedly the strength of the dollar. Boosted by the prospects of a clear divergence in monetary policy between the Fed and the other central
12
CONVERTIBLES EUROPE RESPONSABLE Annual report
banks, the greenback rose for six consecutive months against a basket of the other main currencies and saw its value rise by more than 10% over the year against the Euro, Swiss Franc, and Yen as well as against most emerging currencies. At the other extreme was the Rouble which lost nearly 50% of its value against the dollar.
No other commodity fell as much as oil, but most did lose value over the year. However, the price of coffee and cocoa as well as some industrial metals (nickel, zinc) posted quite significant increases. Regarding precious metals, gold gave up only 2% over the year, while the falls were more marked for silver (-19%) and platinum (-12%).
Equity markets: significant disparities
The rise of 9.3% in the MSCI World All Country Index (in local currencies, net dividends reinvested) shows that the large markets stayed within a largely positive trend in 2014. Among them the US market was the big winner of the year, with a rise of 12.7% (MSCI index, net dividends reinvested). If the majority of the Eurozone markets finished the year in positive territory (with the notable exceptions of the Greek and Portuguese markets which fell by around 30%), they generally under-performed the other developed country markets in the second half, due particularly to disappointing economic figures, the Russian crisis and the increase in Greek risk. The Eurozone equity market thus recorded a gain of 4.3% for the year, well ahead of the UK (which finished up +0.5%), but substantially under-performed the Swiss market (+11.6%). After a difficult beginning to the year, the Japanese market recovered later to finish up close to the average (+9.5%).
Disparities were still more marked in emerging markets. Top prize went to Shanghai (+58% for the Shanghai Composite), thanks to a spectacular rise at the end of the year. With gains of nearly 30% each (in local currencies), the Turkish, Indonesian and Indian markets also figured among the top performers. At the other extreme, the most heavily penalised markets were Russia, Hungary and South Korea, with falls of around 10%. We note finally that it was generally defensive stocks which outperformed, with healthcare and utilities rising by around 20%, followed very closely by technology. Unsurprisingly the energy sector brought up the rear, with a fall of 8% for the year.
2015 prospects: global growth still receiving transfusions from the central banks
Expected to reach 3.5% in 2015, global growth should be slightly more sustained in 2015 than in 2014, thanks in particular to the dynamism of the US economy. After posting a figure of 2.4% in 2014, the US should achieve around 3% this year as a result of more vigorous domestic demand. Household consumption should be stimulated by the fall in unemployment and strong job creation, the sharp fall in petrol prices, still positive wealth effects, and finally, through the absence of any constraint arising from fiscal policy. In this favourable context the Fed should increase interest rates for the first time, after having ended its government bond-buying in 2014. However, the monetary policy committee (FOMC) should remain prudent at this strategic turning point in order not to weaken markets and business activity. It may therefore show itself to be flexible with its timing as well as with the number of rate rises during the year.
US growth should continue to drive activity among the developed economies. Japan and the Eurozone have taken much longer than expected to re-establish durable growth, and economic policy support is still necessary, even if the fall in energy prices should have a positive effect on activity. In the Eurozone, growth will still be weak in 2015 (0.7% expected, according to our scenario), due to the persistence of budgetary constraints, a slow pace of debt reduction and unemployment which has only fallen slightly. The ECB will be obliged to adopt a more aggressive policy through the purchase of government and corporate bonds, after having announced in September 2014 the purchase of ABS and secured bank debt. With the elections calendar for 2015 being heavy, uncertainties will still be numerous in Europe, and only monetary policy will have free rein. Elections in Greece may therefore, depending on the result, disturb the expected scenario and increase fears that the country will exit the Eurozone or that the government will refuse to honour its debts. In Japan, monetary and budgetary policy should also be appealed to in order to relaunch an economic cycle still weak after the rise in VAT in 2014, and the absence of a hoped for jump start following the launch of 'Abenomics'.
Growth in emerging markets should be sustained, with some still significant disparities. The Chinese economy should grow by on average nearly 7%, but the authorities are searching for new engines of growth and must combine monetary and budgetary supports to boost activity which did not appear very clearly defined at the end of the year. In India the reforms of the new government are awaited with interest, as they must revive industry and remove strangling bottlenecks in terms of both infrastructure and political development. Nevertheless, risks remain for investors due to the major uncertainties which weigh on Russia (expected to enter a sharp recession in 2015), on Brazil, as well as on some Eastern European countries and
13
CONVERTIBLES EUROPE RESPONSABLE Annual report
the Middle East. The geopolitical risks will be high and may interfere with the policies put in place in the developed countries.
Commodity prices should remain depressed, and inflation should stay at or around its lowest levels. Thus, deflationary risks may remain high, above all within the Eurozone. Elsewhere, pay increases should remain modest, but tensions may develop in the US in view of the country's pace of growth. In all the developed economies monetary policies have as their aim, not just the support of business activity, but also the stabilisation of inflation expectations which fell sharply at the end of the year.
Moderate growth and central bank activism is producing a propitious framework for the financial markets, despite the current risks and expected higher volatility. Company profits should rise by around 9% globally in 2015 and seem to us better oriented in the US than in other regions. The less favourable prospects of the energy sector should be offset by solid revenues and profitability in other sectors, in particular technology and healthcare. However, the prospects of a continuation of the rise in valuations seem limited to us this year in view of the levels already reached.
The corporate bonds sector should produce more attractive opportunities than those offered by government bonds. Despite the tensions in the energy sector, the yields generated by the credit sector, high yield in particular, seem interesting, especially as the risk of a recession in the US seems very low. Conversely, long term interest rates may see a rise in the US in view of better cyclical conditions, while the fall observed in the 'core' countries of the Eurozone in 2014, may be interrupted and the downward trend reversed due to a stabilisation in business activity.
Finally, the dollar should continue the rebound begun in the second quarter. The divergences in monetary policy between Europe and the US should be more and more marked, as will those between Japan and the US, with a rise in the US dollar being a result. As a consequence the prospects for gold do not seem particularly interesting, as long as major geopolitical risks do not materialise.
2014 was a good year for convertible bond funds, buoyed by the fall in risk premiums in the credit spreads market and the solid performances of the main market indices.
However 2014 was not a long stroll in the park. Concerning technical valuation, the European universe corrected from May onwards with implied volatilities significantly down. The collapse of Espirito Santo also weighed on the asset class.
As for 2013, the primary market remained abundant in 2014, with $89.1bn issued globally, of which $24.1bn was in Europe, renewing investment opportunities.
The US primary market saw the appearance of cheap issues to finance equity buybacks (eg Yahoo). This trend may continue and extend geographically to Europe.
We aimed all year, in conformance with our process, to remain invested in the most attractive bonds in terms of convexity.
Overall the performance of Convertibles Europe Responsable was +1.44% for the part in Euro.
Past performances are no guarantee of future performance.
14
CONVERTIBLES EUROPE RESPONSABLE Annual report
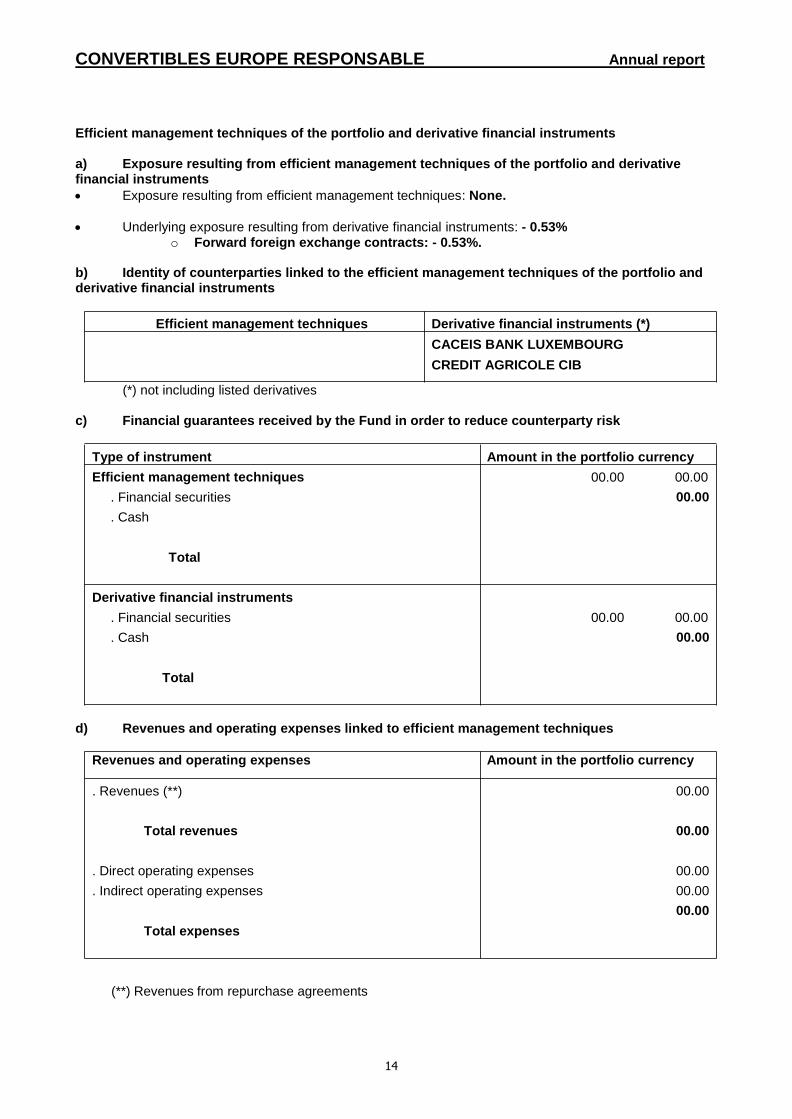
Efficient management techniques of the portfolio and derivative financial instruments
a) Exposure resulting from efficient management techniques of the portfolio and derivative financial instruments
Exposure resulting from efficient management techniques: None. Underlying exposure resulting from derivative financial instruments: - 0.53%
o Forward foreign exchange contracts: - 0.53%.
b) Identity of counterparties linked to the efficient management techniques of the portfolio and derivative financial instruments
Efficient management techniques Derivative financial instruments (*)
CACEIS BANK LUXEMBOURG
CREDIT AGRICOLE CIB
(*) not including listed derivatives
c) Financial guarantees received by the Fund in order to reduce counterparty risk
Type of instrument Amount in the portfolio currency
Efficient management techniques
. Financial securities
. Cash
Total
00.00 00.00
00.00
Derivative financial instruments
. Financial securities
. Cash
Total
00.00 00.00
00.00
d) Revenues and operating expenses linked to efficient management techniques
Revenues and operating expenses Amount in the portfolio currency
. Revenues (**)
Total revenues
. Direct operating expenses
. Indirect operating expenses
Total expenses
00.00 00.00 00.00
00.00
00.00
(**) Revenues from repurchase agreements

15
CONVERTIBLES EUROPE RESPONSABLE Annual report
Regulatory information
PROCEDURE FOR SELECTING INTERMEDIARIES Union Bancaire Gestion Institutionelle (France) selects service providers whose execution policy enables it to ensure the best possible results when processing orders on behalf of its funds or its clients. It also selects investment decision support and order execution service providers. In both cases Union Bancaire Gestion Institutionelle (France) has defined a selection and evaluation policy for its intermediaries according to a number of criteria the updated version of which may be consulted on our website www.ubgi.fr You will also find on the site the report relating to intermediation fees.
VOTING POLICY The details of the conditions in which the management company shall exercise voting rights attached to securities held in the portfolio are available from:
UNION BANCAIRE GESTION INSTITUTIONNELLE (France) SAS 127 avenue des Champs Elysées 75008 PARIS e-mail : [email protected]
SOCIAL, ENVIRONMENTAL AND GOVERNANCE CRITERIA In application of Article L.533-22-1 of the Monetary and Financial Code, the subscriber is informed that the Management Company does not take into simultaneous account social, environmental or governance criteria in the investment policy of the fund.
CALCULATION METHOD OF THE GLOBAL RISK The Fund’s overall risk ratio is calculated using the commitment method.
Report of the statutory auditor
19
CONVERTIBLES EUROPE RESPONSABLE Annual report
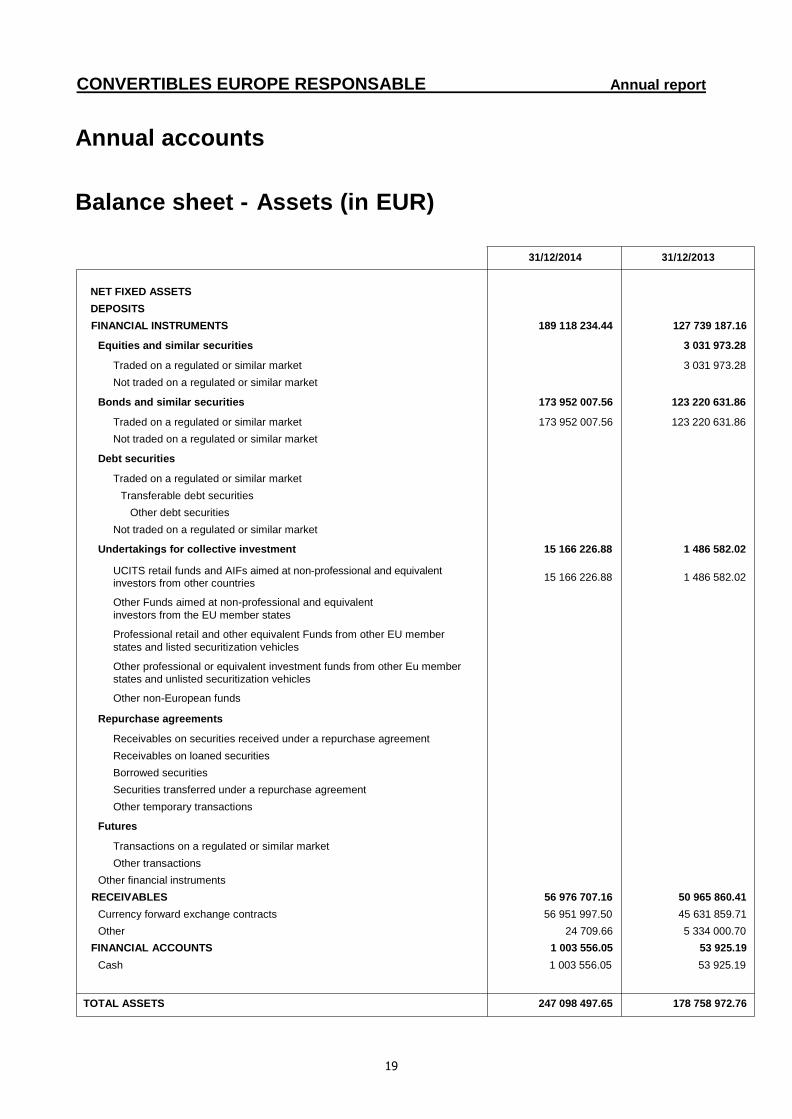
Annual accounts
Balance sheet - Assets (in EUR)
31/12/2014 31/12/2013
NET FIXED ASSETS
DEPOSITS
FINANCIAL INSTRUMENTS 189 118 234.44 127 739 187.16
Equities and similar securities 3 031 973.28
Traded on a regulated or similar market 3 031 973.28
Not traded on a regulated or similar market
Bonds and similar securities 173 952 007.56 123 220 631.86
Traded on a regulated or similar market 173 952 007.56 123 220 631.86
Not traded on a regulated or similar market
Debt securities
Traded on a regulated or similar market
Transferable debt securities
Other debt securities
Not traded on a regulated or similar market
Undertakings for collective investment 15 166 226.88 1 486 582.02
UCITS retail funds and AIFs aimed at non-professional and equivalent
investors from other countries 15 166 226.88 1 486 582.02
Other Funds aimed at non-professional and equivalent
investors from the EU member states
Professional retail and other equivalent Funds from other EU member
states and listed securitization vehicles
Other professional or equivalent investment funds from other Eu member
states and unlisted securitization vehicles
Other non-European funds
Repurchase agreements
Receivables on securities received under a repurchase agreement
Receivables on loaned securities
Borrowed securities
Securities transferred under a repurchase agreement
Other temporary transactions
Futures
Transactions on a regulated or similar market
Other transactions
Other financial instruments
RECEIVABLES 56 976 707.16 50 965 860.41
Currency forward exchange contracts 56 951 997.50 45 631 859.71
Other 24 709.66 5 334 000.70
FINANCIAL ACCOUNTS 1 003 556.05 53 925.19
Cash 1 003 556.05 53 925.19
TOTAL ASSETS 247 098 497.65 178 758 972.76
20
CONVERTIBLES EUROPE RESPONSABLE Annual report
Annual accounts
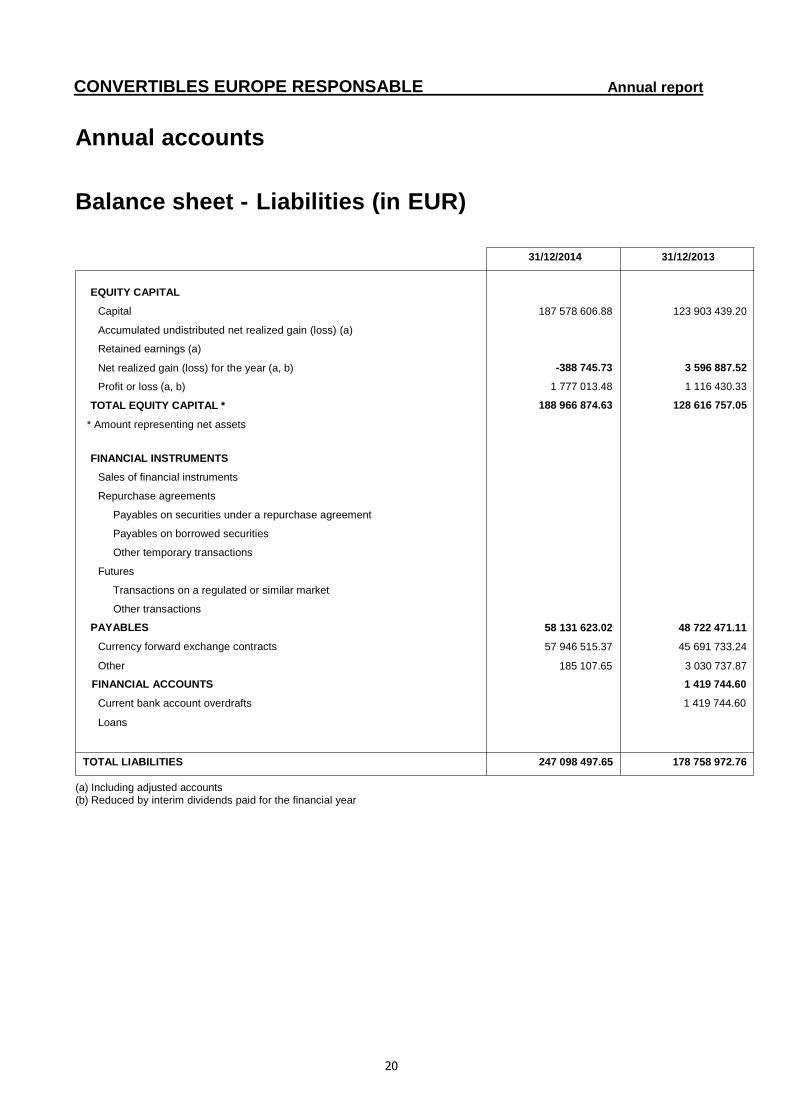
Balance sheet - Liabilities (in EUR)
31/12/2014 31/12/2013
EQUITY CAPITAL
Capital
Accumulated undistributed net realized gain (loss) (a)
Retained earnings (a)
Net realized gain (loss) for the year (a, b)
Profit or loss (a, b)
TOTAL EQUITY CAPITAL *
* Amount representing net assets
FINANCIAL INSTRUMENTS
Sales of financial instruments
Repurchase agreements
Payables on securities under a repurchase agreement
Payables on borrowed securities
Other temporary transactions
Futures
Transactions on a regulated or similar market
Other transactions
PAYABLES
Currency forward exchange contracts
Other
187 578 606.88
-388 745.73
1 777 013.48
188 966 874.63
58 131 623.02
57 946 515.37
185 107.65
123 903 439.20
3 596 887.52
1 116 430.33
128 616 757.05
48 722 471.11
45 691 733.24
3 030 737.87
FINANCIAL ACCOUNTS 1 419 744.60
Current bank account overdrafts 1 419 744.60
Loans
TOTAL LIABILITIES 247 098 497.65 178 758 972.76
(a) Including adjusted accounts
(b) Reduced by interim dividends paid for the financial year
21
CONVERTIBLES EUROPE RESPONSABLE Annual report
Annual accounts
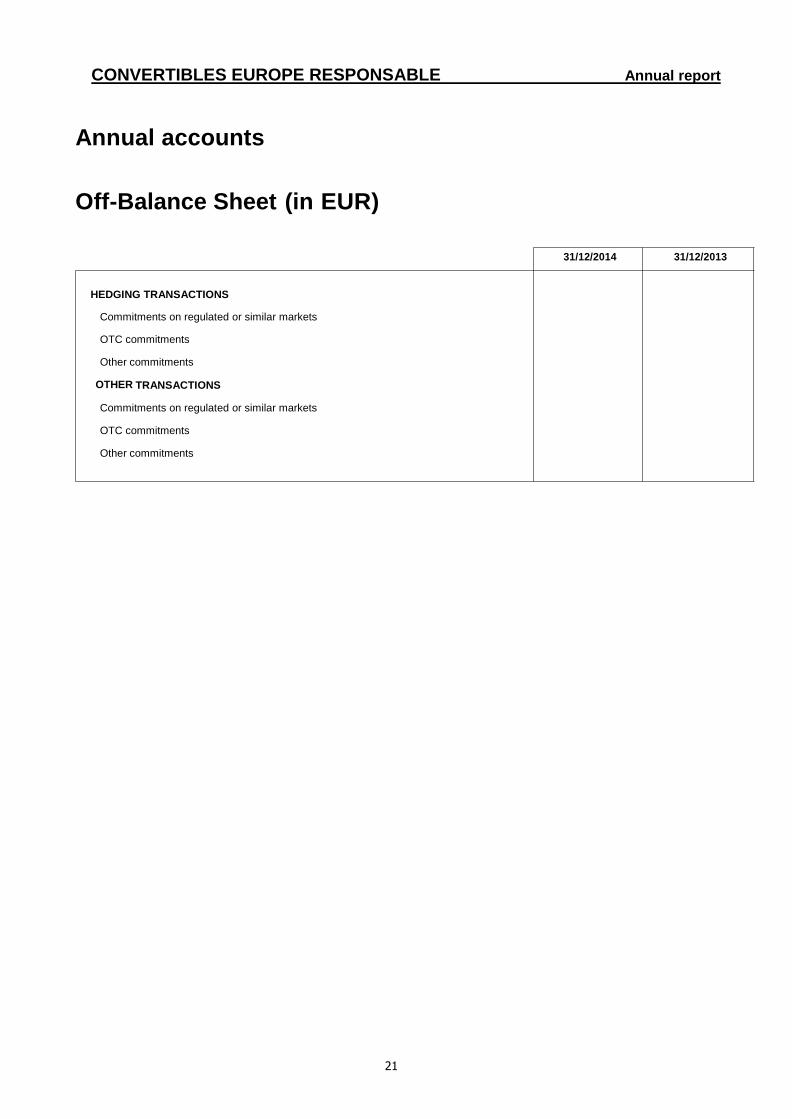
Off-Balance Sheet (in EUR)
31/12/2014 31/12/2013
HEDGING TRANSACTIONS
Commitments on regulated or similar markets
OTC commitments
Other commitments
OTHER TRANSACTIONS
Commitments on regulated or similar markets
OTC commitments
Other commitments
22
CONVERTIBLES EUROPE RESPONSABLE Annual report
Annual accounts
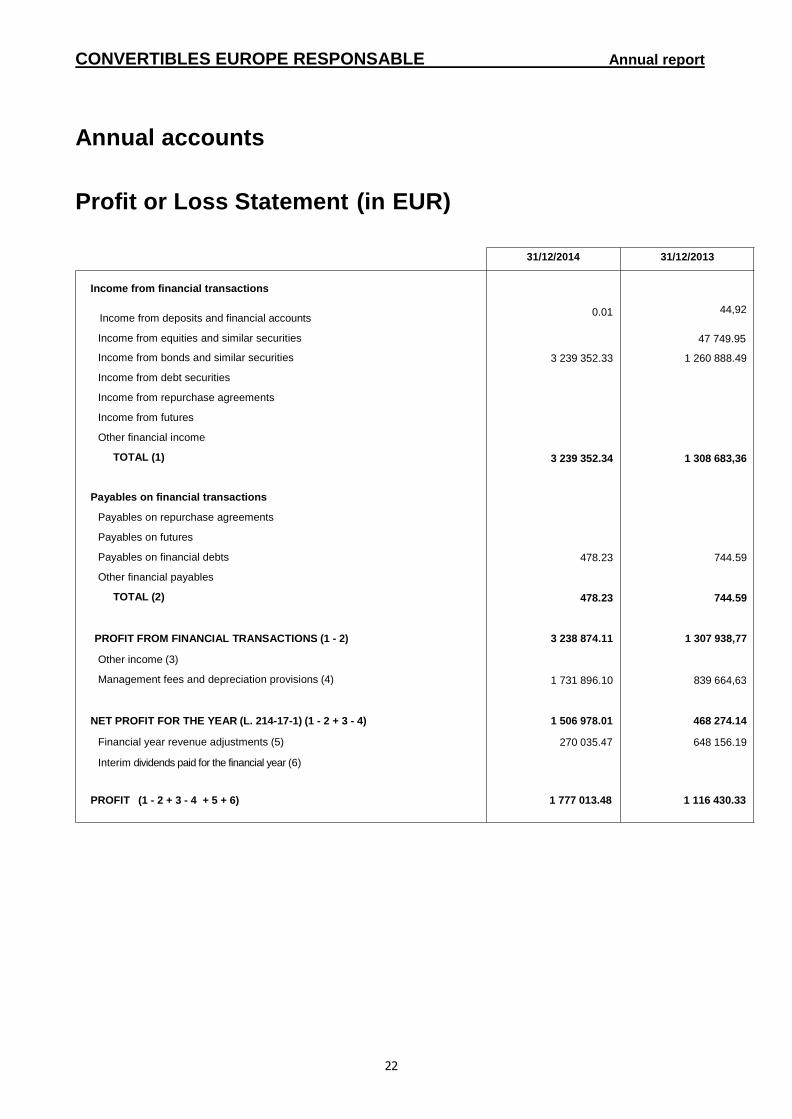
Profit or Loss Statement (in EUR)
31/12/2014 31/12/2013
Income from financial transactions
Income from deposits and financial accounts
0.01
44,92
Income from equities and similar securities 47 749.95
Income from bonds and similar securities
Income from debt securities
Income from repurchase agreements
Income from futures
Other financial income
TOTAL (1)
3 239 352.33
3 239 352.34
1 260 888.49
1 308 683,36
Payables on financial transactions
Payables on repurchase agreements
Payables on futures
Payables on financial debts
Other financial payables
TOTAL (2)
478.23
478.23
744.59
744.59
PROFIT FROM FINANCIAL TRANSACTIONS (1 - 2)
Other income (3)
Management fees and depreciation provisions (4)
3 238 874.11
1 731 896.10
1 307 938,77
839 664,63
NET PROFIT FOR THE YEAR (L. 214-17-1) (1 - 2 + 3 - 4)
Financial year revenue adjustments (5)
Interim dividends paid for the financial year (6)
1 506 978.01
270 035.47
468 274.14
648 156.19
PROFIT (1 - 2 + 3 - 4 + 5 + 6) 1 777 013.48 1 116 430.33
23
CONVERTIBLES EUROPE RESPONSABLE Annual report
Notes to the annual accounts – Accounting rules and methods
The annual accounts are presented in accordance with the ANC 2014-01 Regulation as set out by the French Accounting Standards Authority which replaces the modified CRC 2003-02 Regulation. This regulation integrates the new AIFM classification of UCIs, but does not modify the applicable accounting principles, nor the assets and liabilities valuation methods.
As indicated in the presentation note of the ANC, the terminology and the breakdown of the “Undertakings for collective investment” for the assets in the Balance Sheet were modified as follows and are detailed below:
The subcategory « UCITS retail funds and AIFs aimed at non professional and equivalent investors from other countriess » corresponds to the previous subcategory « Coordinated European UCITS and general-purpose French UCITS ».
The subcategory « Other Funds aimed at non-professional and equivalent investors from the EU member states » corresponds to the previous subcategory « Funds reserved for certain investors - FCPR - FCIMT ».
The subcategory « Professional retail and other equivalent investment funds from other EU member states and listed securitization vehicles » corresponds to the previous subcategory « Investment funds and listed FCC (mutual debt funds) ».
The subcategory « Other professional or equivalent investment funds from other EU member states and non-listed securitization vehicles » corresponds to the previous subcategory « Investment funds and unlisted FCC (mutual debt funds) ».
The subcategory « Other non-European funds » was introduced by Regulation n° 2014-01.
General accounting principles apply: - a true and fair view, comparability and operational continuity, - lawfulness, accuracy, - prudence, - consistency of methods from one financial year to the next.
The accounting method used for recording fixed revenue securities income is based on interest received.
Entries and disposals of securities are accounted for exclusive of charges. The reference accounting currency for the portfolio is the EURO. The financial year period is 12 months.
A- Asset valuation rules
Financial instruments are accounted for according to the historical cost method and recorded on the balance sheet at their current value, which is determined by the latest known market value or, if there is no market, by any external means, or by recourse to financial models. Differences between the current values used in calculating the net asset value and historical costs of transferable securities when they enter the portfolio are recorded in "valuation differences" accounts. Securities that are not in the portfolio currency are valued in accordance with the principle stated below, then converted into the portfolio currency based on the exchange rate on the day of valuation.
1. Deposits:
Deposits with a residual lifetime of less than or equal to three months are valued according to the straight-line method.

24
CONVERTIBLES EUROPE RESPONSABLE Annual report
2. Equities, bonds and other securities traded on a regulated or similar market:
For the calculation of net asset value, shares and other securities traded on a regulated market or similar are valued according to the day’s closing share price.
Bonds and similar securities are valued at the closing price communicated by various financial services providers. The accrued interest of bonds and similar securities is calculated up to the date of the net asset value.
3. Equities, bonds and other securities not traded on a regulated or similar market:
Securities not traded on a regulated market are valued by the management company, using methods based on goodwill value and return and taking into account the prices used during recent significant transactions.
4. Transferable debt securities:
Transferable debt securities and similar securities which are not traded in large volumes are valued on an actuarial basis using a reference rate as defined below, increased if needed by a margin representative of the intrinsic characteristics of the issuer: Transferable debt securities for which the maturity date is less than or equal to one year: interbank rate in euros (Euribor). Transferable debt securities for which the maturity date is more than one year: BTAN rates (Bons du Trésor à Intérêts Annuels Normalisés - standard annual interest French treasury bills) or OAT rates (Obligations Assimilables du Trésor - fungible French treasury bonds) with near-term maturity for longer periods.
Transferable debt securities with a residual lifetime of less than or equal to three months may be valued according to the straight-line method.
Treasury bills are valued at the market rate communicated daily by the Banque de France.
5. UCIs held:
UCI units or shares are valued at the last known net asset value.
6. Repurchase agreements:
Securities received under a repurchase agreement are posted to assets in the "Receivables on securities received under a repurchase agreement" section in the amount provided for by the contract, increased by accrued interest receivable.
Securities given under a repurchase agreement are posted to the buyer portfolio at their current value. The debt for securities given under a repurchase agreement is posted to the seller portfolio at the value fixed in the contract, increased by accrued interest payable.
Loaned securities are valued at their current value and posted to assets in the "Loaned securities receivables" section at their current value, increased by accrued interest receivable.
Borrowed securities are posted to assets in the "Borrowed securities" section in the amount provided for by the contract and to liabilities in the "Payables on borrowed securities" section in the amount provided for by the contract, increased by accrued interest payable.
7. Futures financial instruments:
7.1 Futures traded on a regulated or similar market:
Futures traded on regulated markets are valued at the daily settlement price.
25
CONVERTIBLES EUROPE RESPONSABLE Annual report
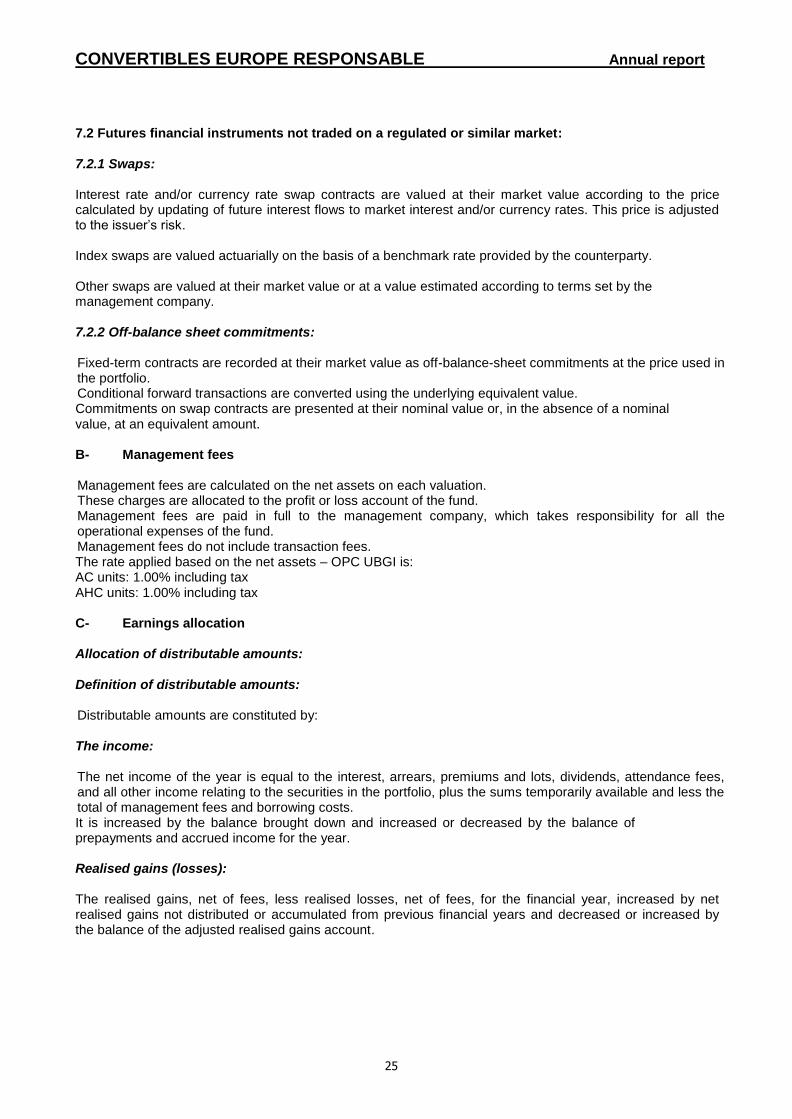
7.2 Futures financial instruments not traded on a regulated or similar market:
7.2.1 Swaps:
Interest rate and/or currency rate swap contracts are valued at their market value according to the price calculated by updating of future interest flows to market interest and/or currency rates. This price is adjusted to the issuer’s risk.
Index swaps are valued actuarially on the basis of a benchmark rate provided by the counterparty.
Other swaps are valued at their market value or at a value estimated according to terms set by the management company.
7.2.2 Off-balance sheet commitments:
Fixed-term contracts are recorded at their market value as off-balance-sheet commitments at the price used in the portfolio. Conditional forward transactions are converted using the underlying equivalent value. Commitments on swap contracts are presented at their nominal value or, in the absence of a nominal value, at an equivalent amount.
B- Management fees
Management fees are calculated on the net assets on each valuation. These charges are allocated to the profit or loss account of the fund. Management fees are paid in full to the management company, which takes responsibility for all the operational expenses of the fund. Management fees do not include transaction fees. The rate applied based on the net assets – OPC UBGI is: AC units: 1.00% including tax AHC units: 1.00% including tax
C- Earnings allocation
Allocation of distributable amounts:
Definition of distributable amounts:
Distributable amounts are constituted by:
The income:
The net income of the year is equal to the interest, arrears, premiums and lots, dividends, attendance fees, and all other income relating to the securities in the portfolio, plus the sums temporarily available and less the total of management fees and borrowing costs. It is increased by the balance brought down and increased or decreased by the balance of prepayments and accrued income for the year.
Realised gains (losses):
The realised gains, net of fees, less realised losses, net of fees, for the financial year, increased by net realised gains not distributed or accumulated from previous financial years and decreased or increased by the balance of the adjusted realised gains account.

26
CONVERTIBLES EUROPE RESPONSABLE Annual report
Allocation of distributable amounts:
Distributable amounts Units
Allocation of net income Accumulation
Allocation of net realized gain (loss) Accumulation
27
CONVERTIBLES EUROPE RESPONSABLE Annual report
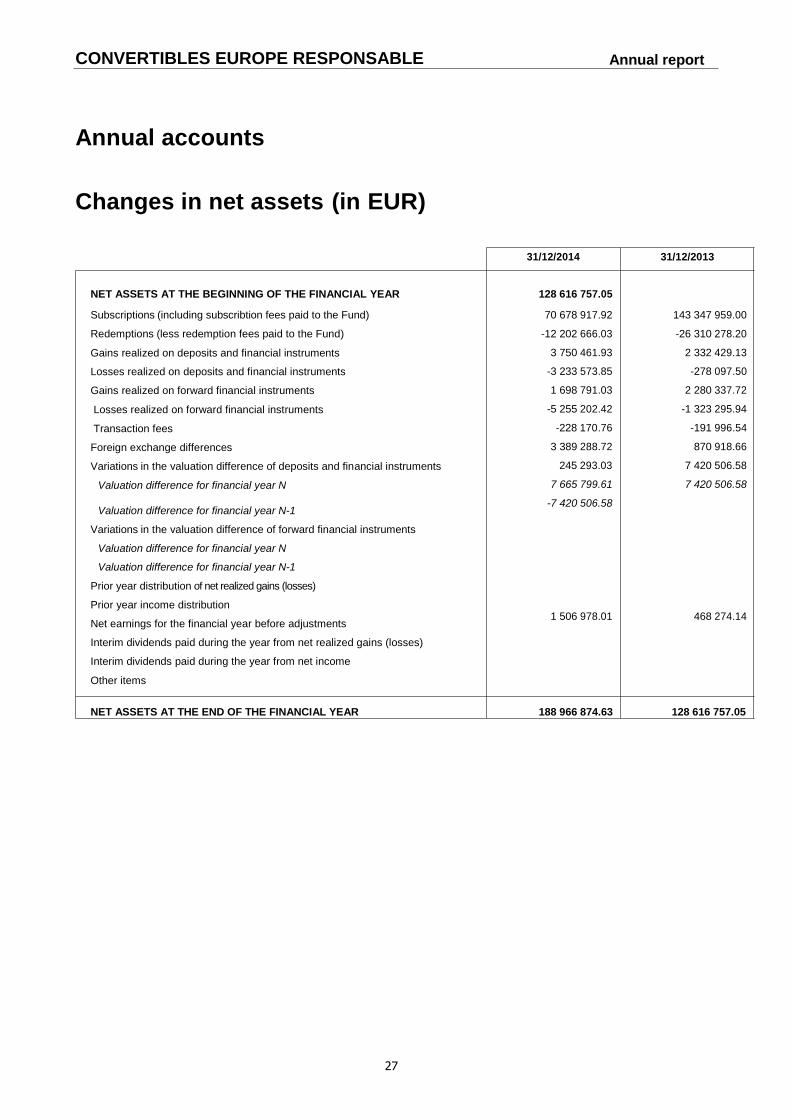
Annual accounts
Changes in net assets (in EUR)
31/12/2014 31/12/2013
NET ASSETS AT THE BEGINNING OF THE FINANCIAL YEAR
Subscriptions (including subscribtion fees paid to the Fund)
Redemptions (less redemption fees paid to the Fund)
Gains realized on deposits and financial instruments
Losses realized on deposits and financial instruments
Gains realized on forward financial instruments
Losses realized on forward financial instruments
Transaction fees
Foreign exchange differences
Variations in the valuation difference of deposits and financial instruments
Valuation difference for financial year N
Valuation difference for financial year N-1
Variations in the valuation difference of forward financial instruments
Valuation difference for financial year N
Valuation difference for financial year N-1
Prior year distribution of net realized gains (losses)
Prior year income distribution
Net earnings for the financial year before adjustments
Interim dividends paid during the year from net realized gains (losses)
Interim dividends paid during the year from net income
Other items
128 616 757.05
70 678 917.92
-12 202 666.03
3 750 461.93
-3 233 573.85
1 698 791.03
-5 255 202.42
-228 170.76
3 389 288.72
245 293.03
7 665 799.61
-7 420 506.58
1 506 978.01
143 347 959.00
-26 310 278.20
2 332 429.13
-278 097.50
2 280 337.72
-1 323 295.94
-191 996.54
870 918.66
7 420 506.58
7 420 506.58
468 274.14
NET ASSETS AT THE END OF THE FINANCIAL YEAR 188 966 874.63 128 616 757.05
28
CONVERTIBLES EUROPE RESPONSABLE Annual report
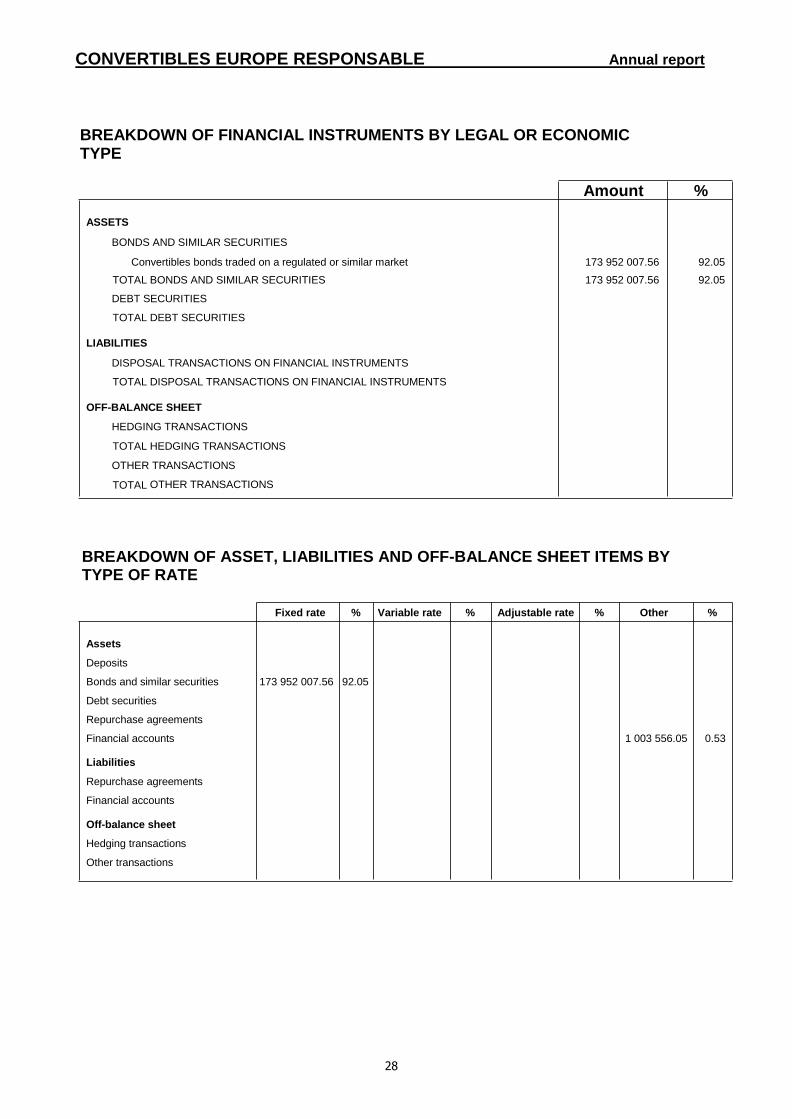
BREAKDOWN OF FINANCIAL INSTRUMENTS BY LEGAL OR ECONOMIC TYPE
Amount %
ASSETS
BONDS AND SIMILAR SECURITIES
Convertibles bonds traded on a regulated or similar market 173 952 007.56 92.05
TOTAL BONDS AND SIMILAR SECURITIES 173 952 007.56 92.05
DEBT SECURITIES
TOTAL DEBT SECURITIES
LIABILITIES
DISPOSAL TRANSACTIONS ON FINANCIAL INSTRUMENTS
TOTAL DISPOSAL TRANSACTIONS ON FINANCIAL INSTRUMENTS
OFF-BALANCE SHEET
HEDGING TRANSACTIONS
TOTAL HEDGING TRANSACTIONS
OTHER TRANSACTIONS
TOTAL OTHER TRANSACTIONS
BREAKDOWN OF ASSET, LIABILITIES AND OFF-BALANCE SHEET ITEMS BY TYPE OF RATE
Fixed rate % Variable rate % Adjustable rate % Other %
Assets
Deposits
Bonds and similar securities 173 952 007.56 92.05
Debt securities
Repurchase agreements
Financial accounts 1 003 556.05 0.53
Liabilities
Repurchase agreements
Financial accounts
Off-balance sheet
Hedging transactions
Other transactions
29
CONVERTIBLES EUROPE RESPONSABLE Annual report
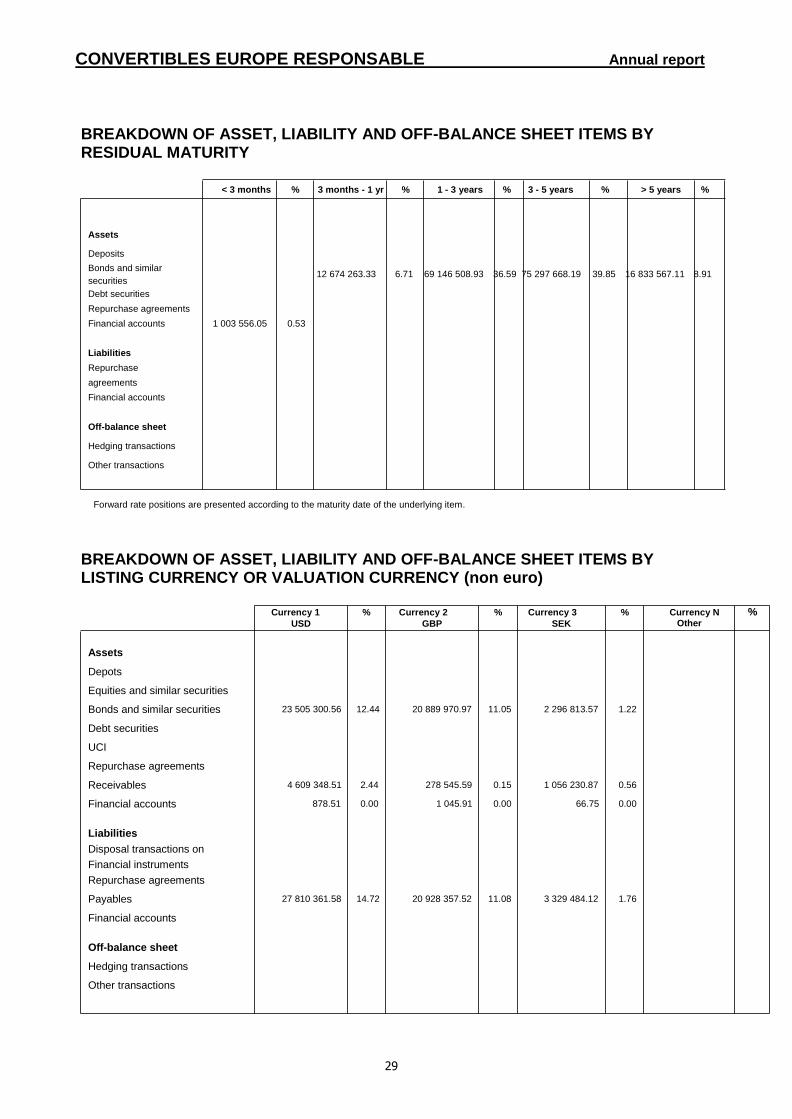
BREAKDOWN OF ASSET, LIABILITY AND OFF-BALANCE SHEET ITEMS BY RESIDUAL MATURITY
< 3 months % 3 months - 1 yr % 1 - 3 years % 3 - 5 years % > 5 years %
Assets
Deposits
Bonds and similar
securities 12 674 263.33 6.71 69 146 508.93 36.59 75 297 668.19 39.85 16 833 567.11 8.91
Debt securities
Repurchase agreements
Financial accounts 1 003 556.05 0.53
Liabilities
Repurchase
agreements
Financial accounts
Off-balance sheet
Hedging transactions
Other transactions
Forward rate positions are presented according to the maturity date of the underlying item.
BREAKDOWN OF ASSET, LIABILITY AND OFF-BALANCE SHEET ITEMS BY LISTING CURRENCY OR VALUATION CURRENCY (non euro)
Currency 1
USD % Currency 2
GBP % Currency 3
SEK % Currency N %
Other
Assets
Depots
Equities and similar securities
Bonds and similar securities 23 505 300.56 12.44 20 889 970.97 11.05 2 296 813.57 1.22
Debt securities
UCI
Repurchase agreements
Receivables 4 609 348.51 2.44 278 545.59 0.15 1 056 230.87 0.56
Financial accounts 878.51 0.00 1 045.91 0.00 66.75 0.00
Liabilities
Disposal transactions on
Financial instruments
Repurchase agreements
Payables 27 810 361.58 14.72 20 928 357.52 11.08 3 329 484.12 1.76
Financial accounts
Off-balance sheet
Hedging transactions
Other transactions
30
CONVERTIBLES EUROPE RESPONSABLE Annual report
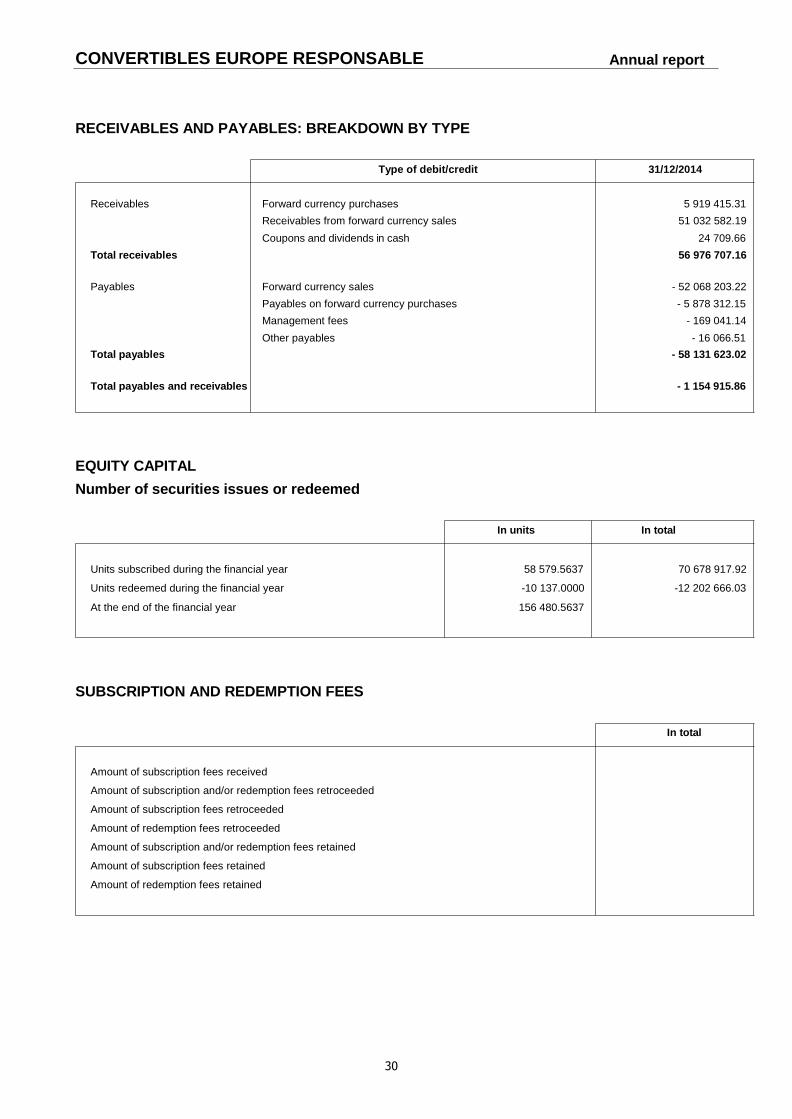
RECEIVABLES AND PAYABLES: BREAKDOWN BY TYPE
Type of debit/credit 31/12/2014
Receivables Forward currency purchases 5 919 415.31
Receivables from forward currency sales 51 032 582.19
Coupons and dividends in cash 24 709.66
Total receivables 56 976 707.16
Payables Forward currency sales - 52 068 203.22
Payables on forward currency purchases - 5 878 312.15
Management fees - 169 041.14
Other payables - 16 066.51
Total payables - 58 131 623.02
Total payables and receivables - 1 154 915.86
EQUITY CAPITAL
Number of securities issues or redeemed
In units In total
Units subscribed during the financial year 58 579.5637 70 678 917.92
Units redeemed during the financial year -10 137.0000 -12 202 666.03
At the end of the financial year 156 480.5637
SUBSCRIPTION AND REDEMPTION FEES
In total
Amount of subscription fees received
Amount of subscription and/or redemption fees retroceeded
Amount of subscription fees retroceeded
Amount of redemption fees retroceeded
Amount of subscription and/or redemption fees retained
Amount of subscription fees retained
Amount of redemption fees retained
31
CONVERTIBLES EUROPE RESPONSABLE Annual report
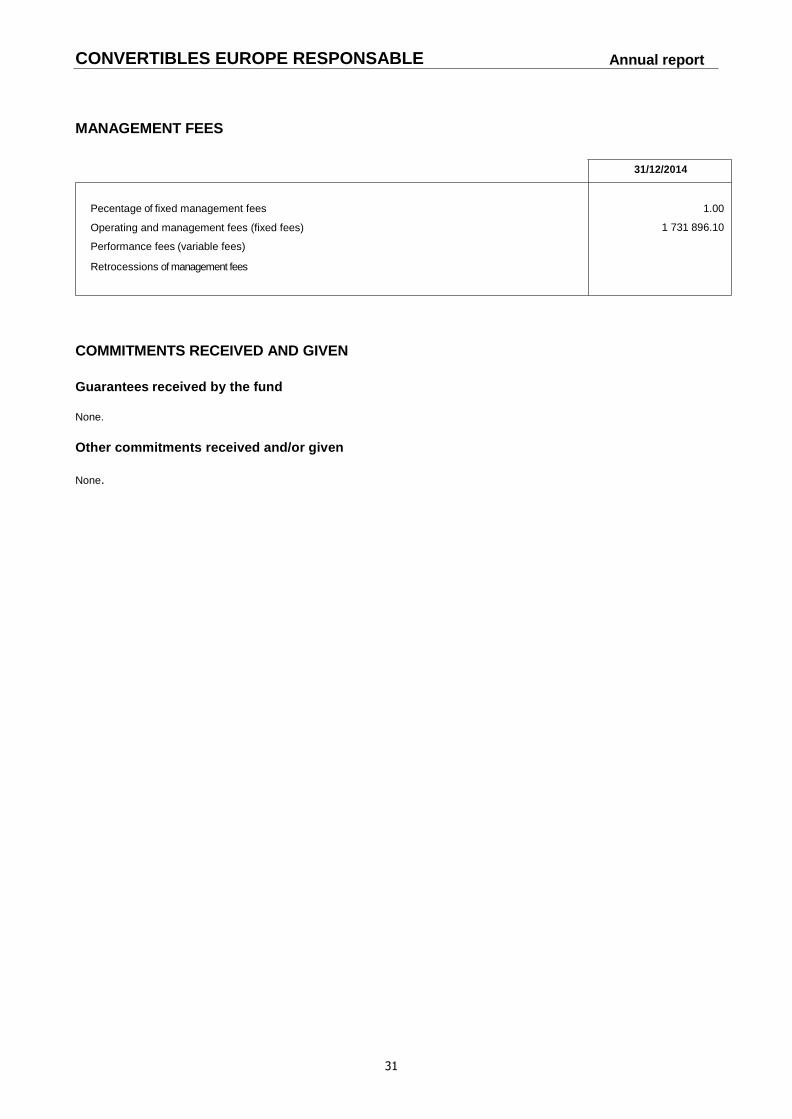
MANAGEMENT FEES
31/12/2014
Pecentage of fixed management fees
Operating and management fees (fixed fees)
Performance fees (variable fees)
Retrocessions of management fees
1.00
1 731 896.10
COMMITMENTS RECEIVED AND GIVEN
Guarantees received by the fund
None.
Other commitments received and/or given
None.

32
CONVERTIBLES EUROPE RESPONSABLE Annual report
OTHER INFORMATION
Current value of securities subject to temporary acquisition
31/12/2014
Securities provided under a repurchase agreement
Borrowed securities
Current value of securities making up guarantee deposits
31/12/2014
Financial instruments given as guarantee and maintained in the original item
Financial instruments received as guarantee and not posted to the balance sheet
Financial instruments held, issued and/or managed by the Group
Isin Code Description 31/12/2014
Equities
Bonds
Transferable debt securities
UCI
Futures
Total Group securities
33
CONVERTIBLES EUROPE RESPONSABLE Annual report
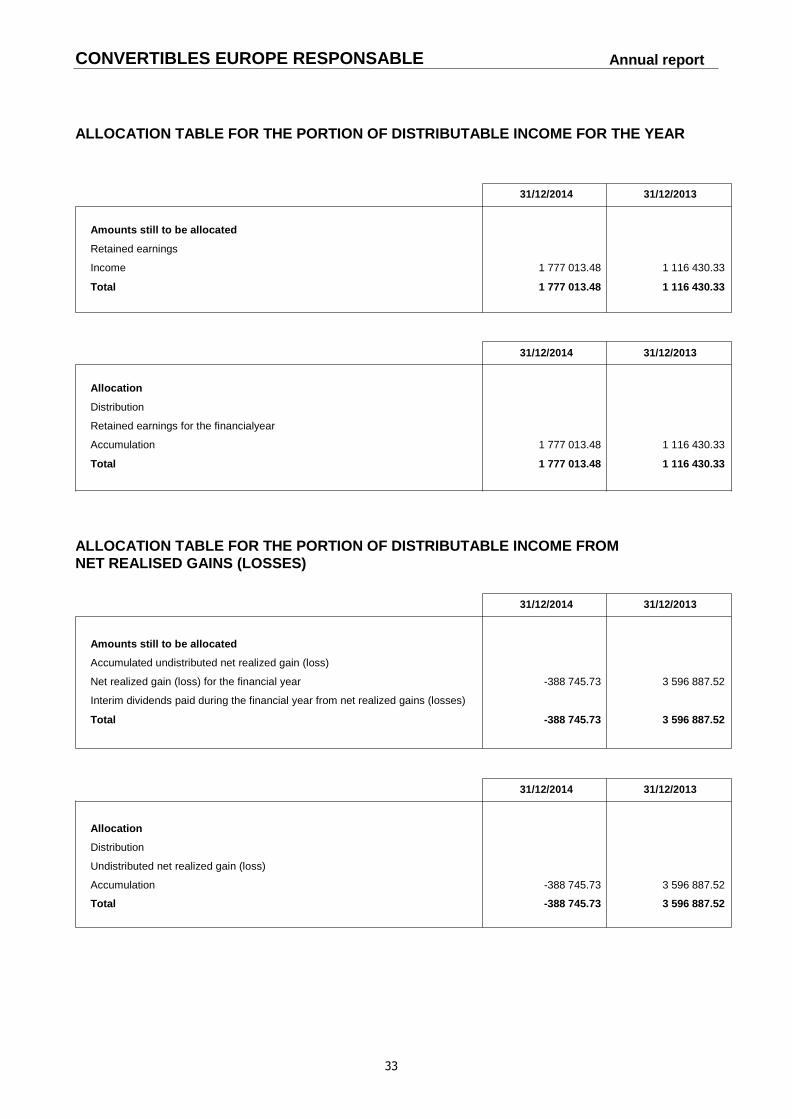
ALLOCATION TABLE FOR THE PORTION OF DISTRIBUTABLE INCOME FOR THE YEAR
31/12/2014 31/12/2013
Amounts still to be allocated
Retained earnings
Income 1 777 013.48 1 116 430.33
Total 1 777 013.48 1 116 430.33
31/12/2014 31/12/2013
Allocation
Distribution
Retained earnings for the financialyear
Accumulation 1 777 013.48 1 116 430.33
Total 1 777 013.48 1 116 430.33
ALLOCATION TABLE FOR THE PORTION OF DISTRIBUTABLE INCOME FROM
NET REALISED GAINS (LOSSES)
31/12/2014 31/12/2013
Amounts still to be allocated
Accumulated undistributed net realized gain (loss)
Net realized gain (loss) for the financial year -388 745.73 3 596 887.52
Interim dividends paid during the financial year from net realized gains (losses)
Total -388 745.73 3 596 887.52
31/12/2014 31/12/2013
Allocation
Distribution
Undistributed net realized gain (loss)
Accumulation -388 745.73 3 596 887.52
Total -388 745.73 3 596 887.52
34
CONVERTIBLES EUROPE RESPONSABLE Annual report
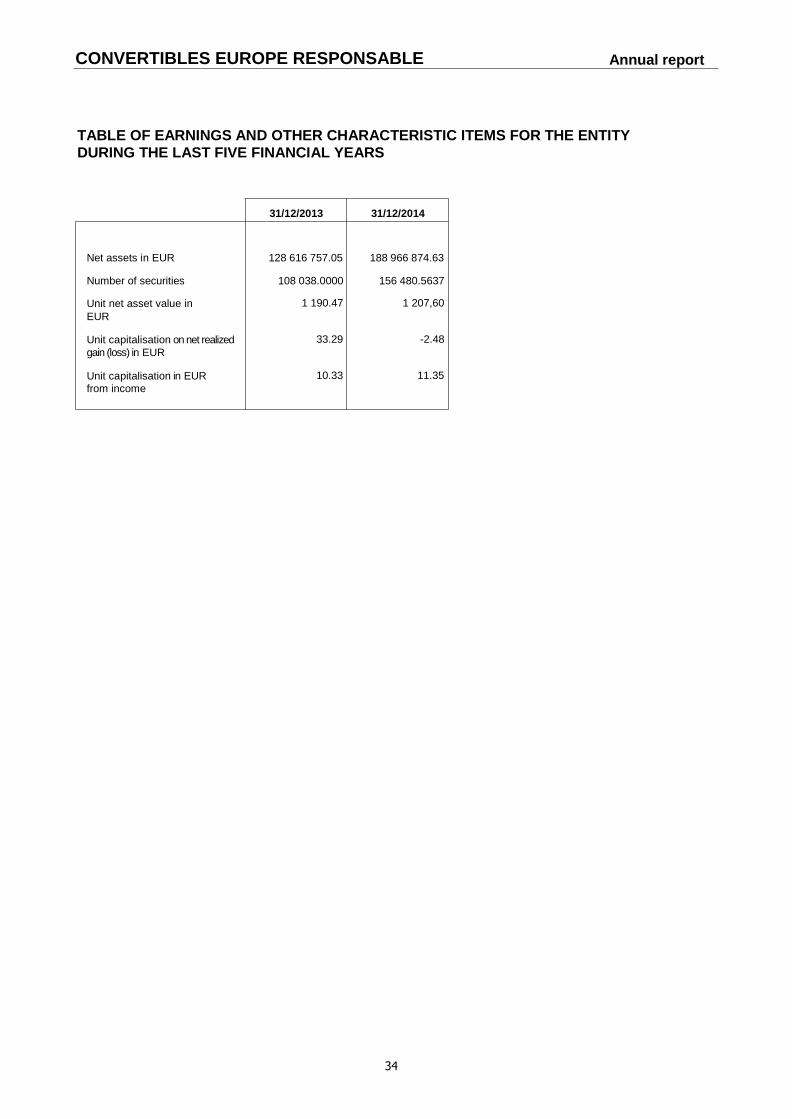
TABLE OF EARNINGS AND OTHER CHARACTERISTIC ITEMS FOR THE ENTITY
DURING THE LAST FIVE FINANCIAL YEARS
31/12/2013 31/12/2014
Net assets in EUR 128 616 757.05 188 966 874.63
Number of securities 108 038.0000 156 480.5637
Unit net asset value in
EUR
1 190.47 1 207,60
Unit capitalisation on net realized
gain (loss) in EUR
33.29 -2.48
Unit capitalisation in EUR
from income
10.33 11.35
35
CONVERTIBLES EUROPE RESPONSABLE Annual report
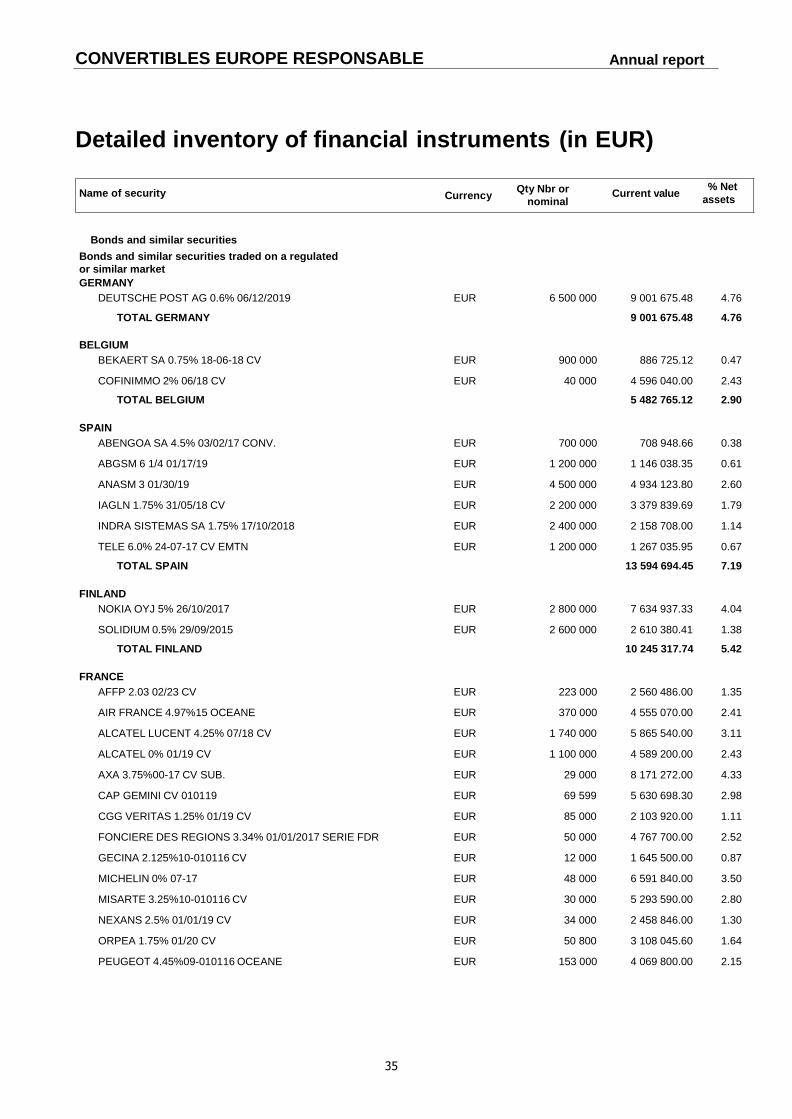
Detailed inventory of financial instruments (in EUR)
Name of security Currency Qty Nbr or
nominal Current value
% Net assets
Bonds and similar securities
Bonds and similar securities traded on a regulated
or similar market
GERMANY
DEUTSCHE POST AG 0.6% 06/12/2019 EUR 6 500 000 9 001 675.48 4.76
TOTAL GERMANY 9 001 675.48 4.76
BELGIUM
BEKAERT SA 0.75% 18-06-18 CV EUR 900 000 886 725.12 0.47
COFINIMMO 2% 06/18 CV EUR 40 000 4 596 040.00 2.43
TOTAL BELGIUM 5 482 765.12 2.90
SPAIN
ABENGOA SA 4.5% 03/02/17 CONV. EUR 700 000 708 948.66 0.38
ABGSM 6 1/4 01/17/19 EUR 1 200 000 1 146 038.35 0.61
ANASM 3 01/30/19 EUR 4 500 000 4 934 123.80 2.60
IAGLN 1.75% 31/05/18 CV EUR 2 200 000 3 379 839.69 1.79
INDRA SISTEMAS SA 1.75% 17/10/2018 EUR 2 400 000 2 158 708.00 1.14
TELE 6.0% 24-07-17 CV EMTN EUR 1 200 000 1 267 035.95 0.67
TOTAL SPAIN 13 594 694.45 7.19
FINLAND
NOKIA OYJ 5% 26/10/2017 EUR 2 800 000 7 634 937.33 4.04
SOLIDIUM 0.5% 29/09/2015 EUR 2 600 000 2 610 380.41 1.38
TOTAL FINLAND 10 245 317.74 5.42
FRANCE
AFFP 2.03 02/23 CV EUR 223 000 2 560 486.00 1.35
AIR FRANCE 4.97%15 OCEANE EUR 370 000 4 555 070.00 2.41
ALCATEL LUCENT 4.25% 07/18 CV EUR 1 740 000 5 865 540.00 3.11
ALCATEL 0% 01/19 CV EUR 1 100 000 4 589 200.00 2.43
AXA 3.75%00-17 CV SUB. EUR 29 000 8 171 272.00 4.33
CAP GEMINI CV 010119 EUR 69 599 5 630 698.30 2.98
CGG VERITAS 1.25% 01/19 CV EUR 85 000 2 103 920.00 1.11
FONCIERE DES REGIONS 3.34% 01/01/2017 SERIE FDR EUR 50 000 4 767 700.00 2.52
GECINA 2.125%10-010116 CV EUR 12 000 1 645 500.00 0.87
MICHELIN 0% 07-17 EUR 48 000 6 591 840.00 3.50
MISARTE 3.25%10-010116 CV EUR 30 000 5 293 590.00 2.80
NEXANS 2.5% 01/01/19 CV EUR 34 000 2 458 846.00 1.30
ORPEA 1.75% 01/20 CV EUR 50 800 3 108 045.60 1.64
PEUGEOT 4.45%09-010116 OCEANE EUR 153 000 4 069 800.00 2.15
36
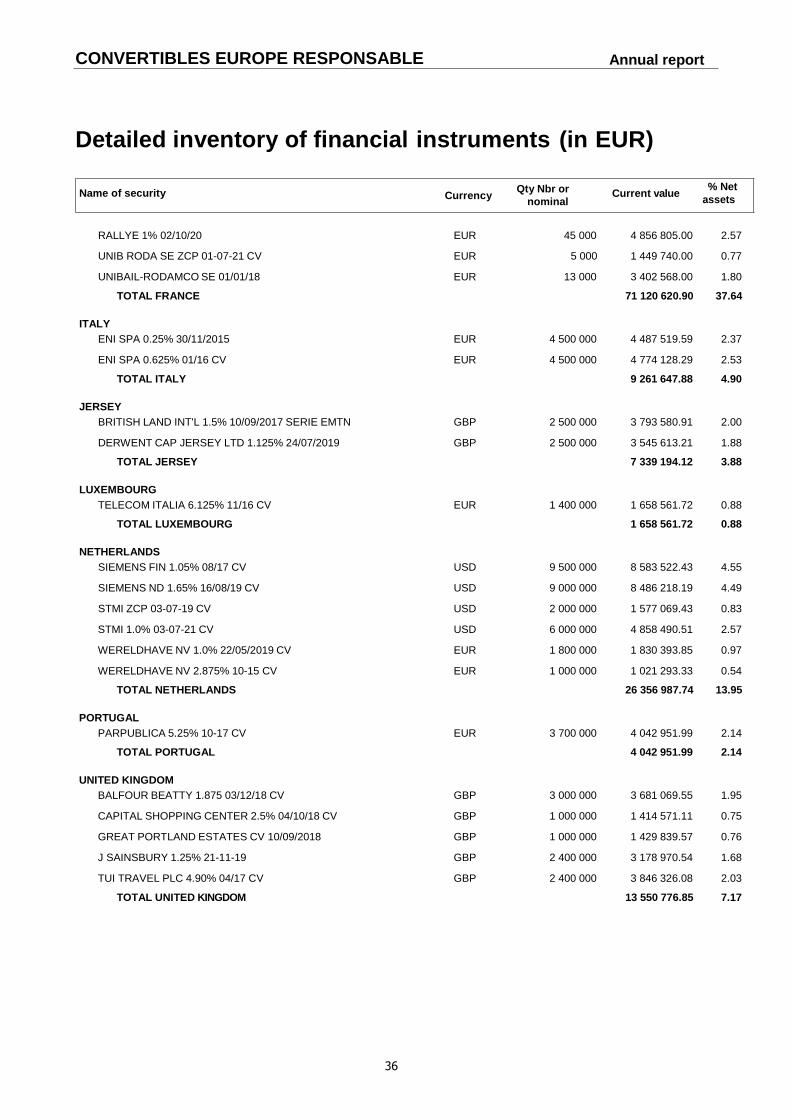
CONVERTIBLES EUROPE RESPONSABLE Annual report
Detailed inventory of financial instruments (in EUR)
Name of security Currency Qty Nbr or
nominal Current value
% Net assets
RALLYE 1% 02/10/20 EUR 45 000 4 856 805.00 2.57
UNIB RODA SE ZCP 01-07-21 CV EUR 5 000 1 449 740.00 0.77
UNIBAIL-RODAMCO SE 01/01/18 EUR 13 000 3 402 568.00 1.80
TOTAL FRANCE 71 120 620.90 37.64
ITALY
ENI SPA 0.25% 30/11/2015 EUR 4 500 000 4 487 519.59 2.37
ENI SPA 0.625% 01/16 CV EUR 4 500 000 4 774 128.29 2.53
TOTAL ITALY 9 261 647.88 4.90
JERSEY
BRITISH LAND INT'L 1.5% 10/09/2017 SERIE EMTN GBP 2 500 000 3 793 580.91 2.00
DERWENT CAP JERSEY LTD 1.125% 24/07/2019 GBP 2 500 000 3 545 613.21 1.88
TOTAL JERSEY 7 339 194.12 3.88
LUXEMBOURG
TELECOM ITALIA 6.125% 11/16 CV EUR 1 400 000 1 658 561.72 0.88
TOTAL LUXEMBOURG 1 658 561.72 0.88
NETHERLANDS
SIEMENS FIN 1.05% 08/17 CV USD 9 500 000 8 583 522.43 4.55
SIEMENS ND 1.65% 16/08/19 CV USD 9 000 000 8 486 218.19 4.49
STMI ZCP 03-07-19 CV USD 2 000 000 1 577 069.43 0.83
STMI 1.0% 03-07-21 CV USD 6 000 000 4 858 490.51 2.57
WERELDHAVE NV 1.0% 22/05/2019 CV EUR 1 800 000 1 830 393.85 0.97
WERELDHAVE NV 2.875% 10-15 CV EUR 1 000 000 1 021 293.33 0.54
TOTAL NETHERLANDS 26 356 987.74 13.95
PORTUGAL
PARPUBLICA 5.25% 10-17 CV EUR 3 700 000 4 042 951.99 2.14
TOTAL PORTUGAL 4 042 951.99 2.14
UNITED KINGDOM
BALFOUR BEATTY 1.875 03/12/18 CV GBP 3 000 000 3 681 069.55 1.95
CAPITAL SHOPPING CENTER 2.5% 04/10/18 CV GBP 1 000 000 1 414 571.11 0.75
GREAT PORTLAND ESTATES CV 10/09/2018 GBP 1 000 000 1 429 839.57 0.76
J SAINSBURY 1.25% 21-11-19 GBP 2 400 000 3 178 970.54 1.68
TUI TRAVEL PLC 4.90% 04/17 CV GBP 2 400 000 3 846 326.08 2.03
TOTAL UNITED KINGDOM 13 550 776.85 7.17
37
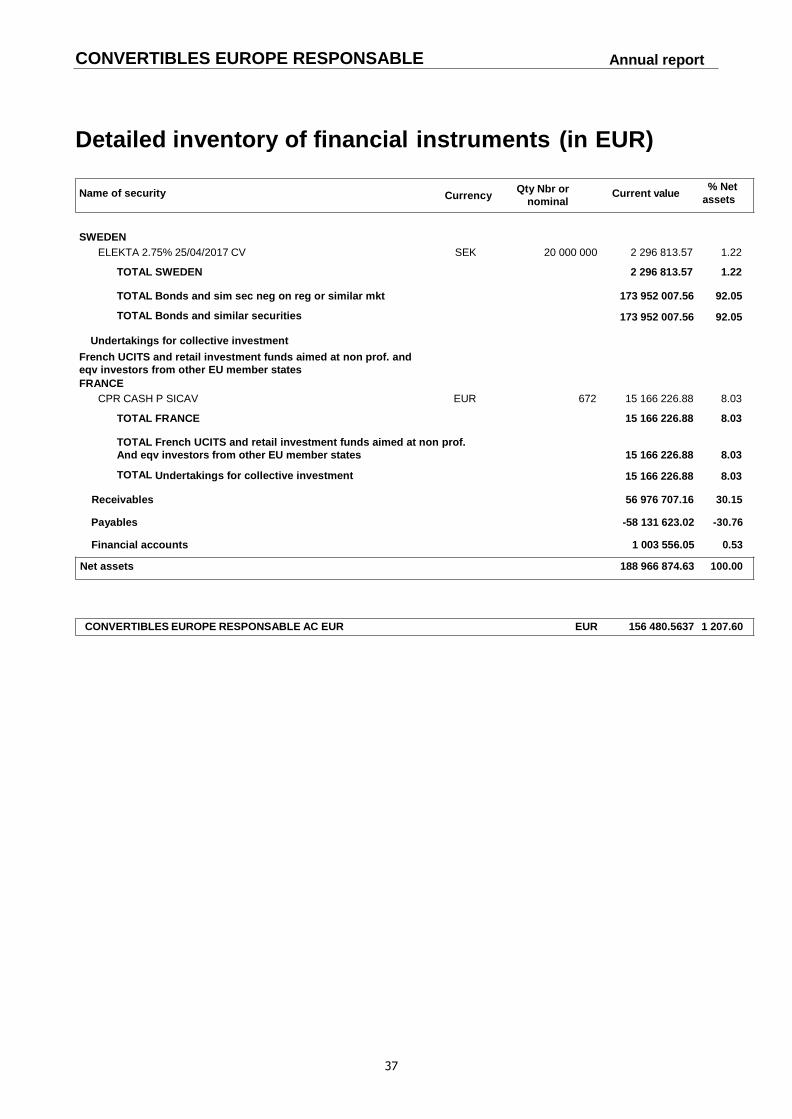
CONVERTIBLES EUROPE RESPONSABLE Annual report
Detailed inventory of financial instruments (in EUR)
Name of security Currency Qty Nbr or
nominal Current value
% Net assets
SWEDEN
ELEKTA 2.75% 25/04/2017 CV SEK 20 000 000 2 296 813.57 1.22
TOTAL SWEDEN 2 296 813.57 1.22
TOTAL Bonds and sim sec neg on reg or similar mkt 173 952 007.56 92.05
TOTAL Bonds and similar securities 173 952 007.56 92.05
Undertakings for collective investment
French UCITS and retail investment funds aimed at non prof. and
eqv investors from other EU member states
FRANCE
CPR CASH P SICAV EUR 672 15 166 226.88 8.03
TOTAL FRANCE 15 166 226.88 8.03
TOTAL French UCITS and retail investment funds aimed at non prof.
And eqv investors from other EU member states 15 166 226.88 8.03
TOTAL Undertakings for collective investment 15 166 226.88 8.03
Receivables 56 976 707.16 30.15
Payables -58 131 623.02 -30.76
Financial accounts 1 003 556.05 0.53
Net assets 188 966 874.63 100.00
CONVERTIBLES EUROPE RESPONSABLE AC EUR EUR
156 480.5637 1 207.60
38
CONVERTIBLES EUROPE RESPONSABLE Annual report
ADDITIONAL INFORMATION FOR INVESTORS IN THE FEDERAL REPUBLIC OF GERMANY
CACEIS Bank Deutschland GmbH, Lilienthalallee 34 – 36, D-80939 Munich has undertaken the function of Information Agent in the Federal Republic of Germany (the “German Information Agent”).
The Fund does not issue printed individual certificates. Applications for the redemption and conversion of units may be sent to the Management Company of the Fund: Union Bancaire Gestion Institutionnelle, 127 avenue des Champs Elysées, 75008 Paris, France. All payments to investors, including redemption proceeds and potential distributions, may, upon request, be facilitated through Union Bancaire Gestion Institutionnelle, 127 avenue des Champs Elysées, 75008 Paris, France.
The prospectus (including the Prospectus and the Management Regulations), the key investor information documents, the annual and semi-annual reports may be obtained, free of charge, in hardcopy form at the office of the Information Agent during normal opening hours.
The issue, redemption and conversion prices of the units and any other information to the unitholders are also available free of charge from the German Information Agent. The issue, redemption and conversion prices of the units and any other information to the unitholders will be published on the fund website www.ubp.com.
The statement of changes in the composition of the investment portfolio is also free of charge upon request available at the office of the German Information Agent.