Consumer/Client Satisfaction Survey SFY2005 - Delaware Health
40
THE DELAWARE DSAMH 2005 CONSUMER/CLIENT SATISFACTION SURVEY PREPARED FOR DELAWARE HEALTH AND SOCIAL SERVICES DIVISION OF SUBSTANCE ABUSE AND MENTAL HEALTH PREPARED BY PHILADELPHIA HEALTH MANAGEMENT CORPORATION July 2006 This project was developed under a contract with the Delaware Health & Social Services/Division of Substance Abuse and Mental Health (DHSS/DSAMH). Funding was provided by the Substance Abuse and Mental Health Services Administration, Center for Mental Health Services (SAMHSA/CMHS) as a part of Delaware’s Community Mental Health Services Block Grant program. The opinions and recommendations expressed in this report are solely of the authors and do not represent the policies of the State or Federal government.
Transcript of Consumer/Client Satisfaction Survey SFY2005 - Delaware Health

Philadelphia Health Management Corporation
THE DELAWARE DSAMH CONSUMER/CLIENT SATISFACTION SURVEY
PREPARED FOR DELAWARE HEALTH AND SOCIAL SERVICES
DIVISION OF SUBSTANCE ABUSE AND MENTAL HEALTH
PREPARED BY PHILADELPHIA HEALTH MANAGEMENT CORPORATION
July, 2006
This project was developed under a contract with the Delaware Health & Social Services/Division of Substance Abuse and Mental Health (DHSS/DSAMH). Funding was provided by the Substance
Abuse and Mental Health Services Administration, Center for Mental Health Services f Delaware’s Community Mental Health Services Block Grant program.
The opinions and recommendations expressed in this report are solely of the authors and do not or Federa governme
(SAMHSA/CMHS) as a part o
represent the policies of the State nt. l
THE DELAWARE DSAMH 2005 CONSUMER/CLIENT SATISFACTION SURVEY
PREPARED FOR DELAWARE HEALTH AND SOCIAL SERVICES
DIVISION OF SUBSTANCE ABUSE AND MENTAL HEALTH
PREPARED BY PHILADELPHIA HEALTH MANAGEMENT CORPORATION
July 2006
This project was developed under a contract with the Delaware Health & Social Services/Division of Substance Abuse and Mental Health (DHSS/DSAMH). Funding was provided by the Substance Abuse and Mental Health Services Administration, Center for
Mental Health Services (SAMHSA/CMHS) as a part of Delaware’s Community Mental Health Services Block Grant program. The opinions and recommendations expressed in this report are solely of the authors and do not represent the policies of the State or
Federal government.

Philadelphia Health Management Corporation
THE DELAWARE DSAMH CONSUMER/ CLIENT SATISFACTION SURVEY
July, 2006
Philadelphia Health Management Corporation
Table of Contents
Executive Summary ............................................................................................... 1 Introduction ............................................................................................................ 3 Methodology........................................................................................................... 4 Findings ................................................................................................................. 9 Demographic Characteristics of Survey Respondents ..................................... 9 Survey Results............................................................................................... 12 Access to Services.................................................................................... 12 Quality and Appropriateness of Services .................................................. 15 Participation in Treatment Planning .......................................................... 16 Outcomes.................................................................................................. 16 Overall Satisfaction ................................................................................... 17 Survey Respondent Comments ................................................................ 18 MHSIP Satisfaction Indicators........................................................................ 19 Access to Treatment ................................................................................. 20 Quality and Appropriateness of Services ................................................... 25 Outcomes................................................................................................... 25 Participation in Treatment Planning .......................................................... 26 Overall Satisfaction ................................................................................... 28
Trend Data: 2002, 2004, and 2005 Survey Results ....................................... 28
Conclusion and Recommendations................................................................ 29 Appendix A: DSAMH Survey Instrument

Philadelphia Health Management Corporation
Table and Figures
Tables Table 1. Respondents by Type of Treatment Program Modality .........................7 Table 2. Demographic Characteristics of Respondents by Type of Treatment
Program ........................................................................................................8 Table 3. Demographic Characteristics of Delaware Treatment Population by
Type of Treatment Program..........................................................................9 Table 4. Demographic Characteristics of Respondents by Court Ordered
Status .........................................................................................................11 Table 5. Respondents Who Agree or Strongly Agree with Survey Statements
by Type of Treatment Program ...................................................................14 Table 6. Respondents’ Comments Regarding Current Treatment Facility ........18 Table 7. Respondents’ Satisfaction with Selected Aspects of Treatment by Type
of Treatment Program.................................................................................19 Table 8. Respondents’ Satisfaction with Selected Aspects of Treatment
by Age.........................................................................................................21 Table 9. Respondents’ Satisfaction with Selected Aspects of Treatment by
Gender........................................................................................................21 Table 10. Respondents’ Satisfaction with Selected Aspects of Treatment by
Race and Ethnicity ......................................................................................22 Table 11. Respondents’ Satisfaction with Selected Aspects of Treatment by
Type and Court Ordered Status..................................................................23 Table 12. Respondents’ Satisfaction with Selected Aspects of Treatment by
Program Modality........................................................................................24
Figures Figure 1. Distribution of Respondents by Age and Type of Treatment..............10 Figure 2. Distribution of Respondents by Treatment Type and Court Ordered
Status..........................................................................................................12 Figure 3. Consumer/Clients’ Satisfaction with Selected Aspects of Treatment
by Type of Treatment Program ...................................................................20 Figure 4. Mental Health Consumers’ Satisfaction with Selected Aspects of
Treatment by Court Ordered Status............................................................23 Figure 5. Substance Abuse Clients’ Satisfaction with Selected Aspects of
Treatment by Court Ordered Status............................................................27 Figure 6. Respondents' Satisfaction with Selected Aspects of Treatment:
2002-2005...................................................................................................29

Philadelphia Health Management Corporation
Over the last three years the Delaware Psychiatric Center, has sponsored photography groups and activities. Initially the groups were run on the Kent 2 Unit but they have now expanded to include consumers from the Sussex 1, 2 and 3 Units. Consumers have had the opportunity to learn the basics of photography moving from simple one-use cameras to more complex automatic models. All pictures shown were taken by consumers.

Philadelphia Health Management Corporation
EXECUTIVE SUMMARY
This report summarizes the findings from a statewide satisfaction survey of 2,227 consumers and clients of the Delaware Division of Substance Abuse and Mental Health (DSAMH), which was conducted between April, 2005 and February, 2006. The survey was jointly administered by DSAMH and the Philadelphia Health Management Corporation (PHMC). The purpose of the survey was to collect information on consumer/client satisfaction with treatment in order to assess the extent to which these programs provided high quality services to Delaware consumers and clients. Consumer satisfaction with services, access, and outcomes are an important part of the management information used by the DSAMH Executive staff and constituents to measure the success of the service delivery system. The consumer/client satisfaction survey was originally piloted in 1998 and repeated with larger samples in 2002, and 2004. • The 32-item survey instrument was based on a 28-item satisfaction
survey developed by the U.S. Substance Abuse and Mental Health Services Administration, Office of Mental Health Services, Mental Health Statistics Improvement Program (MHSIP), and included four additional questions specific to Delaware mental health and substance abuse service consumers.
• The findings in this report are based on a written survey administered to a sample of 2,227 Delaware mental health and substance abuse services consumers and clients.
• The sample was drawn from 12,980 unduplicated mental health consumers and substance abuse clients treated in Delaware-funded programs from July 1, 2004 through June 30, 2005.
• The sample was stratified according to the type of treatment program and the number of persons seen annually. Programs were sampled at a 10% rate except for Community Continuum of Care programs, which were over sampled at a rate of 30%, and programs with less than 50 clients annually, which were assigned a sample of 10 clients per site to include sufficient cases for analysis.
• This plan resulted in a sample of 2,223 cases. Of these, 2,227 interviews (100.2%) were completed.
The results of the 2005 Delaware Consumer/Client Satisfaction Survey were similar to results in previous years. • In fact, overall consumer/client satisfaction (75.3%) and satisfaction
with participation in treatment planning (60.8%), extent of positive
1

Philadelphia Health Management Corporation
change (73.8%), and the quality and appropriateness of services (78.9%) rose slightly in 2005 compared to 2002.
• Unlike the previous surveys, consumer/clients in 2005 were slightly less likely to be satisfied with their access to services (71.9%) than in other areas. However, consistent with prior years, consumer's perception of the single measure of their ability to participate in planning their treatment (57.6%) remained lowest among all the 32 individual measures of consumer satisfaction.
Although satisfaction with treatment continues to vary across different age, racial, and ethnic subgroups of consumer/clients, results from the 2005 survey for these consumer subgroups differed from results from previous years. • As in the past, consumers who were participating voluntarily in
substance abuse or mental health treatment tended to be more satisfied than those who were ordered by a court to participate.
• However, unlike previous surveys, substance abuse clients in general were more likely to be satisfied with every aspect of their treatment than mental health services consumers.
• Consumer/clients who were participating in programs which addressed both substance abuse and mental health issues tended to be the least satisfied of the three different types of treatment groups, perhaps because their problems were more severe.
• Overall, younger consumers were more likely to be dissatisfied than older consumers, except in the area of participation in treatment planning, where older consumers were the most dissatisfied.
• In contrast to previous surveys, where ethnic and racial minorities tended to be less satisfied than Caucasian consumer/clients, there were no consistent differences seen across racial and ethnic subgroups in the 2005 survey results.
The study results suggest that efforts to improve consumer/client satisfaction should focus on determining specific reasons why consumers and clients overall feel that they do not have a large enough role in participating in planning their treatment, and why satisfaction with participation remains relatively low compared to other satisfaction measures. Relatively low rates of consumer/client satisfaction with treatment outcomes, especially with progress in school or work, ability to get and keep a job, and improvement in housing situations should also be explored with treatment program staff to determine whether more attention needs to be devoted to improving outcomes for consumers in these areas.
2

Philadelphia Health Management Corporation
INTRODUCTION
This report summarizes the findings from a statewide satisfaction survey of 2,227 consumers and clients of the Delaware Division of Substance Abuse and Mental Health (DSAMH), which was conducted between April, 2005 and February, 2006. The survey was jointly administered by DSAMH and the Philadelphia Health Management Corporation (PHMC). The purpose of the survey was to collect information on consumer/client satisfaction with treatment in order to assess the extent to which these programs provided high quality services to Delaware consumers and clients. Consumer satisfaction with services, access, and outcomes are an important part of the management information used by the DSAMH Executive staff and constituents to measure the success of the service delivery system. The consumer/client satisfaction survey was originally piloted in 1998 and repeated with larger samples in 2002, and 2004. Delaware’s Behavioral Health Care Service System Responsibility for Delaware's public behavioral health treatment and prevention services is divided between two cabinet level agencies. Delaware Health and Social Services/Division of Substance Abuse and Mental Health (DHSS/DSAMH) is the single state agency for mental health and substance abuse prevention and treatment services for adults aged 18 years and older. DSAMH is responsible for meeting the treatment, rehabilitation and support needs of consumers and clients. The Division receives Federal and State dollars for the sole purpose of administering mental health, substance abuse and gambling prevention and treatment services in Delaware. The Division consists of the Central Office, the Delaware Psychiatric Center, Substance Abuse Services, and the Community Mental Health Center (CMHC). The CMHC includes four Community Continuum of Care Programs, five Community Mental Health Clinics, three day programs, statewide crisis services, and fourteen 24-hour supervised group residences. DSAMH's mission is to: Improve the quality of life for adults with mental illness, alcoholism, drug addiction or gambling addiction by promoting their health and well being, fostering their self-sufficiency, and protecting those who are at-risk.
3

Philadelphia Health Management Corporation
In keeping with its mission, DSAMH maintains the following goals: • Integrate and maintain a coordinated and comprehensive statewide
public and private, inpatient, residential and community-based behavioral health service system;
• Promote inter-agency and intra-agency collaboration and cooperation to ensure accessibility, responsiveness and continuity of services;
• Develop and maintain a statewide management system to ensure quality, appropriateness and efficient utilization of services;
• Ensure consumer and family involvement in the development and operation of the mental health and substance abuse service system;
• Develop and maintain programs that are culturally competent; and • Develop and maintain a culturally diverse and culturally competent
workforce. In State Fiscal Year 2005 DSAMH served 12,980 unique clients. This represents 1.5% of the Delaware adult population. DSAMH provided 17,399 episodes of care during the year. Of these episodes of care, 3.3% were in Delaware Psychiatric Center, 35.5% were in the Community Mental Heath system, and 61.3% were in the Substance Abuse treatment system. At any given time DSAMH has approximately 6,286 active episodes of treatment. The next section, Methodology, describes the survey content and procedures, followed by a presentation of the survey findings. The final section of the report presents conclusions and recommendations for reviewing DSAMH's treatment programs.
METHODOLOGY
Sampling Plan The findings in this report are based on a written survey administered to a sample of 2,227 Delaware mental health and substance abuse services consumers and clients. The sample was drawn from 12,980 unduplicated mental health consumers and substance abuse clients treated in Delaware-funded programs from July 1, 2004 through June 30, 2005. The sample was stratified according to the type of treatment program and the number of persons seen annually. Programs were sampled at a 10% rate except for Community Continuum of Care programs which were over sampled at a rate of 30% and programs with less than 50 clients annually which were assigned a sample of 10 clients per site to include sufficient cases for analysis. This plan resulted in a sample of 2,223 cases. Of these, 2,227 interviews (100.2%) were completed. It is important to note
4

Philadelphia Health Management Corporation
that four additional surveys were conducted due to high consumer interest in the survey. The use of the stratified sample drawn from an annual census also resulted in a greater number of surveys from Delaware's two short-term detoxification sites, which have a much higher rate of turnover than any of the programs at mental health treatment sites. The findings from this study may be somewhat limited in generalizability to the entire population of mental health consumers and substance abuse clients treated in DSMH-funded programs because a convenience sample was used instead of a randomly selected sample. Survey Instrument The 32-item survey instrument was based on a 28-item satisfaction survey developed by the U.S. Substance Abuse and Mental Health Services Administration, Center for Mental Health Services, Mental Health Statistics Improvement Program (MHSIP). The MHSIP consumer survey was developed and proposed as one of several instruments to measure the domains, concerns, and indicators of the MHSIP Consumer-Oriented Report Card, which was developed by a task force of consumers, family members, researchers, and federal, state, and local mental health agency representatives in April, 1996. The consumer survey was specifically designed to measure concerns that were important to consumers in the areas of Access, Quality/Appropriateness, Outcomes, Overall Satisfaction, and Participation in Treatment Planning. Pilot tests of the consumer survey were conducted in several states. Some states have successfully used the survey with adults with episodic mental illness and with adults with a history of substance abuse.1
The Delaware survey employs a five-point scale to measure agreement with 32 statements regarding the consumer's perception of the treatment program the consumer or client is currently attending (See Appendix A for a copy of the Delaware survey). The 32 statements include the 28-item MHSIP survey and four additional questions measuring the ease a case manager can be contacted in time of crisis, how staff treat people of different races and sexual orientations, and improvement with job skills. Included in the survey are the questions used to construct the five scales contained in the MHSIP survey. The statements concern five important aspects of consumer perceptions of treatment which have been identified by MHSIP as being correlated with positive treatment outcomes: access to care, quality and appropriateness of services, outcomes, consumer participation in treatment planning, and overall satisfaction. Positive
1 Ganju, V. The MHSIP Consumer Survey: History, Development, Revisions, Applications, Commonly-asked Questions. Texas Department of Mental Health/Mental Retardation, May 13, 1999.
5

Philadelphia Health Management Corporation
consumer perceptions in these five areas were measured by calculating the percentage of consumers agreeing with the following 22 statements:2
Access:
Location of the services was convenient. Staff were willing to see me as often as I felt was necessary. Staff returned my calls within 24 hours. Services were available at times that were good for me. Quality and Appropriateness of Services: Staff believed I could grow, change and recover. I felt free to complain. Staff told me what side effects to watch for.
Staff respected my wishes about who is and is not to be given information about my treatment.
Staff were sensitive about my cultural/ethnic background. Staff helped me obtain the information I needed so I could take
charge of managing my illness.
Outcomes: I deal more effectively with daily problems. I am better able to control my life. I am better able to deal with crisis. I am getting along better with my family. I do better in social situations. I do better in school and/or work. My symptoms are not bothering me as much.
Consumer Participation in Treatment Planning:
I, not staff, decided my treatment goals. I felt comfortable asking questions about my treatment and
medication.
Overall Satisfaction: I liked the services that I received here. If I had other choices, I would still get services at this agency. I would recommend this agency to a friend or family member.
Survey Administration This survey was administered to a sample of consumers from all DSAMH treatment programs by trained consumer interviewers who distributed the surveys to a convenience sample of consumers at each treatment site and assisted them with their responses as necessary. The questionnaire was available in both English and Spanish. Written, informed consent to 2 Missing values and "not applicable" answers were excluded.
6
Philadelphia Health Management Corporation
participate was obtained from each consumer and survey responses were anonymous and confidential.
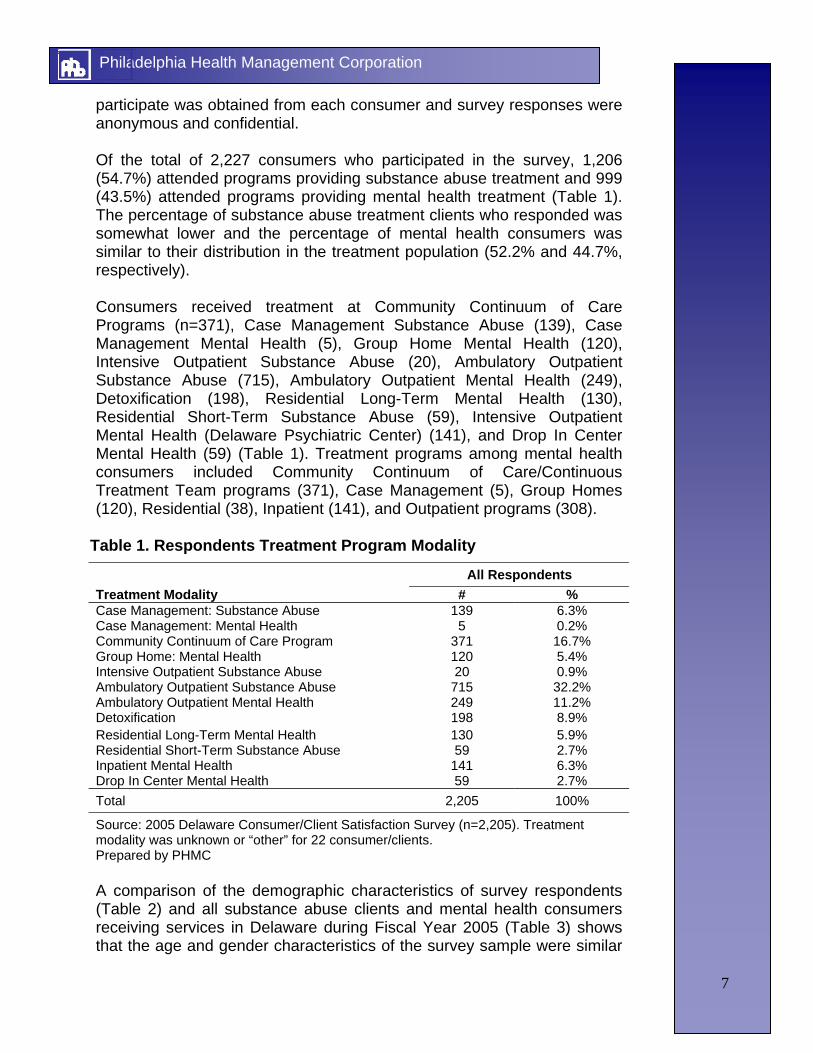
Of the total of 2,227 consumers who participated in the survey, 1,206 (54.7%) attended programs providing substance abuse treatment and 999 (43.5%) attended programs providing mental health treatment (Table 1). The percentage of substance abuse treatment clients who responded was somewhat lower and the percentage of mental health consumers was similar to their distribution in the treatment population (52.2% and 44.7%, respectively). Consumers received treatment at Community Continuum of Care Programs (n=371), Case Management Substance Abuse (139), Case Management Mental Health (5), Group Home Mental Health (120), Intensive Outpatient Substance Abuse (20), Ambulatory Outpatient Substance Abuse (715), Ambulatory Outpatient Mental Health (249), Detoxification (198), Residential Long-Term Mental Health (130), Residential Short-Term Substance Abuse (59), Intensive Outpatient Mental Health (Delaware Psychiatric Center) (141), and Drop In Center Mental Health (59) (Table 1). Treatment programs among mental health consumers included Community Continuum of Care/Continuous Treatment Team programs (371), Case Management (5), Group Homes (120), Residential (38), Inpatient (141), and Outpatient programs (308).
Table 1. Respondents Treatment Program Modality
All Respondents Treatment Modality # % Case Management: Substance Abuse 139 6.3% Case Management: Mental Health 5 0.2% Community Continuum of Care Program 371 16.7% Group Home: Mental Health 120 5.4% Intensive Outpatient Substance Abuse 20 0.9% Ambulatory Outpatient Substance Abuse 715 32.2% Ambulatory Outpatient Mental Health 249 11.2% Detoxification 198 8.9% Residential Long-Term Mental Health 130 5.9% Residential Short-Term Substance Abuse 59 2.7% Inpatient Mental Health 141 6.3% Drop In Center Mental Health 59 2.7% Total 2,205 100%
Source: 2005 Delaware Consumer/Client Satisfaction Survey (n=2,205). Treatment modality was unknown or “other” for 22 consumer/clients. Prepared by PHMC
A comparison of the demographic characteristics of survey respondents (Table 2) and all substance abuse clients and mental health consumers receiving services in Delaware during Fiscal Year 2005 (Table 3) shows that the age and gender characteristics of the survey sample were similar
7

Philadelphia Health Management Corporation
to those of the entire DSAMH consumer population. However, the survey sample contained more than twice as many Latinos (11.0%) as the treatment population as a whole (5.9%). Table 2. Demographic Characteristics of Respondents by Type of
Treatment Program Substance
Abuse Mental Health
All Respondents Characteristic
(N=1206) (N=999) (N= 2,227)§
Age 18-24 25.9% 7.5% 17.5% 25-34 27.7% 13.5% 21.4%
35-44 27.4% 25.3% 26.4%
45-54 15.3% 31.6% 22.6%
55-64 3.2% 14.9% 8.5%
65+ 0.5% 7.3% 3.6% Race
African American 26.2% 26.9% 26.5% Caucasian 52.3% 56.0% 54.0% Other 21.5% 17.1% 19.5%
Latino Origin Latino 12.8% 9.2% 11.0%
Gender Male 71.4% 50.7% 61.4% Female 28.6% 49.3% 38.6%
Court Ordered Court ordered 52.4% 13.9% 34.7% Non court ordered 47.6% 86.1% 65.3%
Source: 2005 Delaware Consumer/Client Satisfaction Survey (n=2,205). Treatment modality was unknown or “other” for 22 consumer/clients. Prepared by PHMC
8

Philadelphia Health Management Corporation
Table 3. Demographic Characteristics of Delaware Treatment Population by Type of Treatment Program
Program Type
Substance Abuse
Mental Health All Respondents Characteristic
(N=8,270 ) (N=4,710 ) (N=12,980 ) Age
18-24 27.8% 7.4% 20.4%
25-34 29.4% 15.2% 24.3%
35-44 26.5% 26.3% 26.4%
45-54 13.0% 27.8% 18.4%
55-64 2.6% 13.8% 6.7%
65+ 0.7% 9.5% 3.9%
Race African American 35.3% 26.4% 32.1%
Caucasian 61.6% 69.4% 64.4% Other 3.1% 4.2% 3.5%
Latino Origin Latino 5.0% 8.2% 5.9%
Gender Male 76.6% 49.8% 66.9% Female 23.4% 50.2% 33.1%
Source: Delaware Health and Social Services Division of Substance Abuse and Mental Health State Fiscal Year 2005. Prepared by PHMC.
FINDINGS
Demographic Characteristics of Survey Respondents The majority of consumer/clients who completed the survey were Caucasian (54.0%) and male (61.%) (Table 2). More than one-quarter of consumer/clients (26.5%) were African American. Slightly more than one-in-ten consumer/clients who reported their ethnic origin were Latino (11.0%). Two-thirds of those who described their Latino origin were Puerto Rican (67.6%), followed by Mexican (16.7%), and Cuban (15.7%). More than one-third of consumer/clients (38.9%) were between the ages of 18 and 34 and one-quarter of survey respondents (26.4%) were aged 35-44. Only 3.6% of consumer/clients were aged 65 or over, 8.5% were aged 55-64, and 22.6% were aged 45-54. Consumers’ demographic characteristics differed by the type of treatment they received (Table 2). Overall, substance abuse clients tended to be younger, male, and Caucasian; mental health consumers tended to be older, equally likely to be male or female, and Caucasian. For example,
9

Philadelphia Health Management Corporation
53.6% of substance abuse clients were between the ages of 18 and 34, compared to 21.0% of mental health consumers (Figure 1). Mental health consumers (56.0%) were slightly more likely to be Caucasian than substance abuse clients (52.3%).
Figure 1. Distribution of Respondents by Age and Type of Treatment
0.0%
5.0%
10.0%
15.0%
20.0%
25.0%
30.0%
35.0%
Substance Abuse Mental Health
Type of Treatment
Perc
ent
18-24 25-34 35-44 45-54 55-64 65+
Source: 2005 Delaware Consumer/Client Satisfaction Survey (n=2,227) Prepared by PHMC
Demographic characteristics also differed between court-ordered and non-court-ordered consumer/clients (Table 4). These differences tend to reflect the fact that the majority of court-ordered consumer/clients were being treated in substance abuse programs (82.0%) (Figure 2). Similar to the substance abuse treatment clients, court-ordered consumer/clients tended to be younger than consumer/clients who were being treated voluntarily: three times as many were aged 18-24 (30.8% compared to 10.7% respectively). Court-ordered consumer/clients were also more likely to be male (75.4% compared to 54.1% of non-court-ordered consumer/clients), and a higher percentage of court-ordered consumer/clients were Latino (13.1%) than non-court-ordered consumer/clients (9.7%). Court-ordered consumers (28.4%) were slightly more likely to be African American than non-court-ordered consumers (25.7%). Conversely, non-court-ordered consumers (58.7%) were slightly more likely to be Caucasian than court-ordered consumers (49.6%).
10

Philadelphia Health Management Corporation
Table 4. Demographic Characteristics of Respondents by Court Ordered Status
Court Ordered Non Court Ordered All
Respondents Characteristic (N=730) (N=1,371) (N=2,227) §
Age 18-24 30.8% 10.7% 17.5%
25-34 26.7% 18.5% 21.4%
35-44 25.8% 26.4% 26.4%
45-54 13.3% 28.0% 22.6%
55-64 2.9% 11.3% 8.5%
65+ 0.4% 5.2% 3.6%
Race African American 28.4% 25.7% 26.5%
Caucasian 49.6% 58.7% 54.0% Other 22.0% 15.6% 19.5%
Latino Origin Latino 13.1% 9.7% 11.0%
Gender Male 75.4% 54.1% 61.4% Female 24.6% 45.9% 38.6%
Type of Treatment Program Mental Health 18.0% 60.0% 45.3% Substance Abuse 82.0% 40.0% 54.7%
Source: 2005 Delaware Consumer/Client Satisfaction Survey (n=2,101) §126 survey respondents did not specify Court ordered status. Prepared by PHMC
11

Philadelphia Health Management Corporation
Figure 2. Distribution of Respondents by Treatment Type and Court Ordered Status
13.9%
52.4%
86.1%
47.6%
0%10%20%30%40%50%60%70%80%90%
100%
Mental Health Substance Abuse
Perc
ent
Court Ordered Non Court Ordered
Source: 2005 Delaware Consumer/Client Satisfaction Survey (n=2,101) 126 survey respondents did not specify Court ordered status. Prepared by PHMC Survey Results The 32-item DSAMH Consumer/Client Survey measured consumer satisfaction in five broad areas which are critical to program success: 1) access to services; 2) quality and appropriateness of treatment by staff, including staff sensitivity, respect for confidentiality, and ability to empower consumers; 3) consumer participation in treatment planning; 4) treatment outcomes; and 5) overall satisfaction. • Access to Services
“I would like to be able to see my case manager more often & regularly at appointed times to discuss life issues.” “Staff is very accommodating with appointment times, picking up meds, etc.”
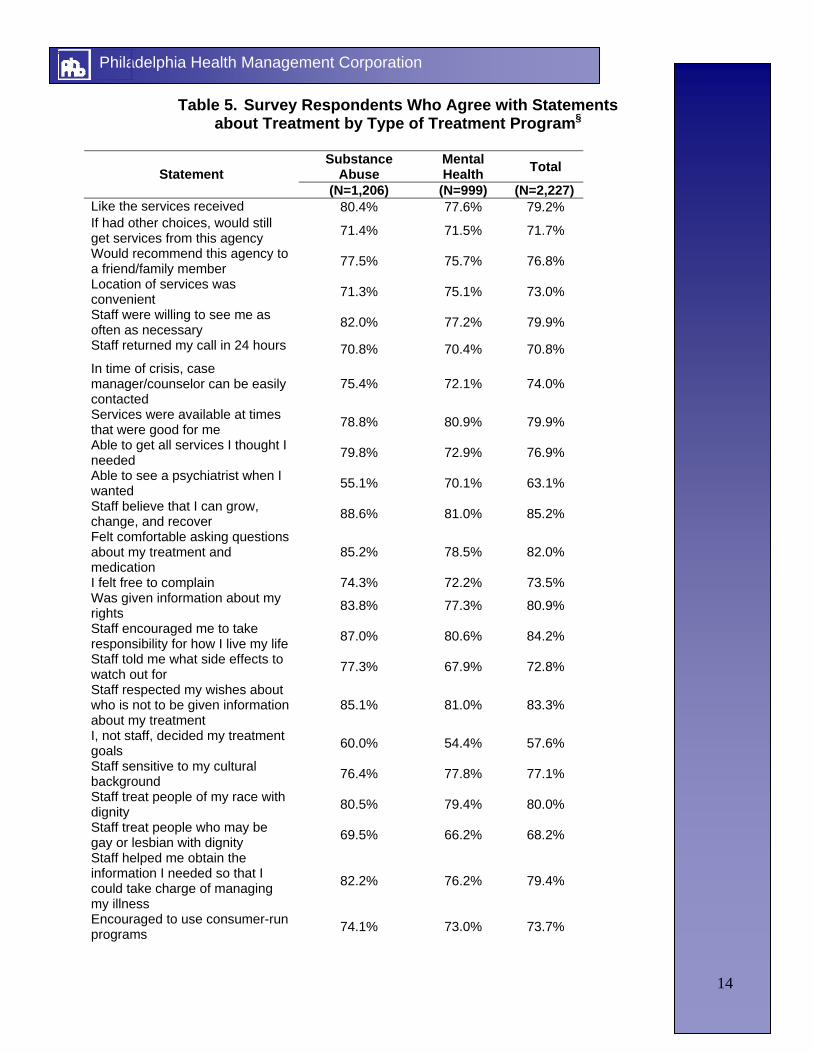
The majority of consumer/clients were satisfied with their access to services (Table 5). More than three-quarters of consumer/clients believed that services were provided at convenient times (79.9%), that staff were willing to see them as often as necessary (79.9%), and that they were able to get all the services they thought they needed (76.9%). Consumer/clients were less satisfied with the ease of contacting their case manager or counselor in a time of crisis (74.0%), the location of services (73.0%), the timeliness in which staff returned their phone calls (70.8%), and their ability to see a psychiatrist when they wanted (63.1%).
12

Philadelphia Health Management Corporation
Mental health consumers were slightly less satisfied than substance abuse clients with the willingness of staff to see them as often as necessary (77.2% versus 82.0%) and with the ease of contacting their case manager in times of crisis (72.1% versus 75.4%). Substance abuse clients were slightly less satisfied than mental health consumers with the times services were available (78.8% versus 80.9%) and the location of services (71.3% versus 75.1%).
13
Philadelphia Health Management Corporation
Table 5. Survey Respondents Who Agree with Statements about Treatment by Type of Treatment Program§
Substance
Abuse Mental Health Total Statement
(N=1,206) (N=999) (N=2,227)
Like the services received 80.4% 77.6% 79.2% If had other choices, would still get services from this agency 71.4% 71.5% 71.7%
Would recommend this agency to a friend/family member 77.5% 75.7% 76.8%
Location of services was convenient 71.3% 75.1% 73.0%
Staff were willing to see me as often as necessary 82.0% 77.2% 79.9%
Staff returned my call in 24 hours 70.8% 70.4% 70.8% In time of crisis, case manager/counselor can be easily contacted
75.4% 72.1% 74.0%
Services were available at times that were good for me 78.8% 80.9% 79.9%
Able to get all services I thought I needed 79.8% 72.9% 76.9%
Able to see a psychiatrist when I wanted 55.1% 70.1% 63.1%
Staff believe that I can grow, change, and recover 88.6% 81.0% 85.2%
Felt comfortable asking questions about my treatment and medication
85.2% 78.5% 82.0%
I felt free to complain 74.3% 72.2% 73.5% Was given information about my rights 83.8% 77.3% 80.9%
Staff encouraged me to take responsibility for how I live my life 87.0% 80.6% 84.2%
Staff told me what side effects to watch out for 77.3% 67.9% 72.8%
Staff respected my wishes about who is not to be given information about my treatment
85.1% 81.0% 83.3%
I, not staff, decided my treatment goals 60.0% 54.4% 57.6%
Staff sensitive to my cultural background 76.4% 77.8% 77.1%
Staff treat people of my race with dignity 80.5% 79.4% 80.0%
Staff treat people who may be gay or lesbian with dignity 69.5% 66.2% 68.2%
Staff helped me obtain the information I needed so that I could take charge of managing my illness
82.2% 76.2% 79.4%
Encouraged to use consumer-run programs 74.1% 73.0% 73.7%
14

Philadelphia Health Management Corporation
15
Substance Abuse
Mental Health Total Statement
(N=1,206) (N=999) (N=2,227)
As a direct result of services I received I:
Deal more effectively with daily problems 76.5% 75.2% 76.0%
Better able to control my life 78.6% 75.5% 77.2% Better able to deal with crisis 77.1% 74.4% 75.8% Get along better with my family 75.4% 72.6% 74.2% Do better in social situations 74.1% 72.3% 73.3% Do better in school/work 73.6% 61.2% 69.0% Better able to get and keep a job 72.5% 57.0% 66.5% Housing situation has improved 64.9% 61.1% 63.2% Symptoms are not bothering me as much 74.3% 67.5% 71.1%
§ Percentage who agree or strongly agree. 22 survey respondents did not specify type of treatment program. Source: 2005 Delaware consumer/Client Satisfaction Survey (n=2,205) Prepared by PHMC • Quality and Appropriateness of Services
“I am very pleased with the way people treat me like a person I am. They have always been very respectful to me. I am very glad that I am able to come here. And hope to keep on coming.” “Front desk has not always been friendly and helpful. Could be more cheerful. Files left on desk with names are viewable by clients.”
The overwhelming majority of consumer/clients were satisfied with the quality of staff and the clinical treatment they received (Table 5). Eighty percent or more of consumer/clients agreed or strongly agreed with most of the statements regarding quality and appropriateness of services. For example, 84.2% of consumer/clients agreed that staff encouraged them to take responsibility for their actions, that staff thought they could grow and change (85.2%), and that staff respected their wishes about who is not to be given information about their treatment (83.3%). Consumer/clients were least satisfied with staff treatment of consumer/clients who might be gay or lesbian (68.2%). A higher percentage of substance abuse clients were more likely to agree with statements regarding quality and appropriateness of services than were mental health consumers, including: • belief that staff encouraged them to take responsibility for their
actions (87.0% versus 80.6%, respectively),

Philadelphia Health Management Corporation
• belief that staff thought they could grow and change (88.6% versus 81.0%), and
• feeling free to complain (74.3% versus 72.2%). • Participation in Treatment Planning
“The staff and I have discussed issues which I need to deal with. We have both agreed to my treatment plan because of the discussions.” “I had no decision making involvement in my treatment. Even though I fought for it. I was making my case, and explaining well, I have 3 yrs as a peer listener and 2 in psychology - I know my own problems - plain and simple!!!”
Overall, consumer/clients were less satisfied with their opportunity to participate in treatment planning than with other areas of satisfaction (Table 5), but satisfaction in this area was varied. Only 57.6% of consumer/clients agreed with the statement, “I, not staff, decided my treatment goals.” However, the overwhelming majority of consumer/clients (82.0%) agreed that they felt comfortable asking questions about their treatment and medication, an area also related to treatment planning. Substance abuse clients were more likely than mental health consumers to agree with the statement that they, not staff, decided their treatment goals (60.0% versus 54.4%, respectively). Substance abuse clients were more likely to agree that they felt comfortable asking questions about treatment and medication (85.2%), compared to mental health consumers (78.5%). • Outcomes
“I believe that when we get out of jail there should be a work counselor some HELP IN THE process of Getting a Job. And referral to agencies that can HELP us get back into society a bunch of phone num. Half of them out of service is not actual help.” "When I first came here my thoughts were bad but now I am stronger, can make better decisions, am much happier, I don't worry as much."
Only about two-thirds of consumer/clients in both mental health and substance abuse treatment were satisfied with specific treatment outcomes related to external changes, such as finding housing (63.2%),
16

Philadelphia Health Management Corporation
sustaining or gaining employment (66.5%), or improving performance in school or work (69.0%). However, a higher percentage, about three-in-four consumer/clients, were satisfied with internal changes, such as their ability to deal more effectively with daily problems (76.0%), to control their lives (77.2%), to deal with a crisis (75.8%), and to do better in social situations (73.3%). Across the different types of treatment programs, substance abuse clients tended to be more satisfied with treatment outcomes than mental health consumers. For example, 72.5% of substance abuse clients agreed that they were better able to get and keep a job, compared to only 57.0% of mental health consumers. • Overall Satisfaction
“My treatment in (facility name) has being very effective. I have being able to control and also tell when my symptoms are coming back. They being very supportive and helpful in such a difficult state. I do appreciate and thank everyone and also a big thank you.” “This program is wonderful. It has literally saved my life. I will be forever grateful for the help I have received at (program name).”
Overall satisfaction among consumer/clients in Delaware was high: an average of three-in-four consumer/clients agreed or strongly agreed with survey statements expressing general satisfaction (Table 5). For example, nearly four-in-five consumer/clients (79.2%) liked the services they received, and 76.8% would recommend their agency to friends or family. A slightly lower percentage of consumer/clients, 71.7%, would still choose services from their agency if they had other choices. However, satisfaction among consumer/clients receiving different types of treatment varied, as mental health consumers were less satisfied with many of these overall measures than were substance abuse treatment clients. Eight out of ten substance abuse clients (80.4%) liked the services they received, and 77.5% would recommend this agency to friends or family. A slightly smaller percentage of mental health consumers (77.6%) liked the services they received or would recommend this agency to family or friends (75.7%). However, substance abuse clients and mental health consumers were equally likely to continue receiving services from this agency if they had other choices (71.4% and 71.5%, respectively).
17

Philadelphia Health Management Corporation
• Respondent Comments Consumer/clients had the opportunity to provide written comments on their experiences in mental health or substance abuse treatment. A total of 340 consumer/clients provided comments regarding services. The majority of responses (52.0%) were positive, 40.0% were negative, and 8.0% contained both positive and negative statements (Table 6). Table 6. Respondents’ Comments Regarding Current Treatment
Facility Positive Comments Percent
Staff is great 21.8% Happy/Pleased with program 22.6% Program taught client to live differently and cope with addiction 3.2% Program has changed client’s life for the better 6.8% Counselor/case manager had a positive impact 1.2%
Negative Comments Need for increased/more convenient hours for appointments and support groups
2.6%
Problems with high turnover rates of counselors/caseworkers 1.2% Problems with understanding 2.1%
Lack of confidentiality among counselors/caseworkers/staff 1.2% Staff has a bad attitude toward clients 3.2% Problems with transitional housing for residents 0.6% Problems with homelessness 0.3% Lack of personal choice in day-today living 1.2% Lack of financial freedom while in treatment 0.3% Problems obtaining/with administration of medications 2.4% Problem with quality of housing 1.2% Lack of choice in treatment plan 0.6% Need for better quality of counseling/support groups 1.5% Problems with food quality 0.3% Problems paying for insurance/services 0.6%
Other 38.5% Survey respondents were given the opportunity at the end of the survey to comment in writing. Total number of comments exceeds the number of those who provided comments because clients were able to include up to three comments each. Source: 2005 Delaware Consumer/Client Satisfaction Survey (n=340) Prepared by PHMC
Most of the positive comments by consumer/clients were statements of satisfaction with their treatment, the warmth and support of the staff, and the positive impact the programs have had on their lives. A number of consumer/clients identified specific staff that helped them immensely, and several commented that their program involvement has taught them ways to live differently and cope with their addictions (Table 6).
Negative comments tended to be more specific, such as dissatisfaction with the process of obtaining medications, lack of confidentiality among
18

Philadelphia Health Management Corporation
staff, and need for increased and more convenient hours for appointments and support groups. Other negative comments included dissatisfaction with food quality, housing, and high staff turnover rates (Table 6).
“In a year and a half, I’ve had two doctors, three nurses, and four case managers.” “Doctors are hard to see any closer than 3 months apart.”
MHSIP Satisfaction Indicators
Five indicators developed by MHSIP that measure consumer/client satisfaction with treatment were examined for survey respondents as a whole and for sub-groups of survey respondents: access, quality and appropriateness of services, outcomes, participation in treatment planning, and overall satisfaction. Overall, three-in-four consumer/clients (75.3%) were satisfied with their treatment (Table 7). More than three-quarters of consumer/clients (78.9%) were satisfied with the quality and appropriateness of services (Figure 3). A slightly lower percentage of consumer/clients, 71.9%, were satisfied with access to services and nearly three-quarters (73.8%), were satisfied with the extent of positive change in their lives. Three-in-five (60.8%) were satisfied with their ability to participate in their treatment planning. These five indicators are discussed in more detail below. Table 7. Respondents’ Satisfaction with Selected Aspects of
Treatment by Type of Treatment Program Substance
Abuse Mental Health
All Respondents
Aspect of Treatment (n=1,206) (n=999) (n=2,227 ) §
Access 71.6% 71.9% 71.9%
Quality and Appropriateness 82.0% 75.1%* 78.9%
Outcomes 76.9% 70.2%* 73.8%
Participation in Treatment Planning 65.1% 55.4%* 60.8%
Overall Satisfaction 75.9% 74.3% 75.3%
*Indicates statistical significance at p<.05 when comparing Substance Abuse and Mental Health consumers. § 22 surveys were missing information regarding treatment program. Source: 2005 Delaware Consumer/Client Satisfaction Survey (n=2,205) Prepared by PHMC
19

Philadelphia Health Management Corporation
Figure 3. Consumer/Clients' Satisfaction w ith Selected Aspects of Treatment by Type of Treatment Program §
76.9%
65.1%55.4%
74.3%
70.2%75.1%71.9% 82.0%
71.6% 75.9%
0%
20%
40%
60%
80%
100%
Access Quality/Appropriateness Outcomes Consumer Participation Overall
Perc
ent o
f Clie
nts
Mental Health Substance Abuse
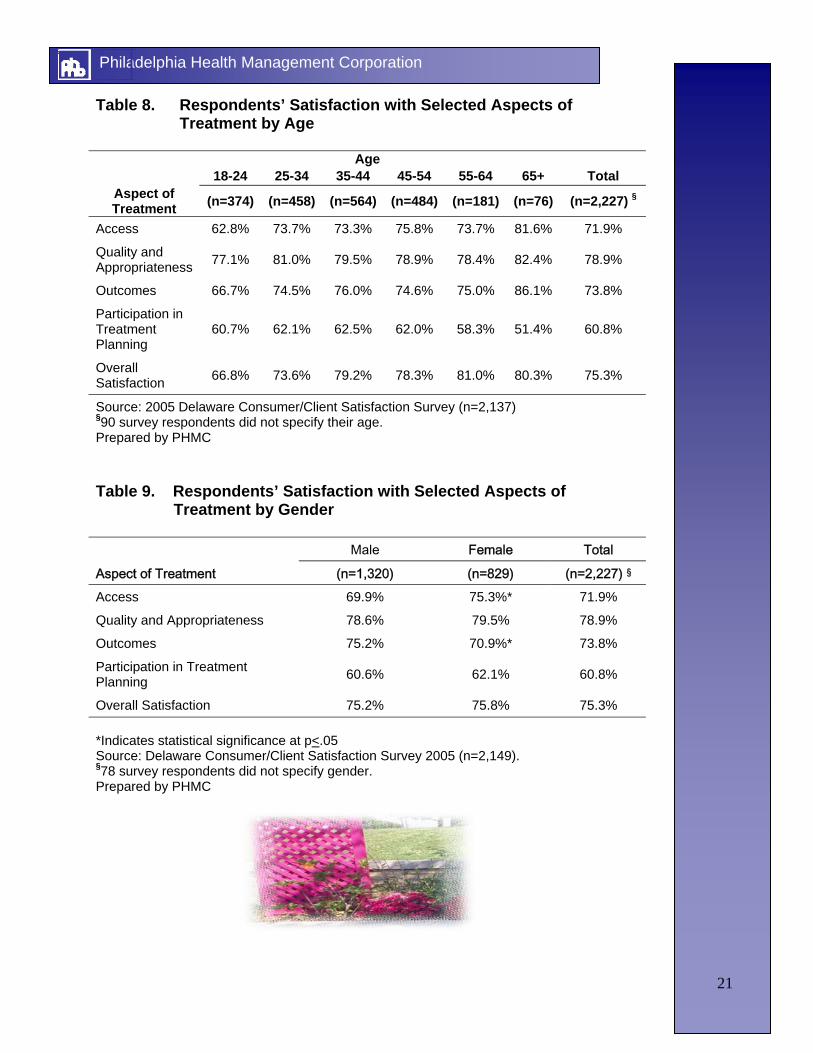
§ 22 surveys were missing information regarding treatment program. Source: 2005 Delaware Consumer/Client Satisfaction Survey (n=2,205) Prepared by PHMC • Access to Treatment Satisfaction with access to treatment includes treatment programs with convenient locations and office hours, staff who were willing to see consumer/clients as often as they felt was necessary, staff who returned calls within 24 hours, and provision of services that clients thought they needed. Although most consumer/clients (71.9%) were satisfied with their access to services, younger consumer/clients were much less likely to be satisfied with access to services than older consumer/clients (Table 8). For example, satisfaction with access to treatment ranged from 62.8% among consumer/clients aged 18-24 to 81.6% among those aged 65 and over. Access to services was perceived as being less convenient by male consumer/clients than by females (69.9% and 75.3%, respectively) (Table 9). On the other hand, African American (72.4%) and white (72.9%) consumer/clients were equally satisfied with access to treatment. However, Latino consumer/clients (64.3%) were less satisfied with access to treatment than non-Latinos (71.7%) (Table 10).
20
Philadelphia Health Management Corporation
Table 8. Respondents’ Satisfaction with Selected Aspects of Treatment by Age
Age
18-24 25-34 35-44 45-54 55-64 65+ Total Aspect of Treatment (n=374) (n=458) (n=564) (n=484) (n=181) (n=76) (n=2,227) §
Access 62.8% 73.7% 73.3% 75.8% 73.7% 81.6% 71.9%
Quality and Appropriateness 77.1% 81.0% 79.5% 78.9% 78.4% 82.4% 78.9%
Outcomes 66.7% 74.5% 76.0% 74.6% 75.0% 86.1% 73.8%
Participation in Treatment Planning
60.7% 62.1% 62.5% 62.0% 58.3% 51.4% 60.8%
Overall Satisfaction 66.8% 73.6% 79.2% 78.3% 81.0% 80.3% 75.3%
Source: 2005 Delaware Consumer/Client Satisfaction Survey (n=2,137) §90 survey respondents did not specify their age. Prepared by PHMC Table 9. Respondents’ Satisfaction with Selected Aspects of
Treatment by Gender Male Female Total
Aspect of Treatment (n=1,320) (n=829) (n=2,227) §
Access 69.9% 75.3%* 71.9%
Quality and Appropriateness 78.6% 79.5% 78.9%
Outcomes 75.2% 70.9%* 73.8%
Participation in Treatment Planning 60.6% 62.1% 60.8%
Overall Satisfaction 75.2% 75.8% 75.3% *Indicates statistical significance at p<.05 Source: Delaware Consumer/Client Satisfaction Survey 2005 (n=2,149). §78 survey respondents did not specify gender. Prepared by PHMC
21
Philadelphia Health Management Corporation
Table 10. Respondents’ Satisfaction with Selected Aspects of Treatment by Race and Ethnicity
African
American Caucasian Latino Non-Latino Total
Aspect of Treatment (n=546) (n=1,113) (n=163) (n=1,319) (n=2,227)
Access 72.4% 72.9% 64.3% 71.7% 71.9%
Quality and Appropriateness 79.2% 79.8% 73.5% 79.1% 78.9%
Outcomes 79.0% 71.7% 73.4% 73.1% 73.8%
Participation in Treatment Planning
63.7% 59.5% 63.5% 59.9% 60.8%
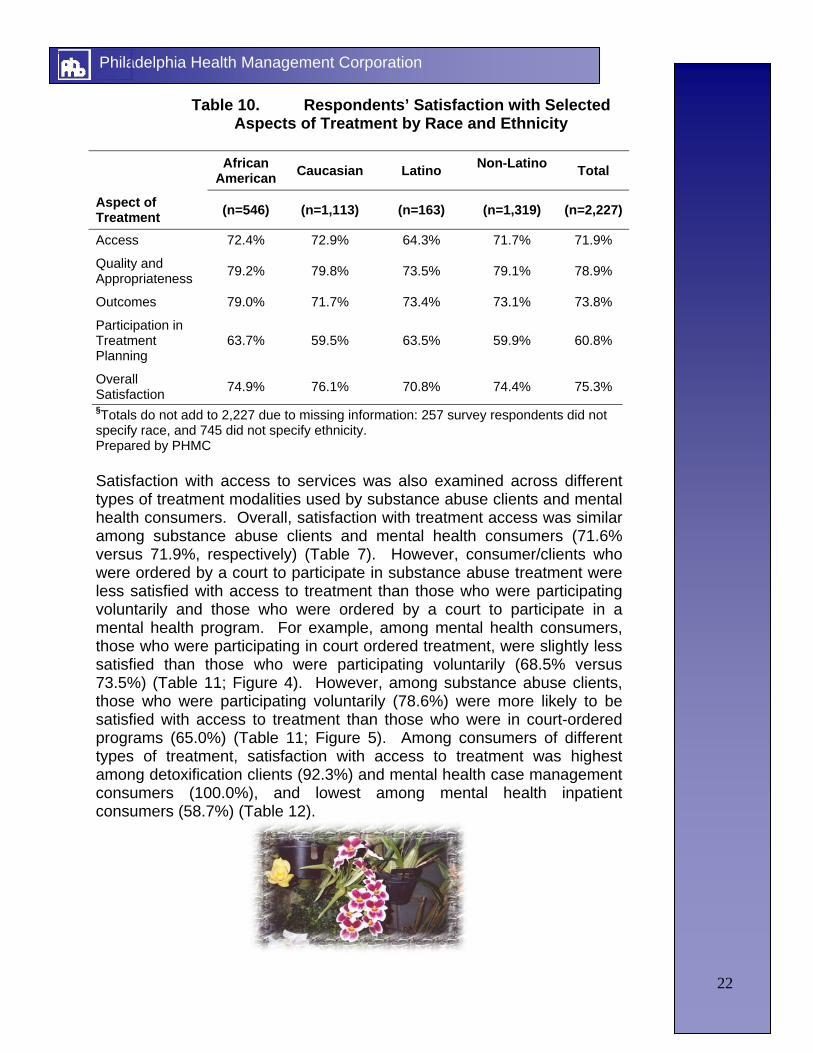
Overall Satisfaction 74.9% 76.1% 70.8% 74.4% 75.3% §Totals do not add to 2,227 due to missing information: 257 survey respondents did not specify race, and 745 did not specify ethnicity. Prepared by PHMC Satisfaction with access to services was also examined across different types of treatment modalities used by substance abuse clients and mental health consumers. Overall, satisfaction with treatment access was similar among substance abuse clients and mental health consumers (71.6% versus 71.9%, respectively) (Table 7). However, consumer/clients who were ordered by a court to participate in substance abuse treatment were less satisfied with access to treatment than those who were participating voluntarily and those who were ordered by a court to participate in a mental health program. For example, among mental health consumers, those who were participating in court ordered treatment, were slightly less satisfied than those who were participating voluntarily (68.5% versus 73.5%) (Table 11; Figure 4). However, among substance abuse clients, those who were participating voluntarily (78.6%) were more likely to be satisfied with access to treatment than those who were in court-ordered programs (65.0%) (Table 11; Figure 5). Among consumers of different types of treatment, satisfaction with access to treatment was highest among detoxification clients (92.3%) and mental health case management consumers (100.0%), and lowest among mental health inpatient consumers (58.7%) (Table 12).
22

Philadelphia Health Management Corporation
Source: 2005 Delaware Consumer/Client Satisfaction Survey (n=2,227) §This chart represents the responses of 943 mental health consumer survey respondents; 56 mental health consumer respondents did not specify court ordered status. Prepared by PHMC
Table 11. Respondents’ Satisfaction with Selected Aspects of
Treatment by Treatment Type and Court Ordered Status
Mental Health Substance Abuse
Court Ordered
Non-Court
Ordered
All Mental Health
Court Ordered
Non-Court
Ordered
All Substance
Abuse Total
Aspect of Treatment (n131) (n=812) (n=999) (n=596) (n=542) (n=1,206) (n=2,227)
Access 68.5% 73.5% 71.9% 65.0% 78.6%* 71.6% 71.9%
Quality and Appropriateness 69.6% 75.8% 75.1% 80.9% 84.2% 82.0% 78.9%
Outcomes 72.2% 70.3% 70.2% 76.2% 77.6% 76.9% 73.8%
Participation in Treatment Planning
59.2% 54.9% 55.4% 64.5% 67.0% 65.1% 60.8%
Overall Satisfaction 69.5% 75.4% 74.3% 70.2% 82.8%* 75.9% 75.3%
* Indicates statistical significance at p<.05 between Court Ordered and Non-Court Ordered consumers Source: Delaware Consumer/Client Satisfaction Survey 2005 (n=2,227). Totals do not add to 2,227 due to missing information (court-ordered status was not reported for 124 consumer/clients). Prepared by PHMC
Figure 4. Mental Health Consumers' Satisfaction with Selected Aspects of Treatment by Court Ordered Status§
59.2%
75.4%68.5% 69.6% 72.2% 69.5%
73.5% 75.8% 70.3%
54.9%
0%
20%
40%
60%
80%
100%
Access Quality/Appropriateness Outcomes Consumer Participation Overall
Perc
ent o
f Clie
nts
Court Ordered Non Court Ordered
23

Philadelphia Health Management Corporation
24
Prog
ram
Mod
ality
Su
bstan
ce
Abus
e Ca
se
Mgmt
.
Subs
tance
Ab
use
Inten
sive
Outpa
tient
Subs
tance
Ab
use
Ambu
lator
y Ou
tpatie
nt
Subs
tance
Ab
use
Detox
Subs
tance
Ab
use
Resid
entia
l Sh
ort T
erm
Menta
l He
alth
Case
Mg
mt.
Menta
l He
alth
Comm
unity
Co
ntinu
um
of Ca
re
Prog
ram
Menta
l He
alth
Grou
p Ho
me
Menta
l He
alth
Ambu
lator
y Ou
tpatie
nt
Menta
l He
alth
Resid
entia
l Lo
ng T
erm
Menta
l He
alth
Inpati
ent
Menta
l He
alth
Drop
In
Cente
r
Satis
fact
ion
area
Acce
ss
66.2%
85
.0%
67.9%
92
.3%
60.4%
10
0.0%
69
.8%
74.4%
80
.9%
67.0%
58
.7%
70.2%
Quali
ty an
d Ap
prop
riate
ness
83
.6%
89.5%
79
.3%
92.3%
61
.0%
100.0
%
73.8%
66
.4%
84.4%
84
.9%
65.0%
78
.6%
Outc
omes
83
.1%
78.9%
75
.5%
74.3%
63
.8%
100.0
%
70.1%
71
.1%
69.1%
85
.2%
68.1%
72
.7%
Parti
cipat
ion
in
Trea
tmen
t Plan
ning
68
.5%
78.9%
60
.8%
77.1%
63
.2%
80.0%
53
.6%
48.7%
69
.7%
61.9%
44
.7%
44.2%
Over
all S
atisf
actio
n 65
.5%
85.0%
73
.2%
89.9%
60
.3%
100.0
%
71.4%
73
.9%
85.5%
83
.6%
63.8%
72
.4%
Tota
l N
139
20
715
198
59
5 37
1 12
0 24
9 13
0 14
1 59
24
Tabl
e 12
: R
espo
nden
ts’ S
atis
fact
ion
with
Sel
ecte
d A
spec
ts o
f Tre
atm
ent b
y Pr
ogra
m M
odal
ity
Sour
ce: 2
005 D
elawa
re C
onsu
mer/C
lient
Satis
factio
n sur
vey (
n=2,2
27)
Trea
tmen
t mod
ality
was u
nkno
wn or
othe
r for
21co
nsum
er/cl
ients.
. Pr
epar
ed by
PHM
C

Philadelphia Health Management Corporation • Quality and Appropriateness of Services The quality and appropriateness of services was measured by consumer agreement with the following items: staff belief in consumer ability to change and recover; consumer freedom to complain about staff; staff respect for consumers' confidentiality, cultural/ethnic background, and rights; staff provision of information on potential side effects of medication; and staff ability to provide consumers with sufficient information to allow them to take charge of managing their own illness and their lives. More than three-quarters of consumer/clients (78.9%) were satisfied with the quality and appropriateness of treatment services. This aspect of treatment was scored highest by consumer/clients among the five areas of consumer/client satisfaction. However, satisfaction levels varied across different age, gender, racial, and ethnic consumer/client subgroups. For example, young adults between 25 and 34 years (81.0%), and adults aged 65 and older (82.4%) were most likely to be satisfied with the quality and appropriateness of services (Table 8). Young adults between the ages of 18 and 24 (77.1%) were least likely to be satisfied with the quality and appropriateness of services. Females (79.5%) were slightly more likely than males (78.6%) to be satisfied with the quality and appropriateness of services (Table 9). Overall, differences in satisfaction among racial and ethnic sub-groups of consumer/clients were slight. For example, African American and Caucasian consumer/clients were similarly satisfied with quality and appropriateness of services (79.2% and 79.8%, respectively) (Table 10). Nearly three-quarters of Latino consumer/clients (73.5%) were satisfied with the quality and appropriateness of services compared to 79.1% of non-Latino consumer/clients. Substance abuse clients (82.0%) were significantly more likely to be satisfied with the quality and appropriateness of services than mental health consumers (75.1%) (Table 7). However, among both substance abuse and mental health consumer/clients, those who were receiving treatment voluntarily (84.2% and 75.8%, respectively) were more likely to be satisfied than those who were receiving court-ordered treatment (80.9% and 69.6%, respectively) (Table 11; Figures 4 and 5). Among all consumer/clients, those in detoxification programs (92.3%) and mental health case management services (100.0%) were most likely to be satisfied, and substance abuse short term residential clients (61.0%) were least likely to be satisfied (Table 12). • Outcomes Satisfaction with treatment outcomes was measured by agreement with statements regarding consumers' ability to: deal more effectively with daily problems, control their lives, deal with crisis, get along better with
25

Philadelphia Health Management Corporation family, do better in social situations and school and/or work, improve their housing situation, and better manage their symptoms. Overall, nearly three-quarters of consumer/clients (73.8%) were satisfied with their treatment outcomes. Satisfaction with treatment outcomes received the third lowest satisfaction scores after satisfaction with consumer participation in treatment planning (60.8%) and access to services (71.9%). Satisfaction with treatment outcomes varied among different demographic subgroups of consumer/clients. For example, young adults between 18 and 24 years of age were least likely to be satisfied with treatment outcomes (66.7%) while adults 65 years of age and older were most satisfied (86.1%) (Table 8). Female consumer/clients were significantly less satisfied with treatment outcomes than male consumer/clients (70.9% and 75.2%, respectively) (Table 9), and African American consumer/clients (79.5%) were more likely than Caucasian consumer/clients (71.7%) to be satisfied with their treatment outcomes (Table 10). Latino and non-Latino consumer/clients were similarly satisfied with treatment outcomes (73.4% and 73.1%, respectively). Substance abuse treatment clients (76.9%) were more likely to be satisfied with treatment outcomes than mental health consumers (70.2%). Satisfaction with treatment outcomes also differed slightly for court-ordered versus those who entered treatment voluntarily across the type of treatment received. Court-ordered substance abuse clients were slightly less likely to be satisfied with treatment outcomes than non-court ordered clients (76.2% versus 77.6%), but court-ordered mental health consumers were slightly more satisfied with the outcome of the services they received than those who were being treated voluntarily (72.2% versus 70.3%) (Table 11). Satisfaction with treatment outcomes also varied across different types of treatment programs, ranging from a high of 100.0% of mental health case management consumers and 85.2% of long-term residential mental health program users, to a low of 63.8% of short-term residential substance abuse clients and 69.1% of ambulatory outpatient mental health program consumers (Table 12). • Participation in Treatment Planning Consumer/client satisfaction with participation in treatment planning was measured by the consumer/clients’ perception of their ability to decide their treatment goals and the extent to which they felt comfortable asking questions about treatment and medication. Consumer/clients gave this area the lowest satisfaction scores overall. Only three-in-five (60.8%) consumer/clients were satisfied with their ability to participate in treatment
26
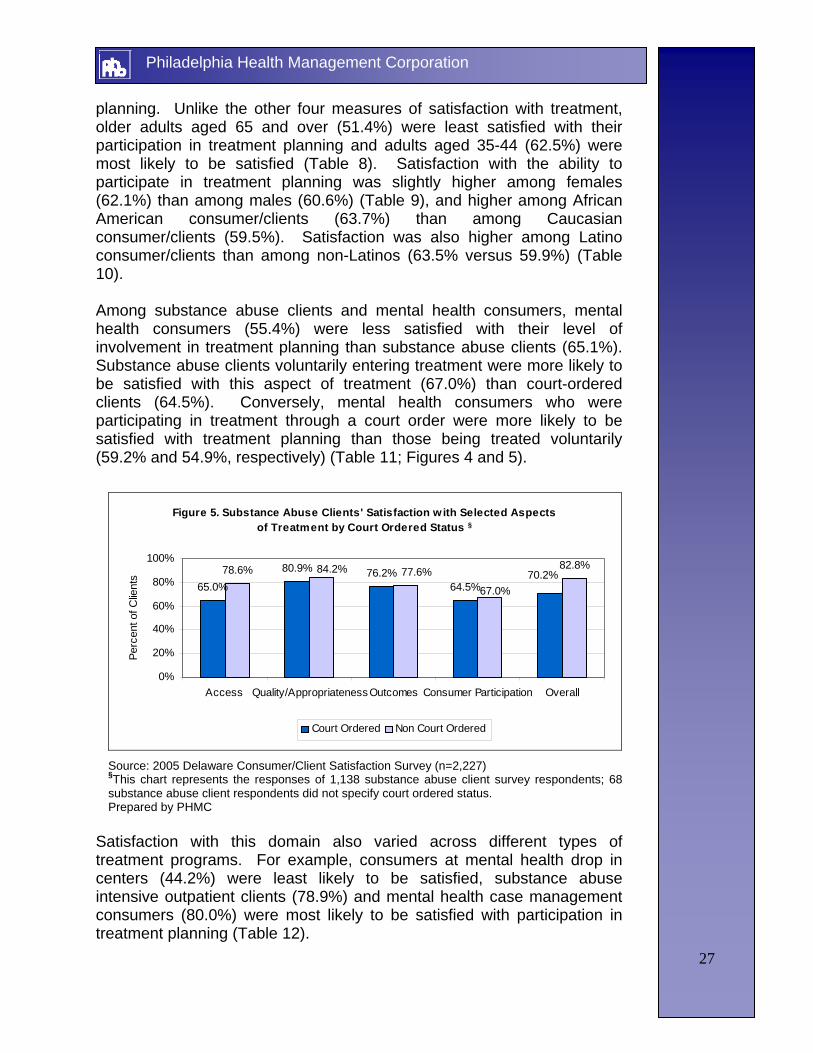
Philadelphia Health Management Corporation planning. Unlike the other four measures of satisfaction with treatment, older adults aged 65 and over (51.4%) were least satisfied with their participation in treatment planning and adults aged 35-44 (62.5%) were most likely to be satisfied (Table 8). Satisfaction with the ability to participate in treatment planning was slightly higher among females (62.1%) than among males (60.6%) (Table 9), and higher among African American consumer/clients (63.7%) than among Caucasian consumer/clients (59.5%). Satisfaction was also higher among Latino consumer/clients than among non-Latinos (63.5% versus 59.9%) (Table 10). Among substance abuse clients and mental health consumers, mental health consumers (55.4%) were less satisfied with their level of involvement in treatment planning than substance abuse clients (65.1%). Substance abuse clients voluntarily entering treatment were more likely to be satisfied with this aspect of treatment (67.0%) than court-ordered clients (64.5%). Conversely, mental health consumers who were participating in treatment through a court order were more likely to be satisfied with treatment planning than those being treated voluntarily (59.2% and 54.9%, respectively) (Table 11; Figures 4 and 5).
Figure 5. Substance Abuse Clients' Satisfaction w ith Selected Aspects of Treatment by Court Ordered Status §
65.0%
80.9% 76.2%64.5%
78.6% 82.8%70.2%84.2% 77.6%
67.0%
0%
20%
40%
60%
80%
100%
Access Quality/Appropriateness Outcomes Consumer Participation Overall
Perc
ent o
f Clie
nts
Court Ordered Non Court Ordered
Source: 2005 Delaware Consumer/Client Satisfaction Survey (n=2,227) §This chart represents the responses of 1,138 substance abuse client survey respondents; 68 substance abuse client respondents did not specify court ordered status. Prepared by PHMC
Satisfaction with this domain also varied across different types of treatment programs. For example, consumers at mental health drop in centers (44.2%) were least likely to be satisfied, substance abuse intensive outpatient clients (78.9%) and mental health case management consumers (80.0%) were most likely to be satisfied with participation in treatment planning (Table 12).
27

Philadelphia Health Management Corporation • Overall Satisfaction Overall satisfaction was measured by the extent to which consumer/clients liked the services that they received, would still get services at that agency if they had other choices, and would recommend the agency to a friend or family member. Among consumer/clients, overall satisfaction levels were high: three-quarters of all consumer/clients (75.3%) were satisfied with their treatment (Table 7). As with other MHSIP indicators, levels of overall satisfaction with DSAMH services varied across different age, gender, racial, and ethnic subgroups of the population. Younger adults aged 18-24 were much less likely (66.8%) to be satisfied with their treatment than adults aged 25-34 (73.6%), 35-44 (79.2%), 45-54 (78.3%), 55-64 (81.0%) and 65 and over (80.3%) (Table 8). Females (75.8%) and males (75.2%) were equally satisfied (Table 9). Among racial and ethnic subgroups of consumer/clients, African Americans (74.9%) were slightly less satisfied than Caucasians (76.1%), and Latinos (70.8%) were less satisfied than non-Latinos (74.4%) (Table 10). Again, consistent with other indicators of consumer/client satisfaction, substance abuse clients (75.9%) were slightly more satisfied overall than mental health consumers (74.3%) (Table 11). In addition, as shown in Table 11, satisfaction levels between court-ordered and voluntary mental health services consumers were higher for those who were participating voluntarily (69.5% and 75.4%, respectively). However, satisfaction levels for court-ordered substance abuse clients (70.2%) were significantly lower than for non-court ordered clients (82.8%) (Figures 4 and 5). Overall satisfaction levels also ranged considerably among consumer/clients participating in different types of treatment programs, as shown in Table 12. Satisfaction was highest among detoxification program clients (89.9%) and lowest among residents of short-term substance abuse programs (60.3%). Trend Data: 2002, 2004, and 2005 Survey Results Results from the 2005 survey were compared to results from two prior surveys (Figure 6). Measures of consumer/client satisfaction from all three surveys were similar across all five areas of satisfaction, although satisfaction levels for 2005 were slightly higher for four of the five measures of satisfaction. The greatest change was observed in satisfaction with the extent of positive change during treatment (outcomes), which increased from 67.1% in 2002 to 73.8% in 2005. On the other hand, satisfaction with access to services decreased slightly between 2002 (73.1%), 2004 (71.4%), and 2005 (71.9%). Satisfaction with participation
28

Philadelphia Health Management Corporation in treatment planning, which is consistently rated the lowest among the five measures of satisfaction, increased slightly from 58.3% in 2002 to 60.9% in 2004 and 60.8% in 2005.
Figure 6. DSAMH Consumer Survey Respondent Satisfaction with Selected Aspects of Treatment: 2002-2005
73.1% 74.4%
67.1%58.3%
74.9%
60.9%69.9%
78.7%71.4%75.3%
60.8%
73.8%71.9% 78.9%
0%
20%
40%
60%
80%
100%
Access Quality andappropriateness
Extent of postivechange
Participation intreatmentplanning
Overall
Satisfaction Area
Perc
ent S
atis
fied
2002
2004
2005
Source: 2001-2002, 2003-2004, and 2005 Delaware Consumer/Client Satisfaction Surveys (n=1,286, 2, 037, and 2,227 respectively). Overall satisfaction was not calculated in 2002. Prepared by PHMC.
CONCLUSION AND RE COMMENDATIONS
The results of the 2005 Delaware Consumer/Client Satisfaction Survey were similar to results in previous years. • Overall consumer/client satisfaction rose slightly between 2004
and 2005. • Satisfaction with participation in treatment planning rose slightly
between 2002 and 2005. • Satisfaction with extent of positive change rose slightly in 2004 and
2005 compared to 2002. • Satisfaction with quality and appropriateness of services rose slightly
in 2004 and 2005 compared to 2002 • Satisfaction with the consumer/clients access to services declined
slightly between 2002 and 2005.
29
Philadelphia Health Management Corporation • Consumer/clients in 2005 were slightly less likely to be satisfied
with their access to services than in 2002. • The majority of Delaware consumer/clients were satisfied with the
overall quality of services, extent of positive change, and quality and appropriateness of services
As in the previous three surveys, consumer's perception of their ability to participate in planning their treatment remained lowest among all the 32 individual measures of consumer satisfaction. Although with previous surveys satisfaction with treatment varied across different age, racial, and ethnic subgroups of consumer/clients, results from the 2005 survey for these consumer subgroups differed from results from previous years. • As in the past, consumers who were participating voluntarily in
substance abuse or mental health treatment tended to be more satisfied than those who were ordered by a court to participate.
• However, unlike previous surveys, substance abuse clients in general were more likely to be satisfied with their treatment than mental health services consumers.
• Overall, younger consumers were more likely to be dissatisfied than older consumers, except in the area of participation in treatment planning, where older consumers were the most dissatisfied.
• In contrast to previous surveys, where ethnic and racial minorities tended to be less satisfied than Caucasian consumer/clients, there were no consistent differences seen across racial and ethnic subgroups in the 2005 survey results.
30

Philadelphia Health Management Corporation The study results suggest that efforts to improve consumer/client satisfaction should focus on determining specific reasons why consumers and clients overall feel that they do not have a large enough role in participating in planning their treatment, and why satisfaction with participation in treatment planning continues to be relatively low in comparison to other satisfaction measures. Relatively low rates of consumer/client satisfaction with treatment outcomes, especially with progress in school or work, ability to get and keep a job, and improvement in housing situations should also be explored with treatment program staff to determine whether more attention needs to be devoted to improving outcomes for consumers in these areas.
31
Philadelphia Health Management Corporation
Appendix A
DSAMH Consumer/Client Satisfaction Survey

Delaware Health and Social Services
33
Division of Substance Abuse and Mental Health
DSAMH Consumer Survey (Version 2.33, March 2005)
Treatment Unit ID: - Date: / / In order to provide the best possible behavioral health services, we need to know what you think about the services you received at this agency during the last year, the people who provided it, and the results. There is space at the end of the survey to comment on any of your answers. Please indicate your agreement/ disagreement with each of the following statements by circling the number that best represents your opinion. If the question is about something you have not experienced, circle the number 9, to indicate that this item is "not applicable" to you. Strongly
Disagree Disagree I am Neutral Agree Strongly Agree
Not Applicable
1. I like the services that I received here. 1 2 3 4 5 9
2. If I had other choices, I would still get services from this agency. 1 2 3 4 5 9
3. I would recommend this agency to a friend or family member. 1 2 3 4 5 9
4. The location of services was convenient (parking, public transportation, distance, etc.).
1 2 3 4 5 9
5. Staff were willing to see me as often as I felt it was necessary. 1 2 3 4 5 9
6. Staff returned my call in 24 hours. 1 2 3 4 5 9
7. In a time of crisis my case manager or counselor can be easily contacted. 1 2 3 4 5 9
8. Services were available at times that were good for me. 1 2 3 4 5 9
9. I was able to get all the services I thought I needed. 1 2 3 4 5 9
10. I was able to see a psychiatrist when I wanted to. 1 2 3 4 5 9
11. Staff here believe that I can grow, change and recover. 1 2 3 4 5 9
12. I felt comfortable asking questions about my treatment and medication. 1 2 3 4 5 9
13. I felt free to complain 1 2 3 4 5 9
14. I was given information about my rights. 1 2 3 4 5 9
15. Staff encouraged me to take responsibility for how I live my life. 1 2 3 4 5 9
16. Staff told me what side effects to watch out for. 1 2 3 4 5 9

Delaware Health and Social Services
34
Division of Substance Abuse and Mental Health
DSAMH Consumer Survey (Version 2.33, March 2005)
In order to provide the best possible behavioral health services, we need to know what you think about the services you received at this agency during the last year, the people who provided it, and the results. There is space at the end of the survey to comment on any of your answers. Strongly
DisagreeDisagree I am Neutral Agree Strongly
AgreeNot
Applicable17. Staff respected my wishes about who is and who is not to be given information about my treatment.
1 2 3 4 5 9
18. I, not staff, decided my treatment goals. 1 2 3 4 5 9
19. Staff were sensitive to my cultural background (race, religion, language, etc.) 1 2 3 4 5 9
20. The Staff treat people of my race with dignity. 1 2 3 4 5 9
21. The Staff treat people who may be gay or lesbian with dignity. 1 2 3 4 5 9
22. Staff helped me obtain the information I needed so that I could take charge of managing my illness.
1 2 3 4 5 9
23. I was encouraged to use consumer-run programs (support groups, drop-in centers, crisis phone line, etc.).
1 2 3 4 5 9
As a Direct Result of Services I Received:
24. I deal more effectively with daily problems. 1 2 3 4 5 9
25. I am better able to control my life. 1 2 3 4 5 9
26. I am better able to deal with crisis. 1 2 3 4 5 9
27. I am getting along better with my family. 1 2 3 4 5 9
28. I do better in social situations. 1 2 3 4 5 9
29. I do better in school and/or work. 1 2 3 4 5 9
30. I am better able to get and keep a job. 1 2 3 4 5 9
31. My housing situation has improved. 1 2 3 4 5 9
32. My symptoms are not bothering me as much. 1 2 3 4 5 9
Delaware Health and Social Services
35
Division of Substance Abuse and Mental Health
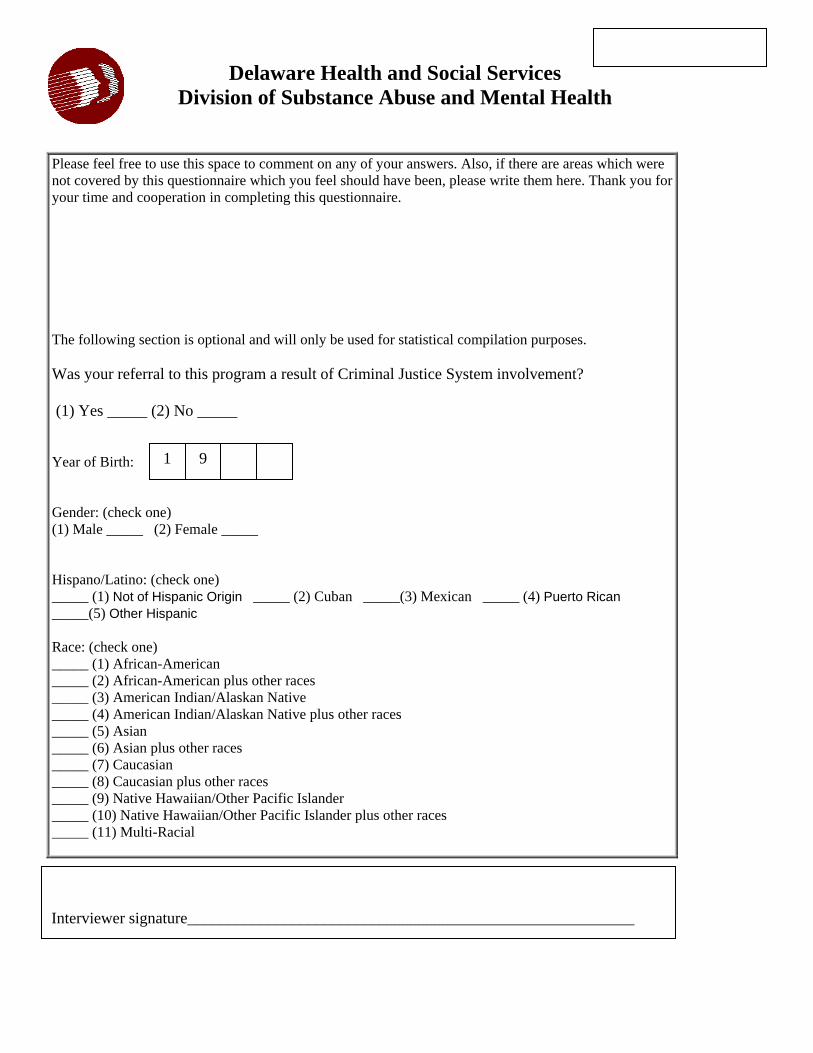
Please feel free to use this space to comment on any of your answers. Also, if there are areas which were not covered by this questionnaire which you feel should have been, please write them here. Thank you for your time and cooperation in completing this questionnaire. The following section is optional and will only be used for statistical compilation purposes. Was your referral to this program a result of Criminal Justice System involvement? (1) Yes _____ (2) No _____ Year of Birth: Gender: (check one) (1) Male _____ (2) Female _____ Hispano/Latino: (check one) _____ (1) Not of Hispanic Origin _____ (2) Cuban _____(3) Mexican _____ (4) Puerto Rican _____(5) Other Hispanic Race: (check one) _____ (1) African-American _____ (2) African-American plus other races _____ (3) American Indian/Alaskan Native _____ (4) American Indian/Alaskan Native plus other races _____ (5) Asian _____ (6) Asian plus other races _____ (7) Caucasian _____ (8) Caucasian plus other races _____ (9) Native Hawaiian/Other Pacific Islander _____ (10) Native Hawaiian/Other Pacific Islander plus other races _____ (11) Multi-Racial
9 1
Interviewer signature________________________________________________________