Client Satisfaction with Case Management...
26
Program Design and Evaluation Services Client Satisfaction with Case Management Services: Title II Service Area Results from the 2005 Survey Prepared by: Linda Drach, Ronda Bard, Susan Van’t Hof, Dena Wilson, and Doris Cordova March 31, 2006 Program Design and Evaluation Services 800 NE Oregon Street, Suite 550 Portland, OR 97232
-
Upload
truongkhuong -
Category
Documents
-
view
219 -
download
3
Transcript of Client Satisfaction with Case Management...

Program Design and Evaluation Services
Client Satisfaction with Case Management Services: Title II Service Area
Results from the 2005 Survey Prepared by: Linda Drach, Ronda Bard, Susan Van’t Hof, Dena Wilson, and Doris Cordova March 31, 2006
Program Design and Evaluation Services 800 NE Oregon Street, Suite 550
Portland, OR 97232

Client Satisfaction with Case Management Services: Title II Service Area Results from the 2005 Survey
1
Client Satisfaction with Case Management Services: Title II Service Area Results from the 2005 Survey
Executive Summary
In order to assess current client satisfaction with case management services, short anonymous surveys were mailed in October and November 2005 to all clients receiving Ryan White case management services in the Title II area. Surveys were sent to 614 clients from 20 Ryan White sites across 26 Oregon counties.
Results are based on 350 completed surveys, representing a 61% response rate after correcting for undeliverable surveys. The majority of respondents were White (81%), male (78%), and between the ages of 35 to 49 years (59%).
In general, clients reported a high level of satisfaction with case management services. Nearly 6 in 10 respondents (58%) described the quality of case management services as “excellent,” while another 26% rated service quality as “good.” Between 85% and 94% reported being “very” or “somewhat” satisfied with each of seven specific aspects of case management. This high level of satisfaction was consistent with findings from the 2004 HIV Case Management Client Satisfaction Survey.
Similar to the 2004 satisfaction survey, approximately one-third to one-half of respondents reported that they did not need help from their case manager in addressing three areas that are important to quality HIV care:
staying on HIV medications (48%),
applying for health insurance (34%), or
finding a doctor who knows about HIV (34%).
However, for those reporting that they needed the help, between 58% and 73% indicated that their case manager had helped “a great deal” with the specific need.
Responses to open-ended questions further echoed a high level of satisfaction, with respondents very positive overall about services and their case managers, repeatedly indicating how thankful they are for the services they receive. Client-

Client Satisfaction with Case Management Services: Title II Service Area Results from the 2005 Survey
2
identified themes for improvement included the need for increased funding, both for specific services and for the HIV service system overall, and improved access to and quality of existing case management services—specifically, increased contact with the case manager, improved follow up by the case manager, and/or more home visits.
Subgroup differences in satisfaction occurred consistently for three characteristics. Specifically, clients reporting 7 or more contacts with their case manager were consistently more satisfied with case management services than those with fewer contacts, and those who felt they had “too few” contacts with their case manager during the past year were consistently less satisfied than those who felt they had “just the right amount” of contact. In addition, clients from the Coastal and Columbia/Eastern Oregon regions were less satisfied with case management services than were clients living in Central Oregon or along the I-5 Corridor.
Client Satisfaction with Case Management Services: Title II Service Area Results from the 2005 Survey
3
Background
Oregon's DHS HIV Client Services Program contracted with Program Design and Evaluation Services (PDES) to conduct an evaluation of Title II case management services. This evaluation is part of an annual requirement by the Health Resources & Services Adminsitration (HRSA) for states receiving Title II Ryan White CARE Act funding. In 2005, the HIV Case Management Satisfaction Survey was administered in conjunction with the Client Needs Assessment survey in the Title II service area. This report will provide data from the HIV Case Management Client Satisfaction Survey only. Needs Assessment data, which was also collected from Title I clients, will be presented as a separate statewide report.
At the time of survey administration, there were 20 Ryan White sites for case management services, serving approximately 696 clients across the 26 counties included in Oregon’s Title II service area.
The purpose of this survey was to:
Describe clients receiving case management services in the Title II services area,
Describe clients’ level of satisfaction with core features of case management services (including location and accessibility, promptness of service, empathy and listening skills, privacy, competence, knowledge of community resources, and respect),
Describe clients’ perceptions of the effectiveness of case managers in helping with typical client needs (including dealing more effectively with problems, finding a doctor, applying for health insurance, and staying on HIV medications), and
Determine which respondent characteristics are associated with client satisfaction with case management services and with the perceived efficacy of case management in dealing with clients’ problems.
Client Satisfaction with Case Management Services: Title II Service Area Results from the 2005 Survey
4
Methods
Survey Instrument
Data were collected through a short, self-administered, anonymous mailed survey. The questionnaire posed 16 close-ended and 2 open-ended questions about satisfaction with case management, as well as 11 close-ended demographic questions.
In the two open-ended questions, respondents were asked to provide the one thing that would most improve the quality of case management services, as well as to spontaneously share any other comments about case management services. Appendix A displays a copy of the survey along with overall results.
The survey instrument also contained questions on housing and the types and amounts of services clients needed and used, which were part of a statewide Ryan White Needs Assessment (Title I and Title II) and are addressed in a separate report.
Survey Distribution
Surveys were provided to all clients living outside the Portland Eligible Metropolitan Area (EMA) who were receiving case management services through the Title II Ryan White program. Case managers distributed surveys to their clients either through the mail or in person. A $2 cash incentive was included with each survey. Clients were given postage-paid envelopes and instructed to return the anonymous surveys either directly to PDES or to PDES via their case managers, whichever they preferred. Survey materials were sent to case managers October 18, 2005; distribution to clients continued through November 16, 2005. Clients returned the surveys October 2005 through January 2006. Case managers were asked to send one follow-up mailing to their clients if PDES had received surveys from less than 50% of their estimated client caseload at a point 5 weeks after the surveys were mailed to case managers. The cut-off date for accepting completed surveys was January 23, 2006.
Return Rate
PDES received a total of 376 completed surveys, for an overall return rate of 61%. The second mailing helped raise the overall return rate from slightly lower than 50%. Based on tallies made by case managers, surveys were sent to a total of 614 eligible clients (not including 25 clients whose surveys were returned as undeliverable or whose surveys could not be mailed and were not picked up at the case management site).
Client Satisfaction with Case Management Services: Title II Service Area Results from the 2005 Survey
5
Analysis
The final dataset included 350 of the 376 surveys returned to PDES. The packets distributed to case managers for second mailings included some Title I Needs Assessment surveys rather than the Title II combined Client Satisfaction/Needs Assessment surveys, which was the correct version for this distribution. Twenty-six clients filled out the “wrong” version of the surveys that were provided to them, and these 26 were omitted from the current analysis because there were no questions addressing case management.
Data were analyzed using SPSS v11.5 for Windows©. The primary analysis was descriptive. We also explored whether there were differences in satisfaction with case management services across the following respondent characteristics: gender, age, ethnicity, region, length of time since HIV and AIDS (if appropriate) diagnoses, and objective and subjective number of contacts with case manager. Because of very few respondents in some subgroups, it was necessary to combine clients into larger, less-specific groups for purposes of these comparisons. For example, clients living in a large geographic area comprised of 13 counties east of the Cascades were combined into a group referred to as “Columbia/Eastern.” It was also necessary to create a three-way division across race/ethnicity, which we refer to as “ethnicity”: 1) White/non-Hispanic (which we refer to as “White”), 2) Hispanic, and 3) “all others” (combining across remaining ethnicity groups—Black, Asian, American Indian, or Multi-racial).
For these subgroup analyses, we performed Chi Square tests and used the traditional statistical cutoff of p < .05 as indication of statistically significant differences between groups. We tested for statistically significant differences between subgroups across nine survey items—the seven specific items related to satisfaction, the perception of overall quality of case management services, and the perceived helpfulness of case management in addressing clients’ problems. The satisfaction response categories for these questions were collapsed into two options (e.g., satisfied versus not satisfied, as were the perceived helpfulness questions (e.g., yes vs. no).
Two staff members independently coded qualitative data from two open-ended questions into distinct themes identified in the statements, and then combined the themes into overall categories. Some responses indicated the presence of more than one distinct theme. In those cases, all themes were coded. Themes were grouped into primary and secondary themes, depending on the degree of resonance among participants.
Client Satisfaction with Case Management Services: Title II Service Area Results from the 2005 Survey
6
Findings
Characteristics of Respondents
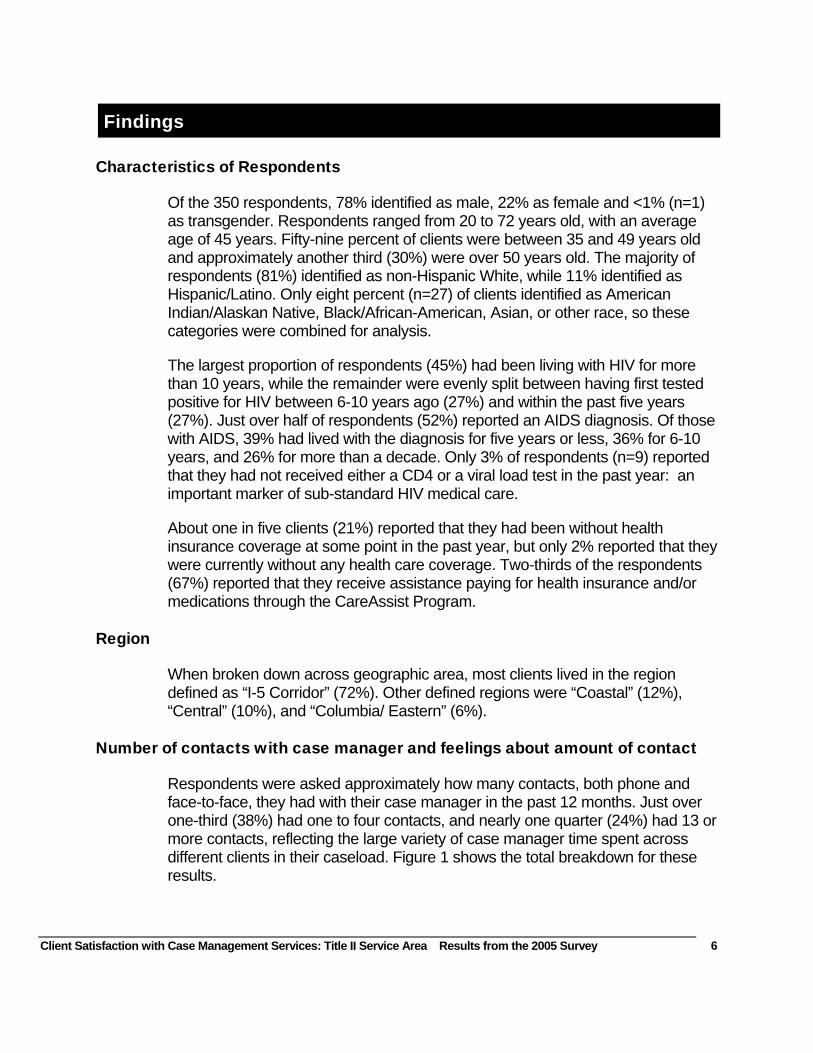
Of the 350 respondents, 78% identified as male, 22% as female and <1% (n=1) as transgender. Respondents ranged from 20 to 72 years old, with an average age of 45 years. Fifty-nine percent of clients were between 35 and 49 years old and approximately another third (30%) were over 50 years old. The majority of respondents (81%) identified as non-Hispanic White, while 11% identified as Hispanic/Latino. Only eight percent (n=27) of clients identified as American Indian/Alaskan Native, Black/African-American, Asian, or other race, so these categories were combined for analysis.
The largest proportion of respondents (45%) had been living with HIV for more than 10 years, while the remainder were evenly split between having first tested positive for HIV between 6-10 years ago (27%) and within the past five years (27%). Just over half of respondents (52%) reported an AIDS diagnosis. Of those with AIDS, 39% had lived with the diagnosis for five years or less, 36% for 6-10 years, and 26% for more than a decade. Only 3% of respondents (n=9) reported that they had not received either a CD4 or a viral load test in the past year: an important marker of sub-standard HIV medical care.
About one in five clients (21%) reported that they had been without health insurance coverage at some point in the past year, but only 2% reported that they were currently without any health care coverage. Two-thirds of the respondents (67%) reported that they receive assistance paying for health insurance and/or medications through the CareAssist Program.
Region
When broken down across geographic area, most clients lived in the region defined as “I-5 Corridor” (72%). Other defined regions were “Coastal” (12%), “Central” (10%), and “Columbia/ Eastern” (6%).
Number of contacts with case manager and feelings about amount of contact
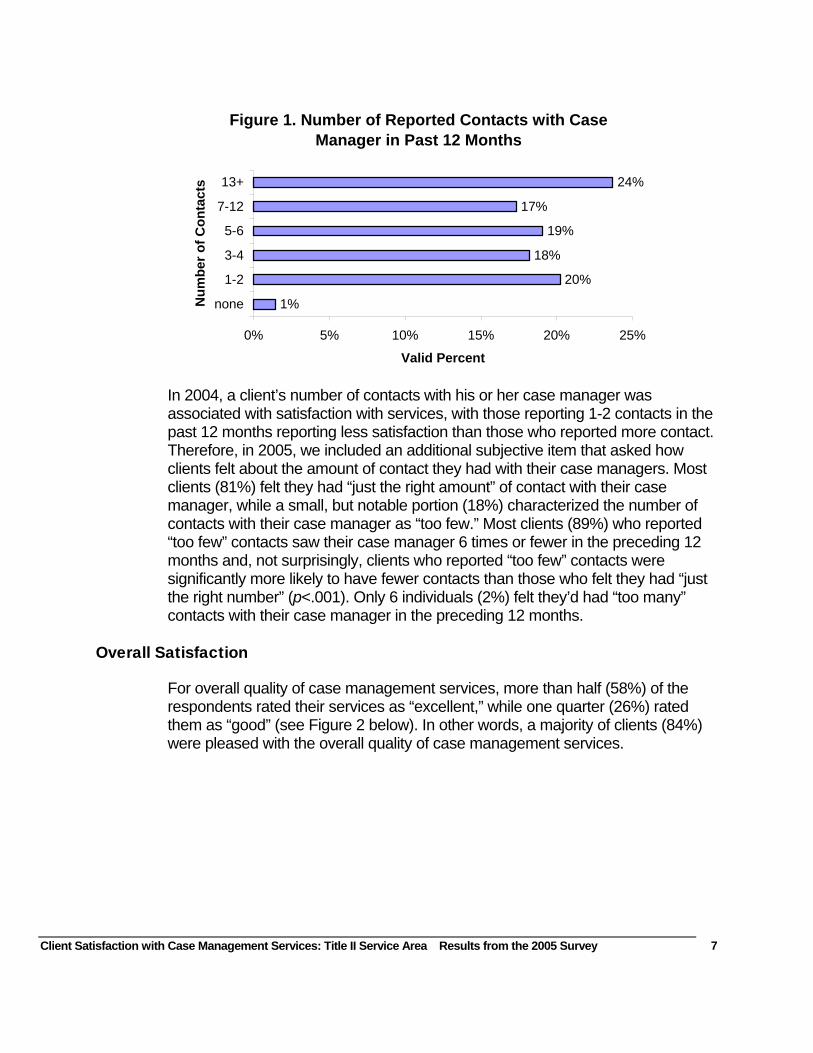
Respondents were asked approximately how many contacts, both phone and face-to-face, they had with their case manager in the past 12 months. Just over one-third (38%) had one to four contacts, and nearly one quarter (24%) had 13 or more contacts, reflecting the large variety of case manager time spent across different clients in their caseload. Figure 1 shows the total breakdown for these results.
Client Satisfaction with Case Management Services: Title II Service Area Results from the 2005 Survey
7
In 2004, a client’s number of contacts with his or her case manager was associated with satisfaction with services, with those reporting 1-2 contacts in the past 12 months reporting less satisfaction than those who reported more contact. Therefore, in 2005, we included an additional subjective item that asked how clients felt about the amount of contact they had with their case managers. Most clients (81%) felt they had “just the right amount” of contact with their case manager, while a small, but notable portion (18%) characterized the number of contacts with their case manager as “too few.” Most clients (89%) who reported “too few” contacts saw their case manager 6 times or fewer in the preceding 12 months and, not surprisingly, clients who reported “too few” contacts were significantly more likely to have fewer contacts than those who felt they had “just the right number” (p<.001). Only 6 individuals (2%) felt they’d had “too many” contacts with their case manager in the preceding 12 months.
Overall Satisfaction
For overall quality of case management services, more than half (58%) of the respondents rated their services as “excellent,” while one quarter (26%) rated them as “good” (see Figure 2 below). In other words, a majority of clients (84%) were pleased with the overall quality of case management services.
Figure 1. Number of Reported Contacts with Case Manager in Past 12 Months
1%
20%
18%
19%
17%
24%
0% 5% 10% 15% 20% 25%
none
1-2
3-4
5-6
7-12
13+N
umbe
r of C
onta
cts
Valid Percent

Client Satisfaction with Case Management Services: Title II Service Area Results from the 2005 Survey
8
Satisfaction with specific aspects of case management
Respondents were asked their opinions about seven specific aspects of case management: location and accessibility, promptness of case manager in responding to requests, empathy and listening skills of case manager, privacy of services, case manager’s knowledge of community resources, competence of case manager, and respect. Results again reflected high ratings, with answers of “very” or “somewhat” satisfied for each aspect falling between 85% (case manager’s promptness in responding to requests and phone calls) and 94% (respect and care given as an individual). Figure 3 displays these results for each aspect of case management services, and shows that the majority of respondents answered with the most positive option (“very satisfied”) across all items.
Figure 2. Quality Rating of Case Management
6%10%
26%
58%
0%
20%
40%
60%
Poor Fair Good Excellent
Quality Rating
Valid
Per
cent

Client Satisfaction with Case Management Services: Title II Service Area Results from the 2005 Survey
9
Change across time—2004 and 2005
We examined client responses to similar items used in both the 2004 and 2005 satisfaction surveys, but did not perform significance testing for several methodological reasons1. Clients reported high levels of satisfaction in both years, with 90% and 84% reporting good or excellent overall quality of case management services in 2004 and 2005, respectively. In 2005, this question rating overall quality was asked after the seven specific satisfaction items, whereas in 2004, it was asked before those items. The different placement may account for some or all of the different percentages between years, although differences in satisfaction between groups should not be discounted (see below). There were no meaningful changes over time for the seven specific items measuring satisfaction with the different features of case management, such as promptness and professional knowledge.
Helpfulness of case management services
Additional questions gathered information on clients’ perceptions regarding how helpful case management services had been to them. One item measured how often case management referrals met clients’ needs and four additional questions explored helpfulness in specific areas that are germane to quality HIV care.
1 Because this is an annual survey of a fairly stable population, it is certain that many respondents answered both the 2004 and 2005 surveys. However, because the surveys were anonymous, there is no way to know which clients responded both times and, thus, no way to account for this correlation. Moreover, the scale measuring the seven satisfaction items was slightly modified between 2004 and 2005 and the overall quality item was placed later in the survey—structural differences that could affect client response.
Figure 3. Satisfaction with Case Management: Percent Very or Somewhat Satisfied
71%
64%
71%
80%
71%
67%
82%
16%
21%
18%
12%
18%
19%
12%
0% 10% 20% 30% 40% 50% 60% 70% 80% 90% 100%
Location and accessibility
Promptness of response to call
Ability to listen and understand
Appropriate privacy
Knowledge and competence
Knowledge of resources
Respect and care given
Very SatisfiedSomewhat Satisfied
Client Satisfaction with Case Management Services: Title II Service Area Results from the 2005 Survey
10
For the question on how helpful referrals were overall, 15% of the respondents stated the question was not applicable to them because they received no referrals from their case manager. Of the respondents who had received referrals from their case manager, 48% reported that the referrals “always” helped meet their needs and 33% said they were “often” helpful. Nearly one in five respondents answered less enthusiastically, with 14% reporting the referrals were “sometimes” helpful and 5% reporting “never.”
For specific ways in which a case manager could be helpful, respondents were asked if their case manager had been “a great deal” helpful, “somewhat” helpful, or “not really” helpful in four important areas of HIV care:
dealing more effectively with problems,
finding a doctor who knows about HIV,
applying for health insurance, and
staying on HIV medications.
Respondents could also indicate that the question was not applicable because they did not need help. About half of the respondents (48%) reported they did not need help with staying on their HIV medications, while about one-third reported not needing help with applying for health insurance (34%) or with finding a doctor who knows about HIV (34%), as displayed in Figure 4 below. Clients who had been living with HIV for 10 years or longer were significantly more likely to report they did not need the four specific types of help from their case managers. Likewise, clients who had been seeing their case manager for more than five years were more likely to report that they did not need the four specific types of help.
Client Satisfaction with Case Management Services: Title II Service Area Results from the 2005 Survey
11
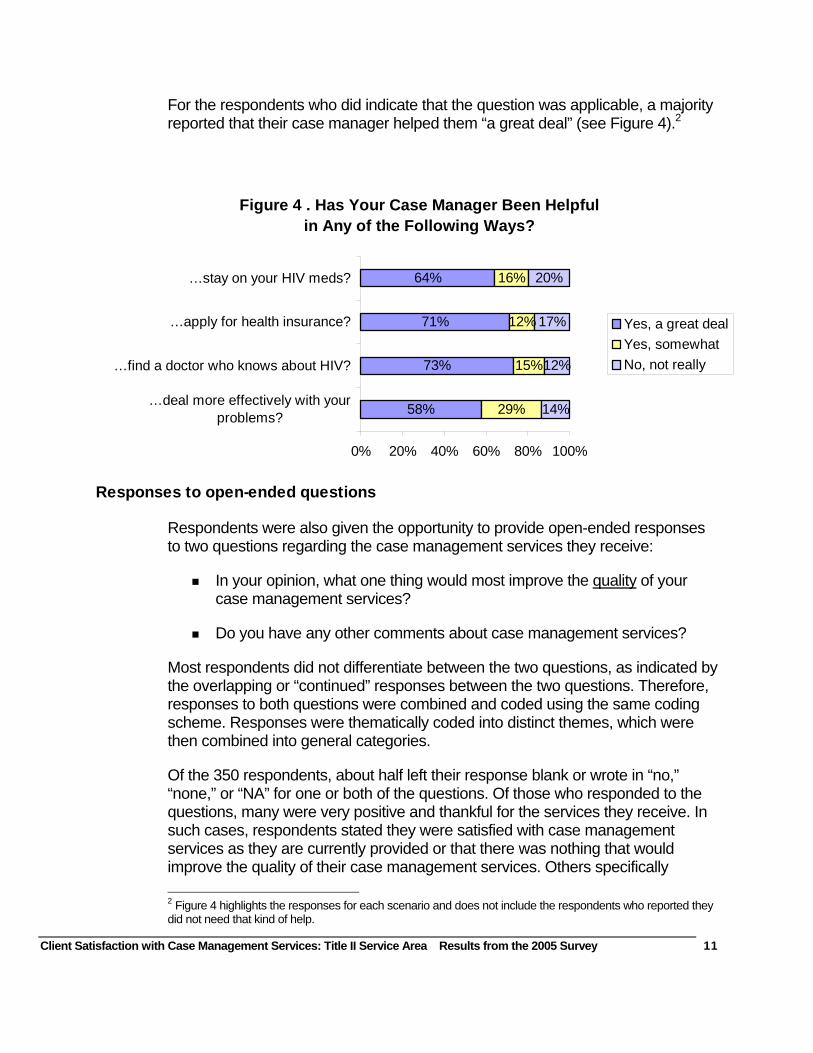
For the respondents who did indicate that the question was applicable, a majority reported that their case manager helped them “a great deal” (see Figure 4).2
Responses to open-ended questions
Respondents were also given the opportunity to provide open-ended responses to two questions regarding the case management services they receive:
In your opinion, what one thing would most improve the quality of your case management services?
Do you have any other comments about case management services?
Most respondents did not differentiate between the two questions, as indicated by the overlapping or “continued” responses between the two questions. Therefore, responses to both questions were combined and coded using the same coding scheme. Responses were thematically coded into distinct themes, which were then combined into general categories.
Of the 350 respondents, about half left their response blank or wrote in “no,” “none,” or “NA” for one or both of the questions. Of those who responded to the questions, many were very positive and thankful for the services they receive. In such cases, respondents stated they were satisfied with case management services as they are currently provided or that there was nothing that would improve the quality of their case management services. Others specifically 2 Figure 4 highlights the responses for each scenario and does not include the respondents who reported they did not need that kind of help.
Figure 4 . Has Your Case Manager Been Helpful in Any of the Following Ways?
58%
73%
71%
64%
29%
15%
12%
16%
14%
12%
17%
20%
0% 20% 40% 60% 80% 100%
…deal more effectively with yourproblems?
…find a doctor who knows about HIV?
…apply for health insurance?
…stay on your HIV meds?
Yes, a great dealYes, somewhatNo, not really
Client Satisfaction with Case Management Services: Title II Service Area Results from the 2005 Survey
12
mentioned their case manager by name and wrote how much they appreciated the help they receive or how grateful they are to their case manager. However, even with the overall positive responses, many respondents had suggestions for how case management services could be improved. The general categories are presented below, starting with the categories most frequently mentioned by clients. The themes are also discussed in order of frequency within each compressed category.
The most frequently mentioned responses fell under the category of increased funding. Various themes that emerged under this category were more money, services and/or resources. Most of the responses that fell under this category indicated that respondents needed more money to help pay for specific services, such as transportation, household bills, prescription medication, dental care and food. Many others indicated that more money was needed by the overall system, in order to hire more case managers or reduce caseloads because their case manager was overworked and/or not able to spend enough time with clients. For example, one respondent wrote that the quality of case management services would be improved if there were “more case managers so they have less burden and more time for one-on-one time.” Similarly, several respondents whose case managers see clients with conditions other than HIV/AIDS felt quality would be improved if their case manager did not have such variety in their case load. One respondent wrote: “my case manager has a large case load that is mainly women, children and families not with the same needs as someone with HIV and AIDS. The resources, problems and solutions are so different.” A handful of respondents felt that if more money was available for case management services, there would be a more equal distribution of services across clients and geographic regions.
Two other main categories emerged, which represent areas for improvement. Both were mentioned with about the same frequency. One category can be summarized as improve access to case management services and the other is improve the overall quality of case management services. Improved access to services was mentioned in several different ways, one of which was by specifically mentioning “access,” such as the location of the services, hours available, or ability to speak directly to a human, rather than being forced to leave voice mail. One client suggested that a toll free number would improve access. A handful of others requested a full-time case manager. However, for the most part, access meant increased contact with the case manager, improved follow up by the case manager, or more home visits. Responses such as “Come see me more often” or “Call me more often” were common. Several of the respondents who had indicated in the close-ended questions that they’d had “too few contacts” with their case manager also felt that increased access to their case manager would improve the quality of case management services. As an example, one respondent stated the one thing that would improve case management services would be “to be seen more than once a year.”
Client Satisfaction with Case Management Services: Title II Service Area Results from the 2005 Survey
13
The third main category, improve overall quality of case management services, had a variety of responses. In this case, quality is defined as knowledge, attitude, communication, consistency and privacy. The most common responses under this category referred to improving knowledge of available resources. Some respondents felt their case managers should have more information about resources available to people living with HIV/AIDS, while others felt they themselves would like to know more about available resources. The second most common responses indicated there was room for improvement in the attitude of the case managers. Respondents expressed this by writing things such as “if my case manager couldn’t help me solve my problems…at least s/he could convince me s/he cared.” Further, respondents asked case managers to be more “compassionate,” “sensitive,” or “less judgmental.” Communication was mentioned with about the same frequency as attitude. Respondents referred to communication in two ways. First, they asked for better communication through increased contact with their case managers. Second, they wanted better communication through an improved understanding of each other. Third, respondents felt that a reduction in case management turnover would help improve the quality of case management services. Finally, while only a few respondents mentioned needing improved privacy, it is noteworthy, given the emphasis placed on confidentiality among HIV/AIDS service providers.
A final category, HIV service system issues, was not mentioned as often as the above three categories, so should be considered a more minor theme. Within this theme, it also should be noted that the responses referred more to the broader HIV service system and not specifically to Title II case management services. Within this category, respondents requested more social support, such as support groups or social networking opportunities. Respondents also requested a reduction in paperwork and bureaucracy. For example, one respondent referred to the assistance for insurance or medical bills as a “slow process which makes everything late” and another said the “procedural hoops” made getting assistance difficult.
Differences across client characteristics
Analyses were performed to assess differences in satisfaction with case management services and perceived helpfulness in dealing with problems across several respondent characteristics. As mentioned earlier, clients within several characteristics were combined because of low respondent numbers. Subgroups were defined by the following characteristics:
gender (men vs. women)3
age (<35, 35-49, 50 and older)
3 The one individual identifying as transgender was eliminated from these analyses.
Client Satisfaction with Case Management Services: Title II Service Area Results from the 2005 Survey
14
ethnicity (non-Hispanic White, Hispanic, all others)
region (Central, Coastal, Columbia/Eastern, and I-5 Corridor, )
time since diagnosis with HIV and, where appropriate, AIDS
length of time seeing a case manager
number of contacts with case manager (1-2, 3-6, 7 or more)
feelings about amount of contact with case manager (i.e., “just the right amount” vs. “too few”)
There were no reported differences in satisfaction with or perceived helpfulness of case management services by gender, age, race/ethnicity, years since HIV/AIDS diagnosis, or length of time in case management. However, differences emerged between clients from different regions and clients with fewer contacts with their case manager.
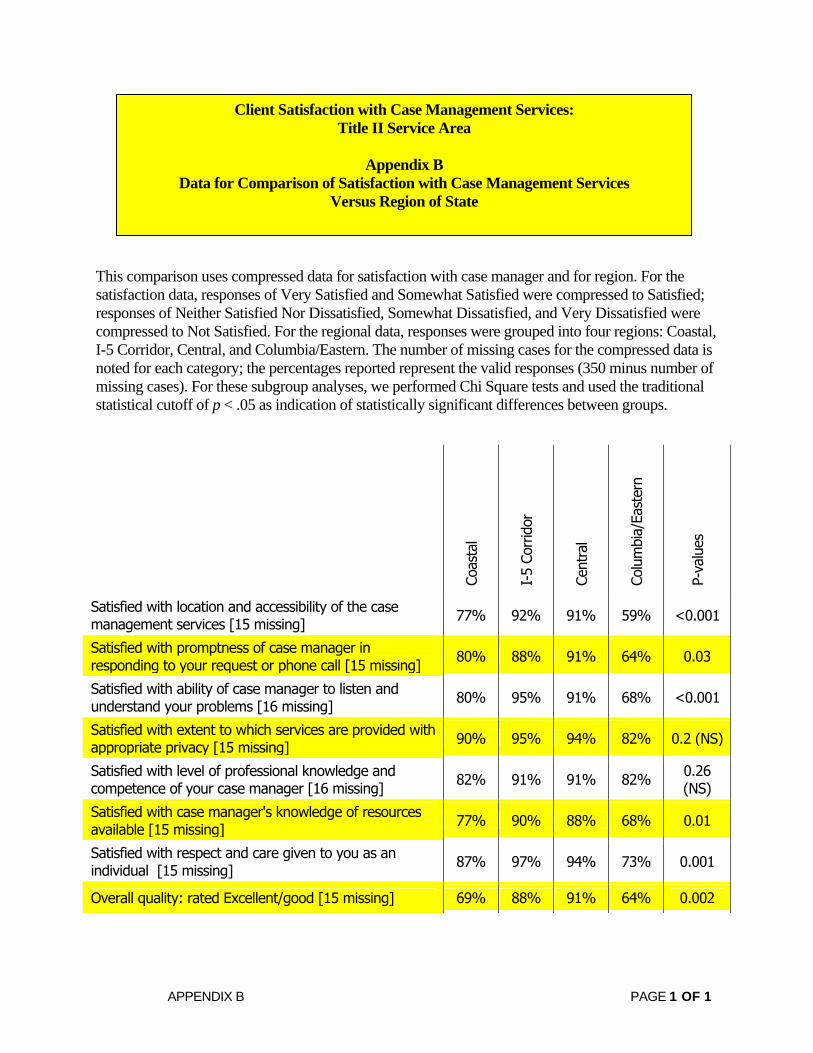
Region4: Clients from the areas defined as “Central Oregon” and “I-5 Corridor” consistently reported higher satisfaction with most aspects of case management than clients from “Coastal Oregon” and “Columbia/Eastern Oregon.” For example, the vast majority of clients living in Central Oregon (91%) and the I-5 Corridor (87%) rated the overall quality of case management services as excellent or good, compared to only 69% of Coastal clients and 64% of clients from the Columbia/Eastern region (p=.002). Clients from the Coast or Columbia/Eastern Oregon also reported lower levels of satisfaction on five of seven items related to specific areas of case management: location, promptness, listening, knowledge of available resources, and respect. Generally, satisfaction across these five items was about 12 percentage points lower for Coastal clients and about 25 percentage points lower for Columbia/Eastern clients, as compared to Central and I-5 Corridor clients. Similarly, 66% of Coastal clients and 68% of Columbia/Eastern clients stated that their case manager helped them deal more effectively with their problems, compared to 98% of Central Oregon clients and 91% of I-5 Corridor clients (See Appendix B). Clients from all regions reported high levels of satisfaction with their case managers’ level of professional knowledge and the extent to which services are provided with privacy.
Number of Contacts and Feelings about the Amount of Contact with Case Manager: Clients who had the most contacts with their case manager—specifically, 7 or more in the past 12 months—reported the highest level of
4 The following counties comprise the four regions: Central (Crook, Deschutes, Jefferson, Klamath, and Lake), Coastal (Clatsop, Coos, Curry, Lincoln, and Tillamook), Columbia/Eastern (Baker, Gilliam, Grant, Harney, Hood River, Malheur, Morrow, Sherman, Umatilla, Union, Wallowa, Wasco, and Wheeler), and I-5 Corridor (Benton, Douglas, Jackson, Josephine, Lane, Linn, Marion, and Polk).
Client Satisfaction with Case Management Services: Title II Service Area Results from the 2005 Survey
15
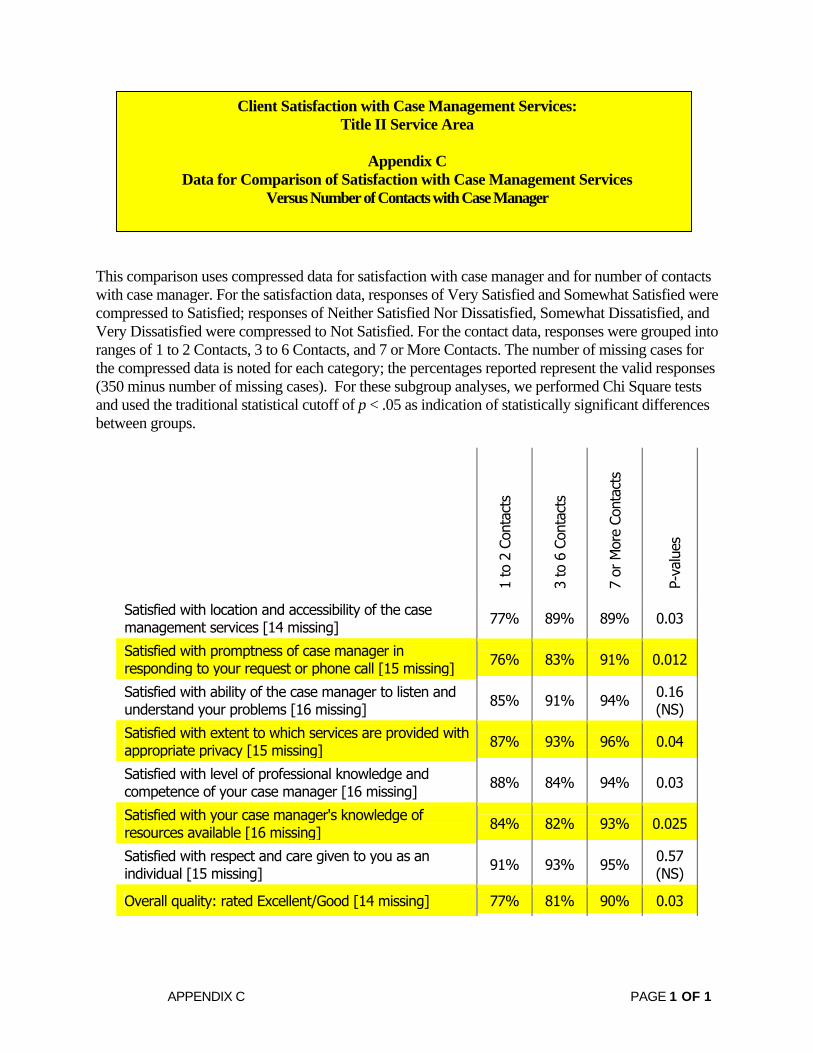
satisfaction across all items. Overall satisfaction increased in a stepwise pattern with number of contacts. Perceived efficacy of case management followed the same pattern, with 91% of clients who had 7 or more contacts with their case manager reporting that case managers helped them deal with their problems, compared to 86% of clients with 3-6 contacts, and 78% of clients with 1-2 contacts. Differences on all satisfaction items by number of contacts are shown in Appendix C.
A more consistent and dramatic difference emerged between clients who felt they’d had “too few” contacts with their case manager in the past year (n=60) compared to those who felt they’d had “just the right amount” of contacts (n=272)5. Fewer than half (48%) of clients who felt they’d had “too few” contacts with their case manager rated the overall quality of case management as “excellent” or “good” compared to nearly all (93%) of those who felt they’d had “just the right amount” of contact. Clients with “too few” contacts were far less satisfied across all other items, ranging from 37 percentage points lower for satisfaction with promptness to 17 percentage points lower for satisfaction with both privacy and with respect given by the case manager. Likewise, only 59% of clients who felt they’d had “too few” contacts with their case manager reported that the case manager helped them deal with their problems compared to 95% of clients who reported “just the right amount” of contact.
Conclusions
Limitations
These results are based on self-reported opinions to a simple mailed survey, representing a specific point in time (Autumn, 2005). We did not receive a survey back from everyone asked to participate, so our results represent the target population—people with HIV, receiving case management services in the Title II service area—only if those who did not answer have similar views compared to those who did. It is not possible to know the extent of this “non-response bias,” so results should be considered with some caution. However, our response rate of 61% is generally considered satisfactory for this type of passive, self-administered survey.
Key Findings
Overall, clients reported a high level of satisfaction with case management services. This was true for the question about their services overall, as well as for several items that asked about specific service aspects and helpfulness of the
5 Eighteen clients were excluded from these analyses: 12 who didn’t answer the question and the 6 who reported “too many” contacts with their case manager in the past 12 months.

Client Satisfaction with Case Management Services: Title II Service Area Results from the 2005 Survey
16
case manager. This high level of satisfaction appears to have remained stable compared with similar questions asked during the 2004 Needs Assessment Survey, although direct comparison of percentages is unwise because of structural differences between the two surveys.
Five survey questions measured clients’ perceptions of their case managers’ helpfulness in helping them with specific problems and issues typically associated with HIV. Nearly half of all clients reported that they did not need help staying on their HIV medications and about one third needed no help finding a doctor or applying for health insurance. Of those who did need help, a majority reported that their case manager had helped them “a great deal” in achieving these goals.
Responses to open-ended questions further echoed this high level of satisfaction, with respondents being very positive overall and thankful for the services they receive. Areas for improvement that clients identified in the open-ended responses included the need for increased funding, both for specific services and for the HIV service system overall, and improved access to and quality of existing case management services.
Subgroup differences in satisfaction with and perceived helpfulness of case management occurred consistently for three characteristics. Clients living in Coastal Oregon and the large geographic region defined as Columbia/Eastern were less satisfied with case management than clients living in Central Oregon or along the I-5 Corridor.
In addition, clients with less contact with their case managers were less satisfied. Specifically, those who felt they’d had “too few” contacts with their case manager were less satisfied across all items than those who felt they’d had “just the right amount” of contact and clients with 7 or more contacts were more satisfied across all items than those with fewer contacts. Many of the open-ended comments stressed the need some clients felt for more frequent and thorough contact from case managers, including specific requests for prompt return phone calls, improved follow up, home visits and improved communication.
Implications
Recent studies bolster the theory that case management plays a critical part in ensuring that people living with HIV receive appropriate medical care and supportive services.6, 7 While the scope of our satisfaction study did not include measuring the effect of our case management services, our clients are reporting a high level of satisfaction. In addition, most clients who needed help applying for 6 Katz MH, Cunningham WE, Fleishman JA, Anderson RM, et al. Effect of case management on unmet needs and utilization of medical care and medications among HIV-infected persons. Annals of Internal Medicine 2001; 135: 557-565. 7 Gardner LI, Metsch LR, Anderson-Mahoney P, Loughlin AM, et al. Efficacy of a brief case management intervention to link recently diagnosed HIV-infected persons to care. AIDS 2005; 19:423-431.

Client Satisfaction with Case Management Services: Title II Service Area Results from the 2005 Survey
17
health insurance, finding an HIV doctor, or staying on their HIV medications reported that case managers helped them “a great deal” in meeting these important goals. Many other clients, particularly those who had been living with HIV for a decade or longer, reported not needing those services from a case manager—likely because the issues had already been worked out at an earlier point in their relationship with HIV and with HIV case management.
Clients from two broadly defined regions in the state, the “Coastal” and “Columbia/Eastern” regions reported less satisfaction with case management services than clients living in the “Central” or “I-5 Corridor” regions. The four regions are markedly different, with the “Coastal” and “Columbia/Eastern” regions characterized by low population density, greater distances between needed services, and fewer dedicated HIV/AIDS service providers. Greater efforts may be needed to maintain links between clients, case managers, and other medical and social services sited across these large geographic areas.
It is harder to interpret the relationship between more contact with case managers and higher satisfaction, as there are several possible factors that might be related to this difference in satisfaction. On the one hand, dissatisfied clients may initiate fewer contacts—for example, clients may have trouble with access, or do not feel like they’re getting the help they need, so they see their case manager with less regularity. Alternatively, those who do not recognize a need for particular services may not seek case management frequently, and may not value case management as highly as those who perceive a need for services.
It is also possible that less contact with case managers may lead to less satisfaction with case management services. The fact that clients who had only seen their case manager once or twice during the preceding year were also more likely to say that they’d had “too few” contacts with the case manager lends credibility to this theory, as do the open-ended comments requesting more contact between client and case manager, better follow up, and improved access. Although the effectiveness of HIV case management has not been well studied, there is some indication in the literature that sustained or multiple contacts with a case manager are associated with fewer unmet needs for services and higher adherence to HIV treatment regimens for those receiving HIV treatment.8 More frequent contact with case managers, especially for recently diagnosed individuals who may have critical needs related to health insurance, medication adherence, and navigation of the medical care system—may be warranted.
8 Katz MH, Cunningham WE, Fleishman JA, Anderson RM, et al. Effect of case management on unmet needs and utilization of medical care and medications among HIV-infected persons. Annals of Internal Medicine 2001; 135: 557-565.
APPENDIX A PAGE 1 OF 6
We’re Still Listening…
2005 Survey for People Living with HIV and AIDS in Oregon
Please help us improve our program by answering some questions about the HIV case management services you’ve received and other services that you might need.
Survey Instructions
( Your name will not be attached to this form and your
answers will be kept completely confidential and anonymous.
( We are interested in your honest opinions, whether they are positive or negative.
( You do not have to answer any question that makes you uncomfortable.
( Please read each question. ( Please read all the choices before you choose an answer. ( Please put a check or X in the box next to your answer or fill it in:
" " ! (all are OK!) ( Some questions will ask you to provide an answer in your
own words. If there is not enough space, please use the back cover to complete your answer.
( If you need help, or need the survey in an alternate format, please call Ronda at 971-673-0594.
( You may skip questions if you do not want to answer them, but we will appreciate it very much if you try to answer as many as you can. Thanks!
Client Satisfaction with Case Management Services: Title II Service Area
Appendix A
Survey Frequencies for Total Group (n=350)
APPENDIX A PAGE 2 OF 6
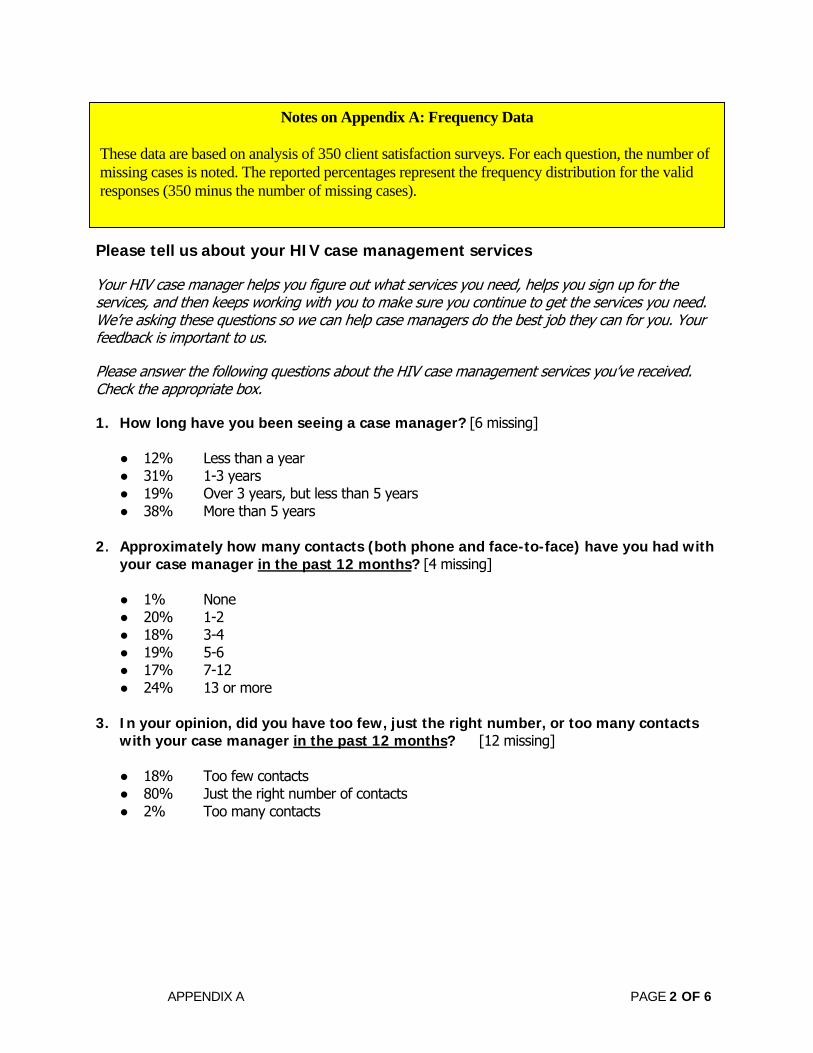
Please tell us about your HIV case management services Your HIV case manager helps you figure out what services you need, helps you sign up for the services, and then keeps working with you to make sure you continue to get the services you need. We’re asking these questions so we can help case managers do the best job they can for you. Your feedback is important to us. Please answer the following questions about the HIV case management services you’ve received. Check the appropriate box.
1. How long have you been seeing a case manager? [6 missing]
● 12% Less than a year ● 31% 1-3 years ● 19% Over 3 years, but less than 5 years ● 38% More than 5 years
2. Approximately how many contacts (both phone and face-to-face) have you had with
your case manager in the past 12 months? [4 missing]
● 1% None ● 20% 1-2 ● 18% 3-4 ● 19% 5-6 ● 17% 7-12 ● 24% 13 or more
3. In your opinion, did you have too few, just the right number, or too many contacts
with your case manager in the past 12 months? [12 missing]
● 18% Too few contacts ● 80% Just the right number of contacts ● 2% Too many contacts
Notes on Appendix A: Frequency Data
These data are based on analysis of 350 client satisfaction surveys. For each question, the number of missing cases is noted. The reported percentages represent the frequency distribution for the valid responses (350 minus the number of missing cases).

APPENDIX A PAGE 3 OF 6
4. How satisfied have you been with these features of the case management services that you’ve been receiving? In each row, please check the one answer that comes closest to what you think.
5. Has your case manager been helpful in any of the following ways? For each item, please check only one answer.
Has your case manager helped you…?
Yes, a great deal
Yes, somewhat
No, not really
Not applicable —I did not need the help
…deal more effectively with your problems? [5 missing] 52% 26% 12% 10%
…find a doctor who knows about HIV? [11 missing] 48% 9% 8% 35%
…apply for health insurance? [10 missing] 47% 8% 11% 34%
…stay on your HIV meds? [9 missing] 33% 8% 10% 49%
Ve
ry S
atis
fied
Som
ewha
t Sat
isfie
d
Nei
ther
Sat
isfie
d
Nor
Dis
satis
fied
Som
ewha
t Dis
satis
fied
Very
Dis
satis
fied
Location and accessibility of the case management services [7 missing] 71% 16% 7% 4% 3%
Promptness of case manager in responding to your request or phone call [8 missing] 64% 21% 6% 5% 3%
Ability of the case manager to listen and understand your problems [9 missing] 72% 18% 4% 4% 2%
Extent to which services are provided with appropriate privacy [8 missing] 80% 12% 4% 2% 2%
Level of professional knowledge and competence of your case manager [9 missing] 71% 18% 5% 4% 2%
Your case manager's knowledge of resources available [9 missing] 67% 19% 5% 6% 2%
Respect and care given to you as an individual [8 missing] 82% 12% 2% 2% 2%
APPENDIX A PAGE 4 OF 6
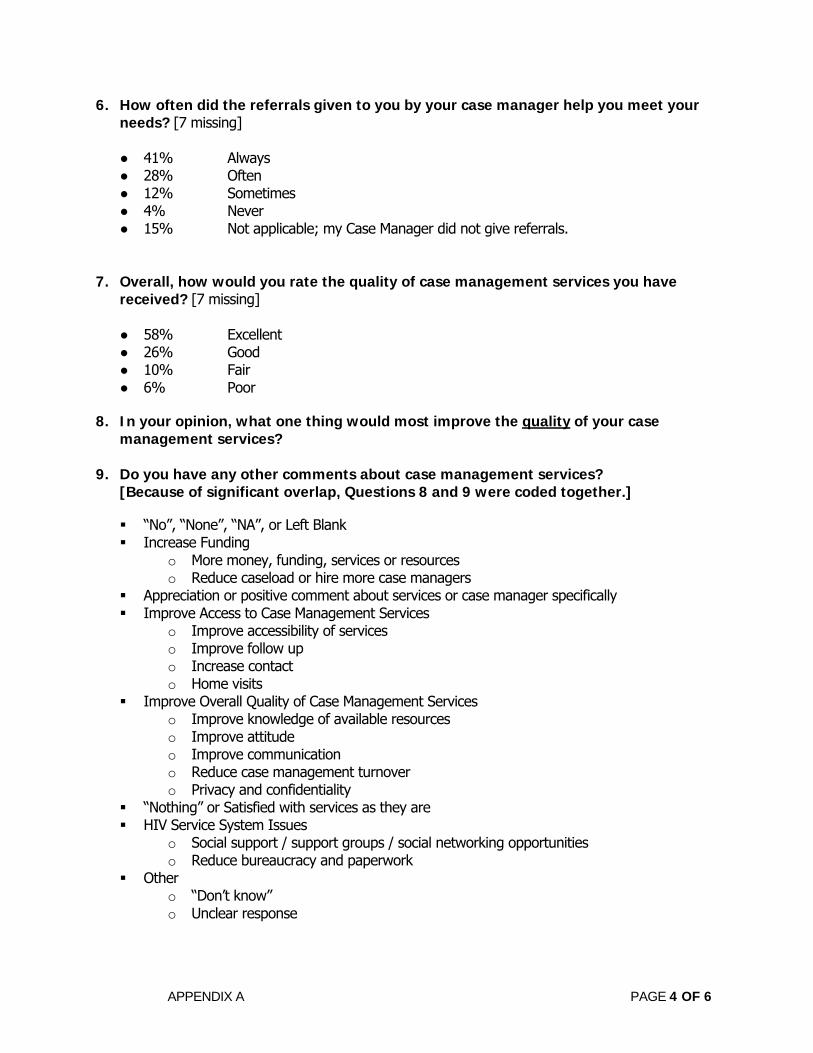
6. How often did the referrals given to you by your case manager help you meet your needs? [7 missing]
● 41% Always ● 28% Often ● 12% Sometimes ● 4% Never ● 15% Not applicable; my Case Manager did not give referrals.
7. Overall, how would you rate the quality of case management services you have received? [7 missing]
● 58% Excellent ● 26% Good ● 10% Fair ● 6% Poor
8. In your opinion, what one thing would most improve the quality of your case
management services? 9. Do you have any other comments about case management services?
[Because of significant overlap, Questions 8 and 9 were coded together.]
“No”, “None”, “NA”, or Left Blank Increase Funding
o More money, funding, services or resources o Reduce caseload or hire more case managers
Appreciation or positive comment about services or case manager specifically Improve Access to Case Management Services
o Improve accessibility of services o Improve follow up o Increase contact o Home visits
Improve Overall Quality of Case Management Services o Improve knowledge of available resources o Improve attitude o Improve communication o Reduce case management turnover o Privacy and confidentiality
“Nothing” or Satisfied with services as they are HIV Service System Issues
o Social support / support groups / social networking opportunities o Reduce bureaucracy and paperwork
Other o “Don’t know” o Unclear response
APPENDIX A PAGE 5 OF 6
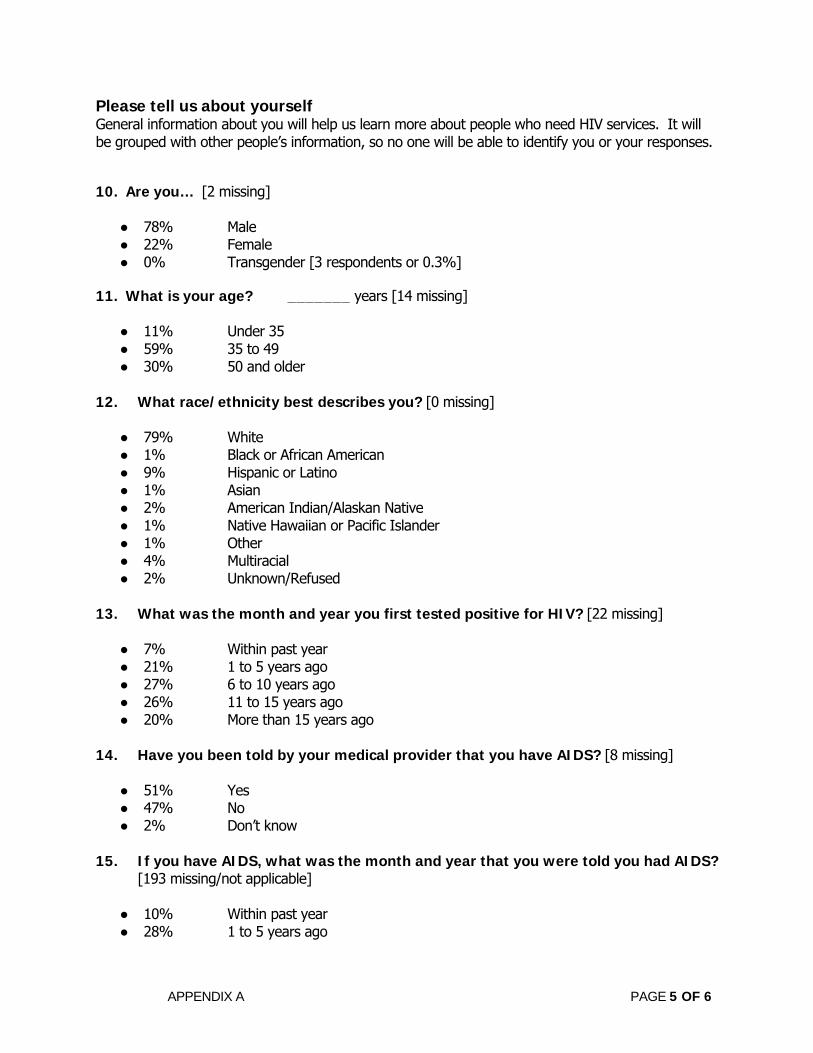
Please tell us about yourself General information about you will help us learn more about people who need HIV services. It will be grouped with other people’s information, so no one will be able to identify you or your responses.
10. Are you… [2 missing]
● 78% Male ● 22% Female ● 0% Transgender [3 respondents or 0.3%]
11. What is your age? _______ years [14 missing]
● 11% Under 35 ● 59% 35 to 49 ● 30% 50 and older
12. What race/ethnicity best describes you? [0 missing]
● 79% White ● 1% Black or African American ● 9% Hispanic or Latino ● 1% Asian ● 2% American Indian/Alaskan Native ● 1% Native Hawaiian or Pacific Islander ● 1% Other ● 4% Multiracial ● 2% Unknown/Refused
13. What was the month and year you first tested positive for HIV? [22 missing]
● 7% Within past year ● 21% 1 to 5 years ago ● 27% 6 to 10 years ago ● 26% 11 to 15 years ago ● 20% More than 15 years ago
14. Have you been told by your medical provider that you have AIDS? [8 missing]
● 51% Yes ● 47% No ● 2% Don’t know
15. If you have AIDS, what was the month and year that you were told you had AIDS?
[193 missing/not applicable]
● 10% Within past year ● 28% 1 to 5 years ago
APPENDIX A PAGE 6 OF 6
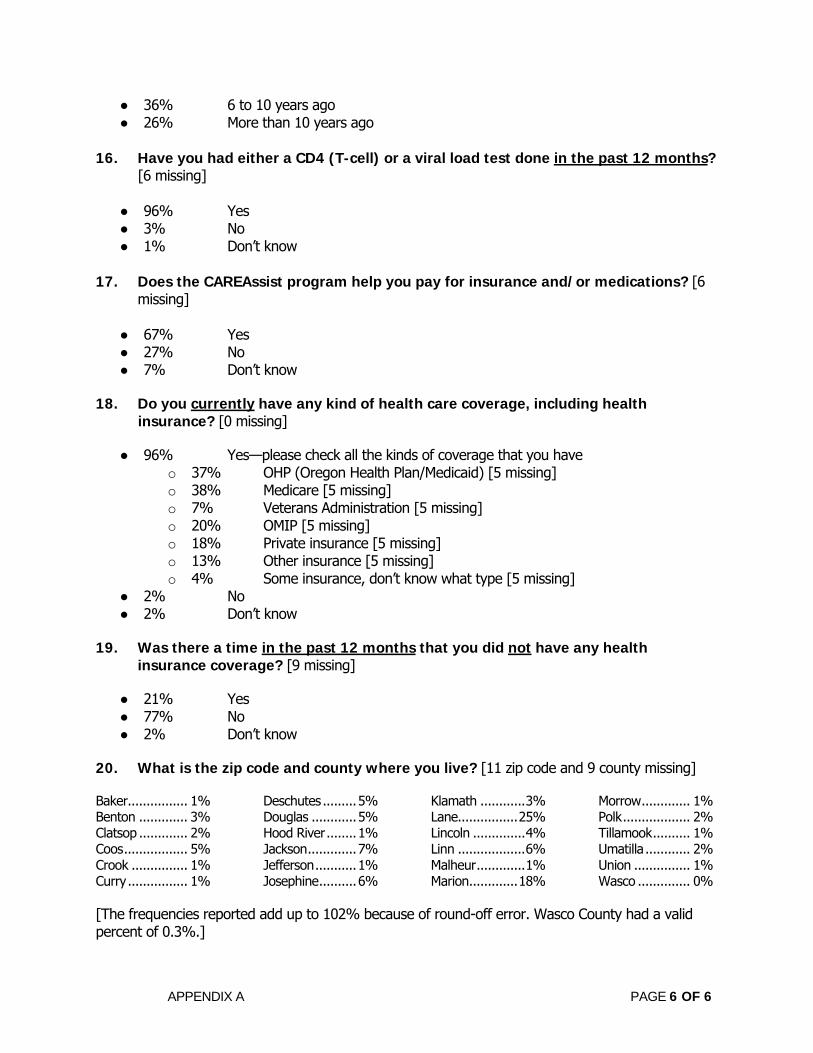
● 36% 6 to 10 years ago ● 26% More than 10 years ago
16. Have you had either a CD4 (T-cell) or a viral load test done in the past 12 months?
[6 missing]
● 96% Yes ● 3% No ● 1% Don’t know
17. Does the CAREAssist program help you pay for insurance and/or medications? [6
missing]
● 67% Yes ● 27% No ● 7% Don’t know
18. Do you currently have any kind of health care coverage, including health
insurance? [0 missing]
● 96% Yes—please check all the kinds of coverage that you have o 37% OHP (Oregon Health Plan/Medicaid) [5 missing] o 38% Medicare [5 missing] o 7% Veterans Administration [5 missing] o 20% OMIP [5 missing] o 18% Private insurance [5 missing] o 13% Other insurance [5 missing] o 4% Some insurance, don’t know what type [5 missing]
● 2% No ● 2% Don’t know
19. Was there a time in the past 12 months that you did not have any health
insurance coverage? [9 missing]
● 21% Yes ● 77% No ● 2% Don’t know
20. What is the zip code and county where you live? [11 zip code and 9 county missing]
Baker................ 1% Benton ............. 3% Clatsop ............. 2% Coos................. 5% Crook ............... 1% Curry................ 1%
Deschutes .........5% Douglas ............5% Hood River........1% Jackson.............7% Jefferson...........1% Josephine..........6%
Klamath ............3% Lane................25% Lincoln ..............4% Linn ..................6% Malheur.............1% Marion.............18%
Morrow............. 1% Polk.................. 2% Tillamook.......... 1% Umatilla ............ 2% Union ............... 1% Wasco .............. 0%
[The frequencies reported add up to 102% because of round-off error. Wasco County had a valid percent of 0.3%.]
APPENDIX B PAGE 1 OF 1
This comparison uses compressed data for satisfaction with case manager and for region. For the satisfaction data, responses of Very Satisfied and Somewhat Satisfied were compressed to Satisfied; responses of Neither Satisfied Nor Dissatisfied, Somewhat Dissatisfied, and Very Dissatisfied were compressed to Not Satisfied. For the regional data, responses were grouped into four regions: Coastal, I-5 Corridor, Central, and Columbia/Eastern. The number of missing cases for the compressed data is noted for each category; the percentages reported represent the valid responses (350 minus number of missing cases). For these subgroup analyses, we performed Chi Square tests and used the traditional statistical cutoff of p < .05 as indication of statistically significant differences between groups.
C
oast
al
I-5
Cor
ridor
Cen
tral
Col
umbi
a/Ea
ster
n
P-v
alue
s
Satisfied with location and accessibility of the case management services [15 missing]
77% 92% 91% 59% <0.001
Satisfied with promptness of case manager in responding to your request or phone call [15 missing] 80% 88% 91% 64% 0.03
Satisfied with ability of case manager to listen and understand your problems [16 missing] 80% 95% 91% 68% <0.001
Satisfied with extent to which services are provided with appropriate privacy [15 missing] 90% 95% 94% 82% 0.2 (NS)
Satisfied with level of professional knowledge and competence of your case manager [16 missing] 82% 91% 91% 82% 0.26
(NS)
Satisfied with case manager's knowledge of resources available [15 missing] 77% 90% 88% 68% 0.01
Satisfied with respect and care given to you as an individual [15 missing] 87% 97% 94% 73% 0.001
Overall quality: rated Excellent/good [15 missing] 69% 88% 91% 64% 0.002
Client Satisfaction with Case Management Services: Title II Service Area
Appendix B
Data for Comparison of Satisfaction with Case Management Services Versus Region of State
APPENDIX C PAGE 1 OF 1
This comparison uses compressed data for satisfaction with case manager and for number of contacts with case manager. For the satisfaction data, responses of Very Satisfied and Somewhat Satisfied were compressed to Satisfied; responses of Neither Satisfied Nor Dissatisfied, Somewhat Dissatisfied, and Very Dissatisfied were compressed to Not Satisfied. For the contact data, responses were grouped into ranges of 1 to 2 Contacts, 3 to 6 Contacts, and 7 or More Contacts. The number of missing cases for the compressed data is noted for each category; the percentages reported represent the valid responses (350 minus number of missing cases). For these subgroup analyses, we performed Chi Square tests and used the traditional statistical cutoff of p < .05 as indication of statistically significant differences between groups.
1
to 2
Con
tact
s
3 to
6 C
onta
cts
7 o
r M
ore
Cont
acts
P-v
alue
s
Satisfied with location and accessibility of the case management services [14 missing]
77% 89% 89% 0.03
Satisfied with promptness of case manager in responding to your request or phone call [15 missing] 76% 83% 91% 0.012
Satisfied with ability of the case manager to listen and understand your problems [16 missing] 85% 91% 94% 0.16
(NS)
Satisfied with extent to which services are provided with appropriate privacy [15 missing] 87% 93% 96% 0.04
Satisfied with level of professional knowledge and competence of your case manager [16 missing] 88% 84% 94% 0.03
Satisfied with your case manager's knowledge of resources available [16 missing] 84% 82% 93% 0.025
Satisfied with respect and care given to you as an individual [15 missing] 91% 93% 95% 0.57
(NS)
Overall quality: rated Excellent/Good [14 missing] 77% 81% 90% 0.03
Client Satisfaction with Case Management Services: Title II Service Area
Appendix C
Data for Comparison of Satisfaction with Case Management Services Versus Number of Contacts with Case Manager