Client Satisfaction Survey Report 2020
63
Prepared By: SPSS ZIMBABWE (Pvt) Ltd 50 Pendennis Road Mt Pleasant Harare Tel: 0242 744 264 / 0774 997 301 / 0772 697 727 Email: [email protected] For: Client Satisfaction Survey Report 2020
Transcript of Client Satisfaction Survey Report 2020

Prepared By:
SPSS ZIMBABWE (Pvt) Ltd 50 Pendennis Road
Mt Pleasant Harare
Tel: 0242 744 264 / 0774 997 301 / 0772 697 727 Email: [email protected]
For:
Client Satisfaction
Survey Report
2020

1
Contents List of Figures .......................................................................................................................................... 3
List of Tables ........................................................................................................................................... 4
CHAPTER ONE: BACKGROUND ................................................................................................................ 5
Introduction ............................................................................................................................................ 5
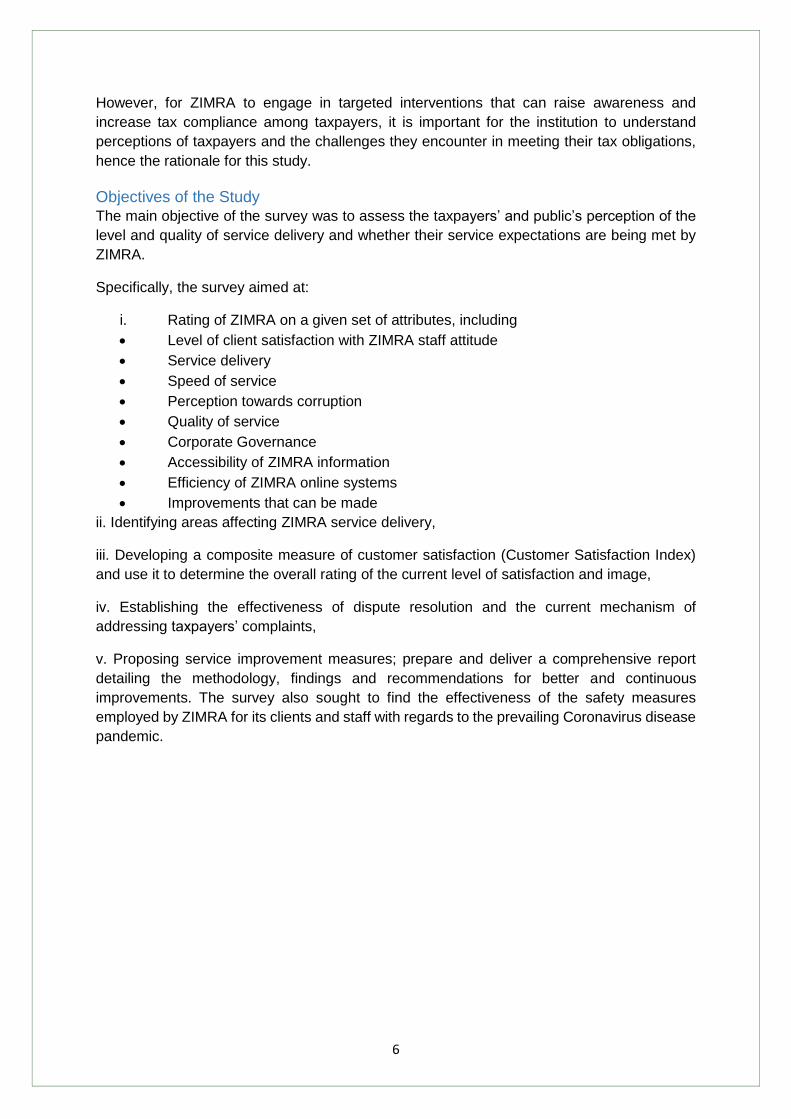
Objectives of the Study ........................................................................................................................... 6
CHAPTER TWO: LITERATURE REVIEW ..................................................................................................... 7
Service Quality ........................................................................................................................................ 7
Relationship Between Service Quality and Client Satisfaction ............................................................... 8
Quality Taxpayer Services ....................................................................................................................... 8
CHAPTER THREE: RESEARCH METHODOLOGY ...................................................................................... 10
Study Design ......................................................................................................................................... 10
Target Groups ....................................................................................................................................... 10
Sampling Techniques and Sample Size ................................................................................................. 11
Sampling Technique .............................................................................................................................. 11
The Survey Population and Sample Size ............................................................................................... 11
Distribution of Respondents to the Questionnaire .............................................................................. 12
Total Sample Size .................................................................................................................................. 12
Data Collection Approach ................................................................................................................... 12
Primary Data ......................................................................................................................................... 12
Quality Control Protocols ...................................................................................................................... 13
CHAPTER FOUR: DATA ANALYSIS AND RESEARCH FINDINGS ............................................................... 14
Data Cleaning, Tabulation and Analysis ............................................................................................ 14
Disaggregation of Respondents by Gender and Age Range ................................................................. 14
Disaggregation of Respondents by Category of Business ..................................................................... 15
Distribution of Corporate Taxpayers by Sector .................................................................................... 15
Length of Contact with ZIMRA .............................................................................................................. 16
Taxpayer Awareness of ZIMRA Service Charter .................................................................................... 16
Effectiveness of ZIMRA Service Charter ................................................................................................ 17
ZIMRA Service Delivery ......................................................................................................................... 17
Taxpayer Awareness of ZIMRA website ................................................................................................ 17
Frequency of Customer Website Visit .................................................................................................. 18
Ease of Use and Access to Information ................................................................................................. 18
Uses of ZIMRA Website ......................................................................................................................... 19
Ways of improving the website ............................................................................................................ 19
Media Appearance ................................................................................................................................ 21

2
Preferred channel of communication ................................................................................................... 22
Level of Satisfaction with ZIMRA Online/Mobile platforms ................................................................. 22
Challenges faced with fiscal devices ..................................................................................................... 23
Problems resolution/Complaint handling ............................................................................................. 24
Reasons for not reporting ..................................................................................................................... 24
Channel used and speed of complaint resolution ................................................................................ 25
Level of satisfaction with complaints handling ..................................................................................... 25
Awareness of ZIMRA current reforms .................................................................................................. 26
Impact of reforms on service delivery .................................................................................................. 26
Customer satisfaction levels with ZIMRA staff ..................................................................................... 27
Customer perception levels on staff service to customers .................................................................. 27
Rating of staff commitment to serving customers ............................................................................... 29
Customer perception on staff integrity and fairness ............................................................................ 29
Comparative Analysis-Border Stations ................................................................................................. 29
Customer perception on taxpayer education ....................................................................................... 31
Effectiveness of ZIMRA sensitization programs .................................................................................... 32
Corruption level at Major Stations ....................................................................................................... 32
Compliance measure ............................................................................................................................ 33
Filing of Tax Returns .............................................................................................................................. 33
Payment of Taxes .................................................................................................................................. 34
Reporting Correctly ............................................................................................................................... 34
Awareness of ZIMRA measures to combat COVID 19 .......................................................................... 34
Calculation of the Customer Satisfaction Index (CSI) ........................................................................... 36
Station Satisfaction Scores .................................................................................................................... 37
Comparative Analysis- Satisfaction by Station ...................................................................................... 38
Overall Service Delivery ........................................................................................................................ 39
Proposed areas of improvement .......................................................................................................... 39
Proposed Areas of Improvement-Border Stations ............................................................................... 41
CHAPTER FIVE: CONCLUSION AND RECOMMENDATIONS .................................................................... 43
Conclusions ........................................................................................................................................... 43
Recommendations ................................................................................................................................ 44
Appendix ............................................................................................................................................... 46
3
List of Figures Figure 1 The Survey Design and Implementation Process .................................................................... 10
Figure 2 GPS Location of Interviewer at Plumtree Border Post ............................................................ 13
Figure 3 GPS Location of Interviewer at Victoria Falls .......................................................................... 13
Figure 4 Distribution of Respondents by Gender and Age ................................................................... 14
Figure 5Distribution of Respondents by Level of Education ................................................................. 14
Figure 6 Distribution of Respondents by Category of Business ............................................................ 15
Figure 7 Distribution of Corporate Taxpayers by Sector....................................................................... 15
Figure 8 Respondent Length of Contact with ZIMRA ............................................................................ 16
Figure 9 Taxpayer Awareness and Source of Awareness of ZIMRA Service Charter ............................ 16
Figure 10 Effectiveness of ZIMRA Service Charter ................................................................................ 17
Figure 11 Service Delivery Performance ............................................................................................... 17
Figure 12 Taxpayer Awareness of ZIMRA Website ............................................................................... 18
Figure 13 Frequency of Visit ................................................................................................................. 18
Figure 14 Ease of Use and Access to Information ................................................................................. 19
Figure 15 ZIMRA Media Presence ......................................................................................................... 21
Figure 16 Preferred Channel of Communication .................................................................................. 22
Figure 17 Taxpayer Impression of ZIMRA's Communication System ................................................... 22
Figure 18 Level of Communication with Online/Mobile Platforms ...................................................... 23
Figure 19 Nature of Complaints ............................................................................................................ 24
Figure 20 Reasons for Failure to Report ............................................................................................... 25
Figure 21 Level of Satisfaction with Complaints Handling .................................................................... 26
Figure 22 Effectiveness of ZIMRA Sensitization Programs .................................................................... 32
Figure 23 Filing of Tax Returns .............................................................................................................. 33
Figure 24 Payment of Taxes .................................................................................................................. 34
Figure 25 Reporting Correctly ............................................................................................................... 34
Figure 26 ACSI Model for Government Services ................................................................................... 36
Figure 27 Satisfaction Score per Station ............................................................................................... 37
Figure 28 Comparative Analysis-Satisfaction Score by Station ............................................................. 38
Figure 29 Overall Service Delivery ........................................................................................................ 39

4
List of Tables Table 1 Distribution of Respondents to the Questionnaire .................................................................. 12
Table 2 Total Sample Size...................................................................................................................... 12
Table 3 Uses of ZIMRA Website ............................................................................................................ 19
Table 4 Ways of Improving the Website ............................................................................................... 20
Table 5 Main Media of Appearance ...................................................................................................... 21
Table 6 Challenges faced with Fiscal Devices ....................................................................................... 23
Table 7 Speed of Complaint Resolution ................................................................................................ 25
Table 8 Level of Satisfaction with ZIMRA Staff ..................................................................................... 27
Table 9 Customer Perception with Staff Service .................................................................................. 28
Table 10 Rating of Staff Commitment .................................................................................................. 29
Table 11 Comparative Analysis of Staff Service at Border Stations ...................................................... 30
Table 12 Comparative Analysis of Staff Service at Border Stations ...................................................... 30
Table 13 Comparative Analysis of Staff Service at Border Stations ...................................................... 31
Table 14 Comparative Analysis of Staff Service at Border Stations ...................................................... 31
Table 15 Corruption Level at Border Stations ....................................................................................... 33
Table 16 Level of Satisfaction with Physical Facilities ........................................................................... 35
Table 17 Proposed Areas of Improvement ........................................................................................... 39
Table 18 Proposed Areas of Improvement at Border Stations ............................................................. 41
5
CHAPTER ONE: BACKGROUND
Introduction The Zimbabwe Revenue Authority (ZIMRA) was established on 19 January 2001 as a
successor organisation to the then Department of Taxes and the Department of Customs and
Excise following the promulgation of the Revenue Authority Act on February 11, 2000.
The Zimbabwe Revenue Authority, which derives its mandate from the Revenue Authority Act
[Chapter 23:11] and other subsidiary legislation, is responsible for assessing, collecting and
accounting for revenue on behalf of the State through the Ministry of Finance.
ZIMRA’s mandate is to: -
1. Collect revenue. The following are some of the revenue heads which are administered by
ZIMRA:
Customs Duty – levied on imported goods in terms of the Customs and Excise Act
[Chapter 23:02]
Value Added Tax (VAT) - levied on consumption of goods and services
Excise Duty - levied on specified locally manufactured goods
Income Tax - levied on income earned from trade
Pay As You Earn (PAYE)- levied on income earned from employment
Presumptive Taxes- it’s a concept of taxation according to which Income Tax is based
on average income instead of actual income
Mining Royalties - charged in terms of the Mines and Minerals Act (Chapter 21:05)
Capital Gains Tax (CGT) – levied on sale of immovable properties and marketable
securities
Surtax – levied on imported vehicles older than five years
2. Facilitate trade and travel. This is achieved by ensuring smooth movement of goods and
people through inland and border ports of entry/exit.
3. Advise Government on fiscal and economic matters. This includes revenue forecasting,
participation in national budget process and revision of Acts.
4. Protect civil society. ZIMRA’s operations also include curbing smuggling and any forms of
international trade crime as well as to enforce import, export and exchange controls. Most of
these controls are meant to protect the consumer against dangerous and harmful drugs,
hazardous substances, expired drugs, pornographic, objectionable or undesirable materials,
and harmful substances.
With the strategic values of integrity, transparency and fairness, ZIMRA is mandated to advise
government of Zimbabwe on all matters of tax policy relating to revenue collections as well as
issues related to tax administration.
In an effort to fulfil its mandate of mobilizing more resources for government development
programs, ZIMRA plays the crucial role of raising taxpayers’ awareness about their tax
obligations, thus raising their compliance. This is achieved through various initiatives including
among others, effective administration and enforcement of tax related laws.
6
However, for ZIMRA to engage in targeted interventions that can raise awareness and
increase tax compliance among taxpayers, it is important for the institution to understand
perceptions of taxpayers and the challenges they encounter in meeting their tax obligations,
hence the rationale for this study.
Objectives of the Study The main objective of the survey was to assess the taxpayers’ and public’s perception of the
level and quality of service delivery and whether their service expectations are being met by
ZIMRA.
Specifically, the survey aimed at:
i. Rating of ZIMRA on a given set of attributes, including
Level of client satisfaction with ZIMRA staff attitude
Service delivery
Speed of service
Perception towards corruption
Quality of service
Corporate Governance
Accessibility of ZIMRA information
Efficiency of ZIMRA online systems
Improvements that can be made
ii. Identifying areas affecting ZIMRA service delivery,
iii. Developing a composite measure of customer satisfaction (Customer Satisfaction Index)
and use it to determine the overall rating of the current level of satisfaction and image,
iv. Establishing the effectiveness of dispute resolution and the current mechanism of
addressing taxpayers’ complaints,
v. Proposing service improvement measures; prepare and deliver a comprehensive report
detailing the methodology, findings and recommendations for better and continuous
improvements. The survey also sought to find the effectiveness of the safety measures
employed by ZIMRA for its clients and staff with regards to the prevailing Coronavirus disease
pandemic.

7
CHAPTER TWO: LITERATURE REVIEW
Service Quality There are many definitions of service quality but the most commonly used delineates service
quality as the extent to which a service meets customers’ needs or expectations (Wisniewski
and Donnelly, 1996). In other words, service quality is the difference between the services
expected by customers and the perceived services. This implies that when customers’
expectations are greater than performance, perceived quality will be less than satisfactory
hence customer dissatisfaction (Parasuraman, Zeithaml, and Berry, 1985; Lewis and Mitchell,
1990). Service quality is considered as a key tool for a firm’s struggle to distinguish itself from
its competitors (Ladhari, 2008). Service quality offers a competitive advantage to
organizations that attempt to improve it and hence bring customer satisfaction.
Studies have showed that service quality is closely linked to customer satisfaction
(Sureschandar&Rajendran 2002). It is therefore vital for organizations to know how to
measure these constructs from the customers’’ perspective in order to better understand their
needs and hence satisfy them. In any organization, service quality is crucial because it leads
to higher customer satisfaction, profitability, reduced cost, customer loyalty and retention
(Chingang and Lukong, 2010).
While efforts have been made to measure service quality, there has been no general
consensus on the measurement of the concept. Nonetheless, most of the work to date has
attempted to use the SERVQUAL methodology proposed by Parasuraman, Zeithaml, and
Berry, (1985). Parasuraman, et al (1985) proposed that ten dimensions determine service
quality: reliability, responsiveness, competence, access, courtesy, communication, credibility,
security, understanding, knowing the customers, and tangibles. Thus, they proposed that the
difference between perceived performance and expected performance of these ten
dimensions determines overall perceived quality. As a result of empirical test, Parasuraman
et al (1988) modified the ten determinants of service quality and came up with five key
dimensions commonly used: tangibles, reliability, responsiveness, assurance, and empathy.
The five dimensions are defined as follows:
i. Tangibles: The appearance of physical facilities, personnel, tools or equipment, technology
used to provide the service and communication material.
ii. Reliability: Ability to perform the promised service dependably and accurately.
iii. Responsiveness: The willingness to help the customer and to provide prompt service,
iv. Assurance: Knowledge and courtesy of employees and their ability to convey trust and
confidence.
v. Empathy: Caring, individualized attention the institution provides to its customers.
In this study, the quality of service provided by ZIMRA is determined based on the level of
taxpayers’ satisfaction in terms of the five key dimensions (reliability, responsiveness,
empathy, assurance and tangibles) as well other specific services.

8
Relationship Between Service Quality and Client Satisfaction Parasuraman et al., (1985), contend that there is a positive correlation between service quality
and customer satisfaction. They argue that high perceived service quality leads to increase in
customer satisfaction. This is in consonant with Saravana& Rao, (2007) and Lee et al., (2000)
who acknowledge that customer satisfaction is based upon the level of service quality provided
by service provider.
Negi, (2009), affirms that the idea of associating service quality with customer satisfaction has
been in existence for a long time. In Ngezi’s study (2009) on the relevance of customer-
perceived service quality in determining customer overall satisfaction in the context of mobile
services, it was found out that reliability is a fundamental factor in assessing overall service
quality but also tangibles, empathy and assurance should not be ignored when evaluating
perceived service quality and customer satisfaction. Similarly, Fen &Lian, (2005) found that
service quality and customer satisfaction are interrelated and play an important role with
regard to the success and survival of any business in the competitive market.
In a study conducted by Su et al., (2002) to examine the link between service quality and
customer satisfaction, it was revealed that both constructs are interdependent in the sense
that an increase in one is likely to lead to an increase in another. However, service quality is
more abstract than customer satisfaction because, customer satisfaction reflects the
customer’s feelings about encounters and experiences with services provided by an
organization while service quality may be affected by perceptions of value (benefit relative to
cost) or by the experiences of other customers that may not be necessarily good.
Furthermore, a study conducted by Magi and Julander (2009), on perceived service quality
and customer satisfaction in a store performance framework equally revealed a positive
relationship between perceived service quality and customer satisfaction. It was found that
customer satisfaction derives from high perceived service quality and this makes the customer
loyal. However, it should be noted that a satisfied customer may not necessarily be loyal.
Quality Taxpayer Services In order for any tax administration to adhere to the principles of taxation, it is imperative to
have quality taxpayer service. Taxpayer service denotes services and information, which the
revenue collection organization provides to taxpayers so as to fulfil their tax obligations. An
organization is supposed to provide taxpayers with clear guidelines on the services it offers.
The services offered should not only address the expressed needs of the taxpayers but also
include assistance in areas in which the taxpayers might be aware that compliance could be
facilitated through taxpayer service and information (Grampert 2001).
A quality taxpayer service program is meant to ensure that there is timely handling of taxpayer
complaints and the tax officials have empathy and are competent. The tax office has to be
located in a convenience area where it is easily accessible and the tax officials have to
effectively communicate to the taxpayers and endeavour to cater for special needs of the
taxpayers. The physical appearance of equipment, facilities and layout should facilitate
taxpayers' services (Aslund 2002). Also, a well-implemented taxpayer services will result in
an informed taxpayerwho is able to register voluntarily, fill their returns in time and honour tax
obligations (Jenkins and Khadka, 2000).

9
According to Beck and Jung (1989), perceived fairness of the tax system and the decision
maker context are detrimental to taxpayer compliance. This implies that the seriousness with
which the government enforces the revenue laws will have profound effect on public attitudes.
MaClure (1982) stresses that the deterioration of the perception of fairness causes concern in
a tax system based on voluntary compliance.
Snavely (1988) argues that in order to increase the level of compliance, there is need to
establish a high level of risk strategy. Empirical evidence support the efficiency of compliance
strategies built upon risk. Mason and Calvin (1984) concluded from surveys of Oregon
taxpayers that fears of discovery had a powerful effect even among citizens most prone to
underreporting income or claiming false deduction. Witte and Woodbury (1985) conducted a
study on federal income and tax returns and considered that fear of discovery-discouraged
evasion. The risk model assumes that odds of being discovered cheating must be made so
high that only a few people can take the chances and that penalties to be paid for evasion
must be set high enough to outweigh any possible benefits.
Tanzi et al (1995) argue that for taxpayers to assess their own tax liability, there should be
clear taxpayer’s service guidelines so that they understand their tax obligations and
entitlements. Taxpayer services are aimed at raising tax awareness and enhance the level of
taxpayer compliance (Jenkins et al, 2000). Zimbabwe Revenue Authority observes this
principle in that it established a service charter that describes the service standard a taxpayer
expects from the organization. The charter allows for an open and transparent approach that
all parties understand and can work within. It is therefore an important mechanism for
taxpayers because it documents the help and support they are entitled to receive from
Zimbabwe Revenue Authority. Also, it is a tool for Zimbabwe Revenue Authority staff to
continuously improve service delivery to the general public and stakeholders. Within this
framework, the organization seeks to improve its customer relations culture measuring and
benchmarking its performance.
10
CHAPTER THREE: RESEARCH METHODOLOGY The following aspects describe the methodological approach that was used to perform the
client satisfaction survey.
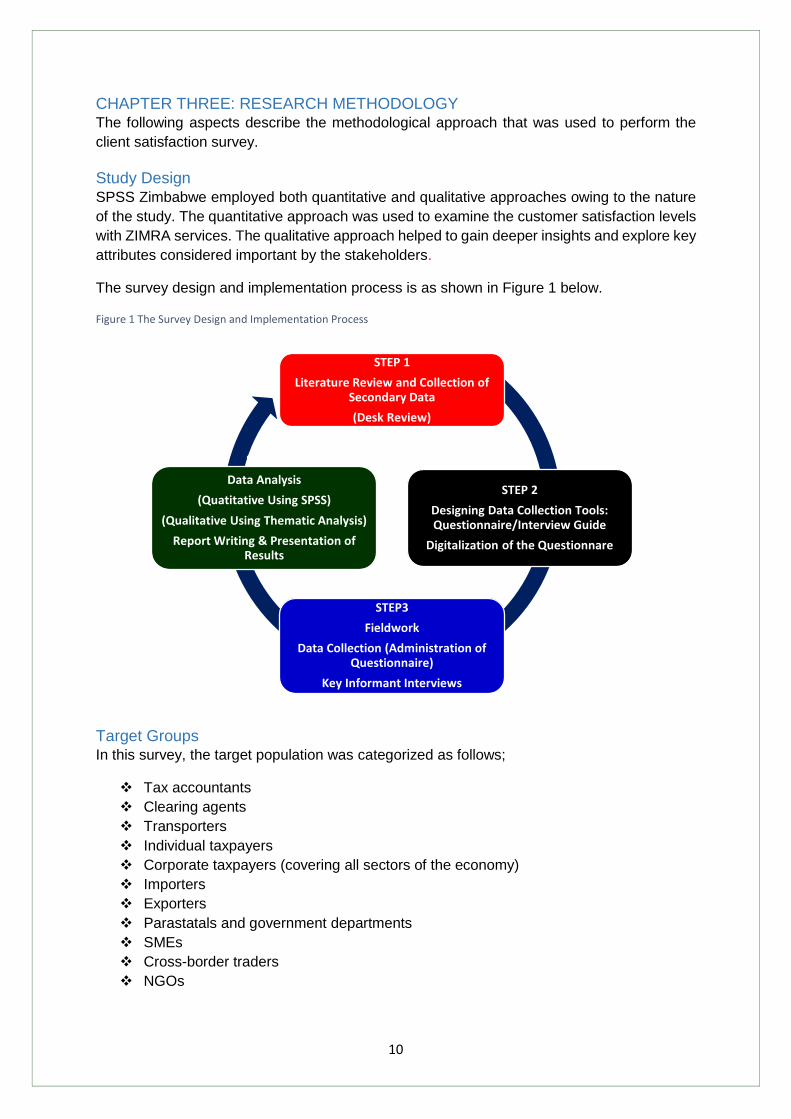
Study Design SPSS Zimbabwe employed both quantitative and qualitative approaches owing to the nature
of the study. The quantitative approach was used to examine the customer satisfaction levels
with ZIMRA services. The qualitative approach helped to gain deeper insights and explore key
attributes considered important by the stakeholders.
The survey design and implementation process is as shown in Figure 1 below.
Figure 1 The Survey Design and Implementation Process
Target Groups In this survey, the target population was categorized as follows;
Tax accountants
Clearing agents
Transporters
Individual taxpayers
Corporate taxpayers (covering all sectors of the economy)
Importers
Exporters
Parastatals and government departments
SMEs
Cross-border traders
NGOs
STEP 1
Literature Review and Collection of Secondary Data
(Desk Review)
STEP 2
Designing Data Collection Tools: Questionnaire/Interview Guide
Digitalization of the Questionnare
STEP3
Fieldwork
Data Collection (Administration of Questionnaire)
Key Informant Interviews
STEP 4
Data Analysis
(Quatitative Using SPSS)
(Qualitative Using Thematic Analysis)
Report Writing & Presentation of Results

11
Sampling Techniques and Sample Size
Sampling Technique Given the nature of data required to inform ZIMRA about customer perceptions regarding tax
related services, both probability and non-probability sampling techniques were employed in
selecting the respondents. Specifically, stratified random sampling (probability) and snowball
sampling (non-probability) were used.
The advantages of using stratified random sampling include minimizing sample selection bias
and ensuring certain segments of the population are not overrepresented or
underrepresented. Stratified random sampling involves first dividing a population into
subpopulations and then applying random sampling methods to each subpopulation to form a
test group. In this case every ZIMRA client was assigned to one of the 11 subpopulations: Tax
accountants, Clearing Agents, Transporters, Individual taxpayers, corporate taxpayers
(covering all sectors of the economy), Importers, Exporters, Parastatals and Government
departments, NGOs and SMEs.
Random sampling was then done for each subpopulation based on its representation within
the population as a whole. Thus stratified sampling ensures each subgroup within the
population receives proper representation within the sample.
The Survey Population and Sample Size The sample size for all categories of taxpayers was determined by using the Yamane formula
at 95% confidence interval or 5% margin of error. The formula is given below.
Where; n = the sample size, N = the survey population size e = the level of precision or
confidence level. Using this formula, the sample size approaches 400 as the population
approaches infinity. However, SPSS Zimbabwe proposed a sample size of 2000 for this study
owing to the heterogeneity of ZIMRA’s clients.

12
Distribution of Respondents to the Questionnaire
Table 1 Distribution of Respondents to the Questionnaire
Frequency Cumulative Percent
Category Clearing Agent 149 8.2
Corporate 241 21.4
Cross-border 39 23.6
Education 16 24.4
Exporter 14 25.2
Government Dep 48 27.8
Importer 80 32.2
Individual 659 68.4
NGO 48 71.1
SME 305 87.8
Tax Accountant 89 92.7
Transporter 133 100.0
Total 1821
Total Sample Size Table 2 Total Sample Size
No Tool Number of Participants
1 Respondents to the questionnaire 1821
2 Participants in in-depth interviews 32
Total 1853
Data Collection Approach The Covid-19 crisis is affecting the way people work and also the way researchers go about
conducting research. Much qualitative research typically relies on face-to-face interaction for
data collection through interviews, focus groups and field work. But the first thing to bear in
mind is that the health and wellbeing of participants and researchers is of paramount
importance and therefore data collection was executed in strict observance of the current
lockdown rules. The following approaches were used to carry out data collection for the
survey.
Primary Data The primary data was collected through in-depth interview and questionnaires. The
questionnaires were generated in three major languages spoken in Zimbabwe namely,
English, Shona and Ndebele. In-depth interviews were conducted through telephone and also
online by asking respondents to type their responses to open-ended questions. Quantitative
data collection was conducted using both online and mobile data collection tools. More

13
emphasis was on online data collection in order to minimize face-to-face interaction. However,
face to face interviews were conducted at the countries major border stations.
Quality Control Protocols In order to ensure quality of the data, a team of very experienced enumerators was recruited
and trained in all aspects of possible field scenarios in order to ensure standardization in
administering the survey tools.
Interviewers could also be monitored through live GPS feed to ensure that interviews were
being conducted at designated stations. Below are screenshots taken during data collection
period.
Figure 2 GPS Location of Interviewer at Plumtree Border Post
The picture above is a satellite image of the movements by one of the interviewers at Plumtree
border post and the picture below is for one of the interviewers at Victoria Falls.
Figure 3 GPS Location of Interviewer at Victoria Falls

14
CHAPTER FOUR: DATA ANALYSIS AND RESEARCH FINDINGS
Data Cleaning, Tabulation and Analysis SPSS Zimbabwe used SurveyToGo and SurveyMonkey to collect data in this study. These
technologies allow for real time upload of collected data. As a result, data cleaning was
performed from the commencement of data collection up to the last interview.
Qualitative data collected using in-depth interviews was analysed using thematic analysis
whereas quantitative data was analysed using the Statistical Package for Social Science
(SPSS) software. The quantitative approach to data analysis in this study was wholly
descriptive.
Disaggregation of Respondents by Gender and Age Range In this survey, the majority (72%) of respondents were males while 28% were females. In
terms of age category, the majority (53%) of the respondents were between 35-44 years while
a paltry 3% of respondents were above the age of 65. Figure 4 below shows the distribution
of respondents by gender and age category.
Figure 4 Distribution of Respondents by Gender and Age
Disaggregation of Respondents by Level of Education
Figure 5 Distribution of Respondents by Level of Education
The pie chart shows that the majority
of participants have attained at least
secondary education. Thus, at this
literacy rate, the questionnaire was
well understood by virtually all
participants.
28%
72%
0%
10%
20%
30%
40%
50%
60%
70%
80%
Female Male
Gender
10%
53%
16%
17%
3%
Age Range
25-34 35-44 45-54 55-64 65+
Degree, 23.50%
Diploma, 28.30%
Other, 4.40%
Postgraduate, 16%
Primary, 3.20%
Secondary, 22.90%

15
Disaggregation of Respondents by Category of Business
Figure 6 Distribution of Respondents by Category of Business
Distribution of Corporate Taxpayers by Sector
Figure 7 Distribution of Corporate Taxpayers by Sector
Clearing Agent, 8.20%
Corporate, 13.20%
Cross-border, 2.10%
Education, 0.90%
Exporter, 0.80%
Government Dep, 2.60%
Importer, 4.40%Individual, 36.20%
NGO, 2.60%
SME, 16.70%
Tax Accountant, 4.90%
Transporter, 7.30%
2.10%3.30%
10.80%1.70%
0.80%7.10%
2.10%3.30%
0.40%2.90%
0.80%3.30%
20.30%6.20%
3.30%3.30%
2.50%3.70%
0.80%9.60%
11.60%
0% 5% 10% 15% 20% 25%
Accommodation and Food ServicesAdmin and Support Services
Agriculture, Forestry and FishingArts, Entertainment and Recreation
Clearing AgentConstruction
EducationFinancial and Insurance
Government DepartmentHuman health and Social work
ImporterInformation and Communication
ManufacturingMining and quarrying
Professional, Scientific and TechReal Estate Activities
SMETransportation and Storage
Water, Sewerage, Waste, RemediatioOther
Wholesale and Retail Trade

16
Length of Contact with ZIMRA It is generally accepted that the more a client interacts with a business or an organization the more confident we are with his/her perceptions with that particular business. Clients were asked about their length of contact with ZIMRA and their responses were distributed as shown in the pie chart below. From Figure 8 below, it can be seen that 63% of the participants have been in interaction with ZIMRA for more than 5 years and only a paltry 10% have been in contact with ZIMRA for less than 1 year.
Figure 8 Respondent Length of Contact with ZIMRA
Taxpayer Awareness of ZIMRA Service Charter ZIMRA’s Service Charter is a written policy that defines what the Authority commits in terms
of service to its internal and external clients. Respondents were asked questions on the
awareness of existence of ZIMRA’s customer service charter. Figure 9 below shows the
distribution of the responses on awareness the service charter and the source of awareness.
Figure 9 Taxpayer Awareness and Source of Awareness of ZIMRA Service Charter
Above 5 years, 63%
Between 1 and 2 years, 7%
Between 2 and 3 years, 3%
Between 3 and 5 years, 16%
Less than 1 year, 10%
No, 45.40%
Yes, 54.60%
12.50%
4.60%
5.30%
30.70%
18.90%
5.80%
11.20%
10.90%
0% 5% 10% 15% 20% 25% 30% 35%
Newspaper
Radio
TV
ZIMRA Website
Posters withing ZIMRA…
Exhibitions and promotions…
Exhibitions and promotions…
Events held by ZIMRA e.g.…

17
Clients learn about products and services from different sources. Therefore, it is imperative
for organizations to evaluate which sources are effective for their customers. Thus it is against
this background that the study also sought to establish the sources awareness of ZIMRA’s
Service Charter to its clients.
Figure 9 above shows that the majority of those participants who were aware of the Service
Charter got to know it through ZIMRA’s website and posters within ZIMRA’s offices.
Effectiveness of ZIMRA Service Charter Figure 10 Effectiveness of ZIMRA Service Charter
On the aspect of the effectiveness of
ZIMRA’s Service Charter, roughly 36% of
the taxpayers believe that it is effective
while less than 20% of the respondents
believe that it is infective.
.
ZIMRA Service Delivery Respondents were asked a dichotomous question on whether ZIMRA’s service delivery was
improving or not.
Figure 11 Service Delivery Performance
As depicted in Figure 11, the majority (56.2%) of the participants believe that the Authority is improving on service delivery. This is shows that the taxpayers appreciate the efforts being undertaken by ZIMRA in its bid to live up to its mandate.
Taxpayer Awareness of ZIMRA website In this era and age, a website is an integral component of any business entity. A website
should be well designed, easy to use and also easy to find and most importantly should
contained all the relevant information for its customers. Respondents were asked about their
knowledge of the existence of the ZIMRA website. They were also asked about their frequency
of visit to the website and the ease of navigation on the website. The figure below shows the
distribution of the responses on awareness.
7.20%9.80%
46.70%
24.50%
11.70%
0%5%
10%15%20%25%30%35%40%45%50%
No, 43.80%
Yes, 56.20%

18
Figure 12 Taxpayer Awareness of ZIMRA Website
The majority of the respondents were not aware of the existence of the website. This can be attributed to the fact that some of the clients are individual taxpayers who are not involved in filing of taxes.
Frequency of Customer Website Visit
Figure 13 Frequency of Visit
The pie chart shows that most of the clients (60.6%)only visit the website as and when the need arises. Only 7% of the clients interact with the website on a daily basis.
Ease of Use and Access to Information Ease of use and access to information are some of the qualities of a good website.
Respondents were asked about their experiences with the website. The figure below shows
the distribution of the responses.
48%
52%
46%
47%
48%
49%
50%
51%
52%
53%
Yes No
Daily, 7.00%
Monthly, 16.40%
On a need basis,
60.60%
Weekly, 16.00%

19
Figure 14 Ease of Use and Access to Information
Ease of use
Ease of access to information on website
The majority (82%) of visitors to the website indicated that the website is easy to use while 18
percent of the users find the website to be difficult to use. On the aspect of ease of access to
information, 61% of the visitors to the website find it easy to access information on the website.
Uses of ZIMRA Website A multiple response question was asked on the uses of the website. The question attracted a
total of 2094 responses which are depicted in the table below. The majority of respondents
indicated that they used the website for seeking information, downloading forms, checking
updates and filing returns.
Table 3 Uses of ZIMRA Website
Responses Percent of
Cases N Percent
Website Uses Filing Returns 391 18.7% 39.7%
Seek information 639 30.5% 64.9%
Download forms 548 26.2% 55.7%
Checking updates 516 24.6% 52.4%
Total 2094 100.0% 212.8%
a. Dichotomy group tabulated at value 1.
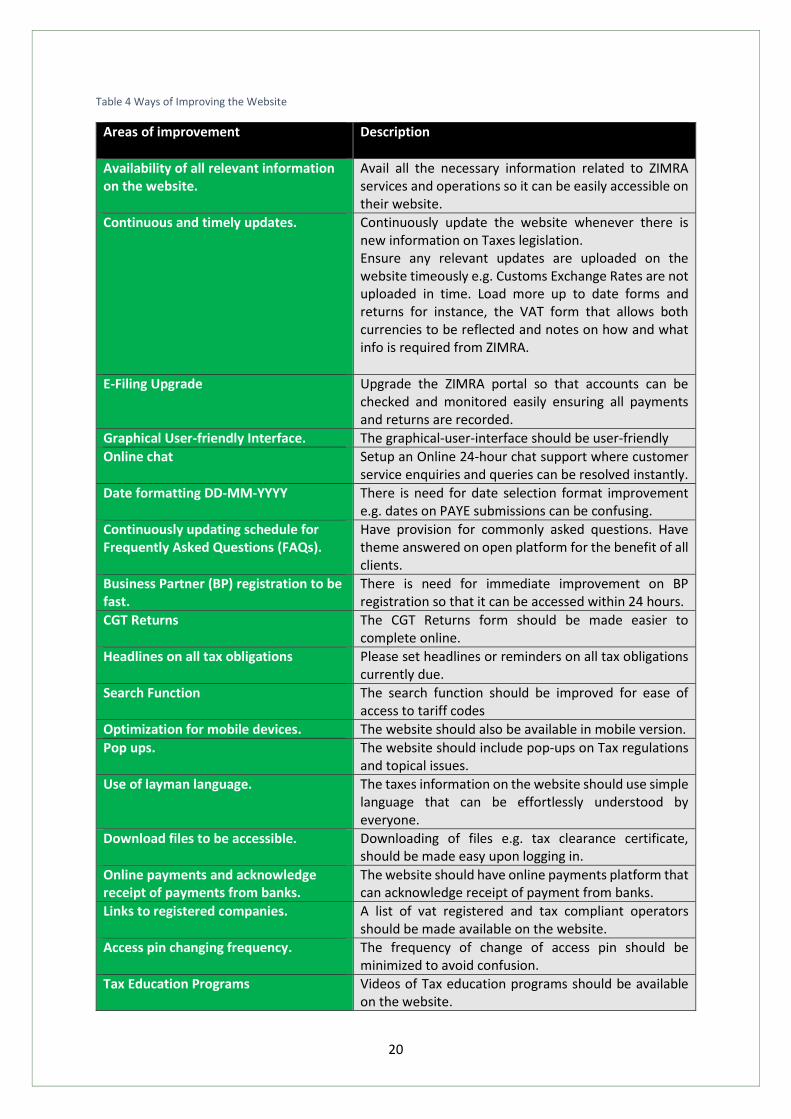
Ways of improving the website It is of paramount importance for a website to have all the necessary features desired by its
users. Users were prompted to suggest ways they feel could improve the ZIMRA website. The
question attracted a lot of responses which were thematically grouped and tabulated as shown
in Table 4 below.
18%
82%
No Yes
38.60%
61.40%
No Yes
20
Table 4 Ways of Improving the Website
Areas of improvement
Description
Availability of all relevant information on the website.
Avail all the necessary information related to ZIMRA services and operations so it can be easily accessible on their website.
Continuous and timely updates. Continuously update the website whenever there is new information on Taxes legislation. Ensure any relevant updates are uploaded on the website timeously e.g. Customs Exchange Rates are not uploaded in time. Load more up to date forms and returns for instance, the VAT form that allows both currencies to be reflected and notes on how and what info is required from ZIMRA.
E-Filing Upgrade Upgrade the ZIMRA portal so that accounts can be checked and monitored easily ensuring all payments and returns are recorded.
Graphical User-friendly Interface. The graphical-user-interface should be user-friendly
Online chat Setup an Online 24-hour chat support where customer service enquiries and queries can be resolved instantly.
Date formatting DD-MM-YYYY There is need for date selection format improvement e.g. dates on PAYE submissions can be confusing.
Continuously updating schedule for Frequently Asked Questions (FAQs).
Have provision for commonly asked questions. Have theme answered on open platform for the benefit of all clients.
Business Partner (BP) registration to be fast.
There is need for immediate improvement on BP registration so that it can be accessed within 24 hours.
CGT Returns The CGT Returns form should be made easier to complete online.
Headlines on all tax obligations Please set headlines or reminders on all tax obligations currently due.
Search Function The search function should be improved for ease of access to tariff codes
Optimization for mobile devices. The website should also be available in mobile version.
Pop ups. The website should include pop-ups on Tax regulations and topical issues.
Use of layman language. The taxes information on the website should use simple language that can be effortlessly understood by everyone.
Download files to be accessible. Downloading of files e.g. tax clearance certificate, should be made easy upon logging in.
Online payments and acknowledge receipt of payments from banks.
The website should have online payments platform that can acknowledge receipt of payment from banks.
Links to registered companies. A list of vat registered and tax compliant operators should be made available on the website.
Access pin changing frequency. The frequency of change of access pin should be minimized to avoid confusion.
Tax Education Programs Videos of Tax education programs should be available on the website.
21
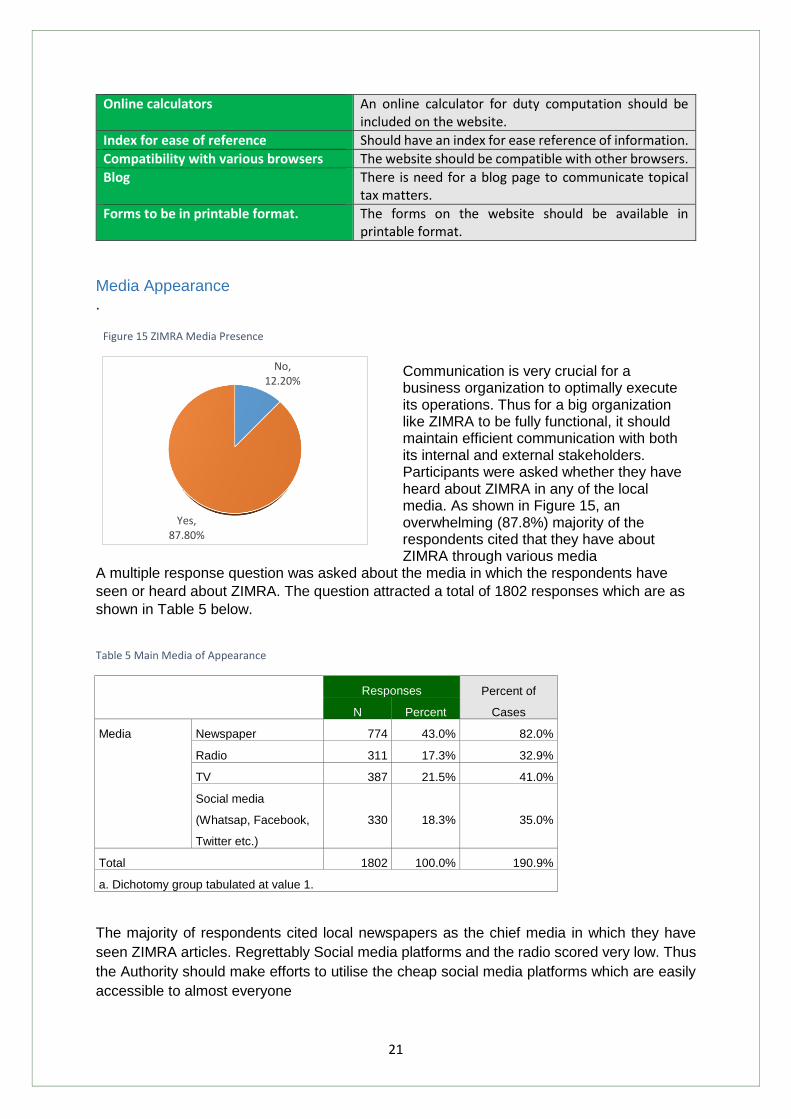
Online calculators An online calculator for duty computation should be included on the website.
Index for ease of reference Should have an index for ease reference of information.
Compatibility with various browsers The website should be compatible with other browsers.
Blog There is need for a blog page to communicate topical tax matters.
Forms to be in printable format. The forms on the website should be available in printable format.
Media Appearance .
Figure 15 ZIMRA Media Presence
Communication is very crucial for a business organization to optimally execute its operations. Thus for a big organization like ZIMRA to be fully functional, it should maintain efficient communication with both its internal and external stakeholders. Participants were asked whether they have heard about ZIMRA in any of the local media. As shown in Figure 15, an overwhelming (87.8%) majority of the respondents cited that they have about ZIMRA through various media
A multiple response question was asked about the media in which the respondents have
seen or heard about ZIMRA. The question attracted a total of 1802 responses which are as
shown in Table 5 below.
Table 5 Main Media of Appearance
Responses Percent of
Cases N Percent
Media Newspaper 774 43.0% 82.0%
Radio 311 17.3% 32.9%
TV 387 21.5% 41.0%
Social media
(Whatsap, Facebook,
Twitter etc.)
330 18.3% 35.0%
Total 1802 100.0% 190.9%
a. Dichotomy group tabulated at value 1.
The majority of respondents cited local newspapers as the chief media in which they have
seen ZIMRA articles. Regrettably Social media platforms and the radio scored very low. Thus
the Authority should make efforts to utilise the cheap social media platforms which are easily
accessible to almost everyone
No, 12.20%
Yes, 87.80%

22
Preferred channel of communication Respondents were asked about their preferred channel of communication from ZIMRA and
an overwhelming majority cited the email as their most preferred channel of communication
followed by ZIMRA Facebook page. A good number of respondents also cited SMS and TV
as their preferred channel of communication. The results are shown in Figure 16 below.
Figure 16 Preferred Channel of Communication
Respondents were also asked about their impression of ZIMRA’s communication system.
Five statements were given and participants were asked to select only one which they felt
best described ZIMRA’s communication system with its clients. The results in Figure 17
below show that most of the respondents (26.3%) firmly believe that ZIMRA keeps
customers fairly well informed. Sadly, 22% of the respondents believe that ZIMRA gives its
customers only a limited amount of information. Therefore, there is need for the Authority to
improve on its ways of communicating with the public so that taxpayers are always up to
date with any new developments.
Figure 17 Taxpayers’ Impression of ZIMRA's Communication System
Level of Satisfaction with ZIMRA Online/Mobile platforms In its bid to enhance customer service delivery and boost revenue collection, ZIMRA has
introduced mobile payment platforms, mobile tracking systems and the E-services platform for
easy of filing tax returns. This study also sought to find the customers’ level of satisfaction with
26.40%
9.10%5.80%
13.80%
2.60%
13.30%15.40%
4.90%
8.70%
0%
5%
10%
15%
20%
25%
30%
14.50%
26.30%
22.90%
21.90%
14.40%
0.00% 5.00% 10.00% 15.00% 20.00% 25.00% 30.00%
ZIMRA keeps customers fully informed
ZIMRA keeps customers fairly well informed
ZIMRA keeps customers adequately informed
ZIMRA gives customers only a limited amount ofinformation
ZIMRA doesn't tell customers much at all about whatis happening
23
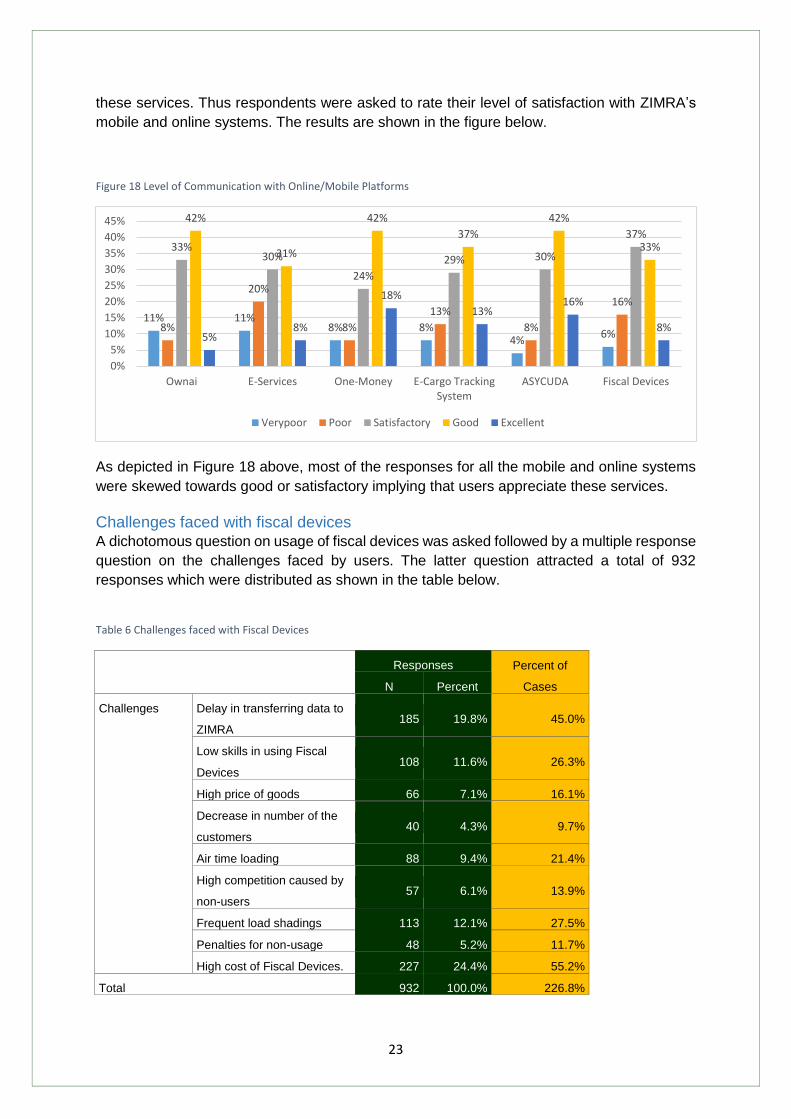
these services. Thus respondents were asked to rate their level of satisfaction with ZIMRA’s
mobile and online systems. The results are shown in the figure below.
Figure 18 Level of Communication with Online/Mobile Platforms
As depicted in Figure 18 above, most of the responses for all the mobile and online systems
were skewed towards good or satisfactory implying that users appreciate these services.
Challenges faced with fiscal devices A dichotomous question on usage of fiscal devices was asked followed by a multiple response
question on the challenges faced by users. The latter question attracted a total of 932
responses which were distributed as shown in the table below.
Table 6 Challenges faced with Fiscal Devices
Responses Percent of
Cases N Percent
Challenges Delay in transferring data to
ZIMRA 185 19.8% 45.0%
Low skills in using Fiscal
Devices 108 11.6% 26.3%
High price of goods 66 7.1% 16.1%
Decrease in number of the
customers 40 4.3% 9.7%
Air time loading 88 9.4% 21.4%
High competition caused by
non-users 57 6.1% 13.9%
Frequent load shadings 113 12.1% 27.5%
Penalties for non-usage 48 5.2% 11.7%
High cost of Fiscal Devices. 227 24.4% 55.2%
Total 932 100.0% 226.8%
11% 11%8% 8%
4%6%
8%
20%
8%
13%
8%
16%
33%30%
24%
29% 30%
37%
42%
31%
42%
37%
42%
33%
5%8%
18%
13%16%
8%
0%
5%
10%
15%
20%
25%
30%
35%
40%
45%
Ownai E-Services One-Money E-Cargo TrackingSystem
ASYCUDA Fiscal Devices
Verypoor Poor Satisfactory Good Excellent

24
The majority of users cited high cost of fiscal devices and delay in data transmission to ZIMRA
as major challenges they face with the use of Fiscal Devices. A paltry 9.7% of the users cited
decrease in the number of customers as a problem being faced by users.
Problems resolution/Complaint handling Participants were asked about the problems they encounter when dealing with ZIMRA. They
were also asked about whether they have reported and if so through which channels have
they used to report their problems. The figure below shows the most frequent problems
encountered by clients when interacting with ZIMRA. The issue of obtaining a Tax Clearance
was the most topical followed by length of time taken for one to be served. Respondents have
cited that a Tax Clearance Certificate is an integral part of a business entity without which one
is not able to operate. Taxpayers complained that obtaining a Tax Clearance is one of the
major challenges they face with ZIMRA. System congestion is also one of the major
challenges faced by clients especially during deadlines.
Figure 19 Nature of Complaints
Reasons for not reporting Respondents were asked a dichotomous question on whether one reported the problem or
not. Those respondents who did not report their problems to the Authority were then prompted
to give reasons on their failing to report. The bar chart below shows the three major deterrents
to complaints registration.
16.30%
31.10%
12.80%
12.50%
21.30%
2.10%
1.10%
0% 5% 10% 15% 20% 25% 30% 35%
Congestion during the deadline
Delaying in getting tax clearance
Lack of immediate collaboration among ZIMRA staff
The website was down
Took too long to serve
Wrong computation of income tax
Wrong computation of PAYE

25
Figure 20 Reasons for Failure to Report
The majority (52.3%) of participants cited that ZIMRA officials take too long to respond to
queries followed by those who cited that they did not know the procedures to follow.
Channel used and speed of complaint resolution The study also sought to find out the channels that are mostly used by taxpayers when
reporting their complaints. One of the key determinants of client satisfaction in a service driven
organization is the speed of complaints resolution. An organization that promptly responds to
customer queries enhances its customer satisfaction levels. Respondents were asked about
the length of time it took for their query to be resolved.
A cross-tabulation of the channel used and the speed of query resolution was performed and
the results are as shown in the table below.
Table 7 Speed of Complaint Resolution
How fast was your complaint / problem solved?
In less than 24 hours Over 3 weeks Within 2 weeks Within 3 weeks within a week
Email 10.5% 45.5% 10.0% 12.0% 22.0%
Telephone 25.5% 27.4% 11.3% 7.5% 28.3%
Visited their offices 16.8% 43.7% 10.1% 5.9% 23.5%
The results show that the majority (45.5%) of taxpayers who reported their problems through
emails went for over 3 weeks without getting a solution from ZIMRA. For those who
physically visited the ZIMRA offices they complained of being posted from one office to
another and as a result they also went for over three weeks without getting a solution to their
problems. Thus the Authority needs to work on improving the speed on resolution of
customer queries.
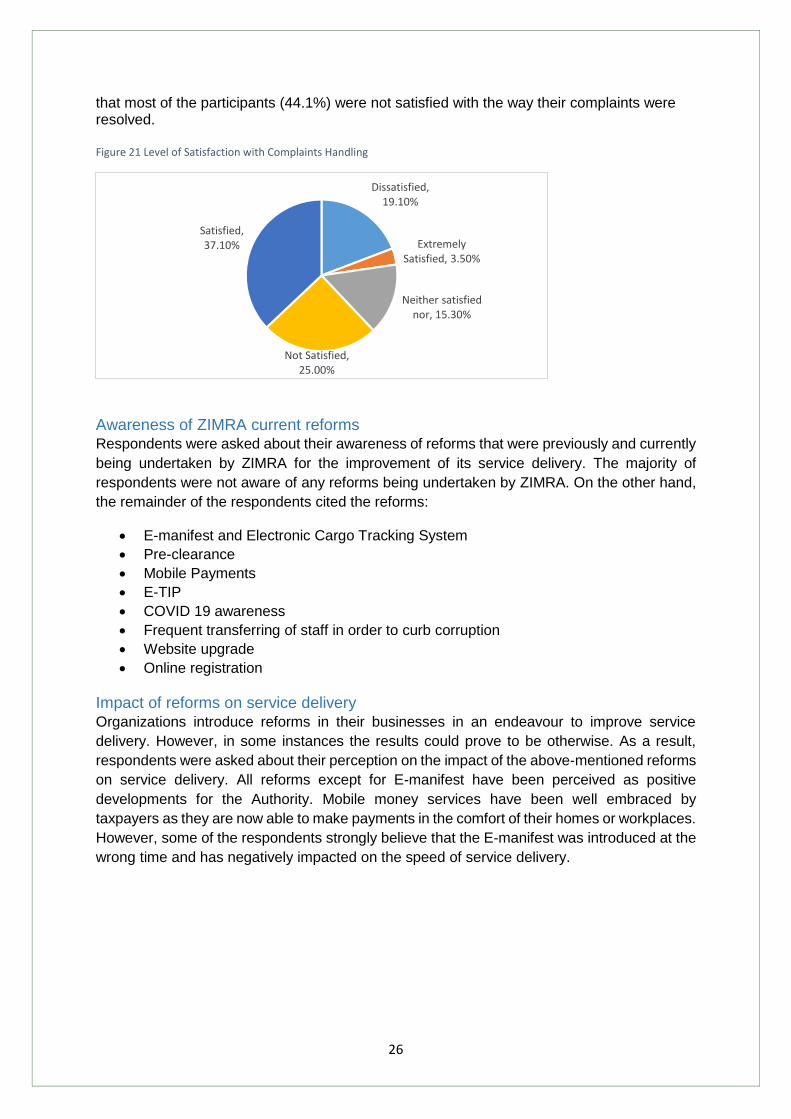
Level of satisfaction with complaints handling Finally, respondents were asked to rate their level of satisfaction with the way their complaint was handled. The results are as shown in the pie chart in Figure 21 below. The results show
33.60%
14.10%
52.30%
0%
10%
20%
30%
40%
50%
60%
I didn't know who to report to/I don't know the procedure
Lack of time They take too long to answer your
query
26
that most of the participants (44.1%) were not satisfied with the way their complaints were resolved. Figure 21 Level of Satisfaction with Complaints Handling
Awareness of ZIMRA current reforms Respondents were asked about their awareness of reforms that were previously and currently
being undertaken by ZIMRA for the improvement of its service delivery. The majority of
respondents were not aware of any reforms being undertaken by ZIMRA. On the other hand,
the remainder of the respondents cited the reforms:
E-manifest and Electronic Cargo Tracking System
Pre-clearance
Mobile Payments
E-TIP
COVID 19 awareness
Frequent transferring of staff in order to curb corruption
Website upgrade
Online registration
Impact of reforms on service delivery Organizations introduce reforms in their businesses in an endeavour to improve service
delivery. However, in some instances the results could prove to be otherwise. As a result,
respondents were asked about their perception on the impact of the above-mentioned reforms
on service delivery. All reforms except for E-manifest have been perceived as positive
developments for the Authority. Mobile money services have been well embraced by
taxpayers as they are now able to make payments in the comfort of their homes or workplaces.
However, some of the respondents strongly believe that the E-manifest was introduced at the
wrong time and has negatively impacted on the speed of service delivery.
Dissatisfied, 19.10%
Extremely Satisfied, 3.50%
Neither satisfied nor, 15.30%
Not Satisfied, 25.00%
Satisfied, 37.10%

27
Customer satisfaction levels with ZIMRA staff Taxpayers were asked to rate their satisfaction levels on a set of attributes pertaining to
ZIMRA’s services. The table below shows the results
Table 8 Level of Satisfaction with ZIMRA Staff
Service Attribute Overall Score
Accurate collection of taxes 68% Payment of taxes 70% Process of registration 65%
Process of filing returns 66%
The confidentiality given to customers while handling sensitive matters 74%
Frequency of communication 64%
Staff being accessible through emails and phones 61%
Decentralization of operations to the district level 69%
Taxpayer education programs 61%
Timeliness in delivery of services 59%
Staff ability to answer customer queries and questions 62%
The responses were categorized from Strongly disagree having a score of 1 to Strongly agree
having a score of 5. The average rating for each statement was computed and subsequently
converted into a percentage score. The results in the table above shows that the Authority
should work on improving service delivery through, timely delivery of services, staff
accessibility through phones and email and speedy resolution of client queries. The processes
of registration need to be enhanced and also taxpayer education programs should be carried
out regularly throughout the country. There is need for decentralization of ZIMRA operations
to district level for ease of access to services and thereby boosting compliance.
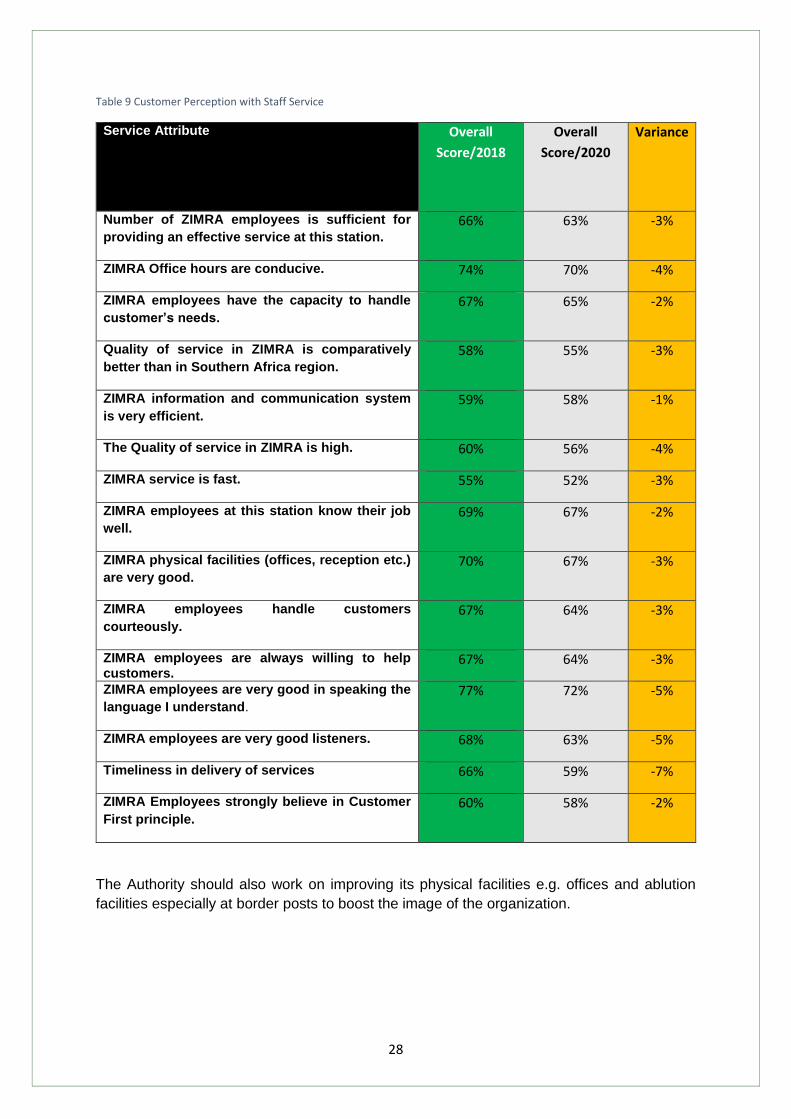
Customer perception levels on staff service to customers Respondents were asked to rate their levels on ZIMRA employee commitment. The questions
were positively worded and based on a 5-point Likert Scale. An average score for each
question was computed as a percentage. Thus the higher the percentage score the higher the
level of satisfaction with that service attribute. Table 9 below shows the results. As shown in
the table, the computed results were juxtaposed with results from the previous study.
Generally, there is a slight decline in almost all the service attributes listed in the table above
except for timeliness in service delivery which showed a notable decline. This slight decline is
attributable to the fact that ZIMRA is fighting to adjust to the new working environment that
has been caused by the COVID-19 pandemic.
The results from the table above also show that ZIMRA should work on improving service
delivery through improved communication systems and customer care training workshops.
28
Table 9 Customer Perception with Staff Service
Service Attribute Overall
Score/2018
Overall
Score/2020
Variance
Number of ZIMRA employees is sufficient for
providing an effective service at this station.
66% 63% -3%
ZIMRA Office hours are conducive. 74% 70% -4%
ZIMRA employees have the capacity to handle
customer’s needs.
67% 65% -2%
Quality of service in ZIMRA is comparatively
better than in Southern Africa region.
58% 55% -3%
ZIMRA information and communication system
is very efficient.
59% 58% -1%
The Quality of service in ZIMRA is high. 60% 56% -4%
ZIMRA service is fast. 55% 52% -3%
ZIMRA employees at this station know their job
well.
69% 67% -2%
ZIMRA physical facilities (offices, reception etc.)
are very good.
70% 67% -3%
ZIMRA employees handle customers
courteously.
67% 64% -3%
ZIMRA employees are always willing to help customers.
67% 64% -3%
ZIMRA employees are very good in speaking the
language I understand.
77% 72% -5%
ZIMRA employees are very good listeners. 68% 63% -5%
Timeliness in delivery of services 66% 59% -7%
ZIMRA Employees strongly believe in Customer
First principle.
60% 58% -2%
The Authority should also work on improving its physical facilities e.g. offices and ablution
facilities especially at border posts to boost the image of the organization.
29
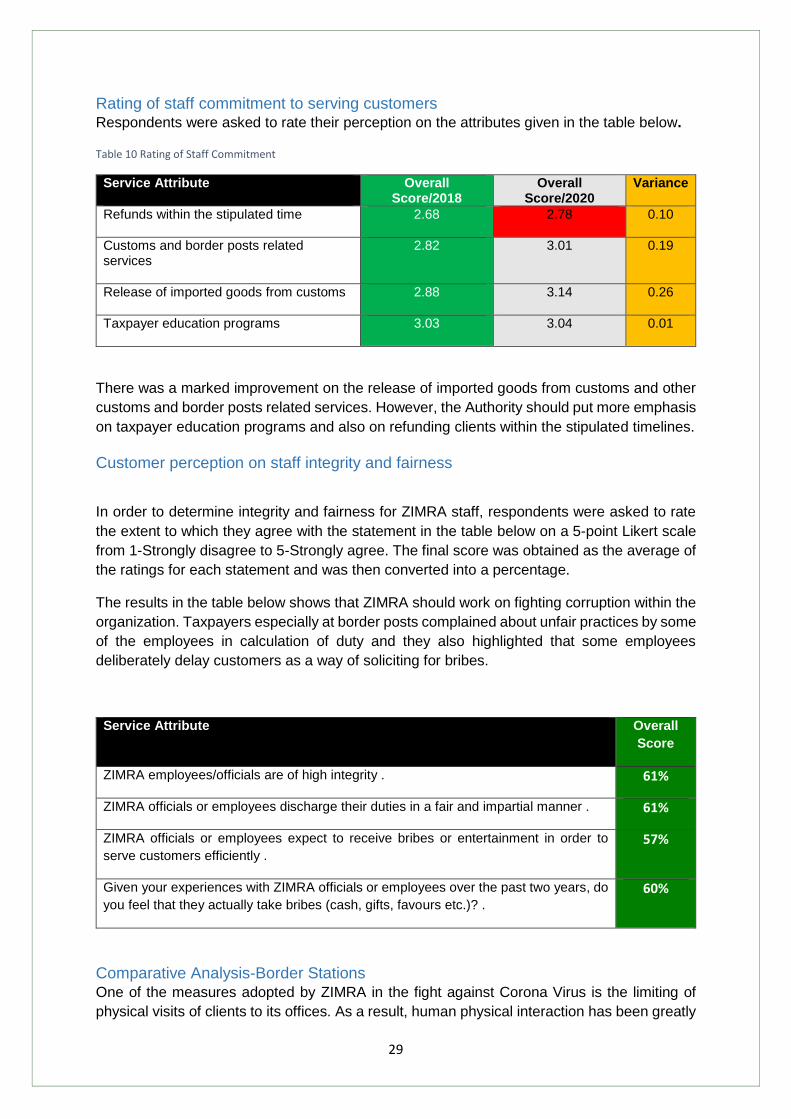
Rating of staff commitment to serving customers Respondents were asked to rate their perception on the attributes given in the table below.
Table 10 Rating of Staff Commitment
Service Attribute
Overall Score/2018
Overall Score/2020
Variance
Refunds within the stipulated time
2.68 2.78 0.10
Customs and border posts related services
2.82 3.01 0.19
Release of imported goods from customs
2.88 3.14 0.26
Taxpayer education programs
3.03 3.04 0.01
There was a marked improvement on the release of imported goods from customs and other
customs and border posts related services. However, the Authority should put more emphasis
on taxpayer education programs and also on refunding clients within the stipulated timelines.
Customer perception on staff integrity and fairness
In order to determine integrity and fairness for ZIMRA staff, respondents were asked to rate
the extent to which they agree with the statement in the table below on a 5-point Likert scale
from 1-Strongly disagree to 5-Strongly agree. The final score was obtained as the average of
the ratings for each statement and was then converted into a percentage.
The results in the table below shows that ZIMRA should work on fighting corruption within the
organization. Taxpayers especially at border posts complained about unfair practices by some
of the employees in calculation of duty and they also highlighted that some employees
deliberately delay customers as a way of soliciting for bribes.
Service Attribute Overall
Score
ZIMRA employees/officials are of high integrity . 61%
ZIMRA officials or employees discharge their duties in a fair and impartial manner . 61%
ZIMRA officials or employees expect to receive bribes or entertainment in order to
serve customers efficiently .
57%
Given your experiences with ZIMRA officials or employees over the past two years, do
you feel that they actually take bribes (cash, gifts, favours etc.)? .
60%
Comparative Analysis-Border Stations One of the measures adopted by ZIMRA in the fight against Corona Virus is the limiting of
physical visits of clients to its offices. As a result, human physical interaction has been greatly

30
reduced at inland stations. Thus the results in the following tables only compares rating of
customer perceptions about staff service at border stations only where actual physical
interaction between clients and employees is existing.
Table 11 Comparative Analysis of Staff Service at Border Stations
Station Sufficiency of employees at stations
Conduciveness of working hours
Employee capacity to handle customer needs
Level of quality service
Beitbridge Border Post
3.75 3.55 3.85 3.25
Chirundu One-Stop Border Post
3.83 3.75 3.21 3.28
Forbes Border Post
3.79 3.94 3.65 4.02
Kazungula Border Post
2.77 3.14 3.57 3.00
Nyamapanda Border Post
3.65 3.72 4.18 3.55
Plumtree Border Post
3.66 3.82 3.78 3.23
Victoria Falls Border Post
3.38 3.64 3.50 3.27
The results show that Nyamapanda Border Post has employees with the highest capacity to
handle customer needs while Forbes border post has the highest level of service quality.
Table 12 Comparative Analysis of Staff Service at Border Stations
Station Speed of service
Ambiance of physical facilities
Staff knowledge
Employee courteousness
Beitbridge Border Post 2.83 3.67 3.91 3.62 Chirundu One-Stop Border Post
3.21 3.47 3.59 2.91
Forbes Border Post 3.85 3.89 4.08 3.81 Kazungula Border Post
3.21 1.98 3.77 3.51
Nyamapanda Border Post
2.97 4.41 4.48 3.85
Plumtree Border Post 3.91 4.46 4.26 4.03 Victoria Falls Border Post
3.53 2.04 4.41 3.79
The results show that Nyamapanda and Plumtree had the highest ratings on appearance of
physical facilities while Kazungula and Victoria Falls got the least rating. On the level of staff
knowledge, Forbes, Nyamapanda, Plumtree and Victoria Falls got the highest ratings.
Plumtree ranked the highest on employee courteousness.

31
Table 13 Comparative Analysis of Staff Service at Border Stations
Station Willingness to help customers
Commitment to keep customers satisfied
Quickness of response to client requests
Use of language understood by clients
Commitment to make customers feel safe in their transactions
Beitbridge Border Post
3.55 3.43 3.29 3.63 3.78
Chirundu One-Stop Border Post
3.12 3.01 3.04 3.44 3.43
Forbes Border Post
3.91 3.82 3.99 3.98 3.82
Kazungula Border Post
3.47 3.27 3.31 3.51 3.35
Nyamapanda Border Post
3.87 2.96 3.46 4.60 3.54
Plumtree Border Post
4.04 3.87 3.83 3.78 3.95
Victoria Falls Border Post
3.83 3.63 3.69 3.62 3.67
The results from Table 13 show that Plumtree got the highest rating on staff helpfulness
while Nyamapanda was the best on having staff that communicate with languages
understood by ZIMRA clients.
Table 14 Comparative Analysis of Staff Service at Border Stations
Station ZIMRA employees being good listeners
Employee belief in "Customer First Principle"
Employee Integrity
Fairness and Impartiality
Beitbridge Border Post
3.66 3.35 3.42 3.44
Chirundu One-Stop Border Post
3.43 2.78 2.82 3.26
Forbes Border Post
4.08 3.89 3.80 3.82
Kazungula Border Post
3.44 3.21 3.25 3.28
Nyamapanda Border Post
3.86 2.91 3.77 3.56
Plumtree Border Post
3.87 3.97 3.85 3.55
Victoria Falls Border Post
3.76 3.53 3.74 3.69
Forbes Border Post got the highest rating on having staff that are good at listening to client
requests.
Customer perception on taxpayer education It is imperative for the authority to educate the public about taxes and the importance of
complying. Taxpayer education is the bridge that connects tax administration and the public.
Thus it is a key tool that in transforming the tax culture. Customers were asked about their
32
perceptions on ZIMRA’s taxpayer education programs. The results are as shown in in Figure
22 below.
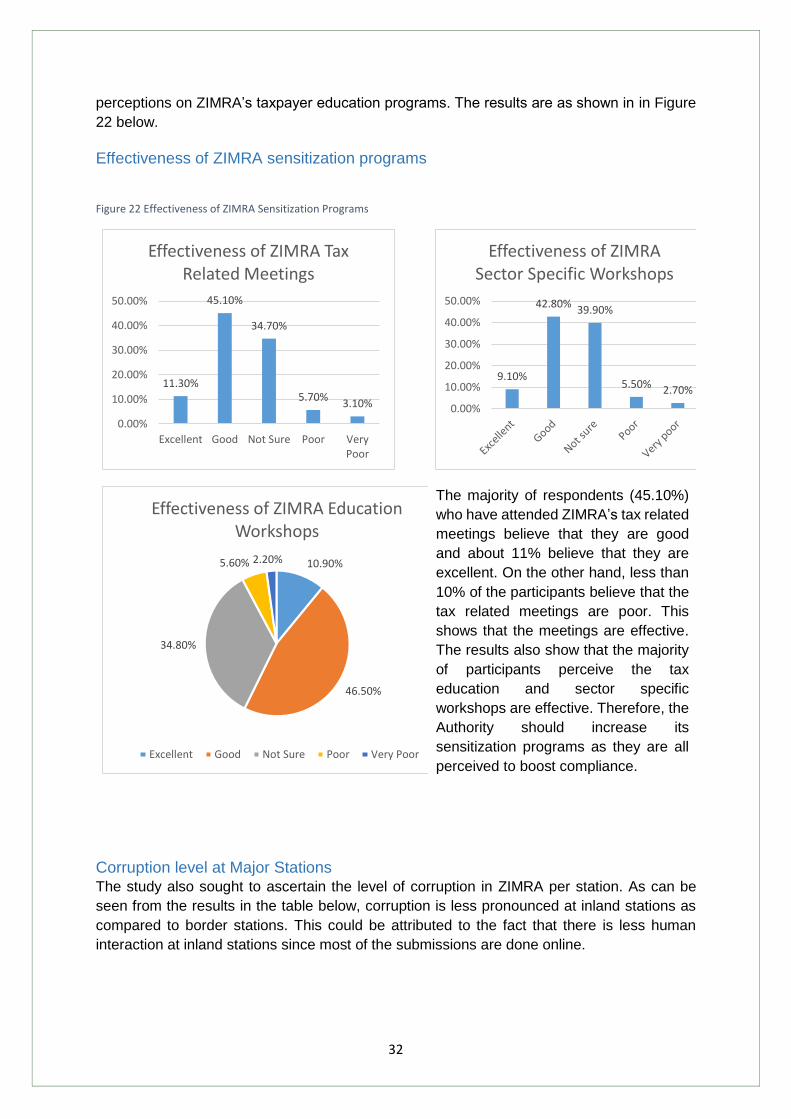
Effectiveness of ZIMRA sensitization programs
Figure 22 Effectiveness of ZIMRA Sensitization Programs
The majority of respondents (45.10%)
who have attended ZIMRA’s tax related
meetings believe that they are good
and about 11% believe that they are
excellent. On the other hand, less than
10% of the participants believe that the
tax related meetings are poor. This
shows that the meetings are effective.
The results also show that the majority
of participants perceive the tax
education and sector specific
workshops are effective. Therefore, the
Authority should increase its
sensitization programs as they are all
perceived to boost compliance.
Corruption level at Major Stations The study also sought to ascertain the level of corruption in ZIMRA per station. As can be
seen from the results in the table below, corruption is less pronounced at inland stations as
compared to border stations. This could be attributed to the fact that there is less human
interaction at inland stations since most of the submissions are done online.
11.30%
45.10%
34.70%
5.70%3.10%
0.00%
10.00%
20.00%
30.00%
40.00%
50.00%
Excellent Good Not Sure Poor VeryPoor
Effectiveness of ZIMRA Tax Related Meetings
9.10%
42.80%39.90%
5.50%2.70%
0.00%
10.00%
20.00%
30.00%
40.00%
50.00%
Effectiveness of ZIMRA Sector Specific Workshops
10.90%
46.50%
34.80%
5.60% 2.20%
Effectiveness of ZIMRA Education Workshops
Excellent Good Not Sure Poor Very Poor

33
Table 15 Corruption Level at Border Stations
Station
Overall Score 2018
Mean Score 2020
Variance
Beitbridge Border Post 4.78 2.10 -2.68
Kazungula Border Post 3.42 2.19 -1.23
Victoria Falls Border Post 3.56 1.53 -2.03
Plumtree Border Post 3.42 2.83 -0.59
Forbes Border Post 3.70 2.67 -1.03
Nyamapanda Border Post 2.37 2.32 -0.05
Chirundu Border Post 4.25 3.34 -0.91
Harare International Airport 3.92 2.16 -1.76
Kurima House 3.54 1.83 -1.71
ZIMRA
3.51 2.66 -0.85
The results in Table 15 also show that there has been a significant reduction in corruption
levels at border posts.
Compliance measure One of the most important aspects of this study is to measure the level of voluntary compliance
among taxpayers. A question on voluntary compliance was asked and the responses were
distributed as shown below.
Filing of Tax Returns Respondents were asked if they have been filing their tax returns without being reminded. The
results below show that the majority (65%) of respondents confirmed that they always filed
their tax returns without reminders. Only 6% of the respondents confirmed that they could only
file their returns upon being reminded.
Figure 23 Filing of Tax Returns
65%
29%
6%
0%
10%
20%
30%
40%
50%
60%
70%
Always Sometimes Never
Filing of Tax Returns

34
Payment of Taxes
The figure below shows the results on voluntary payments of taxes.
Figure 24 Payment of Taxes
The majority of respondents admitted that they always pay their taxes voluntarily whilst 27%
of the respondents cited that they sometimes pay their taxes without reminders. Only
confirmed that they never pay their taxes without reminders.
Reporting Correctly
The results in Figure 25 below show that 71% of respondents always report correctly, while
26% sometimes report correctly without being reminded. The remaining 3% never report
without being reminded.
Figure 25 Reporting Correctly
Awareness of ZIMRA measures to combat COVID 19 Clients were asked about their awareness on measures taken by the Authority to fight COVID
19. The majority of respondents are well aware of the efforts being undertaken by ZIMRA in
fighting the deadly disease. Below are the measures that were cited by the participants as
being implemented by ZIMRA:
Always, 70.00%
Sometimes, 27.00%
Never, 3.00%
Payment of Taxes
Always Sometimes Never
71.00%
26.00%
3.00%
0.00%
20.00%
40.00%
60.00%
80.00%
Always Sometimes Never
Reporting Correctly

35
Sanitization of clients
Minimization of number of clients in Customs
Ensuring that clients are observing social distance
The Authority introduced pre-clearance as ways to facilitate movement of clients to
avoid congestion
Use of face masks
Availability of health officials on ports of entry
The introduction of the sanitizing booth
Foot wash at border posts
Online submission of documents to minimize human interaction
Fumigation of the Customs House
COVID-19 certificate requirement at the countries entry points
Use of online systems and mobile payments
Satisfaction levels with COVID-19 measures at border stations
Customer satisfaction index section
Respondents at border stations were asked about their level of satisfaction with the ablutions
facilities the measures put in place by ZIMRA to combat the Corona virus. The results in Table
16 show that ablutions facilities at border stations are generally not well stocked with hand
wash and paper towels. Most of the respondents at border stations also complained about the
untidiness of toilets at these stations. Thus there is need to ensure that bathrooms are always
clean and well stocked with toiletries at border stations owing to the high human traffic at these
stations. This is also very crucial especially in this COVID-19 pandemic era.
Table 16 Level of Satisfaction with Physical Facilities
Statement
Very
dis
satisfied
Dis
satisfied
Neither
satisfie
d
nor
dis
satisfied
Satisfie
d
Very
satisfied
Dont kn
ow
There are enough hand sanitizers at entry and
exit points around the workplace/station
13.0% 10.8% 22.0% 40.6% 13.6%
There are enough posters around the
workplace on keeping at least 1.5 metres
distance
17.7% 19.0% 20.6% 28.9% 13.8%
Bathrooms at this station are well stocked with
paper towel
24.0% 17.9% 20.2% 9.8% 6.0% 22.1%
Bathrooms at this station are well stocked with
hand wash
26.1% 16.6% 17.6% 10.3% 8.0%
There are enough thermometers at the station 17.1% 14.0% 30.6% 25.4% 12.9%
36
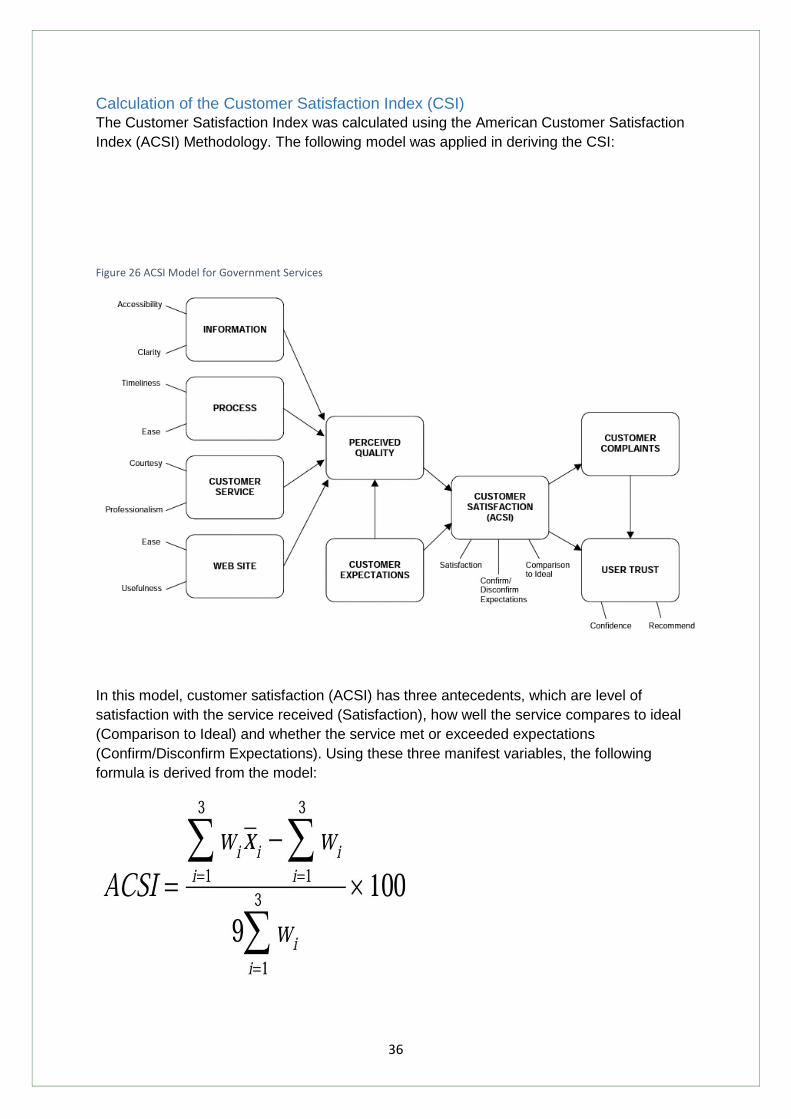
Calculation of the Customer Satisfaction Index (CSI) The Customer Satisfaction Index was calculated using the American Customer Satisfaction
Index (ACSI) Methodology. The following model was applied in deriving the CSI:
Figure 26 ACSI Model for Government Services
In this model, customer satisfaction (ACSI) has three antecedents, which are level of
satisfaction with the service received (Satisfaction), how well the service compares to ideal
(Comparison to Ideal) and whether the service met or exceeded expectations
(Confirm/Disconfirm Expectations). Using these three manifest variables, the following
formula is derived from the model:

37
Using the above formula, the Customer Satisfaction Index was found to be 59.7%. This
figure is 2.9% less than the Zimbabwe National Customer Satisfaction Index (ZimSCI)
released by the Chartered Institute of Customer Management (CICM) in partnership with the
Contact Centre Association of Zimbabwe (CCAZ), which was 62.6%. The result was based
from the National Customer Satisfaction Survey carried out across the country from the period
December 2019 to May 2020.
This customer satisfaction index is 7.3% less than the previous score. This decrease in
satisfaction can be attributed to the fact that business operations have been adversely affected
by the COVID-19 pandemic. Many organizations including ZIMRA have been forced to change
their normal operating procedures. Customers have been adversely affected these changes.
Station Satisfaction Scores One of the objectives of the study was to calculate the satisfaction index per station. Figure
27 below shows the results per station. The satisfaction scores were rounded off to 2
significant figures so that they can be easily compared.
.
Figure 27 Satisfaction Score per Station
As shown in Figure 27, The majority of ZIMRA stations recorded customer satisfaction scores
that were above the organization’s index. The results show that Plumtree (68%), Harare
International Airport (68%), Kariba Border Post (68%) and Masvingo (68%) had the highest
satisfaction scores. On the other hand, Rusape (47%), Kazungula (48%) and Mutare Inland
(49%) recorded the least satisfaction scores
68%
47%
58%61%61%
52%
65%65%67%
50%
63%66%
61%60%
68%67%63%
67%
52%
68%
48%53%51%
68%
49%
67%
60%
0%
10%
20%
30%
40%
50%
60%
70%
80%

38
Comparative Analysis- Satisfaction by Station Table 17 below shows the current station satisfaction scores in comparison with the
satisfaction scores from the previous study.
Table 17 Comparative Analysis-Satisfaction Score by Station
Station Satisfaction
Score-2018
Satisfaction
Score-2020
Variance
Plumtree 66% 68% 2%
Rusape 73% 47% -26%
Marondera 70% 58% -12%
Zvishavane 74% 61% -13%
Beitbridge Border Post 55% 61% 6%
Victoria Falls 62% 52% -10%
Bindura 65% 65% 0%
Bulawayo Port * 65%
Chinhoyi 67% 67% 0%
Chipinge 74% 50% -24%
Chiredzi 68% 63% -5%
Chirundu 70% 66% -4%
Forbes 74% 61% -13%
Gweru 68% 60% -8%
Harare International Airport 62% 68% 6%
Head Office * 67%
Hwange 75% 63% -12%
Joshua M Nkomo Airport 60% 67% 7%
Kadoma 74% 52% -22%
Kariba Border Post 71% 68% -3%
Kazungula 52% 48% -4%
Kurima 63% 53% -10%
Kwekwe 66% 51% -15%
Masvingo 74% 68% -6%
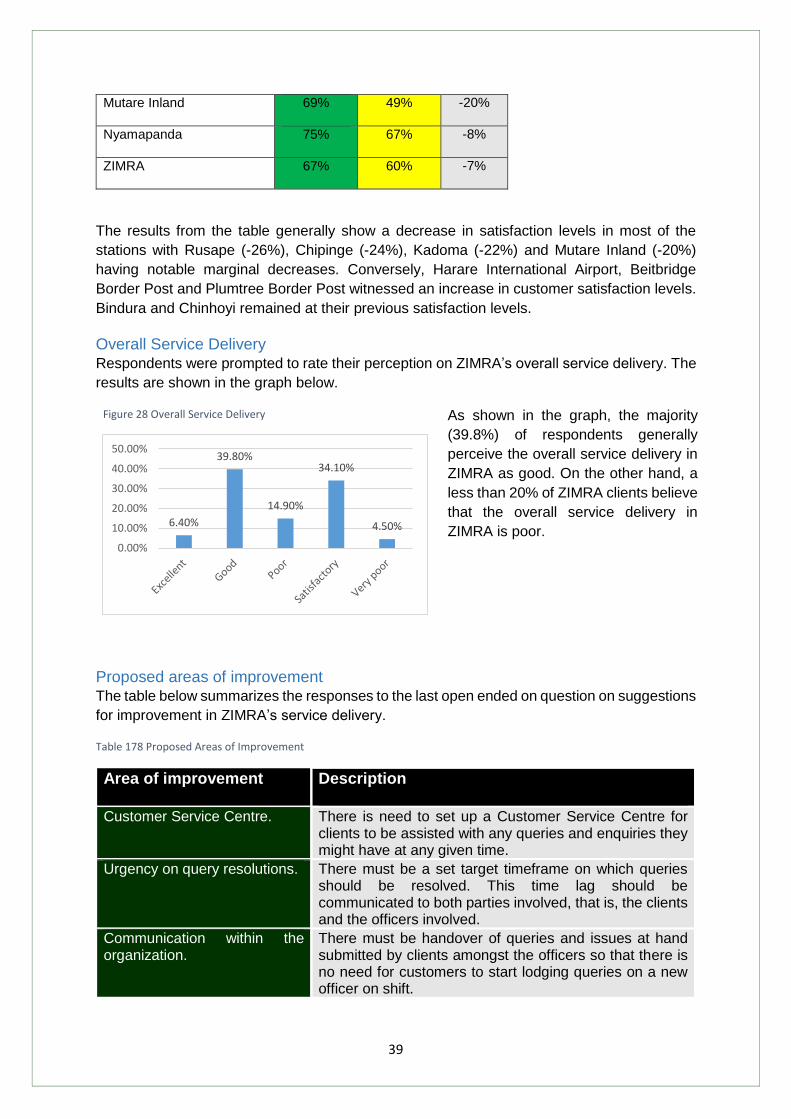
39
Mutare Inland 69% 49% -20%
Nyamapanda 75% 67% -8%
ZIMRA 67% 60% -7%
The results from the table generally show a decrease in satisfaction levels in most of the
stations with Rusape (-26%), Chipinge (-24%), Kadoma (-22%) and Mutare Inland (-20%)
having notable marginal decreases. Conversely, Harare International Airport, Beitbridge
Border Post and Plumtree Border Post witnessed an increase in customer satisfaction levels.
Bindura and Chinhoyi remained at their previous satisfaction levels.
Overall Service Delivery
Respondents were prompted to rate their perception on ZIMRA’s overall service delivery. The
results are shown in the graph below.
Figure 28 Overall Service Delivery
As shown in the graph, the majority
(39.8%) of respondents generally
perceive the overall service delivery in
ZIMRA as good. On the other hand, a
less than 20% of ZIMRA clients believe
that the overall service delivery in
ZIMRA is poor.
Proposed areas of improvement The table below summarizes the responses to the last open ended on question on suggestions
for improvement in ZIMRA’s service delivery.
Table 178 Proposed Areas of Improvement
Area of improvement Description
Customer Service Centre. There is need to set up a Customer Service Centre for clients to be assisted with any queries and enquiries they might have at any given time.
Urgency on query resolutions. There must be a set target timeframe on which queries should be resolved. This time lag should be communicated to both parties involved, that is, the clients and the officers involved.
Communication within the organization.
There must be handover of queries and issues at hand submitted by clients amongst the officers so that there is no need for customers to start lodging queries on a new officer on shift.
6.40%
39.80%
14.90%
34.10%
4.50%
0.00%
10.00%
20.00%
30.00%
40.00%
50.00%
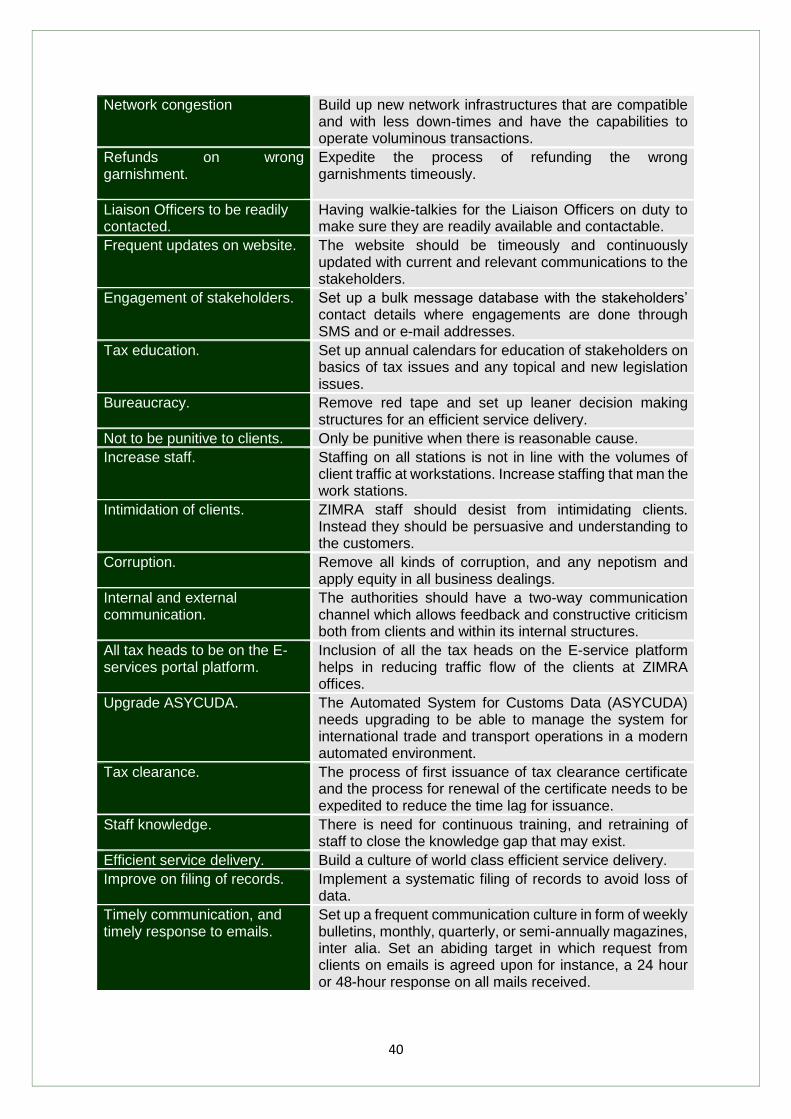
40
Network congestion Build up new network infrastructures that are compatible and with less down-times and have the capabilities to operate voluminous transactions.
Refunds on wrong garnishment.
Expedite the process of refunding the wrong garnishments timeously.
Liaison Officers to be readily contacted.
Having walkie-talkies for the Liaison Officers on duty to make sure they are readily available and contactable.
Frequent updates on website. The website should be timeously and continuously updated with current and relevant communications to the stakeholders.
Engagement of stakeholders. Set up a bulk message database with the stakeholders’ contact details where engagements are done through SMS and or e-mail addresses.
Tax education. Set up annual calendars for education of stakeholders on basics of tax issues and any topical and new legislation issues.
Bureaucracy. Remove red tape and set up leaner decision making structures for an efficient service delivery.
Not to be punitive to clients. Only be punitive when there is reasonable cause.
Increase staff. Staffing on all stations is not in line with the volumes of client traffic at workstations. Increase staffing that man the work stations.
Intimidation of clients.
ZIMRA staff should desist from intimidating clients. Instead they should be persuasive and understanding to the customers.
Corruption.
Remove all kinds of corruption, and any nepotism and apply equity in all business dealings.
Internal and external communication.
The authorities should have a two-way communication channel which allows feedback and constructive criticism both from clients and within its internal structures.
All tax heads to be on the E-services portal platform.
Inclusion of all the tax heads on the E-service platform helps in reducing traffic flow of the clients at ZIMRA offices.
Upgrade ASYCUDA. The Automated System for Customs Data (ASYCUDA) needs upgrading to be able to manage the system for international trade and transport operations in a modern automated environment.
Tax clearance.
The process of first issuance of tax clearance certificate and the process for renewal of the certificate needs to be expedited to reduce the time lag for issuance.
Staff knowledge.
There is need for continuous training, and retraining of staff to close the knowledge gap that may exist.
Efficient service delivery. Build a culture of world class efficient service delivery.
Improve on filing of records. Implement a systematic filing of records to avoid loss of data.
Timely communication, and timely response to emails.
Set up a frequent communication culture in form of weekly bulletins, monthly, quarterly, or semi-annually magazines, inter alia. Set an abiding target in which request from clients on emails is agreed upon for instance, a 24 hour or 48-hour response on all mails received.
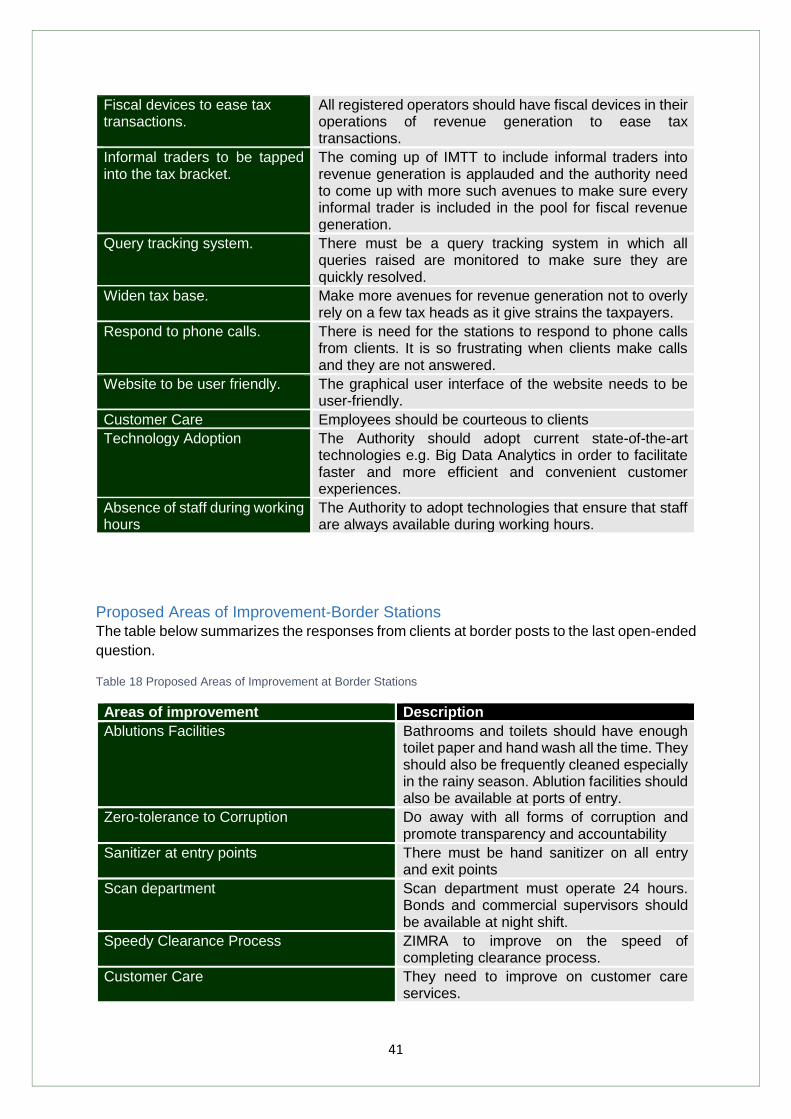
41
Fiscal devices to ease tax transactions.
All registered operators should have fiscal devices in their operations of revenue generation to ease tax transactions.
Informal traders to be tapped into the tax bracket.
The coming up of IMTT to include informal traders into revenue generation is applauded and the authority need to come up with more such avenues to make sure every informal trader is included in the pool for fiscal revenue generation.
Query tracking system. There must be a query tracking system in which all queries raised are monitored to make sure they are quickly resolved.
Widen tax base. Make more avenues for revenue generation not to overly rely on a few tax heads as it give strains the taxpayers.
Respond to phone calls. There is need for the stations to respond to phone calls from clients. It is so frustrating when clients make calls and they are not answered.
Website to be user friendly. The graphical user interface of the website needs to be user-friendly.
Customer Care Employees should be courteous to clients
Technology Adoption
The Authority should adopt current state-of-the-art technologies e.g. Big Data Analytics in order to facilitate faster and more efficient and convenient customer experiences.
Absence of staff during working hours
The Authority to adopt technologies that ensure that staff are always available during working hours.
Proposed Areas of Improvement-Border Stations The table below summarizes the responses from clients at border posts to the last open-ended
question.
Table 18 Proposed Areas of Improvement at Border Stations
Areas of improvement Description
Ablutions Facilities Bathrooms and toilets should have enough toilet paper and hand wash all the time. They should also be frequently cleaned especially in the rainy season. Ablution facilities should also be available at ports of entry.
Zero-tolerance to Corruption Do away with all forms of corruption and promote transparency and accountability
Sanitizer at entry points There must be hand sanitizer on all entry and exit points
Scan department Scan department must operate 24 hours. Bonds and commercial supervisors should be available at night shift.
Speedy Clearance Process ZIMRA to improve on the speed of completing clearance process.
Customer Care They need to improve on customer care services.

42
Cash Offices The Authority should set up more cash offices to avoid delays.
E-Manifest E-manifest needs immediate improvement to avoid delays.
CCTVs Closed Circuit Television Systems must be installed at border stations to aid in fighting corruption.
E-Tip Speedy and efficiency should improve in the payment of E-Tip.
Multicurrency Adoption Payments to be done using any form of currency using the interbank rate.
Better COVID 19 Measures Add more COVID 19 prevention measures like having the newly introduced vaccine readily available at all border stations.
Release of Imported Goods Improve on speed of release of imported goods
Staff Uniforms Employees should be in uniform all the time for easy of identification and also for the image of the organization.
Rotation of Officers Frequent changes of officers so that they will not get used to other stakeholders in order to curb corruption.
Duty Duty should be reasonably charged on some goods especially motor vehicles.
Clearance of Private Vehicles Try and improve the turn over time of clearance of private motor vehicles at border posts.
Mobile Scanners and Drones ZIMRA should consider use of mobile scanners and drones at border posts.

43
CHAPTER FIVE: CONCLUSION AND RECOMMENDATIONS
Conclusions From the above findings, the following conclusions can be drawn:
i. Taxpayers are generally happy with ZIMRA services as indicated by the
Customer Satisfaction Index score at 59.7%. However, there is room for
improvement to increase the customer satisfaction level. In order to increase
customer satisfaction levels, the Authority should improve on communication with
its clients, speed of service delivery and customer care etc.
ii. The E-services platform is not performing to the expectations of ZIMRA clients
since it is always down during peak periods. Respondents has cited the
inadequacy of E-services platform to handle large volumes of transactions as one
of their major challenges.
iii. The complaints resolution mechanism is not clear to taxpayers and as a result
they are generally not happy with the time taken for their queries to be resolved.
Some have complained of going for over 3 weeks without getting a solution from
ZIMRA.
iv. The ZIMRA website does not contain all the relevant information that is needed
by taxpayers.
v. Generally, taxpayers are of the view that ZIMRA staff are difficult to access
through telephone and email during working hours.
vi. The findings also show that most of the taxpayers are generally not familiar with
the jargon used in tax information which they feel is not easily understandable.
vii. Small business owners generally view ZIMRA is a threat to their businesses.
They strongly believe that ZIMRA is there to impose heavy taxes and fines on
their businesses.
viii. The process of obtaining a tax clearance certificate has been cited as one of the
major challenges faced by taxpayers.

44
Recommendations In order to meet customers’ expectations, improvement in the quality of services is of
paramount importance. Accordingly, SPSS Zimbabwe suggested the following
recommendations.
i. Any reforms should be timeously communicated to clients. Reforms cost money
and are meant to solve challenges. Therefore, for the investment to bear fruit,
communication with the targeted group is imperative.
ii. Any new developments with regards to taxes should be well communicated within
ZIMRA before passing the message to clients.
iii. ZIMRA should open more stations throughout the country so that clients can
easily access its services and thereby boosting compliance.
iv. The Authority needs to establish a Call Centre for its clients to access customer
care services more efficiently. An efficient Call Centre will enable speedy
resolution of queries and will also limit office visits by clients.
v. ZIMRA should have a clear procedure for staff to efficiently deal with customer
complaints. A complaints recording system is also important for ZIMRA to identify
recurring problems and trends. ZIMRA should also strive to come up with
mechanisms to deal with areas of service delivery that have the most recurring
complaints.
vi. There is need for an updated taxpayer database that can be utilized by ZIMRA in
disseminating information.
vii. The processing of Capital Gains Tax (GTC) needs immediate improvement.
viii. ZIMRA should conduct a nationwide census to capture all operating businesses
in order to curb tax evasion.
ix. ZIMRA staff should always be available in their offices so that phone calls do not
go unanswered.
x. The Authority should also widen its taxpayer base by incorporating the informal
sector. Lots of businesses in the informal sector are making huge amounts of
profit but not contributing to ZIMRA.
xi. ZIMRA to increase tax awareness to the public through advertisement and
brochures to boost compliance. The Authority should also take advantage of the
social media platforms which are cheap and effective in disseminating
information.
xii. The e-filing services platform should be upgraded so that it can cater for all types
of taxes. The platform should always be up and running. ZIMRA should adopt
advanced ICT infrastructure that is capable of handling large volumes of
transactions to avoid congestion during peak periods.
xiii. The ZIMRA website should be upgraded and all relevant material loaded. The
website should be interactive and should always be up to date. The website
should be active all the time and also have a blog were customers can interact.
The language used on the website should also be simplified so that it’s easy to
understand.
xiv. The movement of traffic at border posts should be expedited as some motorists
are avoiding some of our ports of entry and thereby depriving the country of
revenue. Also parking space at border stations should be increased.
xv. Employees should be adequately trained in their line of work so that they can
perform their duties efficiently and with confidence.
xvi. Customer care trainings should be regularly conducted so that employees
improve on the way they handle clients.

45
xvii. Tax information should be simplified for all to understand. Most people are not
familiar with the jargon used.
xviii. Processing of ITF 263 certificate should be fast as it hinders smooth flowing of
business
xix. ZIMRA should communicate effectively with small business and keep them up to
date with any new information. This can be done through regular newsletters.
xx. ZIMRA should carry out mystery shopping surveys to monitor customer service
standards
xxi. There is need to conduct mini customer satisfaction surveys on a quarterly basis
to keep up with client needs. The Authority should therefore develop a standard
customer satisfaction measurement instrument that focuses on key touch points
for these quarterly surveys.
xxii. The Authority should increase surveillance systems at the countries major ports
of entry as way of fighting corruption.
xxiii. ZIMRA staff should be empowered to make own decisions and reduce
bureaucracy.
xxiv. ZIMRA should also ensure that all staff, during working hours, are in their
uniforms for the image of the organization.
xxv.

46
Appendix
Questionnaire for Taxpayers
SECTION A: General Information
Gender 1. Male 2. Female
Age range 1. 18-25 years 2. 26-35 years 3. 36-45 years 4. 46-55 years 5. Above 55 years
Level of Education 1. Primary 2. Secondary 3. Diploma 4. Degree 5. Postgraduate 6. Other (specify)
Category of Business 1. Large 2. Medium 3. Small 4. Individual 5. Clearing Agents 6. Other (Specify) 7.
INTRODUCTION: Hello, my name is …... I work for SPSS ZIMBABWE, an independent
market research company. In a bid to evaluate the service delivery function within ZIMRA,
we are conducting a Customer Satisfaction Survey targeting taxpayers and other
stakeholders’ perceptions and opinions of the institution. The findings of this research will
be used as a reference in prioritising areas for improvement within ZIMRA. It is in this regard
that we kindly seek your contribution to this survey by responding to this questionnaire.
You can be assured that responses obtained from this exercise will be treated with utmost
confidentiality and will only be used for the purposes of this research.
SPSS ZIMBABWE
Deeper Insights. Smarter Decisions.
Address: 50 Pendennis Road Mt Pleasant, Harare Email: [email protected] [email protected] Phone: 0242-744 264 Cell: 0774 997 301/0775 026 897
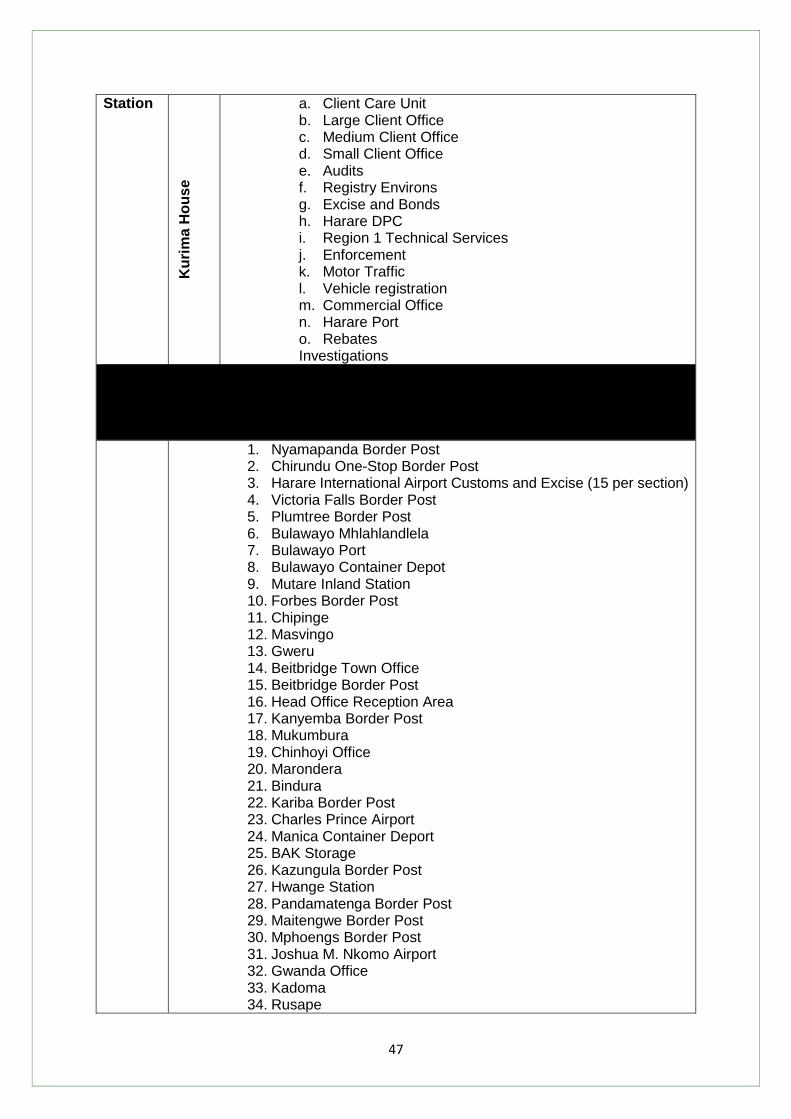
47
Station
Ku
rim
a H
ou
se
a. Client Care Unit b. Large Client Office c. Medium Client Office d. Small Client Office e. Audits f. Registry Environs g. Excise and Bonds h. Harare DPC i. Region 1 Technical Services j. Enforcement k. Motor Traffic l. Vehicle registration m. Commercial Office n. Harare Port o. Rebates Investigations
1. Nyamapanda Border Post 2. Chirundu One-Stop Border Post 3. Harare International Airport Customs and Excise (15 per section) 4. Victoria Falls Border Post 5. Plumtree Border Post 6. Bulawayo Mhlahlandlela 7. Bulawayo Port 8. Bulawayo Container Depot 9. Mutare Inland Station 10. Forbes Border Post 11. Chipinge 12. Masvingo 13. Gweru 14. Beitbridge Town Office 15. Beitbridge Border Post 16. Head Office Reception Area 17. Kanyemba Border Post 18. Mukumbura 19. Chinhoyi Office 20. Marondera 21. Bindura 22. Kariba Border Post 23. Charles Prince Airport 24. Manica Container Deport 25. BAK Storage 26. Kazungula Border Post 27. Hwange Station 28. Pandamatenga Border Post 29. Maitengwe Border Post 30. Mphoengs Border Post 31. Joshua M. Nkomo Airport 32. Gwanda Office 33. Kadoma 34. Rusape

48
35. Kwekwe 36. Mt Selinda Border Post 37. Sango Border Post 38. Chiredzi 39. Zvishavane
Sector 1. Tax Accountant 2. Clearing Agent 3. Transporter 4. Individual Taxpayer 5. Importer 6. Exporter 7. Government Department 8. NGO 9. SME 10. Cross Border Trader 11. Wholesale & Retail Trade 12. Real Estate Activities 13. Other Service Activities 14. Income from Trade & Investment 15. Construction 16. Manufacturing 17. Transportation And Storage 18. Agriculture, Forestry & Fishing 19. Financial and Insurance 20. Information and Communication 21. Admin & Support Services 22. Professional, Scientific & Tech 23. Mining And Quarrying 24. Human Health And Social Work 25. Accommodation & Food Services 26. Standard Industry System 27. Education 28. Electricity, gas, steam & aircon 29. Arts, Entertainment & Recreation 30. Water, Sewerage, Waste, Remediation 31. Public Administration & Defence: CSS 32. Extraterritorial Orgs &Bodies
Position 1. Owner 2. Manager 3. Accountant 4. Other (specify)
SECTION B: Quality of service delivery
1. Are you in regular contact with ZIMRA? Yes/No
2. If Yes, for how long have you been in contact with ZIMRA?
a) Less than 1 year
b) Between 1 year and 2 years
c) Between 3 years and 5 years
d) Over 5 years

49
3. Are you aware that ZIMRA has a customer service charter? Yes/No
4. How did you get to know about ZIMRA’s customer service charter?
Newspaper
Radio
TV
ZIMRA’s website
Posters within ZIMRA’s buildings
Exhibitions and promotions e.g. shows
Events held by ZIMRA e.g. launch events, taxpayers’ week
Employees of ZIMRA
Other
5. On a scale of 1 to 5 where 1 = very ineffective; 2 = somewhat ineffective; 3= neither
effective nor ineffective 4 = somewhat effective and 5 = very effective, how would you
rate the effectiveness of ZIMRA’s customer service charter
Very ineffective Somewhat
ineffective
Neutral Somewhat
effective
Very effective
01 02 03 04 05
6. According to you, is ZIMRA’s service delivery or customer care improving? Yes/No
CUSTOMER SATISFACTION LEVELS: For this section, I want you to tell me the extent to
which you are satisfied with ZIMRA on each of the following attributes that I am going to read
out to you. Please use a scale of 1 to 5 where 5 = Very Satisfied; 4 = Satisfied; 3 =
Neither Satisfied nor Dissatisfied; 2 = Dissatisfied and 1 = Very Dissatisfied.
Attribute Very
Dissatisfied
Dissatisfied Neither Satisfied
nor Dissatisfied
Satisfied Very
Satisfied
ZIMRA keeping their brand
promise – what ZIMRA
promises its customers
Accurate collection of taxes
Process of registration
Payment of taxes
Process of filing returns
The confidentiality given to
customers while handling
sensitive matters
Efficient and speedy service
delivery

50
Frequency of communication
Staff being accessible through
emails and phones
Decentralization of operations
to the district level
Taxpayer education programs
Fast response to enquiries
and complaints
Modes and channels of
communication used
Timeliness in delivery of
services
Staff ability to answer
customer queries and
questions
Refunds within the stipulated
time
Release of imported goods
from customs
Customs and border posts
related services
ZIMRA WEBSITE: Are you aware that ZIMRA has a website? Yes/No
How often do you visit ZIMRA’s website? Daily
Weekly
Monthly
On a need basis
What do you do when you visit ZIMRA’s
website?
Tax payments
Seek information
Download forms
Checking updates
Other (specify)_________________

51
Is the ZIMRA website easy to find? Yes/No
Is the ZIMRA website easy to use?
Are you able to easily access all the relevant information you may need from ZIMRA
website? Yes/No
Please suggest how ZIMRA can improve on their website
……………………………………………………………………………………………………………
……………………………………………………………………………………………………………
PUBLICITY RATING: Have you ever seen/heard about ZIMRA in any of the local media? Yes/No
In which media did you hear/see about ZIMRA?
Newspaper
Radio
TV
Social media (Whatsap, Facebook, Twitter etc.)
Other (Specify)
ZIMRA ONLINE/MOBILE PLATFORMS: Which of the following facilities are you aware of?
(Tick all that apply)
How often do you use these facilities in fulfilling your tax obligation?
Awareness Usage
Every
da
y
Every
week
Every
m
on
th
Every
Qu
art
er
Every
year
ZIMRA-Econet Ownai platform
ZIMRA-Netone One Money platform
ZIMRA Electronic Cargo Tracking System
ZIMRA ASYCUDA System
ZIMRA E-services Platform
Electronic Billing Machines (Fiscal Devices)
How satisfied are you with these facilities?
Services related to Domestic Taxes
Very
Po
or
Sati
sfa
cto
r
y
Go
od
Po
or
Excell
en
t
ZIMRA-Econet Ownai platform
ZIMRA-Netone One Money platform
ZIMRA Electronic Cargo Tracking System
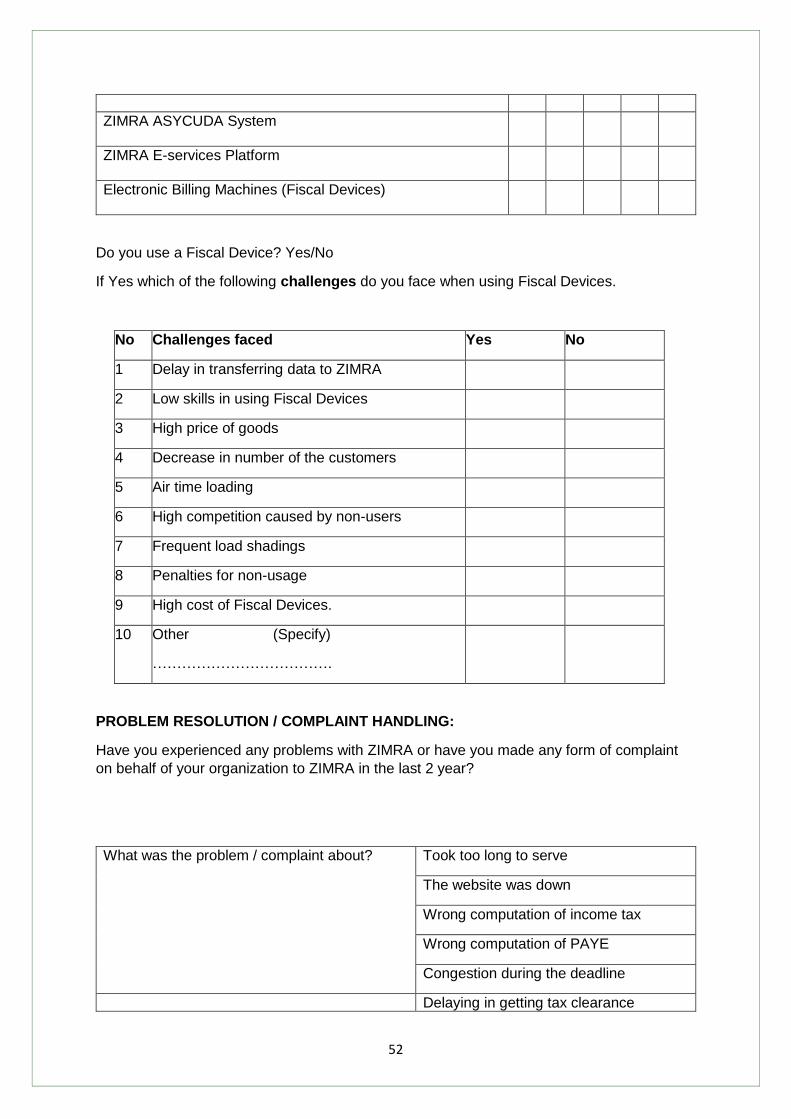
52
ZIMRA ASYCUDA System
ZIMRA E-services Platform
Electronic Billing Machines (Fiscal Devices)
Do you use a Fiscal Device? Yes/No
If Yes which of the following challenges do you face when using Fiscal Devices.
No Challenges faced Yes No
1 Delay in transferring data to ZIMRA
2 Low skills in using Fiscal Devices
3 High price of goods
4 Decrease in number of the customers
5 Air time loading
6 High competition caused by non-users
7 Frequent load shadings
8 Penalties for non-usage
9 High cost of Fiscal Devices.
10 Other (Specify)
……………………………….
PROBLEM RESOLUTION / COMPLAINT HANDLING:
Have you experienced any problems with ZIMRA or have you made any form of complaint
on behalf of your organization to ZIMRA in the last 2 year?
What was the problem / complaint about? Took too long to serve
The website was down
Wrong computation of income tax
Wrong computation of PAYE
Congestion during the deadline
Delaying in getting tax clearance
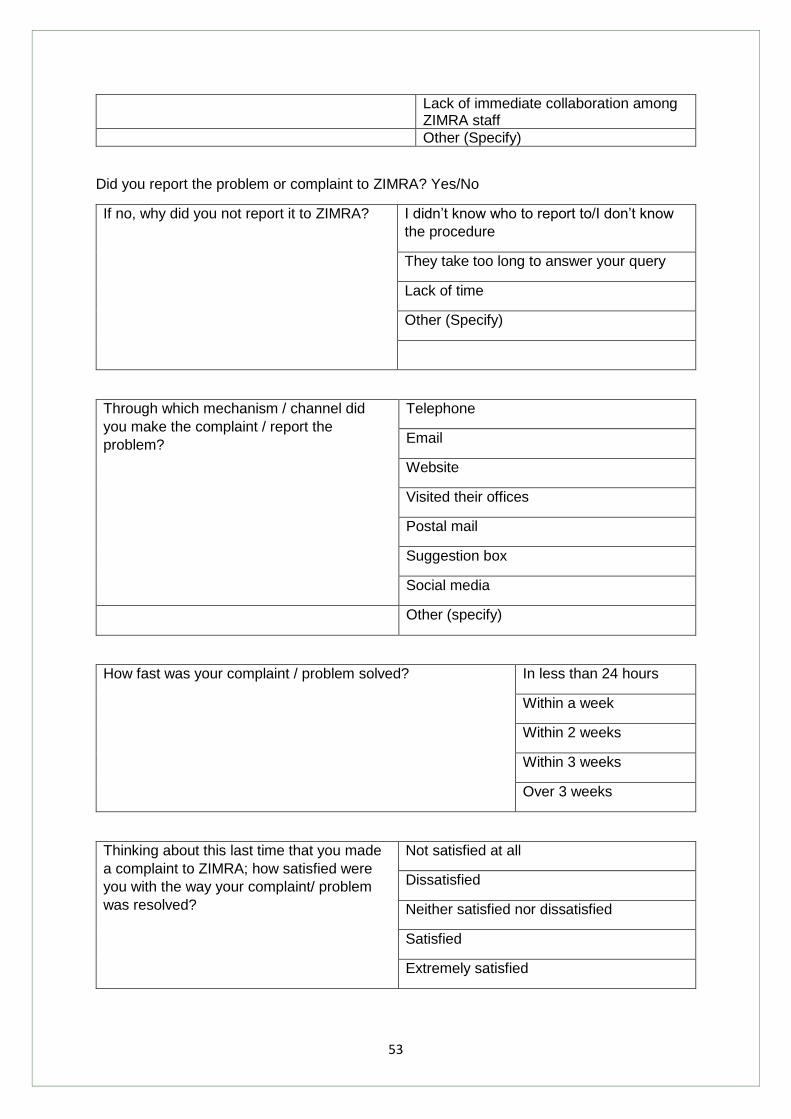
53
Lack of immediate collaboration among ZIMRA staff
Other (Specify)
Did you report the problem or complaint to ZIMRA? Yes/No
If no, why did you not report it to ZIMRA? I didn’t know who to report to/I don’t know
the procedure
They take too long to answer your query
Lack of time
Other (Specify)
Through which mechanism / channel did
you make the complaint / report the
problem?
Telephone
Website
Visited their offices
Postal mail
Suggestion box
Social media
Other (specify)
How fast was your complaint / problem solved? In less than 24 hours
Within a week
Within 2 weeks
Within 3 weeks
Over 3 weeks
Thinking about this last time that you made
a complaint to ZIMRA; how satisfied were
you with the way your complaint/ problem
was resolved?
Not satisfied at all
Dissatisfied
Neither satisfied nor dissatisfied
Satisfied
Extremely satisfied

54
Are you aware of any reforms that are currently being undertaken or have been undertaken
by ZIMRA?
What are these reforms you are aware of? Mobile payment systems
Website upgrade
Others (Specify)
How have these services impacted on ZIMRA’s service delivery?
……………………………………………………………………………………………………………
……………………………………………………………………………………………………………
Customer Perception: How well do you agree with the following statements?
1=Strongly disagree, 2=Disagree, 3=Neither agree nor disagree, 4=Agree, 5=Strongly
Agree
Statement Strongly
Disagree
Disagree Neither
agree nor
disagree
Agree Strongly
agree
Number of ZIMRA employees is sufficient for providing an effective service at this station
ZIMRA Office hours are conducive
ZIMRA employees have the capacity to handle customers’ needs
Quality of service in ZIMRA is comparatively better than in Southern Africa region
ZIMRA’s information and communication system is very efficient
The Quality of service in ZIMRA is high
ZIMRA service is fast
ZIMRA employees at this station know their job well
ZIMRA PHYSICAL FACILITIES
ZIMRA’s physical facilities (offices, reception etc.) are very good
CUSTOMER CARE/STAFF RELATIONS
ZIMRA staff are knowledgeable
ZIMRA employees handle customers courteously
ZIMRA employees are always willing to help customers
ZIMRA staff strive to exceed customers’ expectations

55
ZIMRA employees quickly respond to our service requests
ZIMRA employees are very good in speaking the language I understand
ZIMRA employees make customers feel safe in their transactions
ZIMRA employees are very good listeners
ZIMRA Employees strongly believe in “Customer First” principle
INTEGRITY AND FAIRNESS
ZIMRA employees/officials are of high integrity
ZIMRA officials or employees discharge their duties in a fair and impartial manner
ZIMRA officials or employees expect to receive bribes or entertainment in order to serve customers efficiently
Given your experiences with ZIMRA officials or employees over the past two years, do you agree that they actually take bribes (cash, gifts, favours etc.)?
ZIMRA officials upholds accountability in all their undertakings
TAXPAYER EDUCATION
ZIMRA conducts tax payer education programs for businesses that covers basic information in respect to all taxes
ZIMRA issues simplified publications that contain information on all taxes administered by ZIMRA
1. Have you ever attended any of the following sensitization sessions? (Tick
appropriate box)
Programs Yes No
Tax related meetings
Education workshops
Sector specific workshops

56
How effective are ZIMRA programs in disseminating information to customers about taxes
and tax related issues
5=Excellent; 4= Good 3= Not Sure 2=poor 1=Very Poor
Programs Excellent Good Not Sure Poor Very Poor
Tax related meetings
Education workshops
Sector specific workshops
COMMUNICATION
Which of the following
statements best describes
your impression of
communications within
ZIMRA?
ZIMRA keeps customers
fully informed
ZIMRA keeps customers
fairly well informed
ZIMRA keeps customers
adequately informed
ZIMRA gives customers
only a limited amount of
information
ZIMRA doesn’t tell
customers much at all about
what is happening
Which channel of communication do you think ZIMRA can adopt to get more exposure? (Select one answer only)
Yes No
Telephone
ZIMRA Facebook
Radio
Newspaper
TV
SMS
ZIMRA Twitter

57
ZIMRA
website
Have you ever used any of the following channels to obtain tax information?
Telephone Yes No
In-person (office visit) with
appointment
In-person without
appointment
ZIMRA Facebook
Radio
Newspaper
TV
Front Desk
SMS
ZIMRA Twitter
ZIMRA website
1. On a scale of 0 to 10 how would you rate the corruption level at this station? (Where
0 means not corrupt at all and 10 means extremely corrupt)
Not corrupt
at all
Extremely
corrupt
0 1 2 3 4 5
2. On a scale of 0 to 5 how satisfied are you with ZIMRA’s services at this station?
(Where 0 means very dissatisfied and 5 means very satisfied)
Very
dissatisfied
Very satisfied
0 1 2 3 4 5
SECTION D: COMPLIANCE MEASURE
1. Have you been fulfilling the following without reminders?

58
No Activity Always Sometimes Never
a) Filing of tax returns (Declarations)
b) Reporting correctly
c) Payment of taxes
COVID-19: What measures are you aware of that have been taken by ZIMRA to
mitigate the COVID-19 pandemic?
……………………………………………………………………………………………………………
……………………………………………………………………………………………………………
……………………………………………………………………………………………………………
How satisfied are you with the following statements? (Border Station Clients Only)
Statement Very Dissatisfied
Dissatisfied Neither satisfied nor dissatisfied
Satisfied Very Satisfied
There are enough hand sanitizers at entry and exit points around the workplace/station
There are enough thermometers at the station
Bathrooms at this station are well stocked with hand wash
Bathrooms at this station are well stocked with paper towel
There are enough posters around the workplace on keeping at least 1.5 metres distance between everyone at this station.
There is an adequate number of staff on the work floor whore responsible for keeping everyone the required 1.5 metre distance apart in accordance with the latest government requirements.
There is an adequate number of closed bins around the station

59
CUSTOMER SATISFACTION INDEX SECTION
Have you ever contacted ZIMRA offices to request a service(s) at one of their service
centres? Yes/No
Overall, how satisfied were you with the service(s) you received? (On a scale of 1-
10, circle the digit reflecting the degree of satisfaction; circle 99 if you don’t
know sufficiently to rate)
Very Dissatisfied Very Satisfied DK
1 2 3 4 5 6 7 8 9 10 99
Considering all the expectations you may have had about the service(s), to what
extent did the service meet your expectations?
Fell short of expectations Exceeded expectations DK
1 2 3 4 5 6 7 8 9 10 99
Considering the ideal service, how well do you think the service you received
compare with ideal service?
Far from ideal Very close to ideal DK
1 2 3 4 5 6 7 8 9 10 99
What degree of confidence did you have in the knowledge/ professionalism of the
staff member who provided the service to you?
Not Confident Confident DK
1 2 3 4 5 6 7 8 9 10 99
How courteous, attentive and caring was the staff member who provided the service
to you?
Not at all Very DK
1 2 3 4 5 6 7 8 9 10 99
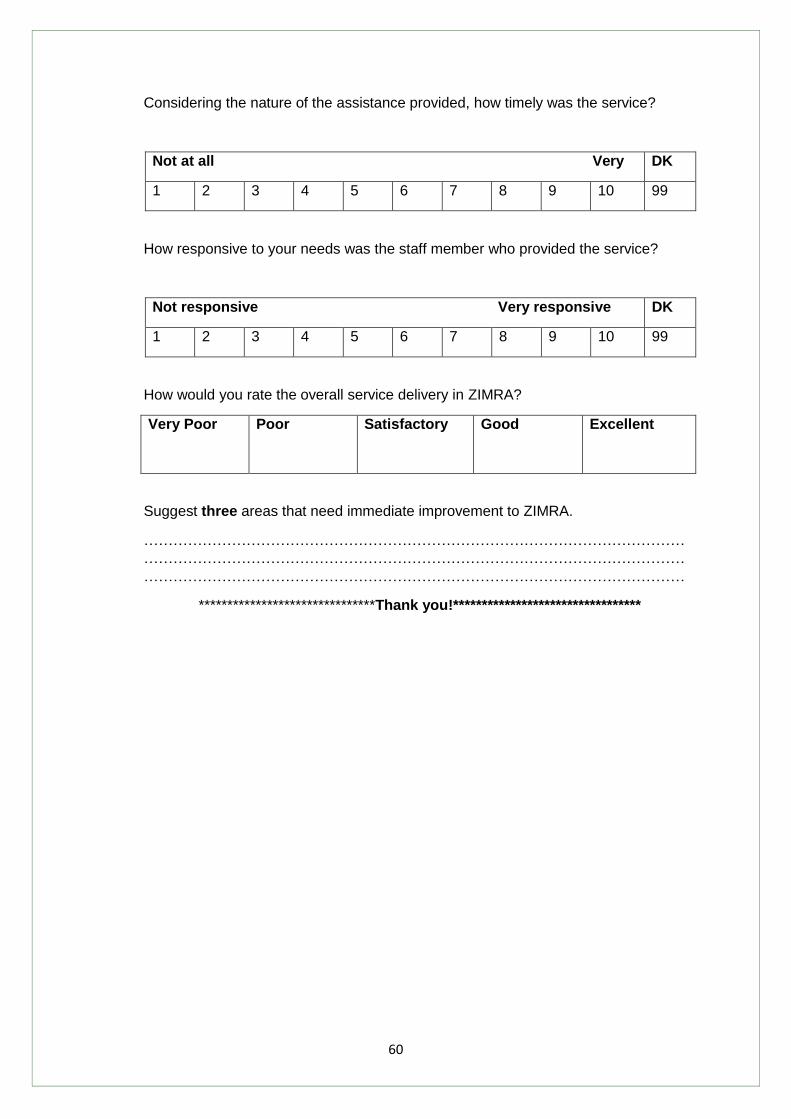
60
Considering the nature of the assistance provided, how timely was the service?
Not at all Very DK
1 2 3 4 5 6 7 8 9 10 99
How responsive to your needs was the staff member who provided the service?
Not responsive Very responsive DK
1 2 3 4 5 6 7 8 9 10 99
How would you rate the overall service delivery in ZIMRA?
Very Poor
Poor Satisfactory Good Excellent
Suggest three areas that need immediate improvement to ZIMRA.
…………………………………………………………………………………………………
…………………………………………………………………………………………………
…………………………………………………………………………………………………
*******************************Thank you!*********************************

61
Key Informant Interview Guide
SPSS ZIMBABWE P/L
Deeper Insights. Smarter Decisions.
50 Pendennis Road Mt Pleasant Harare 0242 744 264/0774 997 301 0772 697 727
Key Informant Interview Guide
INTRODUCTION: Hello, my name is …... I work for SPSS ZIMBABWE, an independent market research company. In a bid to evaluate the service delivery function within ZIMRA, we are conducting a Customer Satisfaction Survey targeting taxpayers and other stakeholders’ perceptions and opinions of the institution. The findings of this research will be used as a reference in prioritising areas for improvement within ZIMRA. It is in this regard that we kindly seek your contribution to this survey by responding to this questionnaire. You can be assured that responses obtained from this exercise will be treated with utmost confidentiality and will only be used for the purposes of this research.
1. Are you satisfied
with the services offered by ZIMRA? a) If yes, probe for the services appreciated b) If no, probe for the dissatisfaction
2. What can you say about the way ZIMRA staff handle customer complaints?
3. Have you ever contacted ZIMRA customer service desk, if yes, what were the issues and how were they solved?
62
4. Generally, what do you think are the challenges that your business face in meeting ZIMRA demands?
5. What do you think should be done to improve the services offered by ZIMRA?