
consumer Satisfaction
70
1 SUMMER TRAINING REPORT ON “Customer Satisfaction on Mobile Service Provider Networks” In Partial fulfillment of the requirements For the degree of “BACHLOR OF BUSINESS ADMINIRISTRATION” SUBMITTED TO; PUNJAB TECHNICAL EDUCATION
Transcript of consumer Satisfaction
1
SUMMER TRAINING REPORT
ON“Customer Satisfaction on Mobile Service Provider Networks”
In Partial fulfillment of the requirements For the degree of
“BACHLOR OF BUSINESS ADMINIRISTRATION”
SUBMITTED TO; PUNJAB TECHNICAL EDUCATION
2
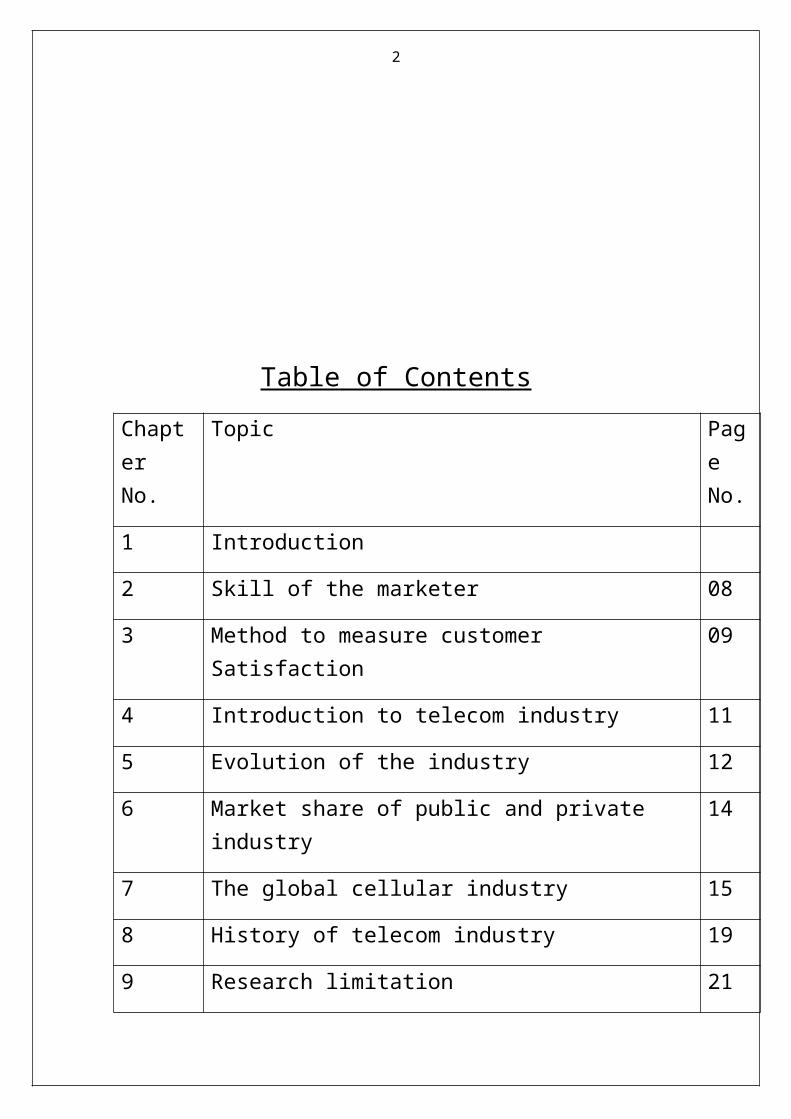
Table of Contents
Chapter No.
Topic Page No.
1 Introduction
2 Skill of the marketer 08
3 Method to measure customer Satisfaction 09
4 Introduction to telecom industry 11
5 Evolution of the industry 12
6 Market share of public and private industry 14
7 The global cellular industry 15
8 History of telecom industry 19
9 Research limitation 21
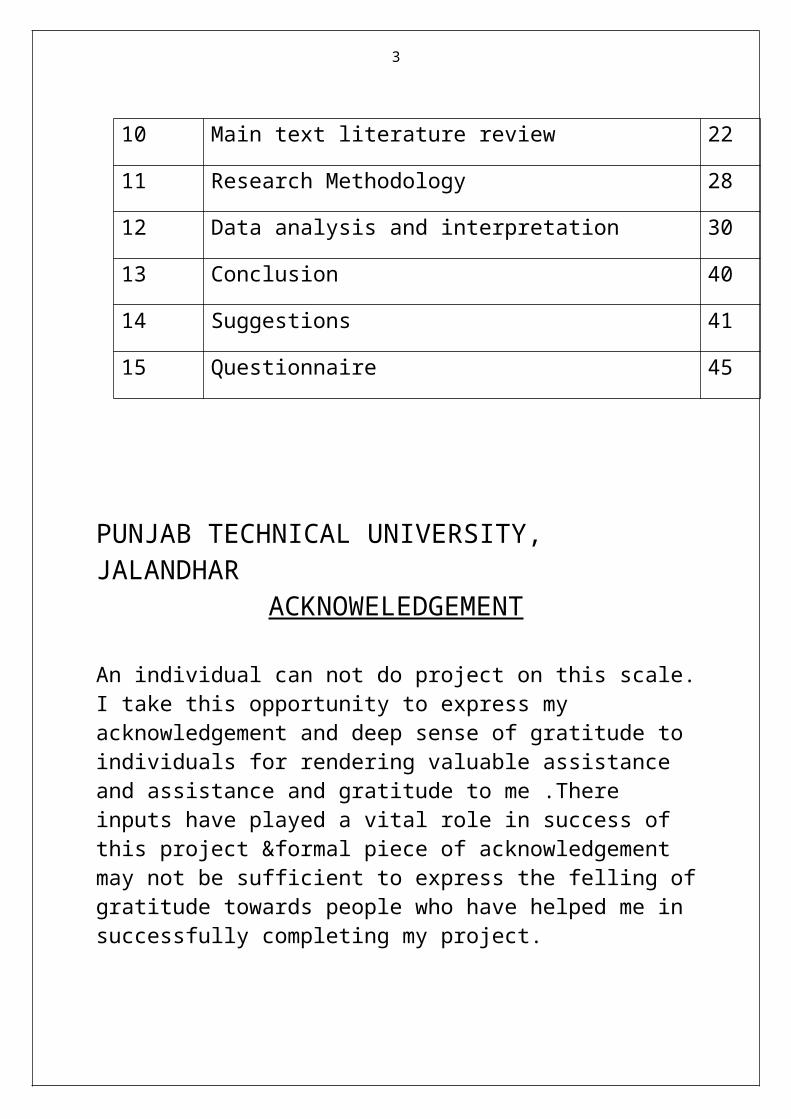
10 Main text literature review 22
11 Research Methodology 28
12 Data analysis and interpretation 30
13 Conclusion 40
14 Suggestions 41
15 Questionnaire 45
3
PUNJAB TECHNICAL UNIVERSITY, JALANDHARACKNOWELEDGEMENT
An individual can not do project on this scale. I take this opportunity to express my acknowledgement and deep sense of gratitude to individuals for rendering valuable assistance and assistance and gratitude to me .There inputs have played a vital role in success of this project &formal piece of acknowledgement may not be sufficient to express the felling of gratitude towards people who have helped me in successfully completing my project.
I highly thankful to Mr. Parvinder Singh for guidance.
I firmly belived that there is always a scope of improvement. I welcome any suggestion for further enriching the quality of this report.
Amit Kumar Pandey
4
PREFACEThe customer is very important and crucial role in any process of marketing .Today, customer are the kings of the market because the customer loyalty and customer preference are built by the products and the services offered to the customers and the seek for the more benefits and money’s worth for the amount the spend that is where the concept of customer preference and consumer behavior comes because the customers make the marketers to rethink about designing the products and services.They have to think about the market segmentation, market strategies, consumer behavior, consumer’s tastes, consumer’s lifestyle etc also. Many marketers are smart enough to understand consumer’s needs, wants and demands and perform beyond their expectation i.e. they delight them. It provides them growth, profitability and creativity with lot of inventions.

5
DECLARATION
I hereby declare that the project on “Customer Satisfaction on Mobile Service Provider Networks” has been submitted by me for the partial fulfillment for the award of the degree of Bachelors of Business Administration.
This report has been based on my study under the guidance of Mr. Parvinder Singh.
I undertake responsibility for the contents of this report.
Amit Kumar Pandey
6
1. Introduction
Theoretical Background of the Topic
Customer SatisfactionAccording to Philip Kotler, “satisfaction is a person’s feelings of pressure
or disappointment resulting from product’s perceived performance
(outcome) in relation to his or her expectations. Customer
satisfaction is the level of a person’s felt state resulting from
comparing a product’s perceived performance (outcome) in relation
to the person’s expectations”.
This satisfaction level is a function of difference between
perceived performance and expectations. If the product’s
performance, exceed expectation the customer highly satisfied
or delighted. If the performance matches the expectations the
customer is satisfied. If the products performance fall shorts of
expectations the customer is dissatisfied.
1 Many companies are aiming for high satisfaction because customers who
are just satisfied still find it easy to switch when a better offer comes along.
High satisfaction or delight creates an emotional affinity with brand.
2 Variety of factors that affect customer satisfaction includes product quality,
product availability and after sales support such as warranties and services.

7
Customer satisfaction is seen as a proof of delivering a quality product or
service. It is believed that customer satisfaction brings sales growth, and
market share. A company can always increase customer satisfaction by
lowering its price or increasing its services but this may result in lower
profits. Thus the purpose of marketing is to generate customer value
profitability.
3 India is on the threshold of a new millennium. India chose for global
economy, exposing her to winds of change in the market place, which has
expanded vastly and become fiercely competitive. In the changed
environment, decision makers view the marketing concept as the key to
success. Marketing in practice has to manage products, pricing, promotion
and distribution.
4 A successful product can be developed by exploding these opportunities.
While delivering the value of the consumer we make use of marketing
support. This support is based on the knowledge of consumers and
distribution. Marketing support both at the introduction of products and
maturing is considered
5 Marketing, as suggested by the American Marketing Association is "an
organizational function and a set of processes for creating, communicating
and delivering value to customers and for managing customer relationships
in ways that benefit the organization and its stakeholders".
6 The two major factors of marketing are the recruitment of new customers
(acquisition) and the retention and expansion of relationships with existing
customers (base management). Marketing methods are informed by many of
the social, particularly psychology, sociology, and economics.
8
Anthropology is also a small, but growing, influence. Market research
underpins these activities. Through advertising, it is also related to many of
the creative arts.
7 For a marketing plan to be successful, the mix of the four "Ps"1 i.e. product,
price, place, promotion must reflect the wants and desires of the consumers
in the target market. Trying to convince a market segment to buy something
they don't want is extremely expensive and seldom successful. Marketers
depend on marketing research, both formal and informal, to determine what
consumers want and what they are willing to pay for. Marketers hope that
this process will give them a sustainable competitive advantage. Marketing
management is the practical application of this process. The offer is also an
important addition to the 4P's theory.
1

9
Skills of MarketersMarketers have 4 main skill sets that they bring to an enterprise:
1) Opportunity Identification : Marketing begins before there is a
product to sell. Many people think marketing is just selling whatever
comes out of the manufacturing plant. It's the job of marketing to decide
WHAT comes out of the manufacturing plant in the first place. Before a
business can make money there must be opportunities for money to be
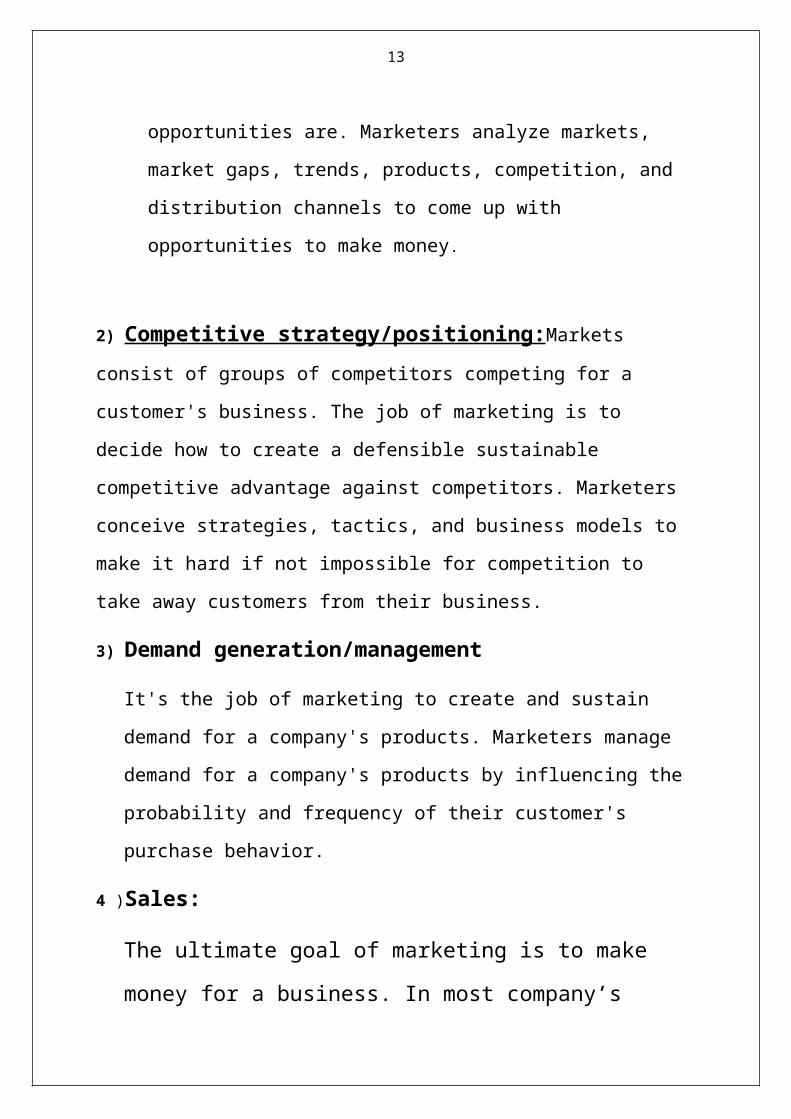
made and it's marketing's job to define what those opportunities are.
Marketers analyze markets, market gaps, trends, products, competition,
and distribution channels to come up with opportunities to make money.
2) Competitive strategy/positioning:Markets consist of groups of
competitors competing for a customer's business. The job of marketing is to
decide how to create a defensible sustainable competitive advantage against
competitors. Marketers conceive strategies, tactics, and business models to
10
make it hard if not impossible for competition to take away customers from
their business.
3) Demand generation/management
It's the job of marketing to create and sustain demand for a company's
products. Marketers manage demand for a company's products by
influencing the probability and frequency of their customer's purchase
behavior.
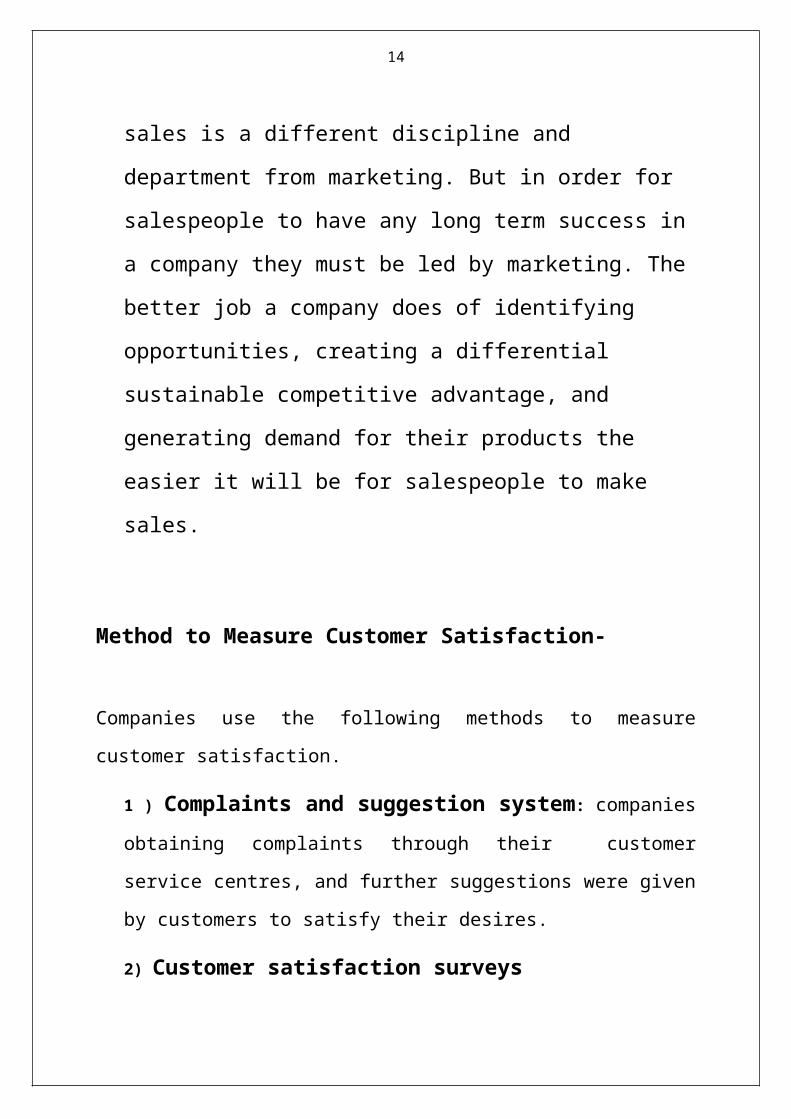
4 )Sales:
The ultimate goal of marketing is to make money for a business. In
most company’s sales is a different discipline and department from
marketing. But in order for salespeople to have any long term
success in a company they must be led by marketing. The better
job a company does of identifying opportunities, creating a
differential sustainable competitive advantage, and generating
demand for their products the easier it will be for salespeople to
make sales.
Method to Measure Customer Satisfaction-
Companies use the following methods to measure customer satisfaction.
1 ) Complaints and suggestion system: companies obtaining
complaints through their customer service centres, and further suggestions
were given by customers to satisfy their desires.
2) Customer satisfaction surveys
11
Responsive companies obtain a direct measure of customer satisfaction by
periodic surveys. They send questionnaires to random sample of their
customers to find out how they feel about various aspects of the company’s
performance and also solicit views on their competitor’s performance. It is
useful to measure the customer’s willingness to recommend the company
and brand to other persons.
3 )Lost Customer Analysis.
Companies should contact customers who have stopped buying or who have
switched to another supplier to learn why this happened.
4 )Consumer Behavior Vs Consumption Behavior
Consumer behavior refers to the manner in which an individual reaches
decision related to the selection, purchases and use of goods and services.
Walters and Paul says that, consumer behavior is the process whereby the
individuals decides what, when, how and from whom to purchase goods &
services.
Consumer behavior relates to an individual person (Micro behavior) where
as consumption behavior relates to and to the mass or aggregate of
individuals (Macro behavior) consumers behavior as a study focuses on the
decision process of the individual consumer or consuming unit such as the
family.
In contrast the consumption behavior as a study is to do with the explanation
of the behavior of the aggregate of consumers or the consuming unit.
Consumer is a pivot, around which the entire system of marketing revolves.
The study of buyer behavior is one of the most important keys to successful
mark

12
Introduction to Telecom Industry-
The Indian Telecommunications network with 110.01 million connections is the fifth largest in the world and the second largest among the emerging economies of Asia. Today, it is the fastest growing market in the world and represents unique opportunities for U.S. companies in the stagnant global scenario. The total subscriber base, which has grown by 40% in 2005, is expected to reach 250 million in 2007. According to Broadband Policy 2004, Government of India aims at 9 million broadband connections and 18 million internet connections by 2007. The wireless subscriber base has jumped from 33.69 million in 2004 to 62.57 million in FY2004- 2005. In the last 3 years, two out of every three new telephone subscribers were wireless subscribers. Consequently, wireless now accounts for 54.6% of the total telephone subscriber base, as compared to only 40% in 2003. Wireless subscriber growth is expected to bypass 2.5 million new subscribers per month by 2007. The wireless technologies currently in use are Global System for Mobile Communications (GSM) and Code Division Multiple Access (CDMA). There are primarily 9 GSM and 5 CDMA operators providing mobile services in 19 telecom circles and 4 metro cities, covering 2000 towns across the country.
13
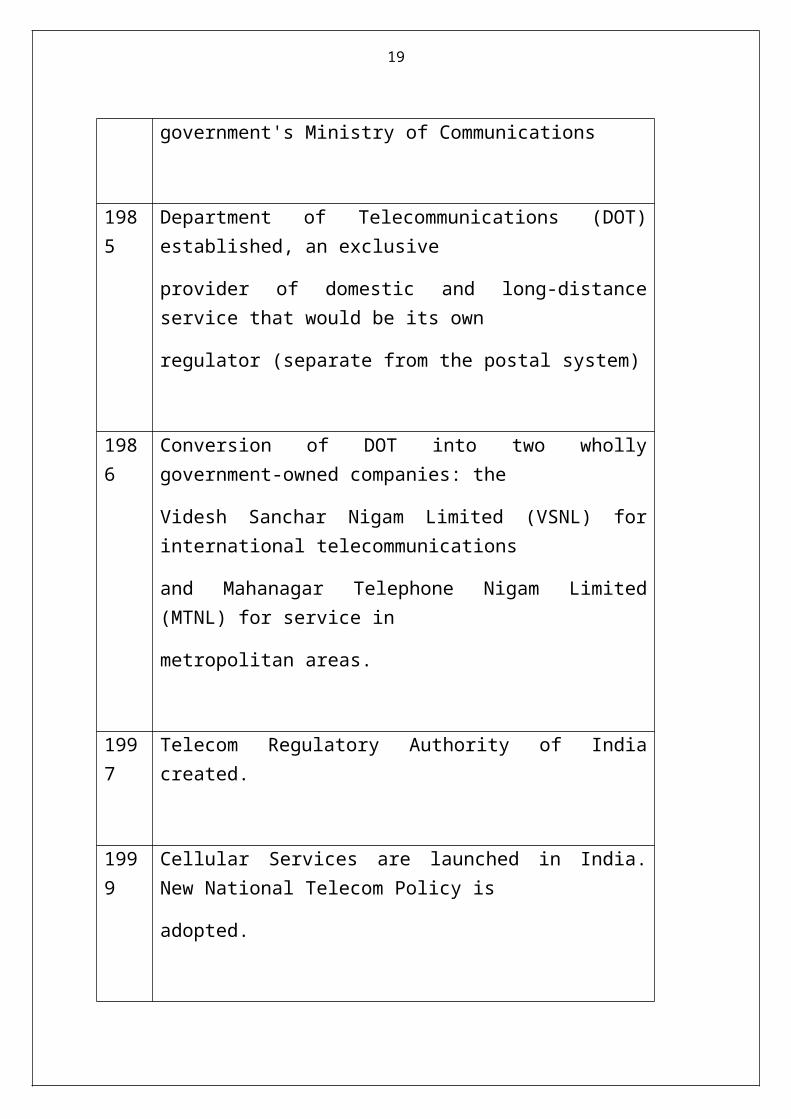
Evolution of the industry-Important Milestones
Year
1851 First operational land lines were laid by the government near Calcutta (seat
of British power)
1881 Telephone service introduced in India
1883 Merger with the postal system
1923 Formation of Indian Radio Telegraph Company (IRT)
1932 Merger of ETC and IRT into the Indian Radio and Cable Communication
Company (IRCC)
1947 Nationalization of all foreign telecommunication companies to form the
Posts, Telephone and Telegraph (PTT), a monopoly run by the
government's Ministry of Communications
1985 Department of Telecommunications (DOT) established, an exclusive
provider of domestic and long-distance service that would be its
14
own
regulator (separate from the postal system)
1986 Conversion of DOT into two wholly government-owned companies: the
Videsh Sanchar Nigam Limited (VSNL) for international telecommunications
and Mahanagar Telephone Nigam Limited (MTNL) for service in
metropolitan areas.
1997 Telecom Regulatory Authority of India created.
1999 Cellular Services are launched in India. New National Telecom Policy is
adopted.
2000 DoT becomes a corporation, BSNL
A large population, low telephony penetration levels, and a rise in consumers' income and spending owing to strong economic growth have helped make India the fastest-growing telecom market in the world. The first and largest operator is the state-owned incumbent BSNL, which is also the 7th largest telecom company in the world in terms of its number of subscribers. BSNL was created by

15
corporatization. While DTS (Department of Telecommunication Services), a government unit responsible for provision of telephony services. Subsequently, after the telecommunication policies were revised to allow private operators, companies such as Bharti Telecom, TATA Indicom, Vodafone, MTNL, Idea, Vodafone and BPL have entered the space Major operators in India. However, rural India still lacks strong infrastructure.
The total number of telephones in the country crossed the 300 million mark on June 18 2008The overall tele-density has increased to 36.98% in March 2009 .In the wireless segment, 15.87 million subscribers have been added in March 2009. The total wireless subscribers (GSM, CDMA & WLL (F)) base is more than 391.76 million now. The wire line segment subscriber base stood at 38.22 million with a decline of 0.13 million in October 2008.
Market Share of Public and Private Industry;
The fixed line and mobile segments serve the basic needs of local calls, long distance calls and the international calls, with the provision of broadband services in the fixed line segment and GPRS in the mobile arena. Traditional telephones have been replaced by the codeless and the wireless instruments. Mobile phone providers have also come up with GPRS-enabled multimedia messaging, Internet surfing, and mobile-commerce. The much-awaited 3G mobile technology is soon going to enter the Indian telecom market. The GSM, CDMA, WLL service providers are all upgrading them to provide 3G mobile services. Along with improvement in telecom services, there is also an improvement in manufacturing. In the beginning, there were only the Siemens handsets in India but now a whole series of new handsets, such as Nokia's latest N-series, Sony Ericsson's W-series, Motorola's PDA phones, etc. have come up.
Touch screen and advanced technological handsets are gaining popularity. Radio services have also been incorporated in the mobile handsets, along with other applications like high storage memory,

16
multimedia applications, multimedia games, MP3 Players, video generators, Camera's, etc. The value added services provided by the mobile service operators contribute more than 10% of the total revenue.
The Global Cellular Mobile Industry
Global telecom sector
Earnings visibility
Earnings growth is being driven by improving pricing conditions, stabilizing operating trends, aggressive cost cutting initiatives, a positive regulatory environment, strong wireless growth, and new market opportunities. This has translated into greater visibility of forward earnings as evidenced by recent increased analyst upgrades within the sector.
Merger synergies
Given the substantial amount of excess capital available in the sector and in private equity we expect to see additional merger and acquisition activity, albeit at a slower pace than recently witnessed. Global telecom M&A deals over the past two years have reflected market expansion but have also had a positive effect on the buyers’ balance sheets. Partnering companies have begun realizing their synergies through cost reductions and economies of scale. In the US, the largest three companies now account for over 70% of the sector market cap; this compares to 34% in 1990. Trends in bundled services are also paving the way for additional M&A activity. Sector consolidation will further increase the importance of stock selection.
Growth;
While cost-cutting has been a major source of earnings growth, we have seen top-line pressures decreasing which will help revenues become a larger driver of earnings growth again. We see growth within the sector coming from a

17
number of areas including: broadband, 3G (third generation) technology, expansion in emerging markets. Broadband penetration has been accelerating as internet customers are seeking faster downloads for audio and video files. 3G services, which facilitate the simultaneous transfer of both voice and non-voice (i.e. video, downloads, SMS, etc.) data are providing mobile users with a much more robust communication platform and should finally begin to realize their growth potential in 2007. Emerging market companies benefit from low penetration rates and also tend to have lower leverage, higher margins and higher growth than most developed markets telecom companies.
Global opportunities
It has become less difficult to find attractive telecom investment opportunities globally than it was a year ago. As the fog has lifted from the sector, there are increased opportunities within both the growth and value spaces.
Definition of Cellular/Mobile phone
The Cellular telephone (commonly "mobile phone" or "cell phone" or "hand phone") is a long-range, portable electronic device used for mobile communication. In addition to the standard voice function of a telephone,

18
The Global Cellular Mobile Industry:The global mobile phone industry is based on many different manufacturers and operators. The industry is based on advanced technology and many of the manufacturers are operating in different industries, where they use their technological skills, distribution network, market knowledge and brand name. Four large manufacturers of mobile phones are today dominating the global mobile phone industry &networks; Nokia, Sony Ericson, Samsung and Motorola . Airtel, Bsnl , tataindicom ,Vodafone, reliance, others. In addition to these companies there are many manufacturers that operate globally and locally.
Telecom Industry in India The telecom industry is one of the fastest growing industries in India.
India has nearly200 million telephone lines making it the third largest network in the world after China and USA.
With a growth rate of 45%, Indian telecom industry has the highest growth rate in the8world.
Much of the growth in Asia Pacific Wireless Telecommunication Market is spurred by the growth in demand in countries like India and China.
India‘s mobile phone subscriber base is growing at a rate of 82.2%. China is the biggest market in Asia Pacific with a subscriber base of 48%
of the total subscribers in Asia Pacific. Compared to that India’s share in Asia Pacific Mobile Phone market is
6.4%. Considering the fact that India and China have almost comparable
populations, India’ slow mobile penetration offers huge scope for growth.
History of Indian Telecommunications
19
It was Started in 1851 ,when the first operational land lines were laid by the government near Calcutta (seat of British power). Telephone services were introduced in India in 1881. In 1883 telephone services were emerged with the postal system. Indian Radio Telegraph Company (IRT) was formed in 1923. After independence in 1947, all the foreign telecommunication companies were nationalized to form the Posts, Telephone and Telegraph (PTT), a monopoly run by the government's Ministry . Telecom sector was considered as a strategic service and the government considered it best to bring under state's control. The first wind of reforms in telecommunications sector began to flow in 1980s when the private sector was allowed in telecommunications equipment manufacturing. In 1985, Department ofTelecommunications (DOT) was established. It was an exclusive provider of domestic and long distance service that would be its own regulator (separate from the postal system). In 1986, two wholly government-owned companies were created: the Videsh Sanchar Nigam Limited (VSNL) for international telecommunications and Mahanagar Telephone Nigam Limited (MTNL) for service in metropolitan areas.
In 1990s, telecommunications sector benefited from the general opening up of the economy. Also, examples of telecom revolution in many other countries, which resulted in better quality of service and lower tariffs, led Indian policy makers to initiate a change process finally resulting in opening up of telecom services sector for the private sector. National Telecom Policy(NTP) 1994 was the first attempt to give a comprehensive roadmap for the Indian telecommunicationssector.
In 1997, Telecom Regulatory Authority of India (TRAI) was created. TRAI was formed to act as a regulator to facilitate the growth of the telecom sector.. Telecommunication sector in India can be divided into two segments: Fixed Service Provider (FSPs), and Cellular Services. Fixed line services consist of basic services, national or domestic long distance and international long distance services. The state operators (BSNL and MTNL), account for almost 90 per cent of revenues from basic services. Private sector services are presently available in selective urban areas, and collectively account .Global System for Mobile Communications (GSM) and Code Division Multiple Access (CDMA). The GSM sector is dominated by Airtel, Vodfone-Essar, and Idea Cellular, while the CDMA sector is dominated by Reliance and Tata Indicom. Opening up of international and domestic long distance telephony services are the major growth drivers for cellular industry. Cellular he tariffs on airtime, which along with rental was the main source of revenue. The reduction in tariffs for airtime,

20
national long distance, international long distance, and handset prices has driven demand.
Classification of Telecommunication services
1. Basic services2. Cellular services3. Internet Service Provider (ISP)
Research Objectives
Scope of study: The main scope of the study to understood the market situation and find the best solution for the market.
Objectives of the study : This project aims at studying the present market scenario.The major players in the market today are Airtel, Vodafone,Bsnl, Tata indicom ,Reliance,Idea.AllThe companies want to capture the market study concerns with evaluating fast developing area and so all the service providers were taken to measure the satisfaction of customer
The main objective of the study is;
1. Service providers in the market which are not reaching the customer.2. To study the customer satisfaction towards mobile service providers.3. To study and identify how the customers are benefited.4. To evaluate the major service provider satisfied the customer.5. To assess the needs, requirements and expectations of the customers in order toAssess their current satisfaction levels.6. To know the attitude, enthusiasm regarding the service provided to customers.7. To understand the performance of different brands in the market on variousParameters like product quality, performance of the customer relationship officer(CRO) service quality range and selection of products available.
About the company

21
IMRB Established in 1971 and with over three decades of market research experience, It is a pioneer in India in various research areas. Associated with a group of international market companies .International promises high quality conceptualization, ISMRB International is the only research company in India today that offers the entire range of research based services to its clients.
consumer market research both quantitative and qualitative, industrial market research, business to business market research, social and rural market research, media research, retail research, and consumer panels.
This provides specialist research services to its clients in India and overseas on products and services covering the entire business and industry. IMRB International today, operates out of its five full service offices in Mumbai, Delhi, Calcutta, Chennai and Bangalore and is supported by15 other regional centers for collection of survey information that literally spanthe entire country.
ABACUS FIELD;Abacus Field handles the field operations for all the business divisions in IMRB. it has a network of 15 regional offices spread across the country that gives IMRB the capability to run pan India research projects smoothly &effectively. In research infrastructure in neighbouring countries. They work with associate companies in Sri Lanka (Lanka Market Research Bureau) and in the Middle East(Arab Market Research Bureau), and through affiliates in Australia, Singapore, Malaysia, Thailand, Indonesia, Philippines, Egypt, Tunisia, Nepal, Pakistan, Bangladesh and Myanmar.
DIVISIONSIMRB has five specialist units to serve the diverse needs of their clients:➢Probe Qualitative Research (PQR)➢Social and Rural Research Institute (SRI)➢Media & Panel Research Group➢Customer Satisfaction Management & Measurement (CSMM)➢Business & Industrial Research Division (BIRD)

22
Research LimitationLimitations of the Study
Carrying the survey was a general learning experience for us but we also
faced some problems, which are listed here:
The market of Telecommunication is too vast and it is not possible to
cover each and every dealer, manufacturer and seller in the available
short span of time.
Generally the respondents were busy in their work and were not
interested in responding rightly.
Respondents were reluctant to discover complete and correct information
about themselves and their organization.
Most respondents were not maintaining proper knowledge of various
services provided by their company, so they were unable to provide
exact information.
Most of the respondents don’t want to disclose the information about the
various other companies’ which they have experienced before.
Some of the respondents were using the service first time of their
company and they were not able to properly differentiate among their
product.
Due to human behavior information may be biased. Mainly in BSNL
case.

23
Main Text Literature Review
. Review of Literature;
1. Robins (2008) This paper is about marketing the next generation of
mobile telephones. The study is about third generation of cell phone
technology, what is usually known as “3G” for short. There are various
issues about that new innovative. One is how to price 3G handsets and
services at a level which will enable telephone operating companies to
recoup the high prices they have already paid to governments for
operating licenses. Second the technology is not yet complete, there are
no agreed international standards and companies do not yet know what
new services the technology will prove capable of delivering effectively.
All variants of 3G remain dependent on largely unproven technology.
Marketing 3G is going to be about services which are new and in many
cases, yet to be designed. At the same time, it will involve services
which can also be obtained by computer and other means. It follows that
the marketing task will be high risk. First, 3G has no obviously unique
selling proposition to build on except, perhaps, the combination of live
video and easy portability. Second, the potential customers have not yet
had adequate opportunity to signal their service likes and dislikes. Third,
the cost and complexity of service provision leave doubt about the
market’s reaction to price.
2. Debnath (2008) This study explain that the prime focus of the service
providers is to create a loyal customer base by benchmarking their
performances and retaining existing customers in order to benefit from
their loyalty. With the commencement of the economic liberalization in

24
1991, and with a view to expand and improve telecom infrastructure
through the participation of the private sector, the Government of India
permitted foreign companies holding 51 percent equity stake in joint
ventures to manufacture telecom equipment in India. The Indian
Government has announced a new policy, which allows private firms to
provide basic telephone services. There had been a monopoly of the
state-owned department of telecommunications. However, several
companies are expected to benefit from the policy change.
3. Bhatt (2008), in his study titled “A Study of Mobile Phone Usage
Among the Post Graduate Students” analyzed that it is important for
mobile carriers, service providers, content developers, equipment
manufacturers, as well as for parents and young people alike that the key
characteristics of mobile technology is well understood so that the risks
associated with its potentially damaging or disruptive aspects can be
mitigated. This paper has tried to compare the usage difference by
gender with respect to the difference manufacturing and service provider
companies.
4. Jha (2008), in his study analyzed that it is the youth which is the real
growth driver of the telecom industry in India. Considering this fact, the
paper is an attempt to give a snapshot of how frequently young people
use their mobile phones for several embodied functions of the cell

25
phones. Data was collected from a sample of 208 mobile phone owners,
aged between 20 and 29. The study sheds light on how gender, monthly
voucher amount and years of owning mobile phones influence the usage
pattern of this device. Findings of the study would be helpful for the
telecom service providers and handset manufacturers to formulate a
marketing strategy for different market segments.
5. Kalavani (2006) in their study analyzed that majority of the respondents
have given favourable opinion towards the services but some problems
exist that deserve the attention of the service providers. They need to
bridge the gap between the services promised and services offered. The
overall customers’ attitude towards cell phone services is that they are
satisfied with the existing services but still they want more services to be
provided.
6. Kumar (2008), in their study titled “Customer Satisfaction and
Discontentment vis-a-vis BSNL Landline Service: A Study” analyzed
that at present, services marketing plays a major role in the national
economy. In the service sector, telecom industry is the most active and
attractive. Though the telecom industry is growing rapidly, India's
telecom density is less than the world's average telecom density as most
of India's market is yet to be covered. This attracts private operators to
enter into the Indian telecom industry, which makes the Bharat Sanchar
26
Nigam Limited (BSNL) more alert to run its business and survive in the
market.
7. Seth et al (2008), in their study titled “Managing the Customer
Perceived Service Quality for Cellular Mobile Telephone: an
Empirical Investigation” analyzed that there is relative importance of
service quality attributes and showed that responsiveness is the most
importance dimension followed by reliability, customer perceived
network quality, assurance, convenience, empathy and tangibles. This
would enable the service providers to focus their resources in the areas
of importance. The research resulted in the development of a reliable and
valid instrument for assessing customer perceived service quality for
cellular mobile services.
8. Fernandez (2007) in their study titled “Understanding Dynamics in an
Evolving Industry: Case of Mobile VAS in India” analyzed that Mobile
Value Added Services (VAS) is a rising star in the fast growing wireless
business. In the paper, attempt is made at understanding the strategic
dynamics of the evolving environment within which the Indian players
are operating, the challenges and structure of the same. Our literature
and industry review indicates that - while the value chain of industry is
complicated yet one can observe the bipolar nature of bargaining powers
between mobile network operators and content aggregators.
27
9. Bismut (2006) in his study titled “Competition in European Telecom
Markets” analyzed that in recent years the European telecommunications
market has witnessed major developments, with rapid expansion in
access to telecommunications networks and a surge in the number of
available services and applications. While many factors have contributed
to the transformation of the telecommunications industry, competition
has played a key role in driving telecom players to invest in new
technologies, to innovate and to offer new services.
10.Kalpana and Chinnadurai (2006) in their study titled “Promotional
Strategies of Cellular Services: A Customer Perspective” analyzed that
the increasing competition and changing taste and preferences of the
customer’s all over the world are forcing companies to change their
targeting strategies. The study revealed the customer attitude and their
satisfaction towards the cellular services in Coimbatore city. It was
found that advertisement play a dominant role in influencing the
customers but most of the customers are of opinion that promotional
strategies of cellular companies are more sale oriented rather than
customer oriented.
11.Fredric (2008) analyzed the importance of yield management and
discrimination pricing in telecommunication sector. Yield management
is the process of allocating the right type of capacity or inventory unit to
the right kind of customer at the right price so as to maximize revenue or
yield. Yield management and dynamic pricing strategies could be
usefully applied to preserve and increase profitability. Yield
management techniques can help telecom operators and similar

28
companies to optimize the benefits they can derive from a subtle
management of information networks and partnerships. However, such
an approach is more difficult to implement in the telecommunications
industry than in the airlines sector because of the difficulty to control
(and sometimes to refuse) network access to customers
12.Chris (2003) has analyzed ‘Telecom advertising in print media.’ This
research attempted to investigate why Telecom theme are used in
advertisement, and the motives that lead companies and advertisers to
use sport celebrities and sport concept in advertisements. From study it
has been revealed that the appearance of sport celebrities in advertising
endorsement occurred more often in Telecom magazines than in other
magazines, because their target group is more acquainted with athletes.
The sport celebrities that dominated each printed media are related with
their target group characteristics.
29
Research Methodology
Sources of Data
SOURCES OF DATA
The study undertaken there to be mainly based on the primary data i.e.
structured questionnaire is designed. The study also contains secondary data i.e.
data from authenticated websites and journals for the latest updates
just to gain an insight for the views of various experts.
METHODOLOGY & PRESENTATION OF DATA
The data collected is then coded in the tables to make the things presentable and
more effective. The results are shown by tables which will help me out in easy
and effective presentation and hence results are being obtained.
TOOLS AND TECHNIQUES USED FOR ANALYSIS
In this study the technique used for interpreting the results is CHI SQUARE
test. It is used as because sample size is 100.
Sampling Design;
RESEARCH DESIGN
The design for this study is Exploratory and convenience sampling
30
Collection Method
DATA COLLECTION;
The data is collected randomly irrespective of the category of the people in the
form of questionnaire and the sample size is 100 respondents. Because it is a
pilot study and due to time constraint the sample size is small.
Research DefinitionThe word research is derived from the Latin word meaning to know. It is a systematic and a replicable process, which identifies and defines problems, within specified boundaries. It employs well-designed method to collect the data and analyses the results. It disseminates the findings to contribute to generalize able knowledge. The main characteristics of research presented below are:
Systematic problem solving which identifies variables and tests relationships between them,
Collecting, organizing and evaluating data. Logical, so procedures can be duplicated or understood by others Empirical, so decisions are based on data collected Reductive, so it investigates a small sample which can be generalized to a
larger population Replicable, so others may test the findings by repeating it. Discovering new facts or verify and test old facts. Developing new scientific tools, concepts and theories, this would
facilitate to takedecision.
For the proper analysis of data simple statistical techniques such as percentage were use. It helps in making more generalization from the data available. The data which will be collected from a sample of population was assumed to be representing entire population was interest. Demographic factors likeage, income and educational background was used for the classification purpose.
31
Data Analysis and Interpretation
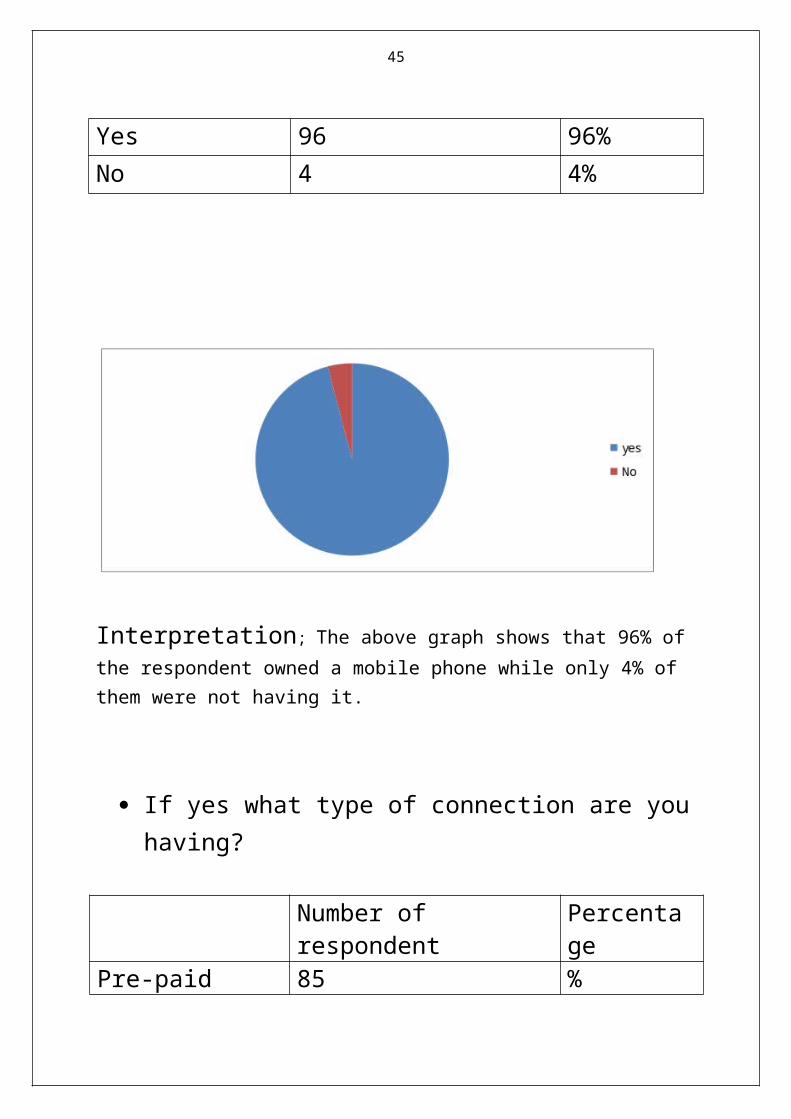
Do you have a mobile phone?
Number of respondent percentageYes 96 96%No 4 4%
Interpretation; The above graph shows that 96% of the respondent owned a
mobile phone while only 4% of them were not having it.
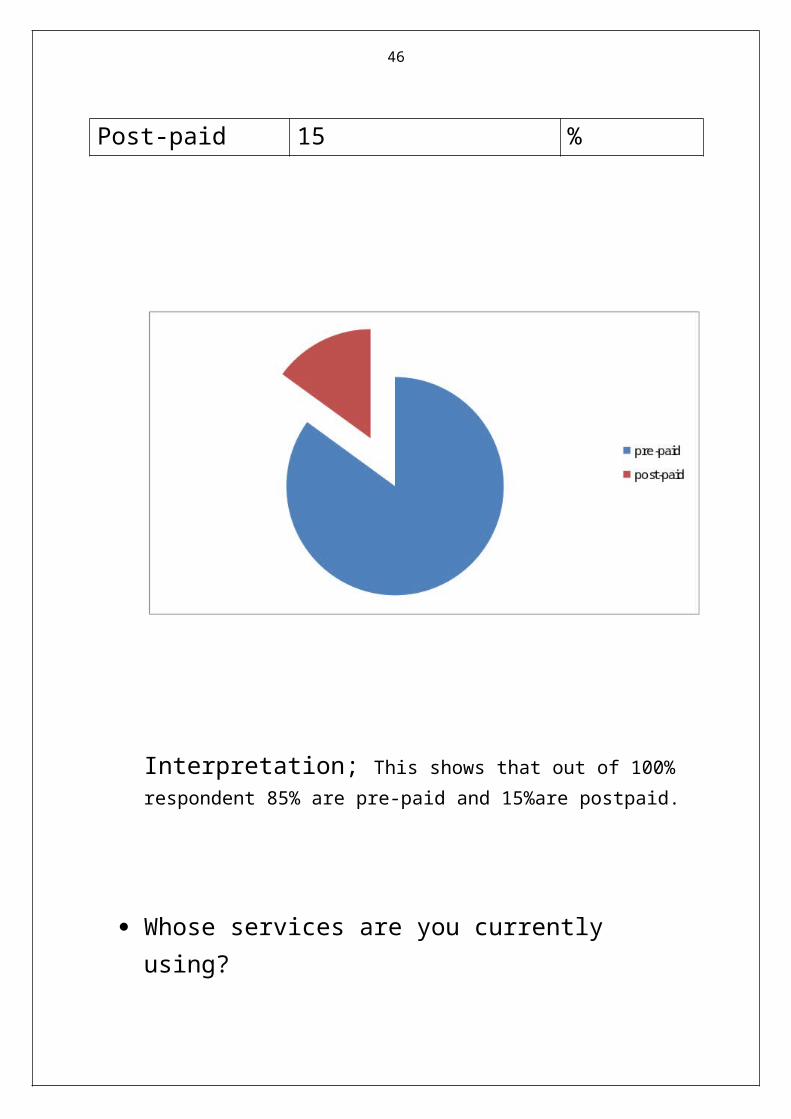
If yes what type of connection are you having?
Number of respondent PercentagePre-paid 85 %Post-paid 15 %

32
Interpretation; This shows that out of 100% respondent 85% are pre-
paid and 15%are postpaid.
Whose services are you currently using?
Number of Respondent Percentage Airtel 12 %Vodafone 18 %Reliance 15 %

33
Tata indicom 13 %BSNL 11 %Idea 19 %Others 12 %
Interpretation; In the 100 respondent 12%people are using Airtel,18% using
Vodafone and 15% using Relince and 13%Tata Docomo 11% BSNL and 19% Idea and only 12%people are using the other network services.
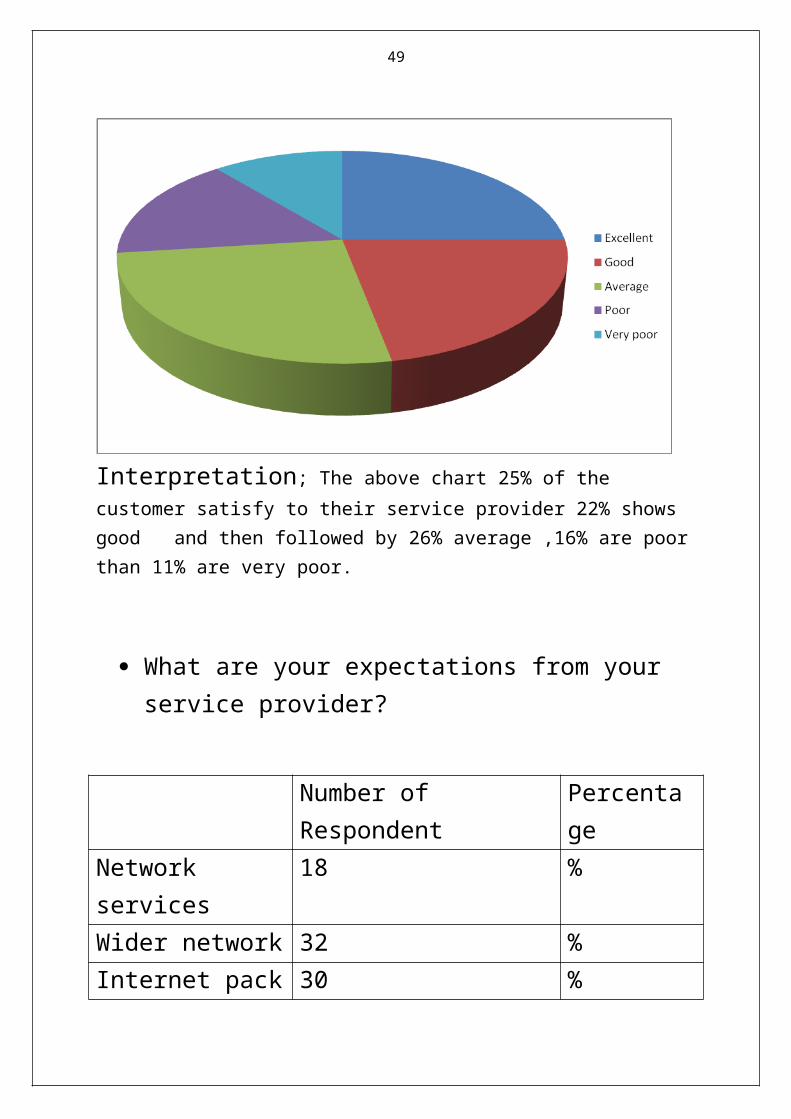
Overall how would you rate satisfaction level to your service provider?
Number of Respondent Percentage Excellent 25 %Good 22 %Average 26 %

34
Poor 16 %Very poor 11 %
Interpretation; The above chart 25% of the customer satisfy to their service
provider 22% shows good and then followed by 26% average ,16% are poor than 11% are very poor.
What are your expectations from your service provider?
Number of Respondent Percentage Network services 18 %Wider network 32 %Internet pack 30 %

35
Others 20 %
Interpretation; The above chart shows that only 18% of the
Respondent expects for network services,32 percent wants wider network and 30% internet pack and 20%people like other facility.
How long have you used this service?
Number of Respondent Percentage Less than 1 month 22 %1-6month 28 %6-8month 26 %Less than one year 18 %

36
More than 1 year 6
Interpretation; 22% customer use this service less than1month ,28% people
used 1-6month,26%used 6-8month,18% used less than one year and only 6% customer using more than one year
Do you call customer care?
Number of Respondent Percentage Yes 74 %No 26 %
-if yes then
37
Interpretation; In this above graph shows that only 74%customer call the customer care and only26% people do not call the customer care.
How much satisfied you with your customer care?
Number of Respondent Percentage Very satisfied 25 %Satisfied 23 %Neutral 10 %
38
Dissatisfied 16 %
Interpretation; The above pie chart shows that 25% customer are very
satisfied,23%satisfied,10%Neutral and 16%customer are dissatisfy.
How would you rate the service value for money?
Number of Respondent Percentage Excellent 26 %Good 20 %Fair 25 %Poor 18 %

39
Very poor 11 %
Interpretation; In this graph26%customer excellent ,20%Good25%fair and18%poor and only11%customer shows very poor for services value for money
Are you satisfied with your mobile services provider in terms of Network facility?
Number of Respondent Percentage Very satisfied 27 %Satisfied 21 %Neutral 27 %Dissatisfied 15 %

40
Highly dissatisfied 10 %
Interpretation; In the above chart27%customer are very satisfied,21%satisfied,27%Neutral,15%peopledissatisfy and only 10% people are highly dissatisfied.
Interpretation: - Above data analysis shows that most of the users of all companies are found satisfactory with the waiting time their queries resolved. But the result of BSNL is again not good as the users say that they have not talk to their customer care service provider even for a single time. Some of them have talk but after a lot of waiting time. So they are found not satisfied and rated this question also as dissatisfied and neutral. So after studying their views with a personal discussion we can not say that the customer care representatives of BSNL are not able to solve their customer queries in a satisfactory time.
Conclusion;
41
As per my belief we have seen that the choice of mobile handset and services can not be separated came out true because when we tried to find out the customer decision .we successfully classified customers in to eight group each with some special requirement service wise and handset’s attribute wise. Competition in telecom industry is heating up its time for Indian telecom players also to align up in the new dynamic business environment.
Telcom majors should think to launch the product according to the needs of customers to satisfy them and make them brand loyal as very soon this blue ocean of Indian telecom scenario will convert into red ocean where the loss of is the gain of other .They should also think for searching new space or we can say either creating a new blue space to sustain their growth in long run.
There is more room for data analysis but the rest of the part is beyond the scope of this project report According to the results, the most important determinant for consumers are price and sacrifice perception (monetary and non-monetary sacrifice), which in perception. These are periodical fixed cost, minute or traffic charge and opening cost when purchasing mobile phone. The results indicate that the minute charge is the most influential factor when a customer assesses to purchase. The second most important factor is the periodical fixed cost and another factor is the opening cost. These indicate, not surprisingly, that communication firms need to deeply consider. Also, this indicates that a lot of effort must be put in the pricing strategy.
Quality of service and the ability to attract and retain customers dictate the success or failure of next-generation communications service providers. In today’s competitive environment, customers are quick to abandon services that do not meet expectations. The ease with which customers can switch from their current service to another, demands that providers deliver the highest possible levels of service quality and performance. To be successful, communications service providers must deliver positive customer experiences with rich, value-added services supported by comprehensive service quality management. To this effect-Mobile services has experienced the negative attributes of not being customer focused and realizes that quality is an attribute that creates customer satisfaction profitably. Therefore quality must be fused with all resources channeled towards their customers
SUGGESTIONS

42
The following suggestions can be given after detailed and careful investigation of the research problem. These suggestions would definitely help the mobile phone service providers to enhance their subscriber base by delivering consumer satisfying services.
• All the mobile phone operators should emphasis m o r e o n t h e p o s t p a i d p l a n s b y m a k i n g consumers aware about the unique features of the plan and reducing monthly rentals.\
• Advertising campaigns focusing on family members and friends should be aggressively aired so that they can create new customers for the company among their family members, relatives and friends.
• Use of SMS, Voice mail and Internet among subscribers is very less and therefore, the use and features of these services should be p r o m o t e d a m o n g s u b s c r i b e r s t h r o u g h advertisements.
• Call tariff is the most influencing factor which induced consumers to buy a particular mobile phone operator. Therefore, call rates should be made competitive and affordable in order to capture more consumers.
• BSNL especially should revise their call rates as per the competition prevailing because their call rates are still very high in comparison to other mobile phone operators.
• Major efforts should be made in the area of improvement in the network coverage of mobile operators especially by BSNL and Reliance.
• As most of the consumers are unaware of the value added services offered by mobile phone service providers, aggressive
43
advertisements and s c h e m e s s h o u l d b e l a u n c h e d t o c r e a t e awareness and promote the use of these services.
• All the mobile phone operators should launch more and more periodical offers from time to time especially by BSNL.
• Customer care services play an important role in retaining consumers. Therefore, customer care services should be improved and there should be provisions of taking feedback from consumers so that necessary steps can be taken in this direction.
• Mobile phone operators should launch some scheme exclusively for senior citize , housewives and students.
• Necessary steps should be taken especially by BSNL and Reliance in solving the problems of poor network, cal l drop and poor clarity.I t is recommended that they should install more towers in order to have large network coverage area which ultimately brings clarity in network area.
• The process involved in taking new connection should be simplified and made easy.

44
BIBLIOGRAPHY
REFERANCES
1. Jallet, Frederic, “Yield management, Dynamic pricing and CRM in
telecommunications”,
(http://www.emeraldinsight.com/Insight/
viewContentItem.do;jsessionid=236E2B6B45CF101465D540FD4401AE
B9?
contentType=Article&hdAction=lnkhtml&contentId=1747102&history=t
rue>) [Viewed 13/3/09]
2. Debnath, Roma Mitra, “Benchmarking telecommunication service in
India”, 2008
(http://www.emeraldinsight.com/Insight/
viewContentItem.do;jsessionid=236E2B6B45CF101465D540FD4401AE
B9?
contentType=Article&hdAction=lnkhtml&contentId=1742535&history=t
rue>) [Viewed 2/3/09]
3. Robins, Fread, “The marketing of 3G”, vol 21, no 6, 2008
(http://www.emeraldinsight.com/Insight/
viewContentItem.do;jsessionid=236E2B6B45CF101465D540FD4401AE
B9?
contentType=Article&hdAction=lnkhtml&contentId=854647&history=tr
ue>) [Viewed 2/4/09]
4. Kalwani, Banumathy, “Consumer’s Attitude towards Cell phone
Services”, 2006
45
5. Fernandez, Fronnie, “Understanding Dynamics in an Evolving Industry:
Case of Mobile VAS in India”, 2007
(http://www.emeraldinsight.com/Insight/
viewContentItem.do;jsessionid=2086527F0757A565F9A6CBAC8800F6
58?
contentType=Article&hdAction=lnkhtml&contentId=881588&history=tr
ue>) [Viewed 4/4/09]
6. Kumar, Kaliyamoorthy, “Influence of Demographic Variables on
Marketing Strategies in the Competitive Scenario”, 2007
(http://www.emeraldinsight.com/Insight/
viewContentItem.do;jsessionid=2086527F0757A565F9A6CBAC8800F6
58?
contentType=Article&hdAction=lnkhtml&contentId=881588&history=tr
ue>) [Viewed 4/4/09]
7. Seth et, Etal, “Managing the Customer Perceived Service Quality for
Cellular Mobile Telephone: an Empirical Investigation”, 2008
(http://www.emeraldinsight.com/Insight/
viewContentItem.do;jsessionid=2086527F0757A565F9A6CBAC8800F6
58?
contentType=Book&hdAction=lnkhtml&contentId=1758667&history=tr
ue>) [Viewed 6/4/09]
8. Tecor, Jha, “Understanding Mobile Phone Usage Pattern among College-
Goers”, 2008
(http://www.emeraldinsight.com/Insight/
viewContentItem.do;jsessionid=2086527F0757A565F9A6CBAC8800F6
58?
46
contentType=Book&hdAction=lnkhtml&contentId=1760544&history=tr
ue>) [Viewed 7/4/09]
9. Bhatt, Andre, “A Study of Mobile Phone Usage Among the Post
Graduate Students”, 2008
10.Chris, Kambitsis, “Telecom advertising in print media”, 2003
Journal
The Indian Telecom Industry, IIM Calutta, Vatsal Goyal, 2007
Investment Surge in the Indian Telecom Space, Times Global, Issue 2, 2008
A multiple-perspective model for technology assessment, vol 3, 2008
The marketing of 3G, Vol 21, no. 6, 2003
ANNEXURE
Questionnaire
NAME- ___________________ MOBILE MODEL- ________
AGE- ________ OCCUPATION-_________________
Do you have a mobile phone?
Options Number of respondent percentageYes 96 96%No 4 4%Total 100 100

47
If yes what type of connection are you having?
Number of respondent PercentagePre-paid 85 85%Post-paid 15 15%
Whose services are you currently using?
Number of Respondent Percentage Airtel 12 12%Vodafone 18 18%Reliance 15 15%Tata indicom 13 13%BSNL 11 11%Idea 19 19%Others 12 12%
Overall how would you rate satisfaction level to your service provider?
Number of Respondent Percentage Excellent 25 25%
48
Good 22 22%Average 26 26%Poor 16 16%Very poor 11 11%
What are your expectations from your service provider?
Number of Respondent Percentage Network services 18 18%Wider network 32 32%Internet pack 30 30%Others 20 20%
How long have you used this service?
Number of Respondent Percentage Less than 1 month 22 22%1-6month 28 28%6-8month 26 26%Less than one year 18 18%More than 1 year 6 6%
Do you call customer care?
Number of Respondent Percentage Yes 74 74%No 26 26%
-if yes then
How much satisfied you with your customer care?
Number of Respondent Percentage
49
Very satisfied 25 25%Satisfied 23 23%Neutral 10 10%Dissatisfied 16 16%
How would you rate the service value for money?
Number of Respondent Percentage Excellent 26 26%Good 20 20%Fair 25 25%Poor 18 18%Very poor 11 11%
Are you satisfied with your mobile services provider in terms of Network facility?
Number of Respondent Percentage Very satisfied 27 27%Satisfied 21 21%Neutral 27 27%Dissatisfied 15 15%Highly dissatisfied 10 10%
Thank you for spending your precious time on filling in the questionnaire for us!


