Consumer Insight Maps: Design practice today is an...
7
PIIM IS A RESEARCH AND DEVELOPMENT FACILITY AT THE NEW SCHOOL © 2011 PARSONS JOURNAL FOR INFORMATION MAPPING AND PARSONS INSTITUTE FOR INFORMATION MAPPING 68 Fifth Avenue New York, NY 10011 THE PARSONS INSTITUTE FOR INFORMATION MAPPING 212 229 6825 piim.newschool.edu KEYWORDS Consumer maps, data visualization, frame- works, design process, design tools, insight communication, mapping, synthesis ABSTRACT It is now common practice to conclude the re- search or analysis phase of a design project with a “frame- work” to capture and describe the stable, structural aspects of the research findings. By definition, frameworks tend towards abstraction and simplification, thereby helping the core design team distill their insights. e downside of a framework is that abstraction and simplification make the work less useful and communicative to anyone who has not experienced the richness and full context of the data. In the conventional design process, this poses little problem, as the people who develop the tools also use the tools. In today’s more open design and innovation pro- cesses that engage multiple stakeholders, the framework’s abstraction is oſten confusing and can create a barrier to diffusion and implementation of ideas. is paper explores an alternative approach to quali- tative synthesis that uses the structural and cognitive affor- dances of maps to organize and display consumer insights while preserving critical detail. For convenience we call these Consumer Maps. By their nature, maps present key features in context, allowing the reader to orient to the ter- ritory, and deliver enough density to support macro and micro readings, while permitting the user to be self-di- rected in the process. In this paper, we explore Consumer Maps that share all of these attributes, and evaluate their potential as a tool for design and communication. Geographic maps have predictable organizing struc- tures—latitude, longitude, North, South, East, West—that create familiarity and allow end users to process the con- tent. What might be the equivalent for Consumer Maps? In this paper, we consider four candidate structures— zones, elevations, topographies, and blueprints—that design practitioners can use to develop Consumer Maps as powerful, visual story platforms that speak to diverse stakeholders. Consumer Insight Maps: e Map as Story Platform in the Design Process KIM ERWIN, MDes INTRODUCTION Design practice today is an increasingly open process. Complex challenges and organizational circumstances lead to expanding numbers of project stakeholders, the targeted engagement of more specialists, and core teams that have fewer people and less attention. Not surprisingly, this creates significant new communi- cation challenges. Project leaders must now connect to more people at key moments in the design and develop- ment process, but these individuals will not possess a full scope of the project and may have limited contextual understanding of the content. e conventional approach to capturing and distilling design insights is to create a summarizing “framework” that simplifies (and frequently visualizes, in diagram form) the high-level findings and linkages. e framework is an important point of convergence for core team members. However, in an open process, frameworks can lose their effectiveness. e insights they encode are only accessible with assistance. e paradox of the framework is that while it sim- plifies and sharpens meaning for an expert audience, it obscures and impedes meaning for the broader audience— an audience that may include stakeholders that are key to successful implementation. is paper explores one approach to help resolve this paradox: Consumer Insight Maps. By employing the tools and perspective of physical geography, Consumer Insight Maps promote emotional contact with research, showcase important complexity in consumers’ lives and support persistence of the consumer voice throughout (and oſten beyond) a design process. THE MAP AS COMMUNICATION PLATFORM ere is something about maps that is so fundamental, so basic to our cognitive processes and the way we think about the world, that the term is used metaphorically in just about every academic discipline. 1 In fact, we use the term “map” to describe almost any activity that concerns the organizing or planning of things that are complicated. But if the act of mapping seems innate, the understanding of maps is not. Comprehending maps is a complex process of percep- tion (the way our eyes feed information to the brain) and cognition (the way our brains interpret information, the actual act of “sense-making”). Successful maps have two central features that aid this process. First, maps present data in context, differentiating them from diagrams. is point is significant: most data representations show us data out-of-context, cutting away important details that provide nuance and interpretation (flattening the depth), or separating the data out from
Transcript of Consumer Insight Maps: Design practice today is an...
PIIM IS A RESEARCH AND DEVELOPMENT FACILITY AT THE NEW SCHOOL
© 2011 PARSONS JOURNAL FOR INFORMATION MAPPING AND PARSONS INSTITUTE FOR INFORMATION MAPPING
68 Fifth Avenue New York, NY 10011
THE PARSONS INSTITUTE FOR INFORMATION MAPPING
212 229 6825piim.newschool.edu
KEYWORDS Consumer maps, data visualization, frame-works, design process, design tools, insight communication, mapping, synthesis ABSTRACT It is now common practice to conclude the re-search or analysis phase of a design project with a “frame-work” to capture and describe the stable, structural aspects of the research findings. By definition, frameworks tend towards abstraction and simplification, thereby helping the core design team distill their insights. The downside of a framework is that abstraction and simplification make the work less useful and communicative to anyone who has not experienced the richness and full context of the data. In the conventional design process, this poses little problem, as the people who develop the tools also use the tools. In today’s more open design and innovation pro-cesses that engage multiple stakeholders, the framework’s abstraction is often confusing and can create a barrier to diffusion and implementation of ideas.
This paper explores an alternative approach to quali-tative synthesis that uses the structural and cognitive affor-dances of maps to organize and display consumer insights while preserving critical detail. For convenience we call these Consumer Maps. By their nature, maps present key features in context, allowing the reader to orient to the ter-ritory, and deliver enough density to support macro and micro readings, while permitting the user to be self-di-rected in the process. In this paper, we explore Consumer Maps that share all of these attributes, and evaluate their potential as a tool for design and communication.
Geographic maps have predictable organizing struc-tures—latitude, longitude, North, South, East, West—that create familiarity and allow end users to process the con-tent. What might be the equivalent for Consumer Maps? In this paper, we consider four candidate structures—zones, elevations, topographies, and blueprints—that design practitioners can use to develop Consumer Maps as powerful, visual story platforms that speak to diverse stakeholders.
Consumer Insight Maps: The Map as Story Platform in the Design ProcessKIM ERWIN, MDes
INTRODUCTION Design practice today is an increasingly open process. Complex challenges and organizational circumstances lead to expanding numbers of project stakeholders, the targeted engagement of more specialists, and core teams that have fewer people and less attention. Not surprisingly, this creates significant new communi-cation challenges. Project leaders must now connect to more people at key moments in the design and develop-ment process, but these individuals will not possess a full scope of the project and may have limited contextual understanding of the content.
The conventional approach to capturing and distilling design insights is to create a summarizing “framework” that simplifies (and frequently visualizes, in diagram form) the high-level findings and linkages. The framework is an important point of convergence for core team members. However, in an open process, frameworks can lose their effectiveness. The insights they encode are only accessible with assistance.
The paradox of the framework is that while it sim-plifies and sharpens meaning for an expert audience, it obscures and impedes meaning for the broader audience—an audience that may include stakeholders that are key to successful implementation.
This paper explores one approach to help resolve this paradox: Consumer Insight Maps. By employing the tools and perspective of physical geography, Consumer Insight Maps promote emotional contact with research, showcase important complexity in consumers’ lives and support persistence of the consumer voice throughout (and often beyond) a design process.
THE MAP AS COMMUNICATION PLATFORM
There is something about maps that is so fundamental, so basic to our cognitive processes and the way we think about the world, that the term is used metaphorically in just about every academic discipline.1 In fact, we use the term “map” to describe almost any activity that concerns the organizing or planning of things that are complicated. But if the act of mapping seems innate, the understanding of maps is not.
Comprehending maps is a complex process of percep-tion (the way our eyes feed information to the brain) and cognition (the way our brains interpret information, the actual act of “sense-making”). Successful maps have two central features that aid this process.
First, maps present data in context, differentiating them from diagrams. This point is significant: most data representations show us data out-of-context, cutting away important details that provide nuance and interpretation (flattening the depth), or separating the data out from
CONSUMER INSIGHT MAPS: THE MAP AS STORY PLATFORM IN THE DESIGN PROCESSKIM ERWIN, MDes
PARSONS JOURNAL FOR INFORMATION MAPPINGVOLUME I I I ISSUE 1, WINTER 2011[PAGE 2]
© 2011 PARSONS JOURNAL FOR INFORMATION MAPPING AND PARSONS INSTITUTE FOR INFORMATION MAPPING
adjacent data that create important contrast and context (limiting the spread). Showing data in context, therefore, is critical to efficient and accurate cognition.
Second, maps have an underlying structure or coordi-nate system that organizes the information into a continu-ous, navigable topography with defined boundaries and details. This structure is often overlaid with data that has been visually coded (by color, shape, size, etc.). Both the underlying structure and visual coding are important be-cause they can accelerate (or hinder) the viewer’s percep-tion of the data.
As visual coding is a native skill for designers, the rest of this paper focuses on how designers might conceive new structures to convey qualitative insights in context.
CREATING CONSUMER MAPS:
THE CHALLENGE OF STRUCTURE
Making the content of a map accessible and useful requires an underlying structure that feels familiar, allows the viewer to ori-ent quickly and to be self-directed in their reading. Geographic maps have predictable organizing structures—latitude, longitude, North, South, East and West—that create familiarity and allow end users to process the content quickly. What might be the equivalent structures for Consumer Maps?
Over the past twenty years, it has be-come conventional in design research to use temporal maps to analyze and illustrate cus-tomer behaviors and experiences. As a result, practitioners now have standard time-based visualizations—experience maps, journey maps and, more recently, Stuart Karten’s mode maps2—that can be deployed to tell in-teresting research stories without overwhelm-ing amounts of labor. These early explorations have solidified into repeatable design tools.
But what about spatial constructs? Spatial reasoning is something most of us do in-stinctively.3 Below are four spatial structures borrowed from cartographic and architectural conventions—zones, topographies, elevations and blueprints. Each of these has been used to shape research insights into Consumer Maps.
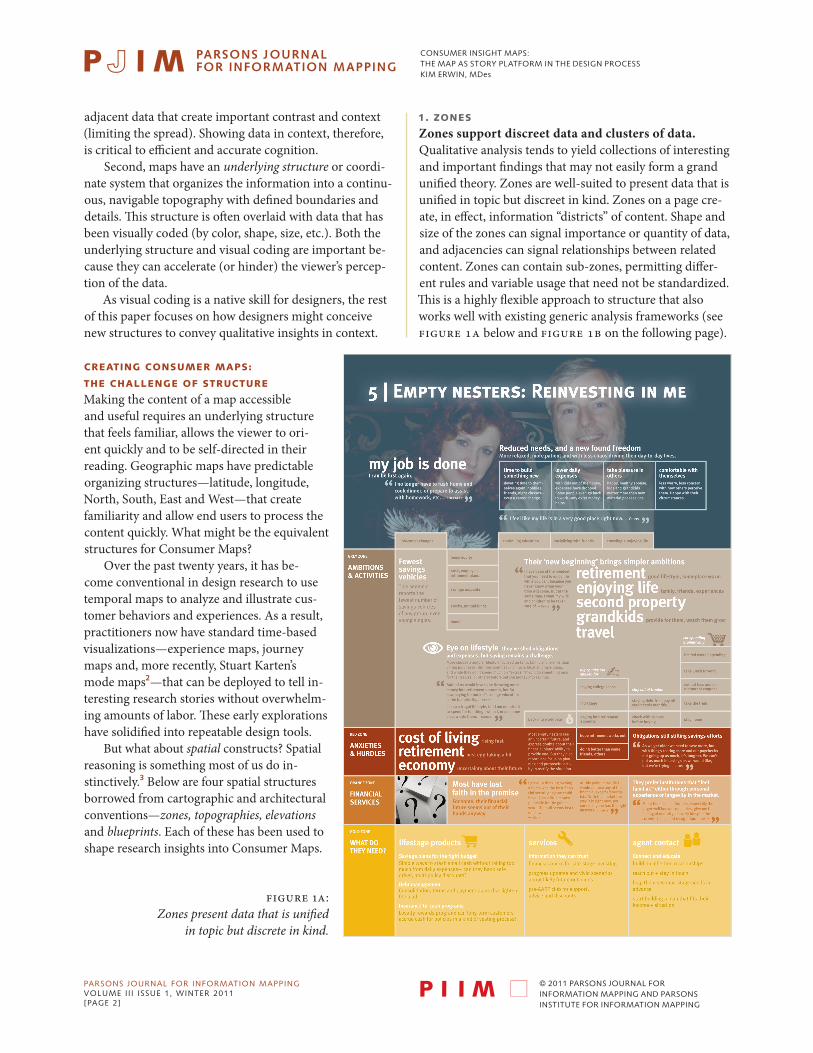
1. ZONES Zones support discreet data and clusters of data. Qualitative analysis tends to yield collections of interesting and important findings that may not easily form a grand unified theory. Zones are well-suited to present data that is unified in topic but discreet in kind. Zones on a page cre-ate, in effect, information “districts” of content. Shape and size of the zones can signal importance or quantity of data, and adjacencies can signal relationships between related content. Zones can contain sub-zones, permitting differ-ent rules and variable usage that need not be standardized. This is a highly flexible approach to structure that also works well with existing generic analysis frameworks (see Figure 1A below and Figure 1B on the following page).
Figure 1A:Zones present data that is unified
in topic but discrete in kind.
CONSUMER INSIGHT MAPS: THE MAP AS STORY PLATFORM IN THE DESIGN PROCESSKIM ERWIN, MDes
PARSONS JOURNAL FOR INFORMATION MAPPINGVOLUME I I I ISSUE 1, WINTER 2011[PAGE 3]
© 2011 PARSONS JOURNAL FOR INFORMATION MAPPING AND PARSONS INSTITUTE FOR INFORMATION MAPPING
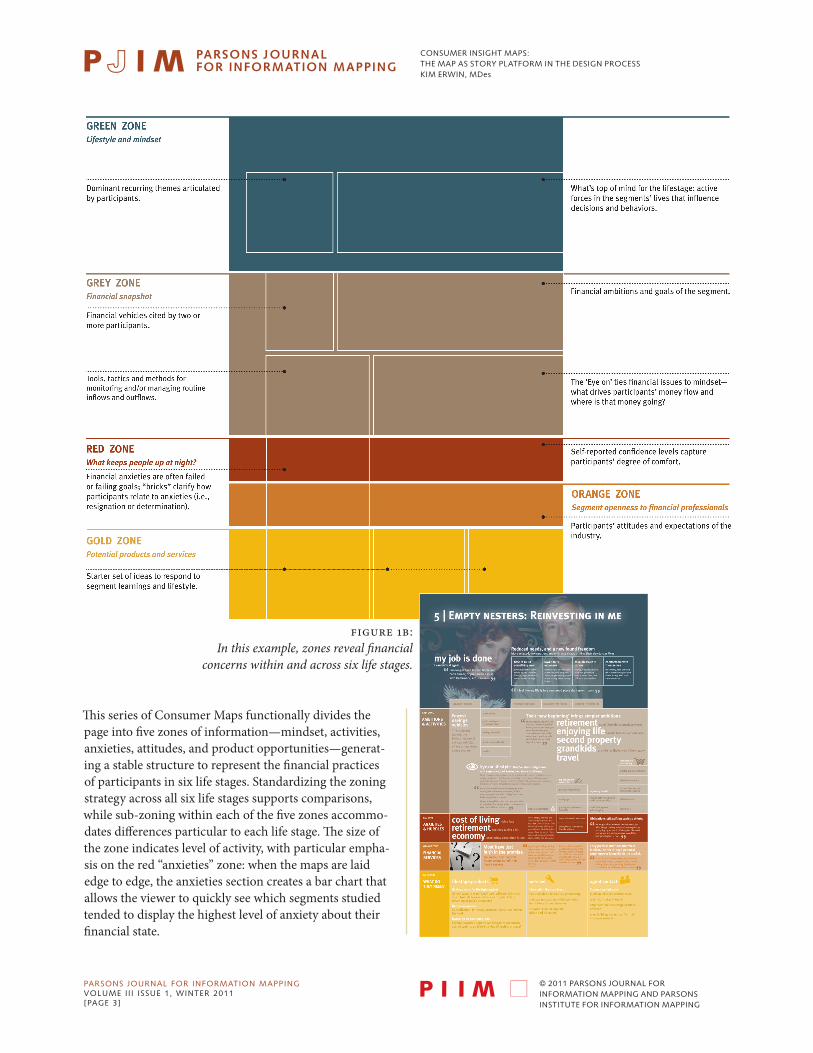
Figure 1B: In this example, zones reveal financial
concerns within and across six life stages.
This series of Consumer Maps functionally divides the page into five zones of information—mindset, activities, anxieties, attitudes, and product opportunities—generat-ing a stable structure to represent the financial practices of participants in six life stages. Standardizing the zoning strategy across all six life stages supports comparisons, while sub-zoning within each of the five zones accommo-dates differences particular to each life stage. The size of the zone indicates level of activity, with particular empha-sis on the red “anxieties” zone: when the maps are laid edge to edge, the anxieties section creates a bar chart that allows the viewer to quickly see which segments studied tended to display the highest level of anxiety about their financial state.

CONSUMER INSIGHT MAPS: THE MAP AS STORY PLATFORM IN THE DESIGN PROCESSKIM ERWIN, MDes
PARSONS JOURNAL FOR INFORMATION MAPPINGVOLUME I I I ISSUE 1, WINTER 2011[PAGE 4]
© 2011 PARSONS JOURNAL FOR INFORMATION MAPPING AND PARSONS INSTITUTE FOR INFORMATION MAPPING
2. TOPOGRAPHIES
Topographies support data that fall in a series, on a spectrum, or a scale. A team on a tight timeline will often revert to simple analytic approaches, e.g., ranking or ordering user behaviors using loose metrics like good/better/best or positive/negative/neutral. By “matrixing” a generic ranking system with project-specific points of interest, the team can break big data into smaller, more organized data collections. With an underlying grid established, the analyst can plot diverse elements —stories, images, examples, quotes—to create a contiguous field of data over an ordered background using prox-imity and separation to generate a meaningful topography.
Figure 2: Topographic visualization is deployed
here to chart moms’ nutrition practices.
This Consumer Map employs a scale of good/better/best to organize nutrition practices against four consumer-defined categories of concern when making healthy meals. With this underlying matrix to organize the data, map elements are then placed and visually coded by shape to distinguish study segments (triangles for convenience-focused moms and circles for holistic health-focused moms) and by color to identify different tactics (planning-oriented tactics, of particular interest to the hypothetical client, are called out in pink).
User group 1 description User group 2 description
Summarizes the circumstances of the two study segments, as well as general patterns of needs and challenges related to the client’s objectives.
Project context
2 Activities 3 Solutions 4 Objectives1 Food
Better
Best
Good
All meal-related in nature, these topics cover the range of issues and concerns users articulated or chose to document: from eating local to what constitutes “cooking” to how to get food on the table.
User’s reported and documented practices are categorized for how well they meet users’ stated objectives and standards for food and meal preparation.
Ranking user practices
4 areas of inquiry
© A
NA
LYS
IS A
ND
DE
SIG
N B
Y D
AN
IA P
ET
ER
SE
N,
DE
SIG
N P
LA
NN
ER
, M
DE
S 2
01
0,
IIT
IN
ST
ITU
TE
OF
DE
SIG
N

CONSUMER INSIGHT MAPS: THE MAP AS STORY PLATFORM IN THE DESIGN PROCESSKIM ERWIN, MDes
PARSONS JOURNAL FOR INFORMATION MAPPINGVOLUME I I I ISSUE 1, WINTER 2011[PAGE 5]
© 2011 PARSONS JOURNAL FOR INFORMATION MAPPING AND PARSONS INSTITUTE FOR INFORMATION MAPPING
3. ELEVATIONS
Elevations compare data with hierarchy or layers of insight. For study purposes, design teams often place a client-articulated challenge, say online shop-ping, into a larger domain of concern, like caring for home and family. This opens up the aperture on the design problem, and reveals layers of context and meaning to generate a more holistic picture. Elevations, a convention used in cartography and architecture, are well-suited to convey layers, hierar-chy, and progression in data. Elevations are typically used to display levels of structure, but can also show progression along conceptual dimensions. Com-mon progressions that are useful in analysis and amenable to elevation structures include: concrete to abstract (user objectives); basic to most advanced (user practices); and essential to aspirational (user wants and needs).
This Consumer Map gives insight into the complex physical and emotional challenges of home cooking. The horizontal axis organizes two modes of nightly meal prep (gleaned from research). The vertical axis outlines five levels of user objectives, ranging from concrete—getting dinner on the table—to most abstract—building family identity and fulfillment through cooking.
The map elements are stories and quotes from research participants, with added visual coding to distinguish meal prep factors (horizontal lines) from barriers (vertical lines); additionally, line color distin-guishes different family members.
Figure 3: An elevation can be used to describe five levels of objectives present when cooking for family.
© A
NA
LYS
IS A
ND
DE
SIG
N B
Y T
HO
M V
AN
DE
R D
OE
F,
DE
SIG
N P
LA
NN
ER
, M
DE
S 2
010,
IIT
IN
ST
ITU
TE
OF
DE
SIG
N
CONSUMER INSIGHT MAPS: THE MAP AS STORY PLATFORM IN THE DESIGN PROCESSKIM ERWIN, MDes
PARSONS JOURNAL FOR INFORMATION MAPPINGVOLUME I I I ISSUE 1, WINTER 2011[PAGE 6]
© 2011 PARSONS JOURNAL FOR INFORMATION MAPPING AND PARSONS INSTITUTE FOR INFORMATION MAPPING
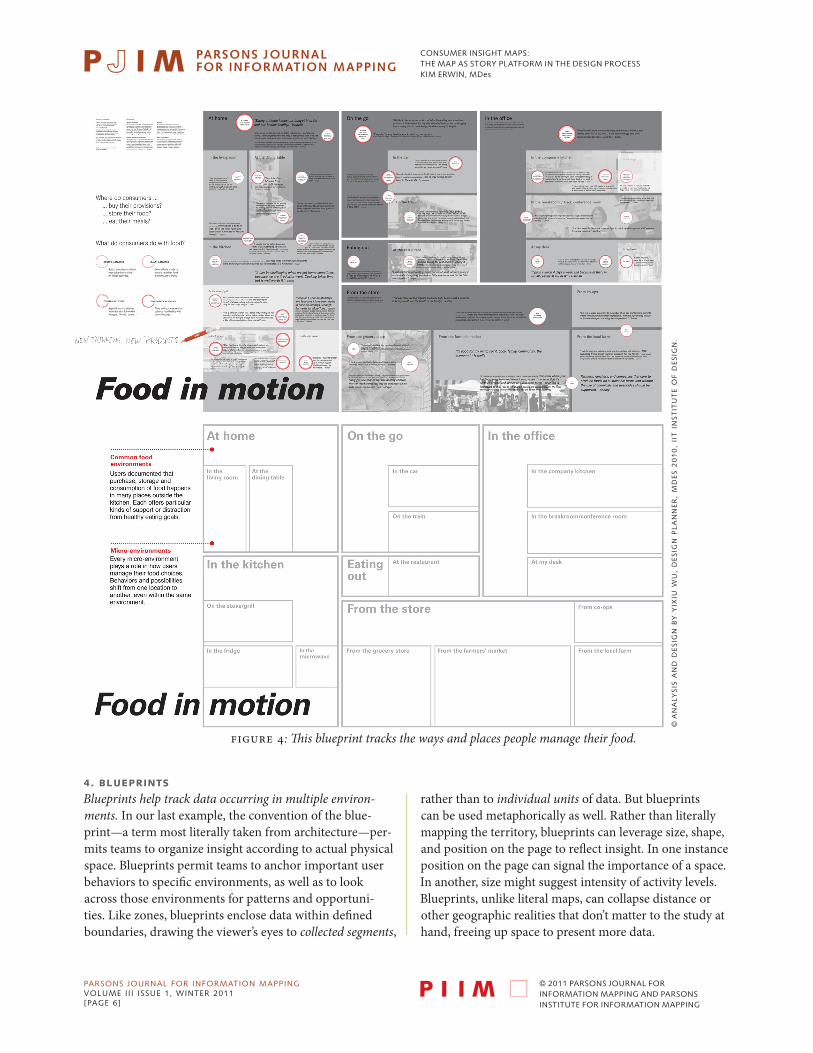
4. BLUEPRINTS
Blueprints help track data occurring in multiple environ-ments. In our last example, the convention of the blue-print—a term most literally taken from architecture—per-mits teams to organize insight according to actual physical space. Blueprints permit teams to anchor important user behaviors to specific environments, as well as to look across those environments for patterns and opportuni-ties. Like zones, blueprints enclose data within defined boundaries, drawing the viewer’s eyes to collected segments,
rather than to individual units of data. But blueprints can be used metaphorically as well. Rather than literally mapping the territory, blueprints can leverage size, shape, and position on the page to reflect insight. In one instance position on the page can signal the importance of a space. In another, size might suggest intensity of activity levels. Blueprints, unlike literal maps, can collapse distance or other geographic realities that don’t matter to the study at hand, freeing up space to present more data.
Figure 4: This blueprint tracks the ways and places people manage their food.
© A
NA
LYS
IS A
ND
DE
SIG
N B
Y Y
IXIU
WU
, D
ES
IGN
PL
AN
NE
R,
MD
ES
20
10
, II
T I
NS
TIT
UT
E O
F D
ES
IGN
.
CONSUMER INSIGHT MAPS: THE MAP AS STORY PLATFORM IN THE DESIGN PROCESSKIM ERWIN, MDes
PARSONS JOURNAL FOR INFORMATION MAPPINGVOLUME I I I ISSUE 1, WINTER 2011[PAGE 7]
© 2011 PARSONS JOURNAL FOR INFORMATION MAPPING AND PARSONS INSTITUTE FOR INFORMATION MAPPING
After asking study participants to document their eat-ing activities for ten days, this Consumer Map organizes that data by reported locations for food purchase, prep and consumption. The blueprint clusters seventeen report-ed food activity locations into five larger locations. The structure is populated with map elements in the form of user pictures, stories, and quotes. Food-related activities are called out in red circles; they are visually coded by line pattern to distinguish between routine, healthy, conve-nience, and coveted activities and then coded again by size to signal importance.
CONCLUSION
Consumer Insight Maps are designed to take the complex-ity of consumers’ lives—the dense, messy, interconnected ambitions, activities, anxieties that thread throughout their days—and flatten them out so that we might examine them more systematically.
But in addition to organizing findings, Insight maps have more general utility to design teams and the organi-zations that hire them. They:
1. Externalize what we know—take all the disjointed facts and scattered insights and push them to-gether.
2. Put everything in one place—allow us to see everything all at once (a powerful advantage over sequential tools such as design briefs or presenta-tion decks).
3. Organize that information by some larger system that helps clarify the relationship between bits of information.
4. Create a whole from parts and pieces, integrat-ing separate but related elements into a cohesive construct that provides a new way to analyze and comprehend many variables.
5. Allow us to share that information with others, sup-ports discussion and collective analysis.
6. Support quick retrieval of information and repeated referencing because it’s externalized into one visual plane.
7. Enable the creation of many itineraries from the same topographic understanding; internal and external teams can revisit the map over time and
derive new and significant information as their focus and tasks evolve.
8. Create a permanent record that can be referred to and added to over time. The map grows as the team understanding grows. In today’s dynamic environments, data persistence is highly valuable.
The central challenge in developing Consumer Insight Maps as a broadly useful tool in the design process is to make them easier and more efficient to produce. Con-sumer Insight Maps today are precious, singular artifacts. In the future, with a good understanding of how differ-ent structures might be best suited for particular types of findings and particular types of organizational users, Consumer Insight Maps can become a mainstay of the open design process.
BIOGRAPHY
Kim Erwin is a visiting associate professor at the IIT Insti-tute of Design since 2009, having been a member of the school’s adjunct faculty since 2006. In her fifteen years of practice, Kim has specialized in the communication and application of strategic user research, first with innova-tion planning firm Doblin and then as an independent consultant. Her research and teaching focus on the most information-intensive aspects of design practice—in particular the conversion of user research and secondary research into stories and frameworks that designers and business leaders can use as a basis for action.
NOTES
1 Arthur H. Robinson and Barbara Bartz Petchenik, The Nature of Maps: Essays toward Understanding Maps and Mapping (Chicago: University of Chicago Press, 1976), 1–22.
2 Helen Walters, “Design Research Conference Re-port,” Businessweek.com (September 24, 2007).
3 Arthur H. Robinson and Barbara Bartz Petchenik, The Nature of Maps, 86.