Consumer Ethnocentrism: a Concept to Support the Increase ...
19
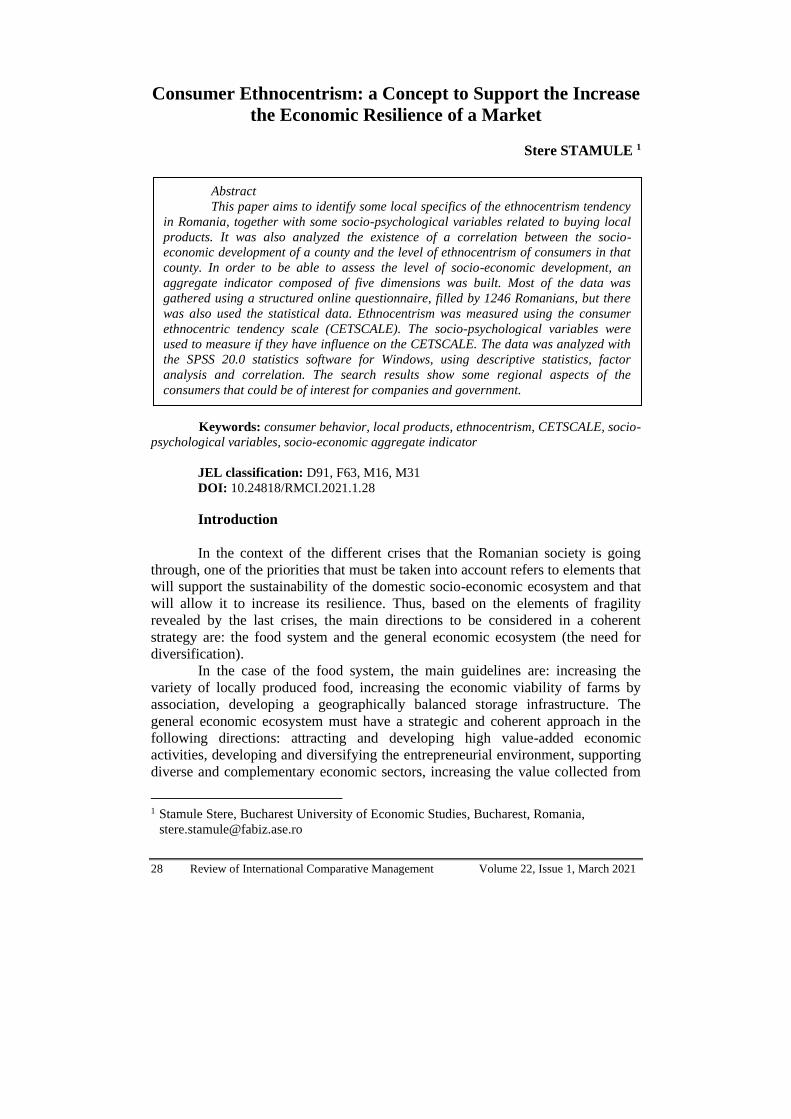
28 Review of International Comparative Management Volume 22, Issue 1, March 2021 Consumer Ethnocentrism: a Concept to Support the Increase the Economic Resilience of a Market Stere STAMULE 1 Keywords: consumer behavior, local products, ethnocentrism, CETSCALE, socio- psychological variables, socio-economic aggregate indicator JEL classification: D91, F63, M16, M31 DOI: 10.24818/RMCI.2021.1.28 Introduction In the context of the different crises that the Romanian society is going through, one of the priorities that must be taken into account refers to elements that will support the sustainability of the domestic socio-economic ecosystem and that will allow it to increase its resilience. Thus, based on the elements of fragility revealed by the last crises, the main directions to be considered in a coherent strategy are: the food system and the general economic ecosystem (the need for diversification). In the case of the food system, the main guidelines are: increasing the variety of locally produced food, increasing the economic viability of farms by association, developing a geographically balanced storage infrastructure. The general economic ecosystem must have a strategic and coherent approach in the following directions: attracting and developing high value-added economic activities, developing and diversifying the entrepreneurial environment, supporting diverse and complementary economic sectors, increasing the value collected from 1 Stamule Stere, Bucharest University of Economic Studies, Bucharest, Romania, [email protected] Abstract This paper aims to identify some local specifics of the ethnocentrism tendency in Romania, together with some socio-psychological variables related to buying local products. It was also analyzed the existence of a correlation between the socio- economic development of a county and the level of ethnocentrism of consumers in that county. In order to be able to assess the level of socio-economic development, an aggregate indicator composed of five dimensions was built. Most of the data was gathered using a structured online questionnaire, filled by 1246 Romanians, but there was also used the statistical data. Ethnocentrism was measured using the consumer ethnocentric tendency scale (CETSCALE). The socio-psychological variables were used to measure if they have influence on the CETSCALE. The data was analyzed with the SPSS 20.0 statistics software for Windows, using descriptive statistics, factor analysis and correlation. The search results show some regional aspects of the consumers that could be of interest for companies and government.
Transcript of Consumer Ethnocentrism: a Concept to Support the Increase ...
28 Review of International Comparative Management Volume 22 Issue 1 March 2021
Consumer Ethnocentrism a Concept to Support the Increase
the Economic Resilience of a Market
Stere STAMULE 1
Keywords consumer behavior local products ethnocentrism CETSCALE socio-
psychological variables socio-economic aggregate indicator
JEL classification D91 F63 M16 M31
DOI 1024818RMCI2021128
Introduction
In the context of the different crises that the Romanian society is going
through one of the priorities that must be taken into account refers to elements that
will support the sustainability of the domestic socio-economic ecosystem and that
will allow it to increase its resilience Thus based on the elements of fragility
revealed by the last crises the main directions to be considered in a coherent
strategy are the food system and the general economic ecosystem (the need for
diversification)
In the case of the food system the main guidelines are increasing the
variety of locally produced food increasing the economic viability of farms by
association developing a geographically balanced storage infrastructure The
general economic ecosystem must have a strategic and coherent approach in the
following directions attracting and developing high value-added economic
activities developing and diversifying the entrepreneurial environment supporting
diverse and complementary economic sectors increasing the value collected from
1 Stamule Stere Bucharest University of Economic Studies Bucharest Romania
sterestamulefabizasero
Abstract
This paper aims to identify some local specifics of the ethnocentrism tendency
in Romania together with some socio-psychological variables related to buying local
products It was also analyzed the existence of a correlation between the socio-
economic development of a county and the level of ethnocentrism of consumers in that
county In order to be able to assess the level of socio-economic development an
aggregate indicator composed of five dimensions was built Most of the data was
gathered using a structured online questionnaire filled by 1246 Romanians but there
was also used the statistical data Ethnocentrism was measured using the consumer
ethnocentric tendency scale (CETSCALE) The socio-psychological variables were
used to measure if they have influence on the CETSCALE The data was analyzed with
the SPSS 200 statistics software for Windows using descriptive statistics factor
analysis and correlation The search results show some regional aspects of the
consumers that could be of interest for companies and government
Review of International Comparative Management Volume 22 Issue 1 March 2021 29
taxes without increasing the tax burden (Strat amp Vuță 2020) The volume of
Romaniarsquos agricultural trade requires an increase in the competitiveness of the
agricultural sector and a diversification of the food processing industry (Andrei
Popescu Nica amp Chivu 2020) Regarding the diversification of the entrepreneurial
environment this might also occur due to the pandemic where the flexible working
schedule could have become a competitive advantage for the organizations (Dima
Țuclea Vracircnceanu amp Țigu 2019) Sustainability could be achieved through an
increase of performance on three levels ndash economic social and enivironment
which is usually happening in countries with consistent development policies
implementations (Subic Vasiljevic amp Andrei 2010)
Regarding the trade situation in 2019 Romanias imports were 863 billion
euros and exports 69 billion euros Romania registering a negative trade balance
worth 173 billion euros 22 billion euros higher than in 2018 given that exports
increased by 19 and imports by 42 (see tabel 1) This data confirms the results
of a former study conducted by Miron Dima amp Vasilache (2010) that the
economy will be dependent of the imports which is affecting the sustainable
development of the economy (p31) These reinforce the idea of the need to
increase the consumption of local products
Table 1 The evolution of Romanias trade balance
Year Import (bn euro) Export (bn Euro) Trade deficit
2014 585 524 61
2015 629 546 83
2016 673 573 99
2017 756 626 13
2018 828 677 151
2019 863 69 173
Source INS press release no 12011 May 2020 (data processed by the author)
This paper is structured as follows in Section 2 it is presented the
literature review on the impact of demographic and socio-psychological factors on
consumerrsquos ethnocentric tendencies The conceptual framework aim research
methodology and data are described in Section 3 and research findings are offered
in Section 4 Section 5 presents concluding comments
1 Theoretical background
One of the most well-known concepts regarding the consumption of local
products is consumer ethnocentrism which was mainly researched by Shrimp amp
Sharma (1987) who developed the consumer ethnocentric tendency scale
(CETSCALE) The term bdquoConsumer ethnocentrismrdquo it is used to represent the
beliefs held by the consumers about the appropriateness indeed morality of
purchasing foreign products
30 Review of International Comparative Management Volume 22 Issue 1 March 2021
According to the synthesis made by Shankarmahesh (2006) based on 37
studies conducted in Australia Austria Great Britain Canada China Czech
Republic France Hong Kong Japan South Korea Malta Mexico New Zealand
Poland Russia Singapore Turkey and the United States from 1964 to 2002 there
were four main antecedents of consumer ethnocentrism identified namely socio-
psychological economic political and demographic Socio-psychological background includes animosities collectivism
conservatism cultural openness dogmatism perceived fear inclination to the problems of global humanity the list of values materialism and patriotism
The economic background includes capitalism the level of economic development a growing national economy and a growing personal financial situation
Regarding the socio-psychological background for this study will be of interest the following notions salience empathy and responsibility
Perceived fear (salience) One of the essential facets of CET is the way its morality is perceived This translates into ethnocentric consumers who consider buyers of foreign products morally responsible for the difficulties of local workers (Kral et al 2020) who lose their jobs due to international competition Olsen Granzin amp Biswas (1993) looked at consumer cooperation in buying local goods as a form of helping behavior This construct refers to the perceived fear of workers and local industry which would be affected In fact Rosenblatt (1964) mentioned that the perception of fear by the group is in a positive relationship with ethnocentrism Olsen et al (1993) found empirical support to emphasize the positive relationship between perceived fear and CET Sharma Shimp amp Shin (1995) included the fear variable perceived as a moderator in their conceptual model which the authors explain as follows ldquoWhen a country feels attacked or threatened by external competition foreignness takes on a negative connotation and nationalism and ethnocentrism is on the rise Fear of losing their jobs could influence consumers reactions to imports
The authors found strong empirical support for the moderating role of perceived fear in the relationship between CET and attitudes towards imported goods Whether perceived fear is a precedent for CET or a moderator between CET and attitudes or a desire to buy foreign goods is still a matter for debate even if there is sufficient evidence for both perspectives
Consequences through mediators Olsen et al (1993) proposed the following elements perceived equity empathy costs and responsibility as possible mediators between CET and the desire to buy imported goods Regarding consumer ethnonationalism the authors argued that it has a negative influence on perceived equity Ethnocentric consumers would consider international competition unfair to local industry The decrease in perceived equity will then influence consumers to buy local goods instead of foreign goods Empathy is the ability to understand a persons perception of a situation and their cognitive and emotional response to a situation Consumer ethnonationalism positively influences empathic feelings for others considered to be similar to those of the consumer This connection is similar to Rosenblatts (1964) hypothesis that high
Review of International Comparative Management Volume 22 Issue 1 March 2021 31
ethnocentrism will increase the solidarity of those within the group High empathy for the group will later influence the desire to buy local products Olsen et al (1993) considered that a high ethnonational identity will lower the costs of collaboration between group members In other words ethnocentric consumers tend to disregard the additional costs of buying local products The reasoning is consistent due to an important property of CET namely price inelasticity Responsibility is defined as accepting an obligation According to the authors Olsen et al (1993) as perceived equity decreases perceived consumer responsibility increases leading to a desire to buy local products The empirical research conducted by the authors based on a very large number of American respondents supports the role played by each mediation variable described above
In the literature the concepts of local product regional product traditional product are recognized as independent concepts but in practice many foods use a mix of these concepts Therefore researchers such as Fernaacutendez-Ferriacuten amp Bande-Vilela (2013) examined the value of foods with local regional and traditional characteristics as well as the possible link between the level of consumer ethnocentrism and the actual purchasing power of local-regional-traditional food
Fernaacutendez‐Ferriacuten Bande Calvo‐Turrientes amp Galaacuten‐Ladero (2017) focused on researching the influence of parents on the level of regional ethnocentrism of their children The model proposed by them considers that the levels of regional identity and regional ethnocentrism of parents are potential antecedents of ethnocentrism among their children The exploratory analysis presented by them supports the hypothesis that consumer ethnocentrism is a general trend acquired in childhood through the process of socialization
2 Conceptual framework
An examination of an Eastern European country that entered the European
Union in 2007 was a good reason for the current study Even if the country had some struggles navigating from a centralized regime to a free market economy it had achieved a GDP per capita adjusted for purchase power parity of over $29900 in 2019 (World Bank 2021) However taking into account both the existence of a large number of imported goods and a limited number of domestic goods and the great openness of the Romanian economy it is considered necessary to research the preferences and inclinations of Romanian consumers in this context Similar studies have been conducted in CEE (Vida amp Reardon 2008 Iacob Kuada amp Lawson 2014) Thus the present study has several objectives to be presented below First of all we want to apply the CET scale very rarely used in Romania to assess the ethnocentrism of the Romanian consumer On this occasion both its reliability and unidimensionality will be checked Secondly it will be observed how the demographic factors the region and the place of residence (rural vs urban) influence the results of the ethnocentrism of the Romanian consumers Thirdly the identification of the correlations between socio-psychological variables and CETSCALE Fourthly the identification of the correlations between the level of development of each county in Romania and its CETSCALE score
32 Review of International Comparative Management Volume 22 Issue 1 March 2021
21 Aim research methodology and data
The motivation for choosing this theme lies in the fact that the worldrsquos
economy has undergone changes as a result of the impact of the global crisis
especially in terms of consumer choices
The main objective of the research is to identify the degree of
ethnocentrism and some its influencing factors among consumers on the Romanian
market
The secondary objectives of this paper is to identify regions with
ethnocentric consumption potential an important component for the creation of a
sustainable economy It is desired to identify the regions with the potential to
develop the production of local goods and their promotion campaigns as well as
identifying some correlations between a social-development aggregated indicator
and the ethnocentric consumers All these secondary objectives converge towards
the main objective
Trends in consumer ethnocentrism were measured based on an online
questionnaire sent to e-mail addresses and completed by 1246 randomly selected
respondents from a database The final questionnaire has 41 questions and is made
up of five parts Recent studies have analyzed the use of the questionnaire
completed with pencil versus the one completed online and it has been shown that
there are no differences in response style (De Jong Steenkamp Fox amp
Baumgartner 2008)
Of interest to this paper is the third part of the questionnaire which aimed
to measure certain antecedents and moderators of consumer ethnocentrism The
socio-psychological antecedents consist of the following constructions ldquoperceived
fearrdquo ldquoempathyrdquo and ldquoresponsibilityrdquo These items were measured in previous
research that validated scales in the field of psychology and marketing
The fourth part of the questionnaire of interest was the one measuring the
trend of consumer ethnocentrism the CETSCALE developed by Shimp amp Sharma
(1987) This tool consists of evaluating 17 statements on the Likert scale with 7
levels (1 = ldquostrong disagreementrdquo and 7 = ldquostrong agreementrdquo)
Higher results on this scale indicate that respondents are willing to buy
local products while lower results indicate a willingness to buy goods produced in
another country Thus CETSCALE scores can range from 17 to 119 The
justification for the use of the scale is based on the confirmation of its reliability
and validity by a large number of researchers (Luque-Martinez Ibanez-Sapata amp
del Barrio-Garcia 2000 Sharma et al 1995)
In addition CETSCALE has been used and validated in Central and
Eastern Europe (Lindquist Vida Plank amp Fairhurst 2001 Huddleston Good amp
Stoel 2001) and in Africa (Saffu amp Walker 2006) According to reports by
Durvasula Andrews amp Netemeyer (1997) high scores of CETSCALE indicate a
high level of ethnocentrism while low scores of CETSCALE indicate a low level
of ethnocentrism
Review of International Comparative Management Volume 22 Issue 1 March 2021 33
The translation of the items was done by an authorized translator For the
present sample we will analyze the CETSCALE results taking into account the
demographic variables Also here will be evaluated the correlation of socio-
psychological factors with CETSCALE
The Excel document was imported into SPSS 200 for Windows and this
software was used for all analyzes Data were analyzed using frequencies and
percentages I mention that the total sum of the percentages in the tables may not
add up to 100 percent due to the rounding of the results to only two decimal places
Continuous data were compared using the Mann-Whitney U-Test due to the
possibility of data abnormalities The Spearman order correlations were used to
verify the CETSCALE results and the statements regarding the socio-psychological
factors of the questionnaire considered the method appropriate as long as the
statements of attitudes are ordinal (Likert Scale) and the CETSCALE results were
assumed to be abnormal The values of p le005 were considered statistically
significant
3 Research findings
Sample description Table 2 shows the composition of the analyzed
sample Thus the age between 25-34 years has the highest frequency which means
that the majority of respondents were in this age range representing a percentage
of 282 of the total predominantly women with a percentage of 506 The
average level of education of the sample members is that of undergraduate studies
(376) the average income is between RON 1001 and RON 2000 taking into
account that 319 people out of 1246 gave this answer Regarding the regions of
residence they had small fluctuations except for the northeastern region which had
the highest percentage of 226 The division by area of residence shows that the
urban area predominates (583) Data were weighted by gender and residence
Table 2 An overview of the sample characteristics
n=1246 (size) Frequency Percentage
Age
15-24 years old 167 134
25-34 years old 352 282
35-44 years old 307 247
45-54 years old 235 189
55-64 years old 158 126
over 65 years old 28 22
Gender
Female 631 506
Men 615 494
Education
Vocational school 63 50
High School 272 218
Post-secondary studies 93 74
34 Review of International Comparative Management Volume 22 Issue 1 March 2021
n=1246 (size) Frequency Percentage
Undergraduate studies 468 376
Masterrsquos Degree 308 247
Doctoral studies 42 34
Income
le 1 000 RON 105 85
between 1 001 RON and 2 000 RON 319 256
between 3 001 RON and 4 000 RON 181 146
over 4 000 RON 264 216
1176 944
Non-answers 70 56
Regions
Bucharest-Ilfov 126 101
Center 112 90
Vest 109 88
Nord-Vest 148 119
Nord-Est 281 226
Siuth-Est 136 109
South-Muntenia 149 119
South-Vest 185 149
Residence
Rural 519 417
Urban 727 583
Note value-p le005 statement and Romanian group are significantly different note
that due to rounding percentages may not add up to 100 per cent Source Own analysis Data processed with SPSS v 20 Windows
31 Hypotheses
The current study focuses on the validationinvalidation of the following
research hypotheses developed based on literature review
bull Hypothesis no1 CETSCALE is unidimensional
bull Hypothesis no2 Consumers living in socio-economically developed
regions are less ethnocentric than those living in less economically and
socially developed regions
bull Hypothesis no3 Consumers living in rural areas are more ethnocentric
than those in urban areas
bull Hypothesis no4 Perceived fear positively influences consumer
ethnocentrism
bull Hypothesis no5 Ethnocentric consumers will show a higher empathy
for the purchase of local products
bull Hypothesis no6 Ethnocentric consumers will show greater
responsibility for purchasing local products
bull Hypothesis no 7 The counties with a high development index are
negatively correlated with counties with a high consumer ethnocentrism
Review of International Comparative Management Volume 22 Issue 1 March 2021 35
To achieve the objective of data analysis specific statistical tools such as
factor analysis with principal component analysis mean scores standard deviation
and Cronbachrsquos alpha were used
32 Analysis and results
The CETSCALE results were collected and the descriptive statistics
showed the average of 7024 (SD 2523) out of the maximum of 119
Table 3 Descriptive statistics of CETSCALE
Source Own analysis Data processed with SPSS v 20 Windows
After studying the vault (kurtosis) and asymmetry (see Table 3) it turned
out that the data series follows an acceptable distribution For Skewness the range
-08 and +08 is considered acceptable and for Kurtosis -3 and +3 The average of
ethnocentrism indicates the intensity of ethnocentrism
Differences between the demographic characteristics of the sample of
respondents (eg age level of education) and the period of data collection could
prevent a significant comparison between the results of ethnocentrism in different
studies
Reliability dimensionality and validity of the scale
Analyzing the reliability of the 17 items of the CET scale shows that good
results were obtained in terms of two measurements of consistency the total
correlation of the corrected items (the corrected total - item correlation - the
homogeneity index) and the Cronbachs alpha index (Campo-Arias amp Oviedo
2008) (see table 4)
36 Review of International Comparative Management Volume 22 Issue 1 March 2021
Table 4 Reliability test of CETSCALE
Cronbachs
Alpha
Cronbachs Alpha Based on
Standardized ItemsN of Items
0956 0956 17 Source Own analysis Data processed with SPSS v 20 Windows
Regarding the value needed to support the consistency of the scale it is
important to emphasize that there is no single rule regarding the definition of the
minimum value In this regard Hair Black Babin Anderson amp Tatham (2006)
suggested that Cronbachs alpha should be greater than 07 while the total
correlation of the items should be greater than 05 although values above 04 show
an acceptable level of homogeneity for all scale items However there are authors
who propose other values This is the case of Santisteben (1990) who considers
that the Cronbachrsquos alpha index should be at least 05 Nurosis (1993) considers
that the total correlation of the items should be at least 03
In this respect according to the above arguments the consistency of
CETSCALE is confirmed Cronbachrsquos alpha by the values obtained show that they
are at levels considered acceptable In the same way all correlation coefficients of
all items are significant all being equal to or greater than 04 (see Table 5) This
result indicates that this instrument is a reliable indicator of ethnocentrism
Unidimensionality of the scale Once the reliability of the scale for
CETSCALE has been demonstrated the second step is to analyze whether the scale
is composed of a single factor or size There are a number of methods and indexes
available to confirm the unidimensionality of a particular scale but in this study it
was used factor analysis to assess the dimensionality The methodology is still one
of the most used and developed techniques at an empirical level (Brown 2006
Kline 2010 Thompson 2004)
Before applying the factor analysis it is recommended to use confirmatory
measurements
bull the sphericity test of Bartlett and KMO (Kaiser - Meyer - Oklin) which
measures the sufficiency of the sample In this case the first (1674175) is
significant (p lt001) showing that it must reject the null hypothesis of the idea of
no correlation between items
bull KMO (0960) can be considered more than acceptable Therefore
according to the results obtained it can be concluded that CETSCALE is suitable
for the development of a factor analysis (see Table 6)
Table 6 KMO and Bartlettrsquos test
Source Own analysis Data processed with SPSS v 20 Windows
Review of International Comparative Management Volume 22 Issue 1 March 2021 37
CE
T1C
ET2
CE
T 3
CE
T 4
CE
T 5
CE
T 6
CE
T7C
ETS
CE
T 9
CE
T10
CE
T 11
CE
T12
CE
T 13
CE
TS4
CE
T 15
CE
T 16
CE
T 17
CE
T 1
100
00
577
061
20
646
049
10
591
070
90
599
069
30
468
058
70
447
058
10
424
041
80
547
052
1
CE
T 2
057
71
000
049
90
440
041
80
450
050
50
495
052
20
535
054
00
513
045
80
442
041
90
709
045
8
CE
T 3
061
20
499
100
00
645
047
60
553
061
70
563
062
30
447
054
20
433
059
60
417
041
50
526
051
1
CE
T 4
064
60
440
064
51
000
043
80
486
058
90
531
065
30
379
044
30
381
065
90
332
036
50
466
044
6
CE
T 5
049
10
418
047
60
438
100
00
723
065
80
587
052
90
530
057
70
525
048
60
575
050
60
484
063
9
CE
T 6
059
10
450
055
30
486
072
31
000
077
40
654
060
00
538
067
90
527
053
20
591
055
80
525
067
7
CE
T 7
070
90
505
061
70
589
065
80
774
100
00
710
073
90
561
068
90
540
598
055
90
516
057
30
660
CE
T 8
059
90
495
056
30
531
058
70
654
071
01
000
066
50
587
065
40
585
056
10
549
056
50
585
057
4
CE
T 9
069
30
522
062
30
653
052
90
600
073
90
665
100
00
542
062
70
490
621
047
20
447
059
00
567
CE
T 10
046
80
535
044
70
379
053
00
538
056
10
587
054
21
000
069
50
672
049
20
655
058
00
629
059
0
CE
T 11
058
70
540
054
20
443
057
70
679
068
90
654
062
70
695
100
00
661
054
90
645
060
70
635
066
1
CE
T 12
044
70
513
043
30
381
052
50
527
054
00
585
049
00
672
066
11
053
60
684
068
50
630
056
1
CE
T 13
058
10
458
059
60
659
048
60
532
059
80
561
062
10
492
054
90
536
100
00
473
050
50
549
054
0
CE
T 14
042
40
442
041
70
332
057
50
591
055
90
549
047
20
655
064
50
684
047
31
000
070
70
560
067
8
CE
T 15
041
80
419
041
50
365
050
60
558
051
60
565
044
70
580
060
70
685
050
50
707
100
00
598
062
0
CE
T 16
054
70
709
052
60
466
048
40
525
057
30
585
059
00
629
063
50
630
549
056
00
598
100
00
572
CE
T 17
052
10
458
051
10
446
063
90
677
066
00
574
056
70
590
066
10
561
054
067
80
620
057
21
000
Ta
ble
5
Th
e co
rrel
ati
on
ma
trix
bet
wee
n C
ET
SC
AL
E i
tem
s
So
urc
e O
wn
an
aly
sis
Dat
a p
roce
ssed
wit
h S
PS
S v
2
0 W
ind
ow
s
38 Review of International Comparative Management Volume 22 Issue 1 March 2021
To better explain the concept of CETSCALE exploratory factor analysis
(EFA) was used (SPSS v20) The CETSCALE unidimensionality hypothesis could
be tested if all items had high load values (gt 040 or evengt 050) on a single factor
The EFA results (see Table 7) show that there is a two-factor solution for our
sample In this case CETSCALE is not unidimensional for our sample Hypothesis
no 1 is rejected
Table 7 Total Variance Explained
Source Own analysis Data processed with SPSS v 20 Windows
This analysis may assume that the initial 17 variables could be reduced to
2 basic factors The two factors explain 70 of the variation in the database This
means that when the two components are assumed to exist 70 of the information
can be predicted for each of the 17 variables (usually only 20 is expected to be
predicted) The first component explains more of the variation than the second
(35 compared to 32) (see Table 7) In this section the factors were not
described but only the proof of the unidimensionality of the scale
CETSCALE by region of residence Hypothesis no 2 Consumers living
in socio-economically developed regions are less ethnocentric than those living in
less socio-economically developed regions Regarding the ethnocentrism of
Romanians according to region we observe (see Table 8) that the region where the
highest values were recorded were the regions of South-East Center and West
which means that in these regions there is the greatest inclination towards the
acquisition of local products compared to the South-West and Bucharest-Ilfov
regions where the lowest values were registered
Total of Variance
Cumulativ e Total of
Variance Cumulativ
e Total of Variance
Cumulativ e
1 9988 58754 58754 9988 58754 58754 5909 34758 34758 2 1391 8182 66937 1391 8182 66937 5470 32179 66937 3 0902 5305 72242 4 0648 3812 76053 5 0490 2879 78933 6 0412 2421 81353 7 0411 2419 83772 8 0392 2308 86080 9 0344 2025 88105
10 0332 1954 90059 11 0280 1649 91707 12 0278 1637 93345 13 0257 1514 94859 14 0248 1459 96318 15 0231 1359 97677 16 0219 1288 98964 17 0176 1036 100000
Extraction Method Principal Component Analysis
Component Initial Eigenvalues Extraction Sums of Squared
Loadings Rotation Sums of Squared
Loadings
Review of International Comparative Management Volume 22 Issue 1 March 2021 39
Table 8 Analysis of the ethnocentrism
of the Romanian consumer by region of residence
Source Own analysis Data processed with SPSS v 20 Windows
Taking into the consideration of the study made by Miron Dima amp
Vasilache (2009) where three indexes were calculated (the infrastructure index the
population rejuvenation index and the intellectual capital index) to evaluate which
were the most developed regions in Romania the analysis gave Bucharest-Ilfov
South-Muntenia and South-West as the most developed one Therefore according
to the data hypothesis no2 is accepted
CETSCALE by the place residence Hypothesis 3 Consumers living in
rural areas are more ethnocentric than those in urban areas
Regarding to the place the residence of the respondents the difference is
small (see Table 9) However it could be said that the people living in rural areas
have a slightly inclination in terms of purchasing local products
Table 9 Romanian Consumer Ethnocentrism by place of residence
Source Own analysis Data processed with SPSS v 20 Windows
According to the data hypothesis no3 is accepted
Further on it will be presented a table with correlations among the socio-
psychological variables and CETSCALE
Hypothesis no4 Perceived fear positively influences consumer
ethnocentrism Hypothesis no5 Ethnocentric consumers will show a higher
empathy for the purchase of local products Hypothesis no6 Ethnocentric
consumers will show greater responsibility for purchasing local products
40 Review of International Comparative Management Volume 22 Issue 1 March 2021
Table 10 Spearmanrsquos correlations socio-psychological variables and CETSCALE
Source Own analysis Data processed with SPSS v 20 Windows
The results in Table 10 show that there are significant linear correlations
between two of the statements corresponding to the socio-psychological variable
perceived fear two of the statements corresponding to the socio-psychological
variable empathy and the CETSCALE The two statements corresponding to the
socio-psychological variable responsibility for ethnocentrism do not correlate
with CETSCALE
According to the data hypothesis no4 is accepted According to the data
hypothesis no5 is accepted According to the data hypothesis no6 is rejected
Dimensions Indicator of socio-economic development and CETSCALE
Hypothesis no7 The counties with a high development index are negatively
correlated with counties with a high consumer ethnocentrism
Next it will be analyzed the existence of a correlation between the socio-
economic development of a county and the level of ethnocentrism of consumers in
that county
In order to be able to assess the level of socio-economic development an
aggregate indicator composed of five dimensions was built Each dimension is
defined by a certain indicator The reference year used for the statistical data is
2015 because in that year were also collected questionnaires used in the
quantitative research Therefore
1 For the construction of Dimension 1 ldquoPopulationrdquo two indicators were
taken into account Population by place of residence (at county level) and Share of
the population under 18 years of age in relation to the total population at county
level
2 For the construction of Dimension 2 ldquoMaterial prosperityrdquo only the
GDP per capita was taken into account
3 For the construction of Dimension 3 ldquoEconomic powerrdquo were taken into
account the number of enterprises foreign direct investment the number of
employees the employment rate the average net earnings and the situation of the
unemployed
4 For the construction of Dimension 4 ldquoPopulation educationrdquo the
following indicators were taken into account school population school units
Review of International Comparative Management Volume 22 Issue 1 March 2021 41
situation of school laboratories situation of gyms situation of sports fields and
situation of computers in educational institutions
5 For the construction of Dimension 5 ldquoPhysical and mental well-beingrdquo
the following indicators were taken into account the number of libraries the
situation of the beds in the sanitary units the situation of the medical-sanitary
personnel and the situation of the sanitary units
Socio-economic indicator = Average of the Dimensions
Dimension 1 = Average (zI1zI2zI3zI4zI5)
zi = (xi-minU) (maxU-minU)
minU = min 08 maxU = max 12
Table 11 Dimensions Indicator of socio-economic development and CETSCALE
Source Own analysis Data processed with EXCEL Microsoft Office
42 Review of International Comparative Management Volume 22 Issue 1 March 2021
According to the results presented in Table 12 it appears that there is a weak
correlation between the results of the indicator and the CETCALE results and this
relationship is negative In a negative connection the high values of one variable
are associated with the low values of the second variable and vice versa From here
we can conclude that with the increase of the level of socio-economic
development the ethnocentrism of the consumer will decrease
Table 12 Correlation indicator socio-economic development and CETSCALE
Source Own analysis Data processed with SPSS v 20 Windows
According to the data hypothesis no7 is accepted
Discussions Managerial implications
In this study my objective was to understand the Romanian consumersrsquo
ethnocentrism and the effects of some socio-psychological factors on their attitudes
towards imports and subsequently on purchase intentions The place of residence
as a demographic factor was also analyzed The focus was on the socio-
psychological variables ldquosaliencerdquo ldquoempathyrdquo and ldquoresponsibilityrdquo Six of the
current studyrsquos hypotheses were supported These findings confirm results from
previous consumer ethnocentrism research while integrating them in an overall
model (Shankarmahesh 2006) The results indicate one more time that
CETSCALE is a reliable indicator of ethnocentrism Compared to consumers of
other nationalities who were studied in previous ethnocentrism research (Lindquist
et al 2001 Luque-Martınez et al 2000 Supphellen amp Rittenburg 2001 Javalgi
Khare Gross amp Scherer 2005) Romanian consumers appear to not be overly
ethnocentric
Marketing specialists could improve their campaigns if they would
understand the network of influence that makes consumers prefer local products in
favor of imported ones Consumer cooperation in the purchase of local products
could be seen as a form of aid for workers whose jobs are endangered by the
success of imported products Understanding the ethnocentric trends of the
consumers and the link between ethnocentric trends and socio-psychological
factors could be helpful for both local and international companies to properly
correct their resources in building spending strategies to develop plans better
marketing strategies and policies
Review of International Comparative Management Volume 22 Issue 1 March 2021 43
Regarding the consumption of local products foreign markets should also
be explored Nowadays with the help of European funds local farmers could be
encouraged to focus their production on bio and organic food for which there is a
rising demand on an expanding market which can find a most welcoming soil in
Romania and the production of which could create niche opportunities for exports
to a wider range of destinations (Andrei et al 2020)
Limitations and future research
The limitations offer fertile premises for future studies For example future
research could be done on a more representative number of respondents Moreover
a comparative analysis between two countries or between regions or countries in
transition on the same study could be made The results of the analysis suggest a
number of new questions about what should be further researched Some positive
correlations (Maramures Satu Mare Alba-Iulia Brasov Bacau Arges and
Constanta) between the CETSCALE and the aggregated indicator (Table 13) have
been identified that could be further investigated Even if this data shows that
between the results of the indicator and the CETCALE there are some weak
correlations there might be of interest for some researchers and marketing
specialist to try to understand the opportunity to produce and sell local products in
those counties
Regarding the CETSCALE results in urban versus rural areas the data
shows that the diference was not so significantly Taking into consideration that
former studies showed big gaps between the reveneus of the households in rural
area versus urban ones (Chivu Ciutacu amp Georgescu 2014) some further
research could made to understand some cultural aspects or other variables that
could influence the consumer ethnocentrism
Future researchers could also take into consideration some aspects related
to cultural specifics of some regions such as minority culture and language (as for
example Hungarian Roma Russian Turkish minorities) Moreover answers to
the questions if ethnocentrism apply to services need more research
Due to the focus on the consumer in the contemporary business world the
market orientation paradigm advances in consumer knowledge and its dynamics
will continue to be crucial for both market researchers theorists and practitioners
Given the results mentioned during the paper it can be stated that research
opportunities in Central and Eastern Europe seem to be abundant In order to
increase the confidence in the generalizability of my findings future research in
these countries is needed
4 Conclusion
The main objective of this study was to measure the ethnocentric trends of
consumers in a transition economy Romania However all this followed the
inclusion in specialized research at the global level and the analysis of certain
antecedents and moderators that would influence the consumers ethnocentrism
44 Review of International Comparative Management Volume 22 Issue 1 March 2021
Regarding the ethnocentrism of the Romanian consumer it presented some
differences when certain demographic factors were taken into account the
environment of residence (urban vs rural region) Regarding the analysis of the
correlation of socio-demographic factors with CETSCALE the results show that
there is a significant linear correlation between statements corresponding to the
socio-psychological variable perceived fear and ethnocentrism between
statements corresponding to the socio-psychological variable empathy and
ethnocentrism The analysis regarding the connection between the socio-economic
development of the counties and the ethnocentrism of the consumers presents a
negative correlation According to the results as the level of socio-economic
development increases consumer ethnocentrism decreases
Overall the results of this study appear to be encouraging in developing
knowledge in this area about consumer attitudes in advanced transition economies
References
1 Andrei J V Popescu G H Nica E amp Chivu L (2020) The impact of agricultural
performance on foreign trade concentration and competitiveness empirical evidence
from Romanian agriculture Journal of Business Economics and Management 21(2)
317-343 httpsdoiorg103846jbem202011988
2 Aviv Shoham amp Maja Makovec Brenčič (2003) Consumer Ethnocentrism Attitudes
and Purchase Behavior Journal of International Consumer Marketing 154 67-86
httpDOI101300J046v15n04_04
3 Brown TA (2006) Confirmatory factor analysis for applied research New York
NY Guilford Press httpsbooksgooglerobookshl=roamplr=ampid=tTL2BQAAQBAJ
ampoi=fndamppg=PP1ampdq=Confirmatory+factor+analysis+for+applied+researchampots=al
PwpRWJ5Campsig=PH16GF0VLwRa7wryTFyYLmOxZo0ampredir_esc=yv=onepageamp
q=Confirmatory20factor20analysis20for20applied20researchampf=false
Campo-Arias Adalberto amp Oviedo Heidi C (2008) RevisioacutenReview Propiedades
Psicomeacutetricas de una Escala la Consistencia Interna Revista de Salud Puacuteblica 10(5)
831-839 httpswwwscielosporgarticlersap2008v10n5831-839
4 Chivu L Ciutacu C amp Georgescu L (2015) Household income in Romania A
challenge to economic and social cohesion Procedia Economics and Finance 22
398-401 101016s2212-5671(15)00310-x
5 De Jong M Steenkamp J Fox J amp Baumgartner H (2008) Using item response
theory to measure extreme response style in marketing research A global
investigation Journal of Marketing Research 45(1) 104-115 httpsdoiorg101509
jmkr451104
6 Dima A M Țuclea C E Vracircnceanu D M amp Țigu G (2019) Sustainable social
and individual implications of telework a new insight into the Romanian labor
market Sustainability 11(13) 3506 httpsdoiorg103390su11133506
7 Durvasula S Andrews CJ and Netemeyer RG (1997) A cross-cultural
comparison of consumer ethnocentrism in the United States and Russia Journal of
International Consumer Marketing Vol 9 No 4 pp 73-93
httpsdoiorg101300J046v09n04_05
Review of International Comparative Management Volume 22 Issue 1 March 2021 45
8 Fernaacutendez-Ferriacuten P and Bande-Vilela B (2013) Regional ethnocentrism
Antecedents consequences and moderating effects Food Quality and Preference 30
299-308 httpsdoiorg101016jfoodqual201306011
9 Fernaacutendez‐Ferriacuten P Bande B Calvo‐Turrientes A amp Galaacuten‐Ladero M M
(2017) The choice of local food products by young consumers The importance of
public and private attributes Agribusiness 33(1) 70-84 httpsdoiorg101002
agr21470
10 Iacob A Kuada J amp Lawson L G (2014) Relationships between Brand
Perception Ideology and Consumer Ethnocentrism in Post-Communist Romania
Svetla T Marinova 23 85-110 httpswwwresearchgatenetprofileJohn-
Kuadapublication292190856_Relationships_between_Brand_Perception_Ideology_a
nd_Consumer_Ethnocentrism_in_Post-Communist_Romanialinks56af298808
ae43a3980fa36fRelationships-between-Brand-Perception-Ideology-and-Consumer-
Ethnocentrism-in-Post-Communist-Romaniapdfpage=88
11 Hair J Black W Babin B Anderson R amp Tatham R (2006) Multivariate Data
Analysis (6th ed) New Jersey Pearson Educational Inc
12 Huddleston P Good L K amp Stoel L (2001) Consumer ethnocentrism product
necessity and Polish consumersrsquo perceptions of quality International Journal of
Retail amp Distribution Management httpsdoiorg10110809590550110390896
13 Javalgi R G Khare V P Gross A C amp Scherer R F (2005) An application of
the consumer ethnocentrism model to French consumers International Business
Review 14(3) 325-344 httpsdoiorg101016jibusrev200412006
14 Kline RB (2010) Principles and practice of structural equation modeling (3rd ed)
New York NY Guilford Press
15 Kral P Janoskova K Lazaroiu G amp Suler P (2020) Impact of Selected Socio-
Demographic Characteristics on Branded Product Preference in Consumer Markets
Management amp Marketing Challenges for the Knowledge Society 15(4) 570-586
httpsdoiorg102478mmcks-2020-0033
16 Lindquist JD Vida D Plank RE and Fairhurst A (2001) The modified
CETSCALE validity tests in the Czech Republic Hungary and Poland International
Business Review Vol 10 No 5 pp 505-16 httpsdoiorg101016S0969-
5931(01)00030-0
17 Luque-Martinez T Ibanez-Sapata JA and del Barrio-Garcia S (2000) Consumer
ethnocentrism measurement an assessment of the reliability and validity of the
CETSCALE in Spain European Journal of Marketing Vol 34 Nos 1112 pp 1353-73
httpsdoiorg10110803090560010348498
18 Miron D Dima A M amp Vasilache S (2010) Modele ale influenţei comerţului
intra-regional asupra dezvoltării sustenabile icircn Romacircnia Amfiteatrul Economic vol
XII nr 27 pg27-35 httpswwwamfiteatrueconomicrotempArticol_928pdf
19 Miron D Dima A M amp Vasilache S (2009) Indexes of regional economic growth in
post-accession Romania Romanian Journal of Economic Forecasting 11(3) 138-152
httpsciteseerxistpsueduviewdocdownloaddoi=10116034879amprep=rep1amptype
20 Nurosis M (1993) SPSS Statistical data analysis New York SPSS Inc
21 Olsen JE Granzin KL and Biswas A (1993) Influencing consumers selection of
domestic versus imported products implications for marketing based on a model of
helping behavior Journal of the Academy of Marketing Science Vol 21 No 4
pp 307-21 httpsdoiorg101007BF02894523
46 Review of International Comparative Management Volume 22 Issue 1 March 2021
22 Rosenblatt PC (1964) Origins and effects of group ethnocentrism and nationalism
Journal of Conflict Resolution Vol 8 No 2 pp 131-46 httpsdoiorg101177
002200276400800204
23 Saffu K and Walker J (2006) An assessment of the CETSCALE in a developing
country the Ghana case Journal of African Business Vol 7 Nos 12 pp 167-82
httpsdoiorg101300J156v07n01_08
24 Santisteban C (1990) Psicometriacutea Teoriacutea y praacutectica en la construccioacuten de tests
Madrid Ediciones Norma SA
25 Shankarmahesh M N (2006) Consumer ethnocentrism an integrative review of its
antecedents and consequences International Marketing Review 23 146-172
httpsdoiorg10110802651330610660065
26 Sharma S Shimp TA and Shin J (1995) ldquoConsumer ethnocentrism a test of
antecedents and moderatorsrdquo Journal of the Academy of Marketing Science Vol 23
No 1 pp 26‐37 httpsdoiorg1011770092070395231004
27 Shimp TA and Sharma S (1987) Consumer ethnocentrism construction and
validation of the CETSCALE Journal of Marketing Research Vol 24 pp 280-289
httpsdoiorg101177002224378702400304
28 Strat V and Vuță C (2020) Raport de țară Romacircnia 2020 Konrad Adenauer
Foundation pp1-93 httpsdrivegooglecomfiled11tBUScPIoaoQNfXVz6stTj
UoSJzX68enview
29 Subic J Vasiljevic Z amp Andrei J (2010) The impact of FDI on the European
economic development in the context of diversification of capital flows Proceedings of
the 14th International Business Information Management Association Business
Transformation through Innovation and Knowledge Management An Academic
Perspective Istanbul Turkey 23-24 105937StraMan2002003A
30 Supphellen M amp Rittenburg T L (2001) Consumer ethnocentrism when foreign
products are better Psychology and Marketing 18(9) 907-927
httpsdoiorg101002mar1035
31 Thompson B (2004) Exploratory and confirmatory factor analysis Washington DC
American Psychological Association httpsdoiorg10103710694-000
32 Vida I amp Reardon J (2008) Domestic consumption rational affective or normative
choice Journal of Consumer Marketing httpsdoiorg10110807363760810845390
33 World Bank (2021) Romania GDP per capita PPP Retrieved on March 5 2021 from
httpstradingeconomicscomromaniagdp-per-capita-ppp
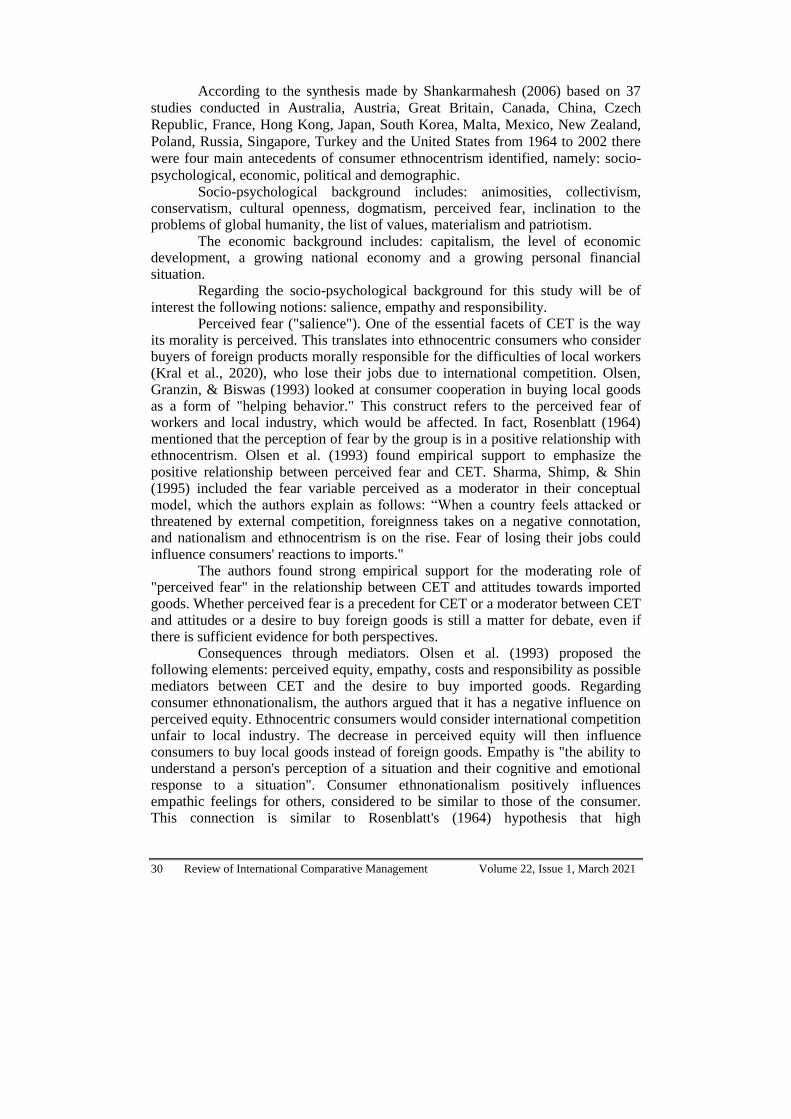
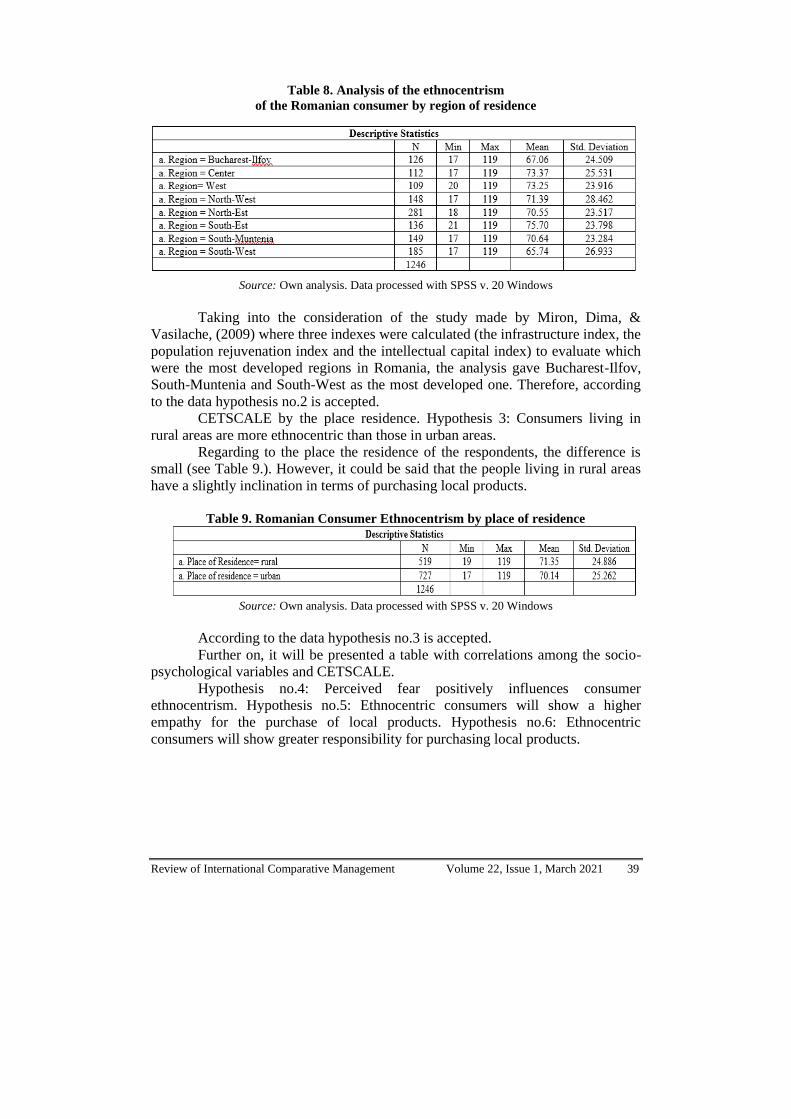