Consumer Evaluation of Brand Extention- A Pakistani Context(ODD)
Consumer Data Source Evaluation
Consistency Assessment:
Chimera
December 20, 2011
By
Consistency Evaluation of Chimera Data Source
Mktg, Inc. 12/20/2011 Page 2 of 46
TABLE OF CONTENTS
Page
1. Consistency Analysis ...................................................................................................... 3
2. Summary of Chimera Consistency Results..................................................................... 4
3. Sources of Variation ....................................................................................................... 7
4. Methods of Analysis ....................................................................................................... 9
5. Demographic Variation ................................................................................................. 12
5.1. Age Distribution .................................................................................................... 13
5.2. Income Distribution ............................................................................................... 15
5.3. Education Distribution ........................................................................................... 17
5.4. Marital Status Distribution..................................................................................... 19
6. Structural Segment Distributions .................................................................................. 21
6.1. Buyer Behavior Segments ..................................................................................... 22
6.2. Sociographic Segments .......................................................................................... 25
6.3. Media Segments ..................................................................................................... 28
7. Source Performance ...................................................................................................... 31
7.1. Performance ........................................................................................................... 32
7.2. Characteristics (Frequent Survey Takers) .............................................................. 35
7.3. Satisficing Behavior (Speeders and Straight-Liners) ............................................. 40
7.4. Q-Metrics ........................................................................................................... 44
Consistency Evaluation of Chimera Data Source
Mktg, Inc. 12/20/2011 Page 3 of 46
1. SUMMARY OF CHIMERA CONSISTENCY ANALYSIS
This report focuses on the testing of consistency of panel results for Chimera (5/2009,
3/2010 and 7/2010). Performance metrics comparing the results of these panels to
country or regional standards is covered in separate reports. This report is exclusively
concerned with the stability and consistency of the results of the specific sources of
respondents. Here the focus is on the consistency of structure, characteristics and
performance of a specific source of data. To be effective, these consistency metrics are
designed to be standardized and independent.
The testing procedures were based on the execution of a standard questionnaire. The
questions were selected to allow a consistent standard and independent assessment of the
panel or data source. In all cases, samples were made by the source supplier using their
standard methods of management and incentives to reflect current operations and panel
management methods.
For this assessment, three sample-sets were used of at least 500 completes each based on
the execution of a standardized online (internet form) questionnaire. Typically, for
“random” and non-structured sampling, some form of quota corrections are used to help
balance the resulting sample. These quotas may reflect the specific needs of a study,
regional or preference requirements or to balance demographics. For consistency testing,
all quota methods are used consistently across all sample sets.
The primary reference or basis of comparison for the consistency tests is a measure of the
overall average value of the samples of the Chimera data source. A secondary reference
is used to examine overall effectiveness; this is the Grand Mean.

Consistency Evaluation of Chimera Data Source
Mktg, Inc. 12/20/2011 Page 4 of 46
2. CONSISTENCY RESULTS
The objective of this program is to capture the variability in the use of a specific source
of online respondents. All survey data, by its inherent nature, is distributed. That is, in
any survey, the responses are expected to vary. What we wish to measure is the stability
of those responses from which one would like to infer the consistency of the source.
Chimera provided samples for which standardized surveys were executed.
Analysis was based on response to questions on three types of information:
Demographics (including age, income, education, and marital status distribution)
reflect the traditional classification of respondents. Note that some of these variables
were used to quota control the sample. As such, they measure the consistency of the
quota process.
Structural Segments (based on buyer behavior, sociographic issues, and media use)
reflect the cultural, social, and behavioral characteristics of the respondents. These
segmentation schemes may vary between countries and regions. They should be more
consistent within countries and within panels over time.
Source Performance (including erroneous, professional and satisficing behavior
metrics) may reflect the quality of survey results. These include the issues of
incorrect responses, speeding through the survey, and participating in frequent
surveys.
Two references are used to gauge the consistency of results: overall average response
(local mean), and the external “Grand Mean,” representing the average responses for a
standard questionnaire over a number of sources. The Grand Mean references have been
collected by country and are used only within the country to evaluate panels. Separate
evaluation reports have been prepared on each Chimera sample-set compared to the
Grand Mean.
The basis for evaluating consistency is the congruity of sample-set results with these
references within the expected statistical error. To summarize the results of this study we
examine the average deviation across the sample sets against the overall average
response and the corresponding deviation from the most recent sample set.
Consistency Evaluation of Chimera Data Source
Mktg, Inc. 12/20/2011 Page 5 of 46
Average Consistency of the Chimera Data Source
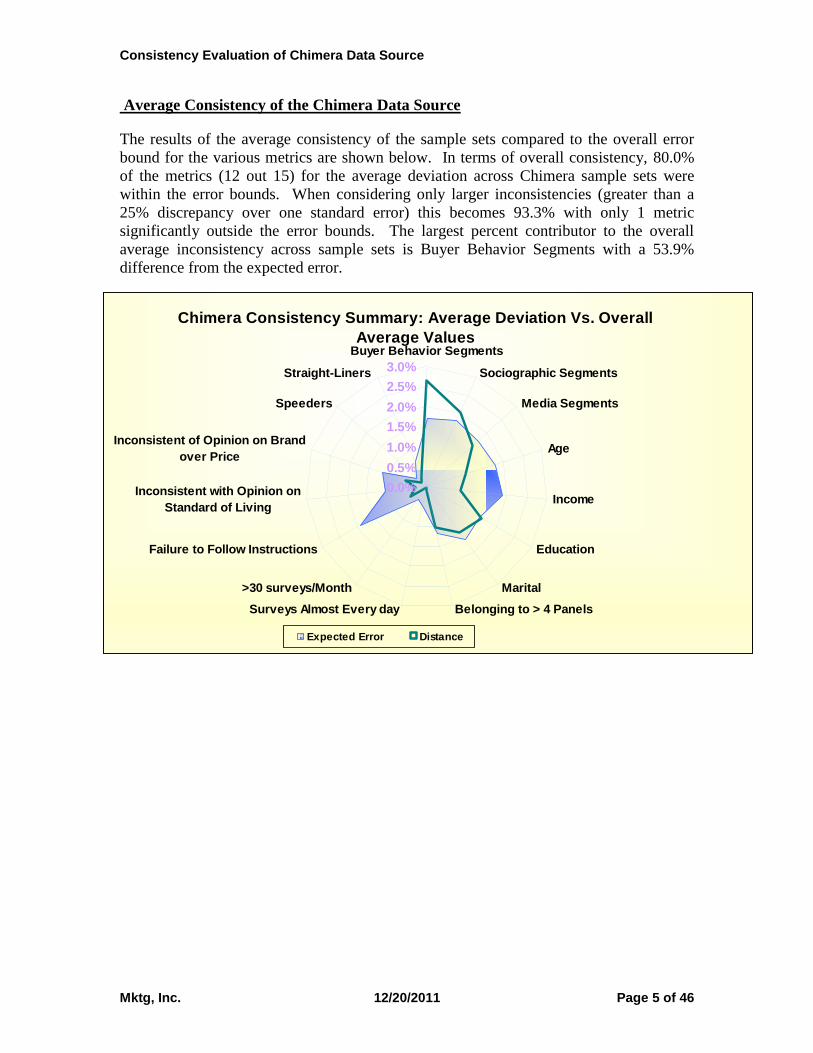
The results of the average consistency of the sample sets compared to the overall error
bound for the various metrics are shown below. In terms of overall consistency, 80.0%
of the metrics (12 out 15) for the average deviation across Chimera sample sets were
within the error bounds. When considering only larger inconsistencies (greater than a
25% discrepancy over one standard error) this becomes 93.3% with only 1 metric
significantly outside the error bounds. The largest percent contributor to the overall
average inconsistency across sample sets is Buyer Behavior Segments with a 53.9%
difference from the expected error.
Chimera Consistency Summary: Average Deviation Vs. Overall
Average Values
0.0%
0.5%
1.0%
1.5%
2.0%
2.5%
3.0%
Buyer Behavior Segments
Sociographic Segments
Media Segments
Age
Income
Education
Marital
Belonging to > 4 PanelsSurveys Almost Every day
>30 surveys/Month
Failure to Follow Instructions
Inconsistent with Opinion on
Standard of Living
Inconsistent of Opinion on Brand
over Price
Speeders
Straight-Liners
Expected Error Distance
Consistency Evaluation of Chimera Data Source
Mktg, Inc. 12/20/2011 Page 6 of 46
Consistency of the Chimera 7/2010 Sample Set Data Source
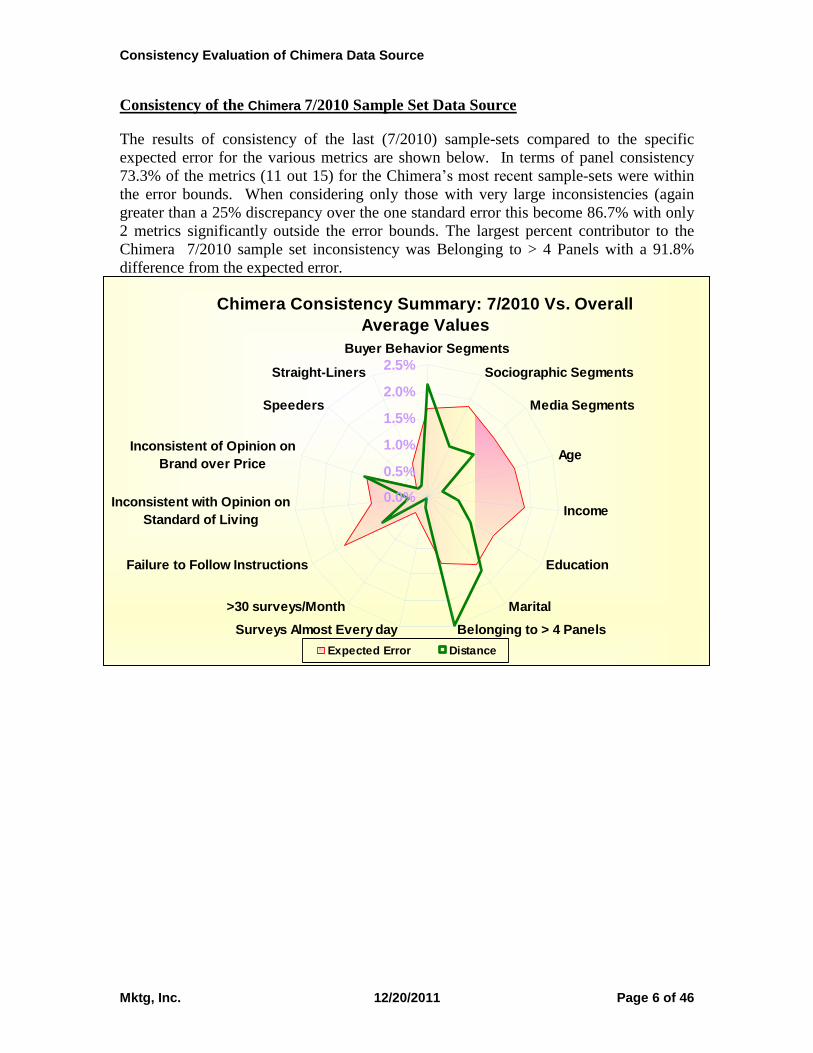
The results of consistency of the last (7/2010) sample-sets compared to the specific
expected error for the various metrics are shown below. In terms of panel consistency
73.3% of the metrics (11 out 15) for the Chimera’s most recent sample-sets were within
the error bounds. When considering only those with very large inconsistencies (again
greater than a 25% discrepancy over the one standard error this become 86.7% with only
2 metrics significantly outside the error bounds. The largest percent contributor to the
Chimera 7/2010 sample set inconsistency was Belonging to > 4 Panels with a 91.8%
difference from the expected error.
Chimera Consistency Summary: 7/2010 Vs. Overall
Average Values
0.0%
0.5%
1.0%
1.5%
2.0%
2.5%
Buyer Behavior Segments
Sociographic Segments
Media Segments
Age
Income
Education
Marital
Belonging to > 4 PanelsSurveys Almost Every day
>30 surveys/Month
Failure to Follow Instructions
Inconsistent with Opinion on
Standard of Living
Inconsistent of Opinion on
Brand over Price
Speeders
Straight-Liners
Expected Error Distance
Consistency Evaluation of Chimera Data Source
Mktg, Inc. 12/20/2011 Page 7 of 46
3. SOURCES OF VARIATION
Unlike typical production quality measures where tight control procedures can be
employed, the results of survey measurements are inherently varied. It is in the nature of
the surveys and dealing with human responses. While increasing sample size makes the
expected or average values more stable, it still does not remove the potential variability.
This is inherent. However, beyond that inherent variation, there are two major sources of
variation. The purpose of consistency measurement is to understand the potential
variations between sample sets that are due to differences among respondents drawn from
the specified panel or list source. In addition, there are potential variations that arise
from measurement procedures.
Inconsistencies in the Source
There are two sets of sources of inconsistency of survey results beyond the inherent
nature of sampled distributed data. These focus on the source of data; the control of
which is the objective of this consistency tracking. Variation of the sample source is the
problem of both control of the membership and its management.
Source Membership - The source of respondents are expected to vary as the online
communities from which the samples are drawn grow and change. This is inherent to
the nature and characteristic of the respondent sources. The consistency of the
membership is a key factor in the maintenance of consistency.
Source Management Control – Management methods include procedures of obtaining
and soliciting respondents, implementing incentives, and filtering/ screening results.
It is assumed that these are standardized processes that are practiced in a consistent
fashion. However, some variation may take place due to the manual nature of the
procedures and to an effort to continuously improve the process. Understanding the
impact of this variation is one of the key objectives for continuity testing.
Measurement Consistency
The nature of a time series of tests always leads to the potential of unintended variations.
To some degree this is inherent. In this study actions have or will be taken to mitigate
these potential problems.
Instrument Upgrades – The testing instrument will be upgraded over time. This is
done to accommodate the control needs and conditions requested by the users of the
panels and data sources. However, these changes can produce variation in the
consistency metrics. As such, these upgrades are minimized and are only allowed
when they are expected to have a minimal effect on the results.
Seasonality - In this context, seasonality reflects the potential of differences in the
availability or willingness of potential respondents to participate in a survey. This is
a problem in both consumer and specialty surveys. It is reasonable to expect different
response rates in different groups in and around the holiday season. In Europe and
Consistency Evaluation of Chimera Data Source
Mktg, Inc. 12/20/2011 Page 8 of 46
particularly in France, the month of August is almost a natural vacation time and as
such, the distribution of respondents may be significantly different than other times.
For the purpose of these consistency studies, execution has been limited to time
periods where seasonality effects are not expected.
Drift – The standardized instrument measures both characteristics and opinions of the
respondents. While these are expected to remain for the general population fairly
stable, drift is possible. Drift would appear as a gradual monotonic variation in
values. In the analysis, standard references are used. Both references are moving
averages and as such, to some degree automatically compensate for limited drift.
These references will periodically be updated to compensate for drift. Where feasible,
structural segmentation measures were used. These involved combinations of
attributes which are expected to be less sensitive to drift and more stable than the
underlying attribute values.

Consistency Evaluation of Chimera Data Source
Mktg, Inc. 12/20/2011 Page 9 of 46
4. METHODS OF ANALYSIS
The methods of analysis1 are designed to reflect inconsistency due to variability in the
underlying sample and to minimize that due to instrumental variation. Note that almost
all of these measures are in terms of percent of respondents. As such, the percentages are
independent of the sample size, which may vary among sample sets2.
Consistency testing is a sequential process. It is a measure of the continuity of data for a
series of sets and panels. As such, each consistency report should be viewed as a part of
that series. It is important, therefore, that the consistency values not depend inherently on
the time or order of measurement. This is important to maintain a logical sequence of
results and control.
References and Error Bounds
The internal reference for analysis is based on a moving average of the data series3. Note
that this is a “boot strapping” process where the internal reference is recomputed for each
consistency report. As more data in the series is available, the average reference values
are expected to become increasingly stable. It is the intention that once an annual set of
data becomes available, a one year moving average will be used.
All variations, error bounds, are assumed to be associated only with the tested panel.
References are assumed to be “fixed”. This is necessary to prevent an inherent decrease
in the collective error bound (test panel and reference) as a broader based internal
reference is used. This is a progression problem in that the consistency results, using
both sources of error, will depend on precision of the reference. As more data sets are
used in computing the average, the error around the reference will decrease resulting in
an inherent decrease in the collective error bound and an apparent increase inconsistency.
Eliminating this source of error does result in an apparent decrease in the error bound
making this analysis somewhat more conservative.
Point Metrics
Single value or point metrics are used to capture panel performance. These include
measures of errors, professionalism and satisficing. These can be thought of as
traditional quality control “fault” metrics.
1 The measurement methods are based on standard Quality Control, Total Quality Management and Six
Sigma Procedures with noted variation to handle distributed metrics.
2 The standard errors around the values, however, are dependent on sample size as is the measures of
precision. The distribution of percent values are usually assumed to be binomial distributions with the
Standard Error around the value being equal to Square Root {value x(1-value)/Sample Size}
3 This is not typical for most Quality Control situations where the reference is usually set at some
requirement or specification and is therefore automatically fixed. In this case, the historical average is used
and therefore, varies between consistency reports
Consistency Evaluation of Chimera Data Source
Mktg, Inc. 12/20/2011 Page 10 of 46
Variation & Error – Bar charts with error bounds are used to show the variation of the
data and the references. These charts highlight the relative value of the measures
compared to the references.
Control-Charts – The control-charts show the variation in range or error bound around
the profile of values compared to standards. The control range is taken as 2 standard
errors around the particular values. Where the primary reference falls within the
control range, the process is considered to be “under-control”. The secondary
reference represents an external condition which may be desirable.
Distribution Metrics
Measures of structural characteristics of the panels and data sources are best reflected by
the distribution of attributes rather than single point values. These include the
demographic and segmentation characteristics. However, due to the multiple values of
these distributions, the collective measures of comparisons are necessary in order to
highlight differences and to establish consistency measures.
Variation & Error – Stacked bar charts are used to show the time series results of the
sample-set along with the appropriate references. Error bounds at 2 standard errors
around the components are also shown to illustrate relative importance of differences.
As previously noted, all error is assumed to be associated with the panels being
examined. All referenced fixed without error.
Chi Square Measure of Variation – The Chi Square test indicates the likelihood that
two distributions of values are the same. It is a collective test of consistency based on
variation. It tends to emphasize specific differences. We use two measures one
against the overall average values (internal reference) and other against the Grand
Mean4. The internal reference measures the relative consistency of the series. The
external reference is used to determine if any variation is moving toward or away
from an overall measure of effectiveness.
Distance Measure of Variation – While the Chi-Square measures are useful to provide
a broad view of the fit between distributions, it does not yield details of the fit. It
tends to indicate the extreme case of distributions that are or are not the same. It does
show the degree of fit. The Root-Mean-Square distance5 measure is used to indicate
this finer detail in the differences. As with the Chi-Square measures, values are
measured against both references. In addition, a measure of the expected error6 is
4 The Chi Square statistic includes measures of the number of respondents included from both the primary
measure and the reference. We used the sample size for the tested group for both. This eliminated the
progression problem previously discussed in regards to error bounds.
5 The root-mean-square distance is defined as the square root of the average of square of the differences
between the distributions elements.
6 These are taken as the square root of the average of the squared errors (note that these are taken as 2
standard errors.

Consistency Evaluation of Chimera Data Source
Mktg, Inc. 12/20/2011 Page 11 of 46
also given. This is useful to distinguish between statistically significant differences
and those that are important in terms of consistency. Note that due to the use of 2
standard errors, this is a strong test for inconsistency.
Summary Metrics
There are two sets of summary charts which compare average deviations against the
expected error (one standard deviation) and the most recent sample set, 7/2010,
deviations also against the expected error.
Deviations – Distributed parameters are based on the root-mean-squared value of the
deviations. Single valued variables are taken as the simple difference between the
value and the reference.
Error Range – The error range for the distributed parameters were taken as the root-
mean-squared values of the standard errors.

Consistency Evaluation of Chimera Data Source
Mktg, Inc. 12/20/2011 Page 12 of 46
5. DEMOGRAPHIC VARIATION
Demographics reflect the nature of the respondents. One would expect the demographics
of a sample to reflect that of the references. For these sample-sets quotas were requested
based on the general population. As such, unless there was some error in the process, the
resulting demographic distributions of these quota controlled variables should be in-line
with those of the references. Both age of the respondent and income group were quota
controlled. However, there were several other demographic characteristics measured that
should be in-line with the reference though they were not controlled by quota.

Consistency Evaluation of Chimera Data Source
Mktg, Inc. 12/20/2011 Page 13 of 46
5.1. AGE DISTRIBUTION
The comparison of the age distribution for Chimera against the series mean-values and
the Grand Mean is shown below. This is a distributed value with the error ranges
indicated by the vertical black lines at the end of the groups. These bounds consist of 2
standard errors based on the overall mean values. The space between represents a 95%
probability interval. As would be expected, there does not appear to be a major
difference between the 7/2010 sample set and the overall average . However, that should
be verified with the 2 test below.
Age Distribution Profile
0%
20%
40%
60%
80%
100%
120%
Overall
Average
5/2009 3/2010 7/2010 Grand
Mean
Re
sp
on
de
nt
Pe
rce
nt
18-24 25-34 35-44 45-54 55+
Consistency Evaluation of Chimera Data Source
Mktg, Inc. 12/20/2011 Page 14 of 46
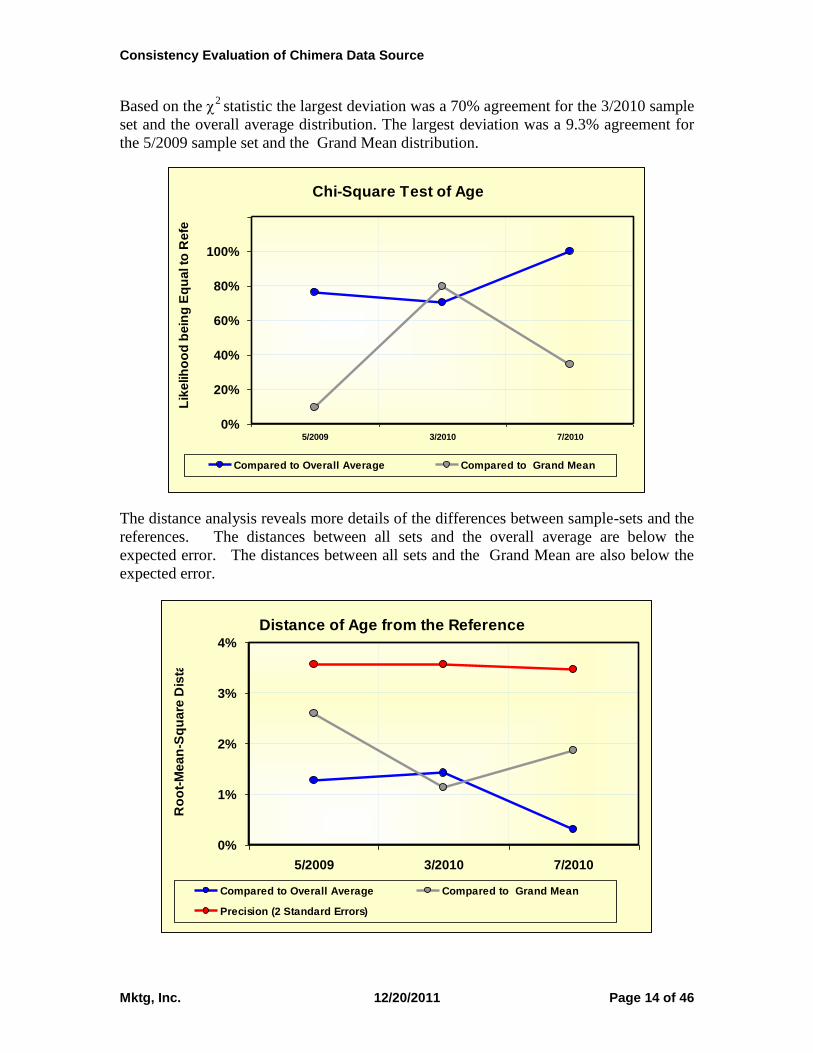
Based on the 2
statistic the largest deviation was a 70% agreement for the 3/2010 sample
set and the overall average distribution. The largest deviation was a 9.3% agreement for
the 5/2009 sample set and the Grand Mean distribution.
Chi-Square Test of Age
0%
20%
40%
60%
80%
100%
120%
5/2009 3/2010 7/2010
Lik
elih
oo
d b
ein
g E
qu
al to
Re
fere
nc
e
Compared to Overall Average Compared to Grand Mean
The distance analysis reveals more details of the differences between sample-sets and the
references. The distances between all sets and the overall average are below the
expected error. The distances between all sets and the Grand Mean are also below the
expected error.
Distance of Age from the Reference
0%
1%
2%
3%
4%
5/2009 3/2010 7/2010
Ro
ot-
Me
an
-Sq
ua
re D
ista
nc
e
Compared to Overall Average Compared to Grand Mean
Precision (2 Standard Errors)

Consistency Evaluation of Chimera Data Source
Mktg, Inc. 12/20/2011 Page 15 of 46
5.2. INCOME DISTRIBUTION
Similarly the income distribution for Chimera sample sets were quota controlled and as
such it would be expected to fall well within the confidence interval of the references, as
shown below. As with the other demographic variables, the error ranges are indicated by
the vertical black lines at the end of the groups. These bounds also consist of 2 standard
errors based on the overall mean values. The space between represents a 95% probability
interval. As expected, due to the quota control, there does not appear to be a major
difference between the 7/2010 sample set and the overall average values. However, that
should be verified with the 2 test below.
Income Distribution Profile
0%
20%
40%
60%
80%
100%
120%
Overall
Average
5/2009 3/2010 7/2010 Grand
Mean
Re
sp
on
de
nt
Pe
rce
nt
Group 1 Group 2 Group 3 Group 4
Consistency Evaluation of Chimera Data Source
Mktg, Inc. 12/20/2011 Page 16 of 46
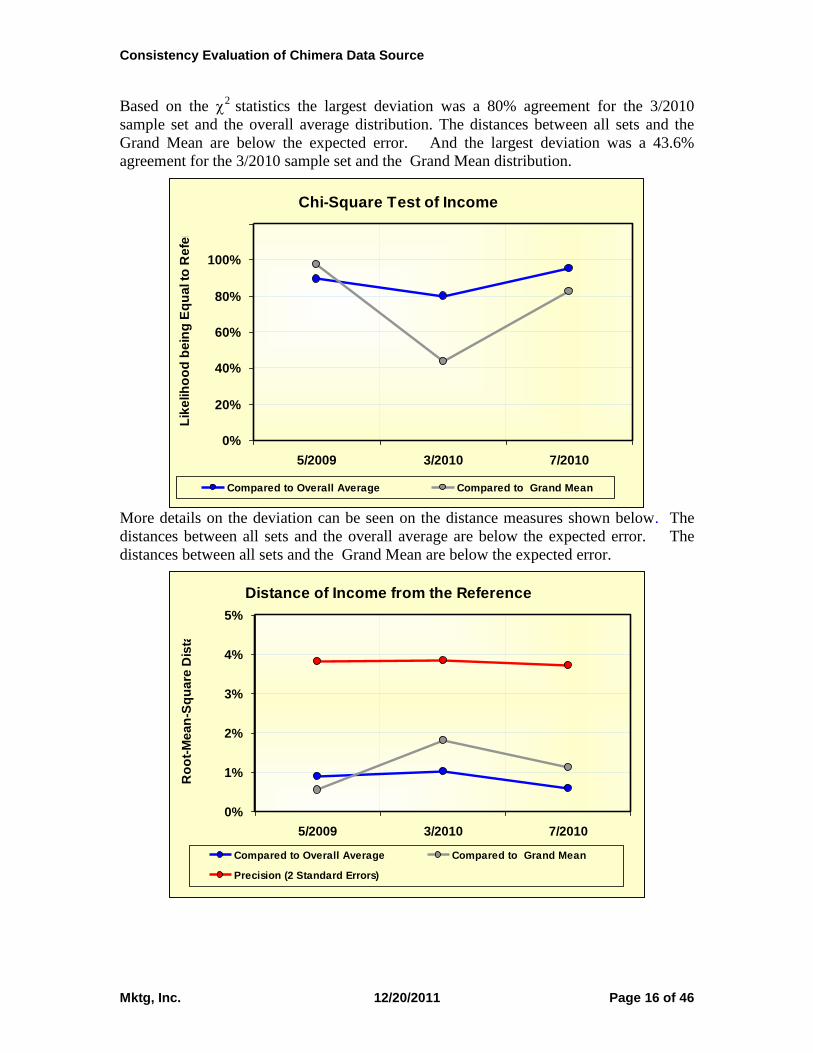
Based on the 2
statistics the largest deviation was a 80% agreement for the 3/2010
sample set and the overall average distribution. The distances between all sets and the
Grand Mean are below the expected error. And the largest deviation was a 43.6%
agreement for the 3/2010 sample set and the Grand Mean distribution.
Chi-Square Test of Income
0%
20%
40%
60%
80%
100%
120%
5/2009 3/2010 7/2010
Lik
elih
oo
d b
ein
g E
qu
al to
Re
fere
nc
e
Compared to Overall Average Compared to Grand Mean
More details on the deviation can be seen on the distance measures shown below. The
distances between all sets and the overall average are below the expected error. The
distances between all sets and the Grand Mean are below the expected error.
Distance of Income from the Reference
0%
1%
2%
3%
4%
5%
5/2009 3/2010 7/2010
Ro
ot-
Me
an
-Sq
ua
re D
ista
nc
e
Compared to Overall Average Compared to Grand Mean
Precision (2 Standard Errors)
Consistency Evaluation of Chimera Data Source
Mktg, Inc. 12/20/2011 Page 17 of 46
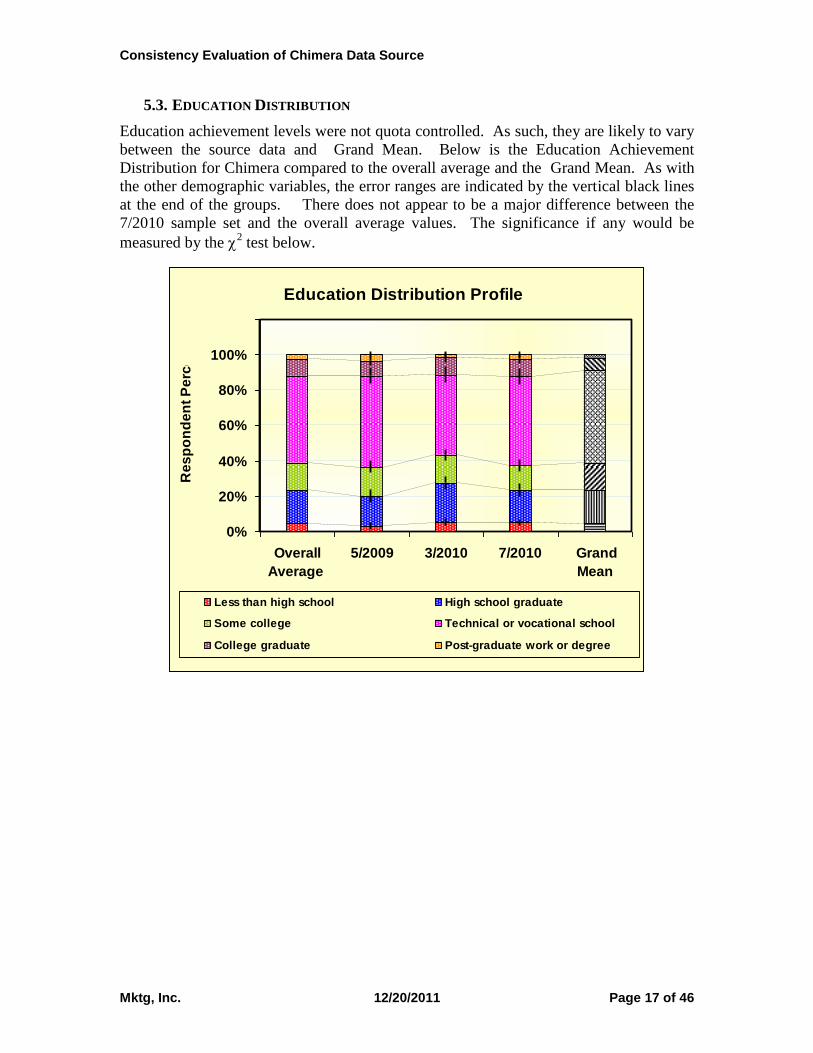
5.3. EDUCATION DISTRIBUTION
Education achievement levels were not quota controlled. As such, they are likely to vary
between the source data and Grand Mean. Below is the Education Achievement
Distribution for Chimera compared to the overall average and the Grand Mean. As with
the other demographic variables, the error ranges are indicated by the vertical black lines
at the end of the groups. There does not appear to be a major difference between the
7/2010 sample set and the overall average values. The significance if any would be
measured by the 2 test below.
Education Distribution Profile
0%
20%
40%
60%
80%
100%
120%
Overall
Average
5/2009 3/2010 7/2010 Grand
Mean
Re
sp
on
de
nt
Pe
rce
nt
Less than high school High school graduate
Some college Technical or vocational school
College graduate Post-graduate work or degree

Consistency Evaluation of Chimera Data Source
Mktg, Inc. 12/20/2011 Page 18 of 46
Based on the 2
statistics the largest deviation was a 23.6% agreement for the 5/2009
sample set and the overall average distribution. The largest deviation was a 1.2%
agreement for the 3/2010 sample set and the Grand Mean distribution.
Chi-Square Test of Education
0%
20%
40%
60%
80%
100%
120%
5/2009 3/2010 7/2010
Lik
elih
oo
d b
ein
g E
qu
al to
Re
fere
nc
e
Compared to Overall Average Compared to Grand Mean
More details on the deviation can be seen on the distance measures shown below. The
distances between all sets and the overall average are below the expected error.
Distance of Education from the Reference
0%
5%
5/2009 3/2010 7/2010
Ro
ot-
Me
an
-Sq
ua
re D
ista
nc
e
Compared to Overall Average Compared to Grand Mean
Precision (2 Standard Errors)
Consistency Evaluation of Chimera Data Source
Mktg, Inc. 12/20/2011 Page 19 of 46
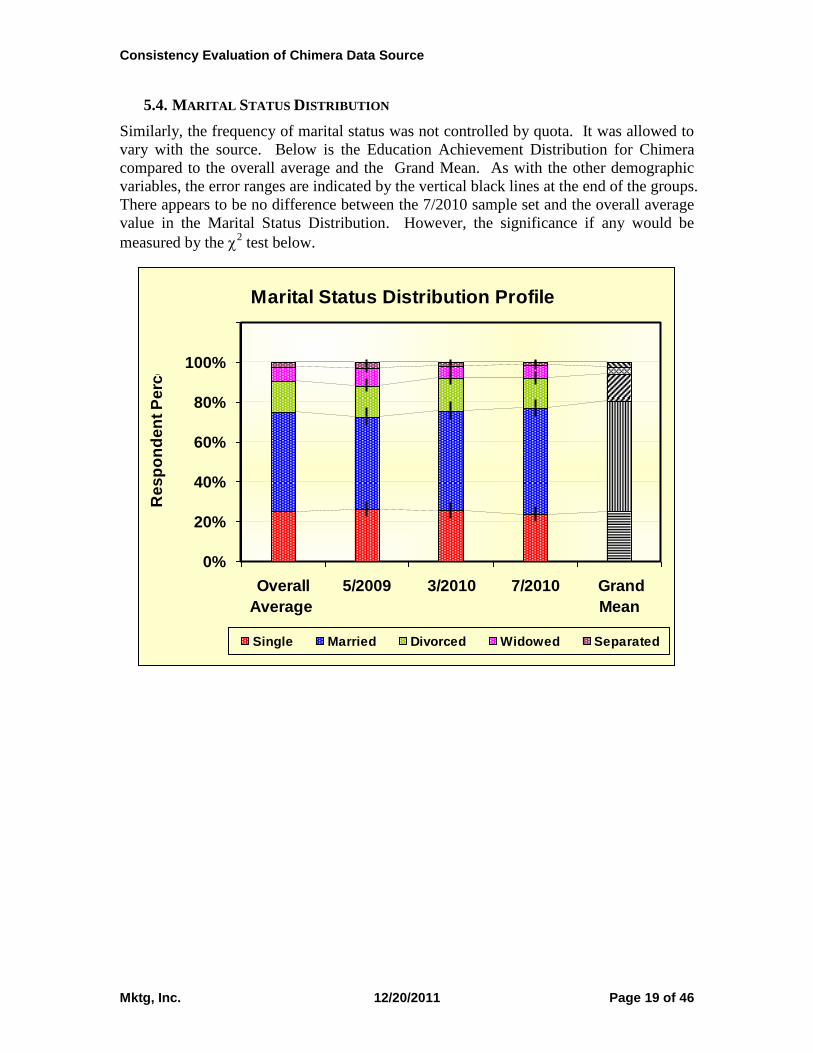
5.4. MARITAL STATUS DISTRIBUTION
Similarly, the frequency of marital status was not controlled by quota. It was allowed to
vary with the source. Below is the Education Achievement Distribution for Chimera
compared to the overall average and the Grand Mean. As with the other demographic
variables, the error ranges are indicated by the vertical black lines at the end of the groups.
There appears to be no difference between the 7/2010 sample set and the overall average
value in the Marital Status Distribution. However, the significance if any would be
measured by the 2 test below.
Marital Status Distribution Profile
0%
20%
40%
60%
80%
100%
120%
Overall
Average
5/2009 3/2010 7/2010 Grand
Mean
Re
sp
on
de
nt
Pe
rce
nt
Single Married Divorced Widowed Separated
Consistency Evaluation of Chimera Data Source
Mktg, Inc. 12/20/2011 Page 20 of 46
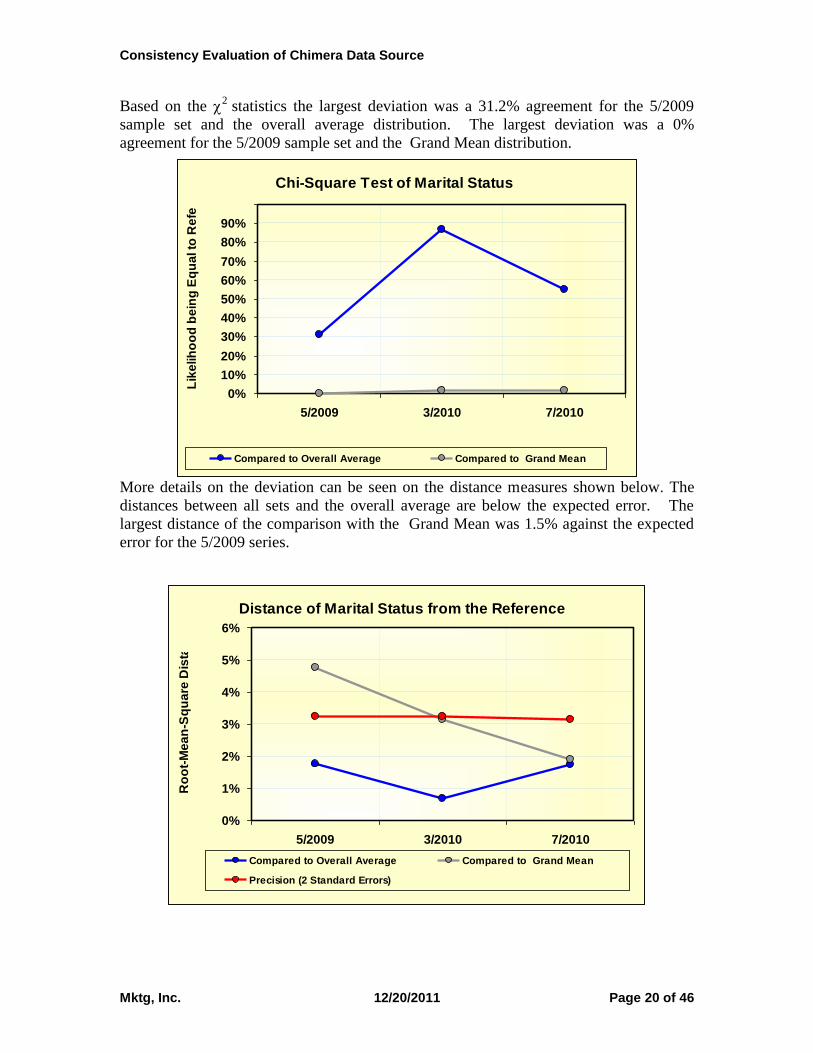
Based on the 2
statistics the largest deviation was a 31.2% agreement for the 5/2009
sample set and the overall average distribution. The largest deviation was a 0%
agreement for the 5/2009 sample set and the Grand Mean distribution.
Chi-Square Test of Marital Status
0%
10%
20%
30%
40%
50%
60%
70%
80%
90%
100%
5/2009 3/2010 7/2010
Lik
elih
oo
d b
ein
g E
qu
al to
Re
fere
nc
e
Compared to Overall Average Compared to Grand Mean
More details on the deviation can be seen on the distance measures shown below. The
distances between all sets and the overall average are below the expected error. The
largest distance of the comparison with the Grand Mean was 1.5% against the expected
error for the 5/2009 series.
Distance of Marital Status from the Reference
0%
1%
2%
3%
4%
5%
6%
5/2009 3/2010 7/2010
Ro
ot-
Me
an
-Sq
ua
re D
ista
nc
e
Compared to Overall Average Compared to Grand Mean
Precision (2 Standard Errors)

Consistency Evaluation of Chimera Data Source
Mktg, Inc. 12/20/2011 Page 21 of 46
6. STRUCTURAL SEGMENT DISTRIBUTIONS
In the previous section, we examined distributed demographic measures to identify the
basic consistency of the sources over time. These reflect the operations of the panel or
list source, but not the consistency nature of the respondents themselves. Typically,
panels and lists are filtered to balance demographics against some external standard such
as the known general population. However, this still does not assure that the source
maintains the targeted group of respondents. Structural segmentation is designed to
capture the distribution of alternative groups of customers that are expected to impact the
studies executed using these sources of data.
The key issue is to identify driving factors that need to be addressed to assure an effective
sample. These are “pragmatic” issues in that they represent concerns regarding the
makeup of panels and sources as they would affect studies. Here we use the term
“pragmatic” in that it is not a theoretical construct of what should happen, but what is
expected to happen. Studies involving purchases will depend on the distribution of
“buyer behavior” segments and media studies would depend on the distribution of “media
use” segments, for example.
In order to construct a functional segmentation scheme, the underlying groups should be
based on the identification of highly stable groups. While segments are initially
identified using statistical cluster analysis, they are defined by predictor models (Logit
models) in order to assure consistent definition and assignment
Three segmentation schemes are being used in this evaluation focusing on: (1) Buyer
Behavior, (2) Sociographic Factors, and (3) Media Use Factors. These are not the only
segmentation schemes that can be developed for this process. However, these were well
supported by the test questionnaire and fulfilled the requirements as structural segments
and are used for consistency testing.
Consistency Evaluation of Chimera Data Source
Mktg, Inc. 12/20/2011 Page 22 of 46
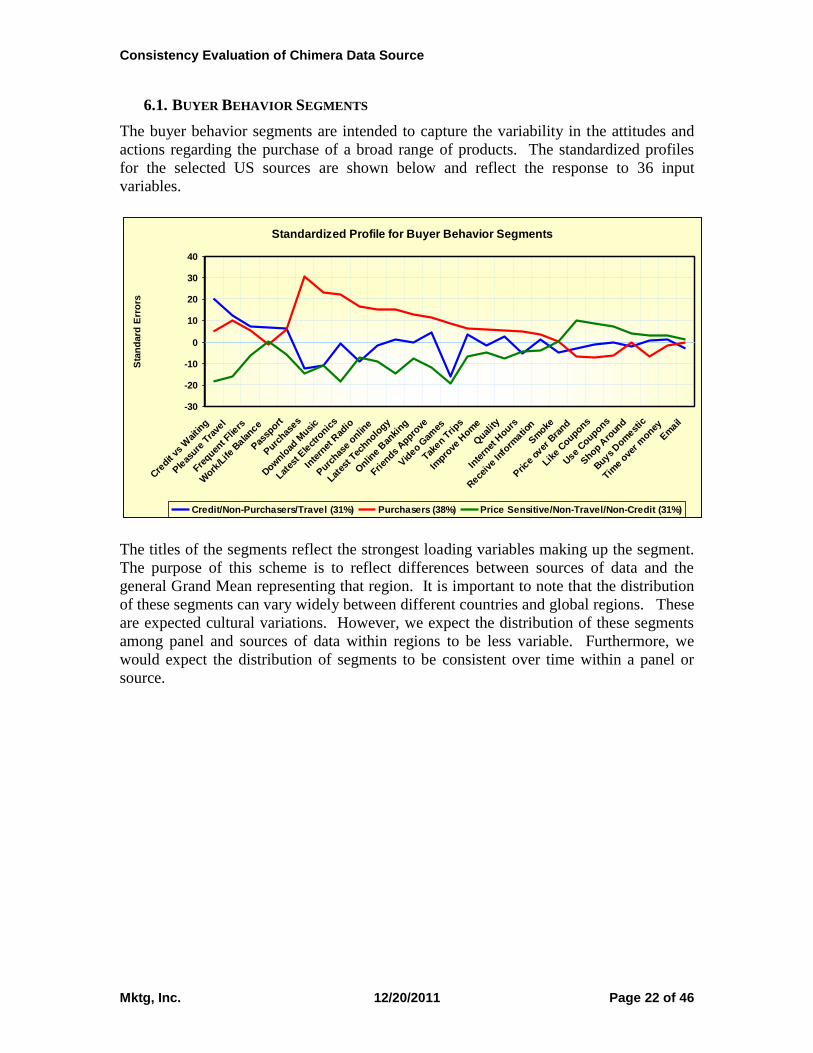
6.1. BUYER BEHAVIOR SEGMENTS
The buyer behavior segments are intended to capture the variability in the attitudes and
actions regarding the purchase of a broad range of products. The standardized profiles
for the selected US sources are shown below and reflect the response to 36 input
variables.
Standardized Profile for Buyer Behavior Segments
-30
-20
-10
0
10
20
30
40
Cre
dit vs
Waitin
g
Ple
asure
Tra
vel
Frequen
t Flie
rs
Work
/Life
Bala
nce
Pas
sport
Purc
hases
Dow
nload
Musi
c
Lates
t Ele
ctro
nics
Inte
rnet
Rad
io
Purc
hase o
nline
Lates
t Tec
hnology
Onlin
e Ban
king
Frien
ds Appro
ve
Vid
eo Gam
es
Taken T
rips
Impro
ve H
ome
Qual
ity
Inte
rnet
Hours
Rece
ive
Info
rmatio
n
Sm
oke
Pric
e ov
er B
rand
Like
Coupons
Use
Coupons
Shop A
roun
d
Buys
Dom
estic
Time
over m
oney
Em
ail
Sta
nd
ard
Err
ors
Credit/Non-Purchasers/Travel (31%) Purchasers (38%) Price Sensitive/Non-Travel/Non-Credit (31%)
The titles of the segments reflect the strongest loading variables making up the segment.
The purpose of this scheme is to reflect differences between sources of data and the
general Grand Mean representing that region. It is important to note that the distribution
of these segments can vary widely between different countries and global regions. These
are expected cultural variations. However, we expect the distribution of these segments
among panel and sources of data within regions to be less variable. Furthermore, we
would expect the distribution of segments to be consistent over time within a panel or
source.

Consistency Evaluation of Chimera Data Source
Mktg, Inc. 12/20/2011 Page 23 of 46
Below is the comparison between the buyer segment distributions for Chimera and the
overall average and the Grand Mean. As with the other variables, the error ranges are
indicated by the vertical black lines at the end of the groups. There does not appear to
be a major difference between the 7/2010 sample set and the overall average value in the
Buyer Behavior Segment Distribution. However, the significance if any are measured
need to be explored based on the 2 test below.
Buyer Behavior Segment Distribution Profile
0%
20%
40%
60%
80%
100%
120%
Overall
Average
5/2009 3/2010 7/2010 Grand
Mean
Re
sp
on
de
nt
Pe
rce
nt
Price Sensitive/Non-Purchasers
Purchasers
Credit/Non-Purchasers
Consistency Evaluation of Chimera Data Source
Mktg, Inc. 12/20/2011 Page 24 of 46
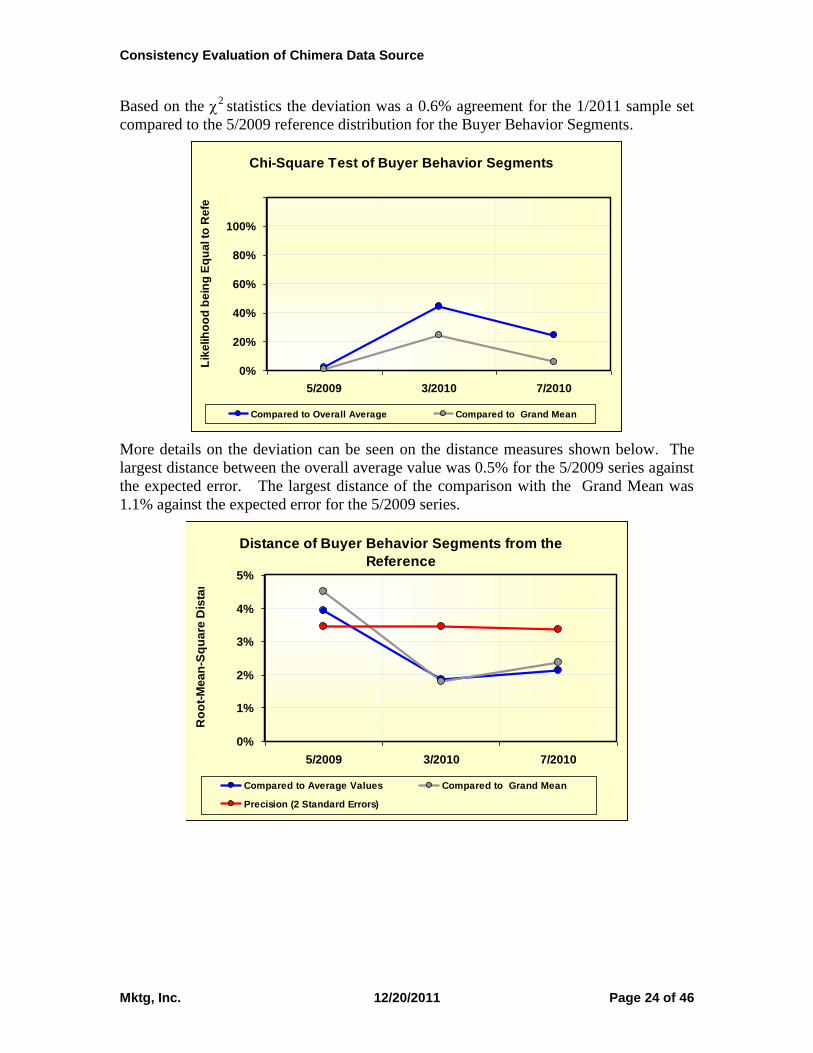
Based on the 2
statistics the deviation was a 0.6% agreement for the 1/2011 sample set
compared to the 5/2009 reference distribution for the Buyer Behavior Segments.
Chi-Square Test of Buyer Behavior Segments
0%
20%
40%
60%
80%
100%
120%
5/2009 3/2010 7/2010
Lik
elih
oo
d b
ein
g E
qu
al to
Re
fere
nc
e
Compared to Overall Average Compared to Grand Mean
More details on the deviation can be seen on the distance measures shown below. The
largest distance between the overall average value was 0.5% for the 5/2009 series against
the expected error. The largest distance of the comparison with the Grand Mean was
1.1% against the expected error for the 5/2009 series.
Distance of Buyer Behavior Segments from the
Reference
0%
1%
2%
3%
4%
5%
5/2009 3/2010 7/2010
Ro
ot-
Me
an
-Sq
ua
re D
ista
nc
es
Compared to Average Values Compared to Grand Mean
Precision (2 Standard Errors)

Consistency Evaluation of Chimera Data Source
Mktg, Inc. 12/20/2011 Page 25 of 46
6.2. SOCIOGRAPHIC SEGMENTS
The sociographic segments are intended to capture the variability in behavior and
attitudes regarding a broad range of life style decisions. The standardized profiles are
shown below and reflect the response to 31 input variables from a selected US sample
source.
Standardized Profile for Sociographic Segments
-30
-20
-10
0
10
20
30
Glo
bal W
armin
g
Alc
ohol off T
V
Child
ren A
ds off
TV
Lower
Std
to C
onserv
e
No C
ompute
rTV
Soci
al N
etwork
Inst
ant M
essa
ging
Contr
ibute
On L
ine
Blo
g
Shar
e Pictu
res
Dow
nload
Vid
eo
On-li
ne Cal
endar
Gam
es O
nline
Frien
ds Appro
ve
Enjo
y Ris
ks
Aske
d for fin
anci
al a
dvice
Unconv
entio
nal
Com
puters
mak
es Eas
ier
Mag
Too much
coner
n envi
ronm
ent
Spea
k M
ind
Rese
archM
odes
Happy
w/ S
td o
f Liv
ing
Sta
y Info
rmed
Good w
ork/li
fe B
alanc
e
Enjo
y Polit
ics
Radio
Pas
sport
Read
Sunday
New
spap
er
Read
New
paper
Sta
nd
ard
Err
ors
Concerned/Not Social Networked (36%) Social Networked (41%) Not Concerned/Not On-line (23%)
As in the case of the buyer behavior segments, the titles of the segments reflect the
strongest loading variables making up the segment. As in the case of the other structural
segments, it is important to note that the distributions of these segments are expected to
vary widely between different countries and global regions. However, once again we
expect the distribution of these segments over time to be consistent.

Consistency Evaluation of Chimera Data Source
Mktg, Inc. 12/20/2011 Page 26 of 46
Below is the comparison between the sociographic segment distributions for Chimera and
the overall average and the Grand Mean. There does not appear to be a major difference
between the 7/2010 sample set and the overall average value in the Sociographic
Segment Distribution. However, the significance if any are measured need to be
explored based on the 2 test below.
Sociographic Segment Distribution Profile
0%
20%
40%
60%
80%
100%
120%
Overall
Average
5/2009 3/2010 7/2010 Grand
Mean
Re
sp
on
de
nt
Pe
rce
nt
Not Concerned/Not On-line
Social Networked
Concerned/Not Social Networked
Consistency Evaluation of Chimera Data Source
Mktg, Inc. 12/20/2011 Page 27 of 46
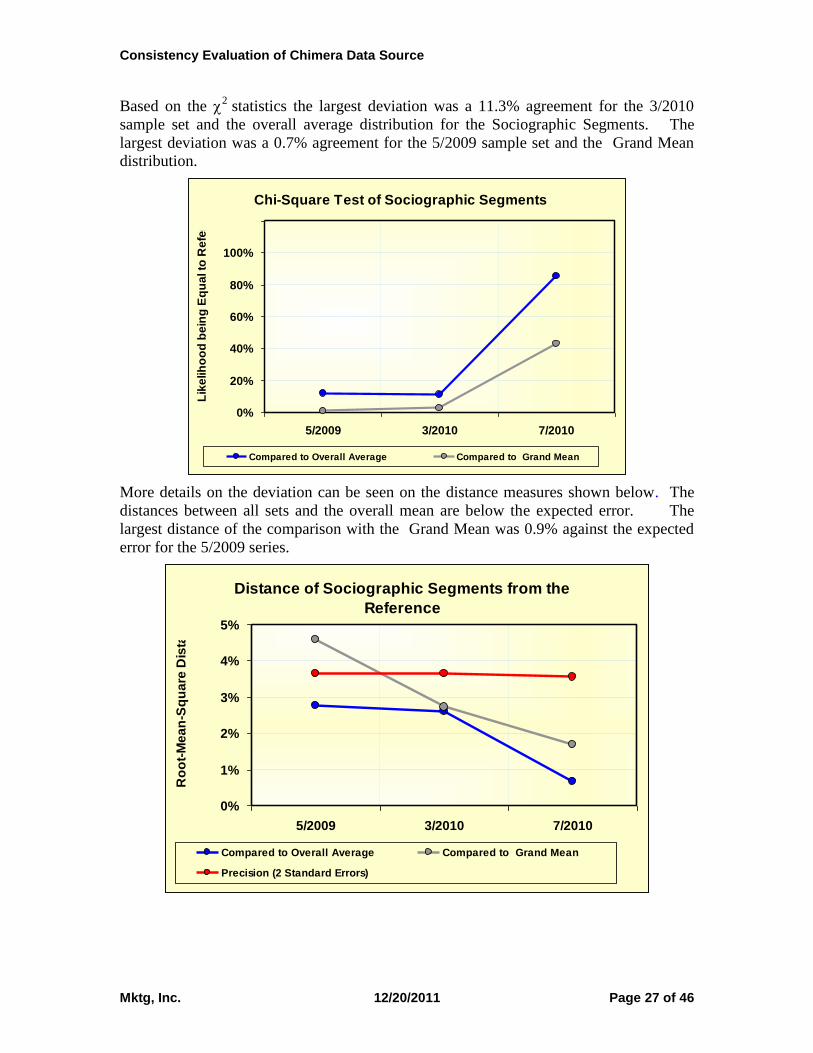
Based on the 2
statistics the largest deviation was a 11.3% agreement for the 3/2010
sample set and the overall average distribution for the Sociographic Segments. The
largest deviation was a 0.7% agreement for the 5/2009 sample set and the Grand Mean
distribution.
Chi-Square Test of Sociographic Segments
0%
20%
40%
60%
80%
100%
120%
5/2009 3/2010 7/2010
Lik
elih
oo
d b
ein
g E
qu
al to
Re
fere
nc
e
Compared to Overall Average Compared to Grand Mean
More details on the deviation can be seen on the distance measures shown below. The
distances between all sets and the overall mean are below the expected error. The
largest distance of the comparison with the Grand Mean was 0.9% against the expected
error for the 5/2009 series.
Distance of Sociographic Segments from the
Reference
0%
1%
2%
3%
4%
5%
5/2009 3/2010 7/2010
Ro
ot-
Me
an
-Sq
ua
re D
ista
nc
e
Compared to Overall Average Compared to Grand Mean
Precision (2 Standard Errors)
Consistency Evaluation of Chimera Data Source
Mktg, Inc. 12/20/2011 Page 28 of 46
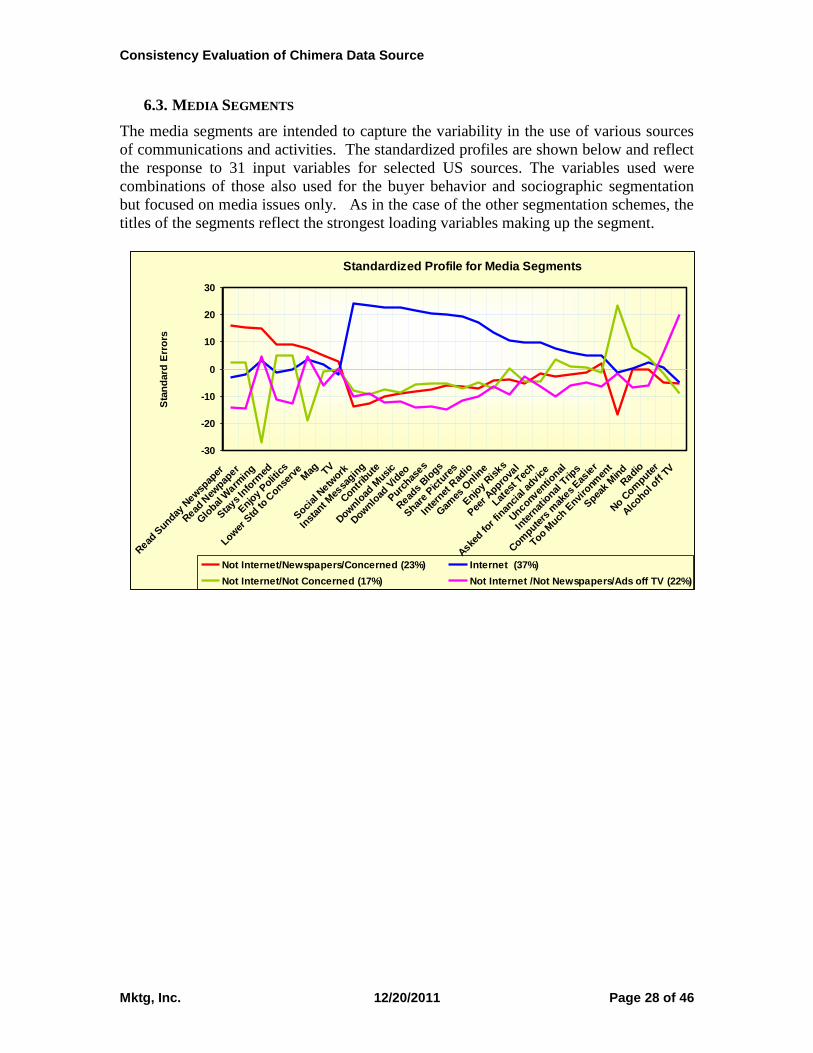
6.3. MEDIA SEGMENTS
The media segments are intended to capture the variability in the use of various sources
of communications and activities. The standardized profiles are shown below and reflect
the response to 31 input variables for selected US sources. The variables used were
combinations of those also used for the buyer behavior and sociographic segmentation
but focused on media issues only. As in the case of the other segmentation schemes, the
titles of the segments reflect the strongest loading variables making up the segment.
Standardized Profile for Media Segments
-30
-20
-10
0
10
20
30
Read
Sunday
New
spap
er
Read
New
paper
Glo
bal W
armin
g
Sta
ys In
form
ed
Enjo
y Polit
ics
Lower
Std
to C
onserv
eM
ag TV
Soci
al N
etwork
Inst
ant M
essa
ging
Contr
ibute
Dow
nload
Musi
c
Dow
nload
Vid
eo
Purc
hases
Read
s Blo
gs
Shar
e Pictu
res
Inte
rnet
Rad
io
Gam
es O
nline
Enjo
y Ris
ks
Pee
r Appro
val
Lates
t Tec
h
Aske
d for fin
anci
al a
dvice
Unconv
entio
nal
Inte
rnat
ional
Trip
s
Com
puters
mak
es Eas
ier
Too Much
Envi
ronm
ent
Spea
k M
ind
Radio
No C
ompute
r
Alc
ohol off T
V
Sta
nd
ard
Err
ors
Not Internet/Newspapers/Concerned (23%) Internet (37%)
Not Internet/Not Concerned (17%) Not Internet /Not Newspapers/Ads off TV (22%)

Consistency Evaluation of Chimera Data Source
Mktg, Inc. 12/20/2011 Page 29 of 46
Below is the comparison between the media segment distributions for Chimera and the
references. There does not appear to be a major difference between the 7/2010 sample
set and the overall average value in the Media Segment Distribution. However, the
significance if any are measured need to be explored based on the 2 test below.
Media Segment Distribution Profile
0%
20%
40%
60%
80%
100%
120%
Overall
Average
5/2009 3/2010 7/2010 Grand
Mean
Resp
on
den
t P
erc
en
t
Not Internet /Not Newspapers/Concerned
Not Internet/Not Concerned
Internet
Not Internet/Newspapers/Concerned
Consistency Evaluation of Chimera Data Source
Mktg, Inc. 12/20/2011 Page 30 of 46
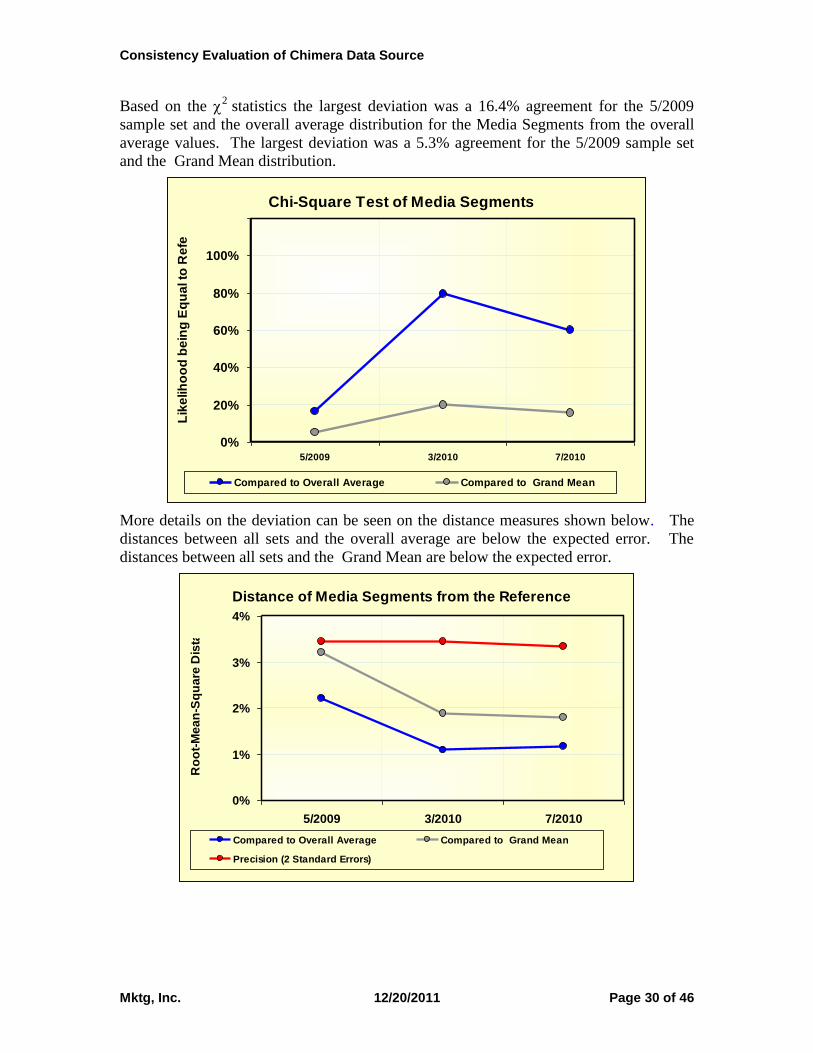
Based on the 2
statistics the largest deviation was a 16.4% agreement for the 5/2009
sample set and the overall average distribution for the Media Segments from the overall
average values. The largest deviation was a 5.3% agreement for the 5/2009 sample set
and the Grand Mean distribution.
Chi-Square Test of Media Segments
0%
20%
40%
60%
80%
100%
120%
5/2009 3/2010 7/2010
Lik
elih
oo
d b
ein
g E
qu
al to
Re
fere
nc
e
Compared to Overall Average Compared to Grand Mean
More details on the deviation can be seen on the distance measures shown below. The
distances between all sets and the overall average are below the expected error. The
distances between all sets and the Grand Mean are below the expected error.
Distance of Media Segments from the Reference
0%
1%
2%
3%
4%
5/2009 3/2010 7/2010
Ro
ot-
Me
an
-Sq
ua
re D
ista
nc
e
Compared to Overall Average Compared to Grand Mean
Precision (2 Standard Errors)
Consistency Evaluation of Chimera Data Source
Mktg, Inc. 12/20/2011 Page 31 of 46
7. SOURCE PERFORMANCE
There are several types of metrics that provide measure of effective panel and source
performance. As previously mentioned these are often fundamental issues reflecting the
mechanism of generating and encouraging participants. While each of these measures
reflects the potential of respondents generating erroneous responses, each one in isolation
may only be a random error. However, we would expect consistency on the appearance
of these effects.
Performance- The incidence of errors in the execution of questionnaires reflects the
quality of the panel. These are “checks” designed into the testing instrument. They
include but are not limited by: (1) inconsistency in responding to multiple questions and
(2) the failure to follow instructions.
Characteristics - The characteristics or structure reflects the nature of the participants
in the panels. In general, these focus on issues and concerns with the long term
maintenance and in particularly the tendency of containing “professional” participants.
These metrics may include participants, who belong to multiple panels, have been on
panels for an extended period of time or who take multiple surveys frequently.
Satisficing – Respondents occasionally show extraordinary characteristics. These are
not errors, just extreme behavior which provides a potential warning of problems. These
include: (1) “speeders” who finish their questionnaire in extraordinarily short time and (2)
“straight-liners” who tend to give the same answer to a large number of questions.
Consistency Evaluation of Chimera Data Source
Mktg, Inc. 12/20/2011 Page 32 of 46
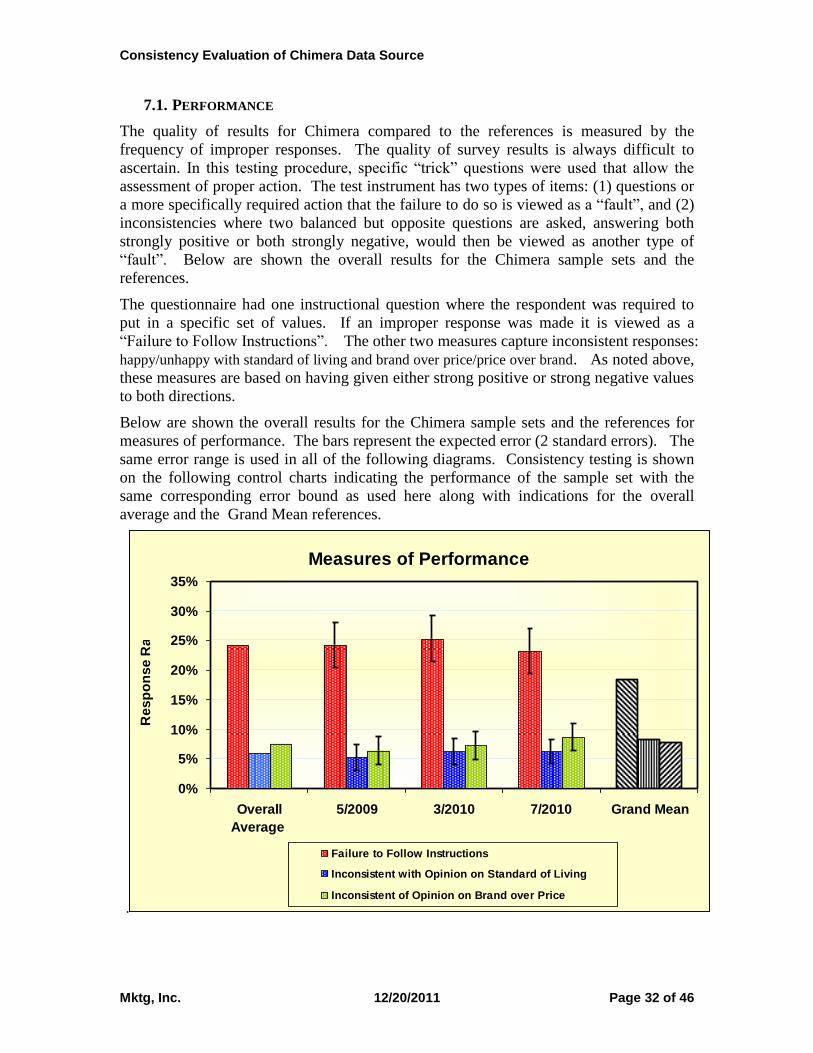
7.1. PERFORMANCE
The quality of results for Chimera compared to the references is measured by the
frequency of improper responses. The quality of survey results is always difficult to
ascertain. In this testing procedure, specific “trick” questions were used that allow the
assessment of proper action. The test instrument has two types of items: (1) questions or
a more specifically required action that the failure to do so is viewed as a “fault”, and (2)
inconsistencies where two balanced but opposite questions are asked, answering both
strongly positive or both strongly negative, would then be viewed as another type of
“fault”. Below are shown the overall results for the Chimera sample sets and the
references.
The questionnaire had one instructional question where the respondent was required to
put in a specific set of values. If an improper response was made it is viewed as a
“Failure to Follow Instructions”. The other two measures capture inconsistent responses:
happy/unhappy with standard of living and brand over price/price over brand. As noted above,
these measures are based on having given either strong positive or strong negative values
to both directions.
Below are shown the overall results for the Chimera sample sets and the references for
measures of performance. The bars represent the expected error (2 standard errors). The
same error range is used in all of the following diagrams. Consistency testing is shown
on the following control charts indicating the performance of the sample set with the
same corresponding error bound as used here along with indications for the overall
average and the Grand Mean references.
.
Measures of Performance
0%
5%
10%
15%
20%
25%
30%
35%
Overall
Average
5/2009 3/2010 7/2010 Grand Mean
Re
sp
on
se
Ra
te
Failure to Follow Instructions
Inconsistent with Opinion on Standard of Living
Inconsistent of Opinion on Brand over Price
Consistency Evaluation of Chimera Data Source
Mktg, Inc. 12/20/2011 Page 33 of 46
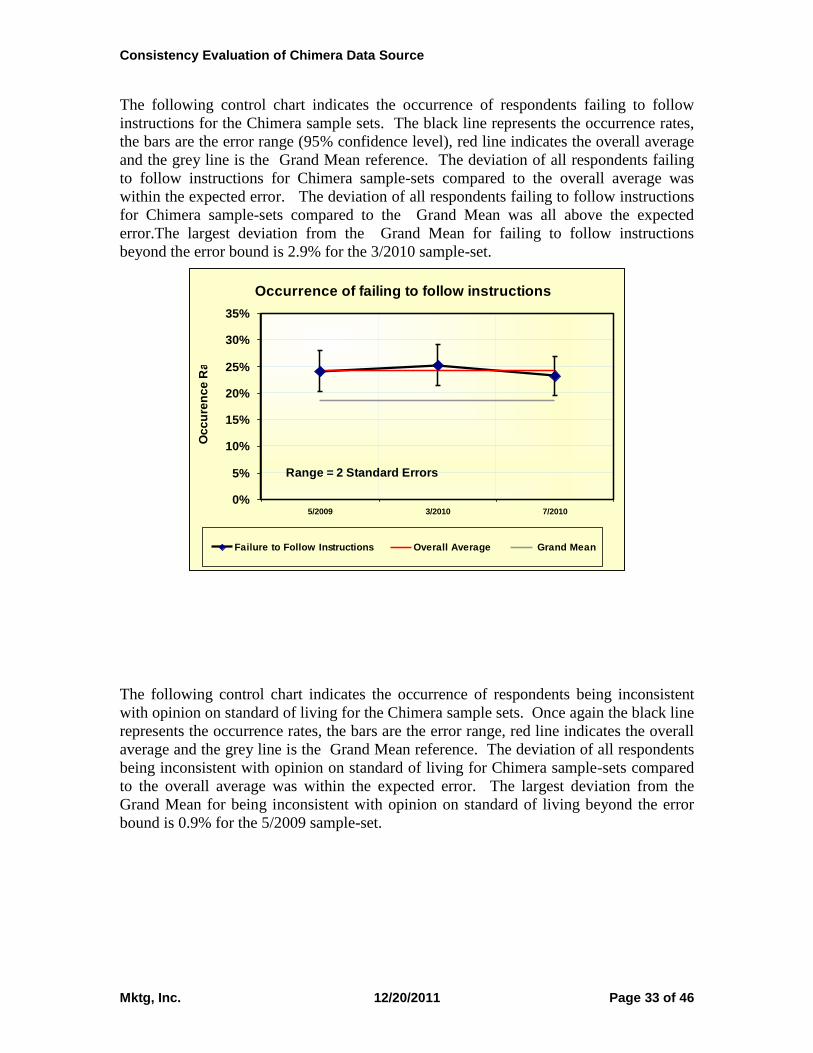
The following control chart indicates the occurrence of respondents failing to follow
instructions for the Chimera sample sets. The black line represents the occurrence rates,
the bars are the error range (95% confidence level), red line indicates the overall average
and the grey line is the Grand Mean reference. The deviation of all respondents failing
to follow instructions for Chimera sample-sets compared to the overall average was
within the expected error. The deviation of all respondents failing to follow instructions
for Chimera sample-sets compared to the Grand Mean was all above the expected
error.The largest deviation from the Grand Mean for failing to follow instructions
beyond the error bound is 2.9% for the 3/2010 sample-set.
Occurrence of failing to follow instructions
0%
5%
10%
15%
20%
25%
30%
35%
5/2009 3/2010 7/2010
Oc
cu
ren
ce
Ra
te
Failure to Follow Instructions Overall Average Grand Mean
Range = 2 Standard Errors
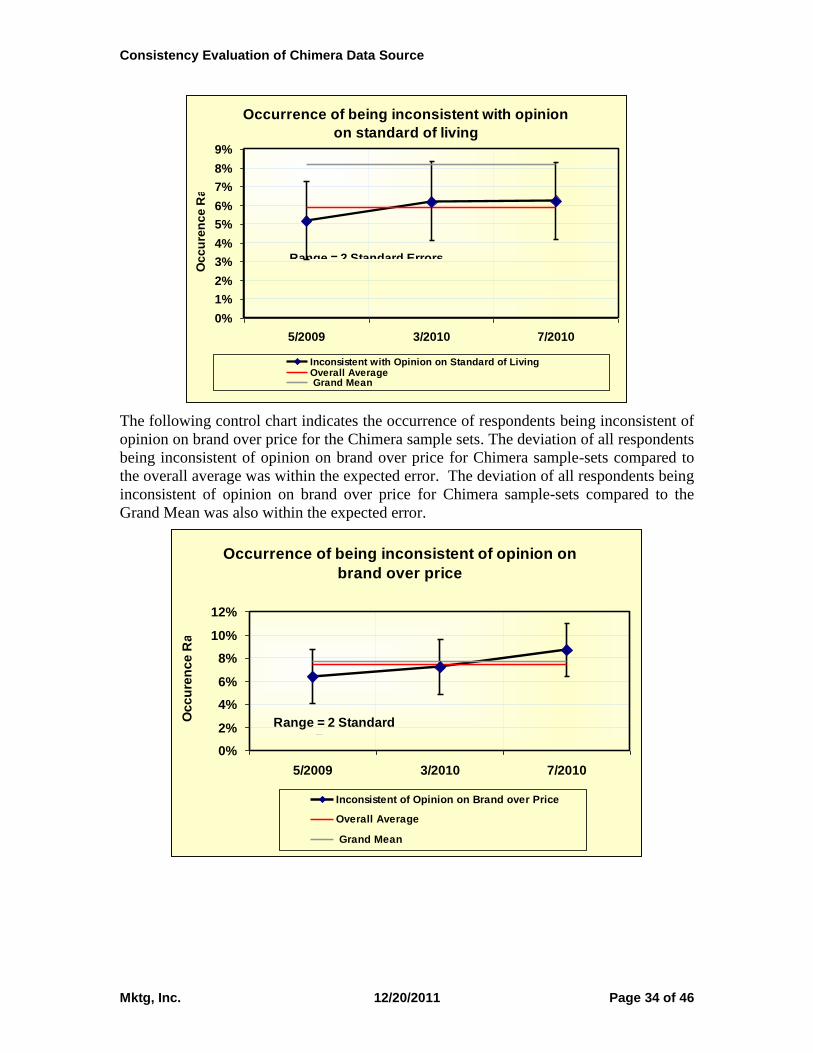
The following control chart indicates the occurrence of respondents being inconsistent
with opinion on standard of living for the Chimera sample sets. Once again the black line
represents the occurrence rates, the bars are the error range, red line indicates the overall
average and the grey line is the Grand Mean reference. The deviation of all respondents
being inconsistent with opinion on standard of living for Chimera sample-sets compared
to the overall average was within the expected error. The largest deviation from the
Grand Mean for being inconsistent with opinion on standard of living beyond the error
bound is 0.9% for the 5/2009 sample-set.
Consistency Evaluation of Chimera Data Source
Mktg, Inc. 12/20/2011 Page 34 of 46
Occurrence of being inconsistent with opinion
on standard of living
0%
1%
2%
3%
4%
5%
6%
7%
8%
9%
5/2009 3/2010 7/2010
Oc
cu
ren
ce
Ra
te
Inconsistent with Opinion on Standard of LivingOverall Average Grand Mean
Range = 2 Standard Errors
The following control chart indicates the occurrence of respondents being inconsistent of
opinion on brand over price for the Chimera sample sets. The deviation of all respondents
being inconsistent of opinion on brand over price for Chimera sample-sets compared to
the overall average was within the expected error. The deviation of all respondents being
inconsistent of opinion on brand over price for Chimera sample-sets compared to the
Grand Mean was also within the expected error.
Occurrence of being inconsistent of opinion on
brand over price
0%
2%
4%
6%
8%
10%
12%
5/2009 3/2010 7/2010
Oc
cu
ren
ce
Ra
te
Inconsistent of Opinion on Brand over Price
Overall Average
Grand Mean
Range = 2 Standard
Errors
Consistency Evaluation of Chimera Data Source
Mktg, Inc. 12/20/2011 Page 35 of 46
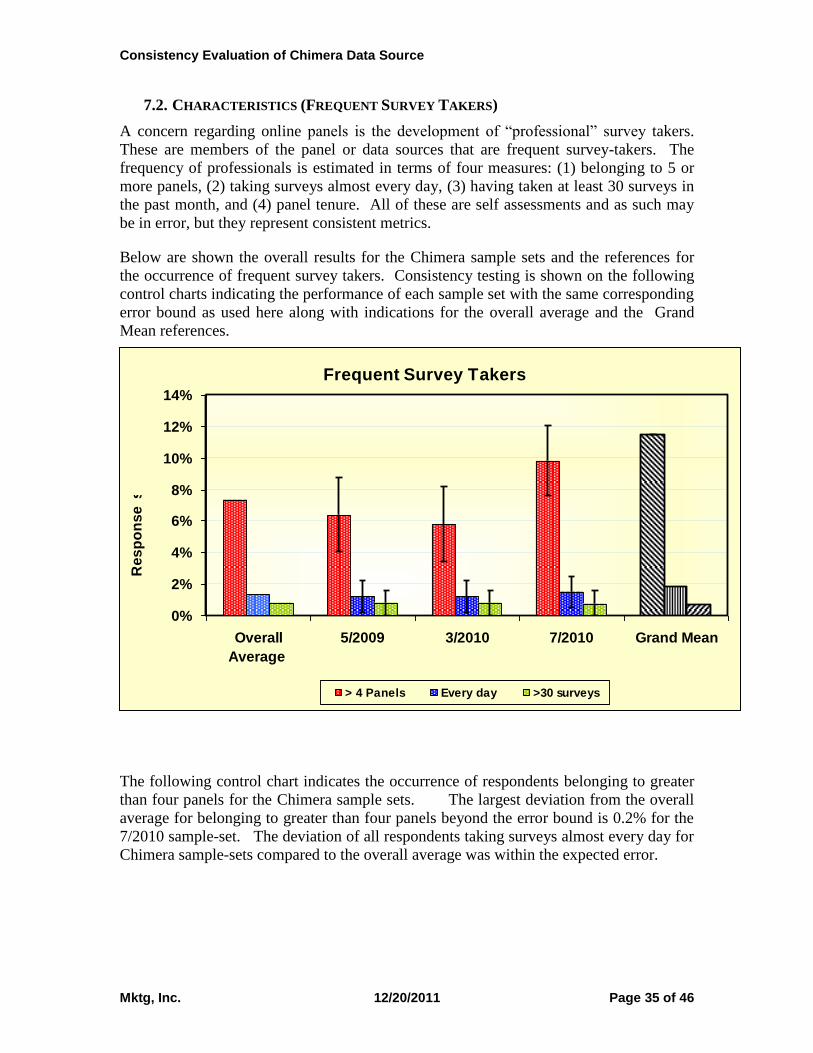
7.2. CHARACTERISTICS (FREQUENT SURVEY TAKERS)
A concern regarding online panels is the development of “professional” survey takers.
These are members of the panel or data sources that are frequent survey-takers. The
frequency of professionals is estimated in terms of four measures: (1) belonging to 5 or
more panels, (2) taking surveys almost every day, (3) having taken at least 30 surveys in
the past month, and (4) panel tenure. All of these are self assessments and as such may
be in error, but they represent consistent metrics.
Below are shown the overall results for the Chimera sample sets and the references for
the occurrence of frequent survey takers. Consistency testing is shown on the following
control charts indicating the performance of each sample set with the same corresponding
error bound as used here along with indications for the overall average and the Grand
Mean references.
Frequent Survey Takers
0%
2%
4%
6%
8%
10%
12%
14%
Overall
Average
5/2009 3/2010 7/2010 Grand Mean
Re
sp
on
se
s
e
> 4 Panels Every day >30 surveys
The following control chart indicates the occurrence of respondents belonging to greater
than four panels for the Chimera sample sets. The largest deviation from the overall
average for belonging to greater than four panels beyond the error bound is 0.2% for the
7/2010 sample-set. The deviation of all respondents taking surveys almost every day for
Chimera sample-sets compared to the overall average was within the expected error.

Consistency Evaluation of Chimera Data Source
Mktg, Inc. 12/20/2011 Page 36 of 46
Occurrence of belonging to greater than four panels
0%
2%
4%
6%
8%
10%
12%
14%
5/2009 3/2010 7/2010
Oc
cu
ren
ce
Ra
te
belonging to greater than four panels Overall Average Grand Mean
Range = 2 Standard Errors
The occurrence of respondents taking surveys almost every day for the Chimera sample
sets is shown on the following chart. The deviation of all respondents taking surveys
almost every day for Chimera sample-sets compared to the overall average was within
the expected error. The deviation of all respondents taking surveys almost every day for
Chimera sample-sets compared to the Grand Mean was also within the expected error.
Occurrence of taking surveys almost every day
0%
1%
2%
3%
5/2009 3/2010 7/2010
Oc
cu
ren
ce
Ra
te
taking surveys almost every day Overall Average Grand Mean
Range = 2 Standard Errors
Consistency Evaluation of Chimera Data Source
Mktg, Inc. 12/20/2011 Page 37 of 46
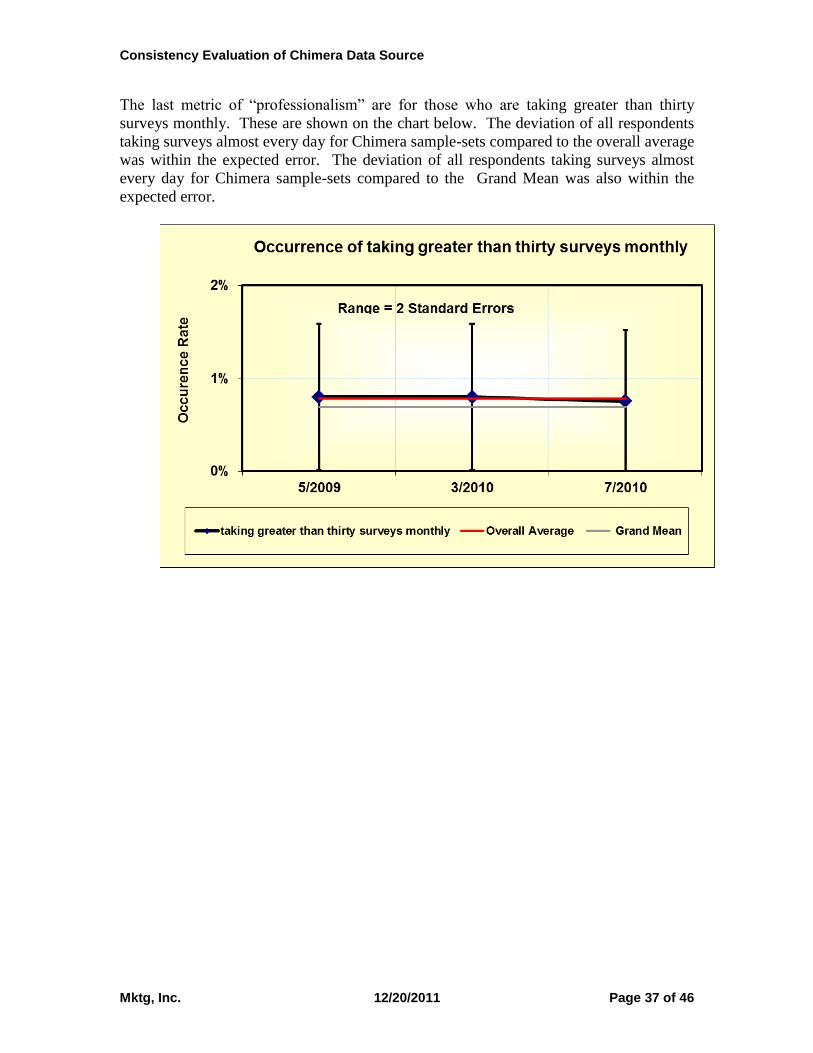
The last metric of “professionalism” are for those who are taking greater than thirty
surveys monthly. These are shown on the chart below. The deviation of all respondents
taking surveys almost every day for Chimera sample-sets compared to the overall average
was within the expected error. The deviation of all respondents taking surveys almost
every day for Chimera sample-sets compared to the Grand Mean was also within the
expected error.
Consistency Evaluation of Chimera Data Source
Mktg, Inc. 12/20/2011 Page 38 of 46
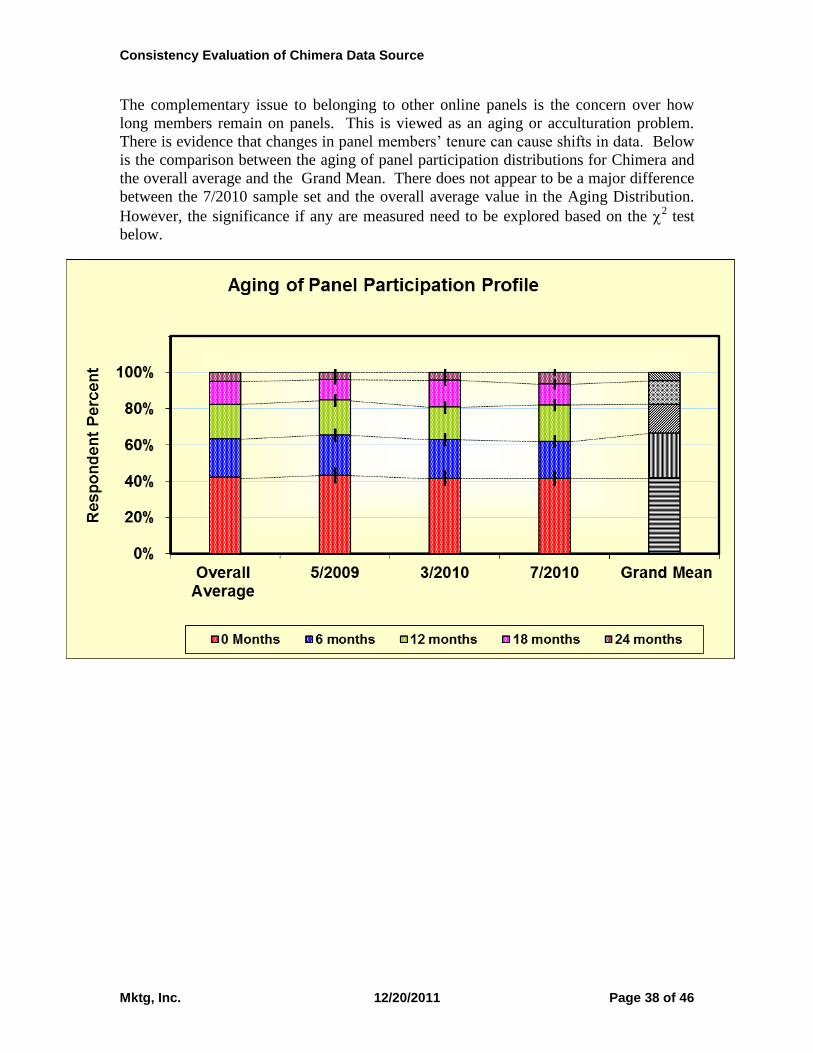
The complementary issue to belonging to other online panels is the concern over how
long members remain on panels. This is viewed as an aging or acculturation problem.
There is evidence that changes in panel members’ tenure can cause shifts in data. Below
is the comparison between the aging of panel participation distributions for Chimera and
the overall average and the Grand Mean. There does not appear to be a major difference
between the 7/2010 sample set and the overall average value in the Aging Distribution.
However, the significance if any are measured need to be explored based on the 2 test
below.
Consistency Evaluation of Chimera Data Source
Mktg, Inc. 12/20/2011 Page 39 of 46
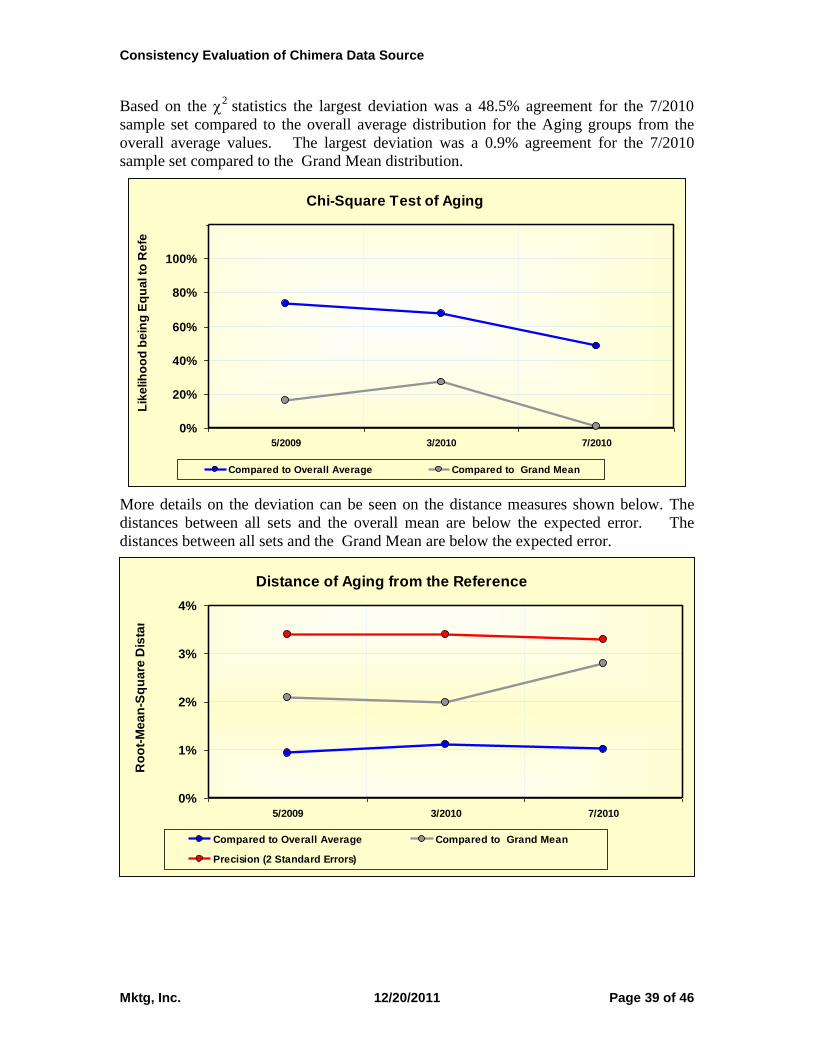
Based on the 2
statistics the largest deviation was a 48.5% agreement for the 7/2010
sample set compared to the overall average distribution for the Aging groups from the
overall average values. The largest deviation was a 0.9% agreement for the 7/2010
sample set compared to the Grand Mean distribution.
Chi-Square Test of Aging
0%
20%
40%
60%
80%
100%
120%
5/2009 3/2010 7/2010
Lik
elih
oo
d b
ein
g E
qu
al to
Re
fere
nc
e
Compared to Overall Average Compared to Grand Mean
More details on the deviation can be seen on the distance measures shown below. The
distances between all sets and the overall mean are below the expected error. The
distances between all sets and the Grand Mean are below the expected error.
Distance of Aging from the Reference
0%
1%
2%
3%
4%
5/2009 3/2010 7/2010
Ro
ot-
Me
an
-Sq
ua
re D
ista
nc
es
Compared to Overall Average Compared to Grand Mean
Precision (2 Standard Errors)
Consistency Evaluation of Chimera Data Source
Mktg, Inc. 12/20/2011 Page 40 of 46
7.3. SATISFICING BEHAVIOR (SPEEDERS AND STRAIGHT-LINERS)
Previously, the performance characteristics that were covered focused on the errors made
by respondents and their participation in surveys and panels. There is a third category of
activities that are thought to possibly affect the quality of results. These are the
participants who either speed through the survey (speeders) and those who give similar or
identical values to blocks of questions in the surveys (straight-liners). These respondents
can be viewed as potential satisficers. However, once again, there is no direct evidence
that such behavior results in poor quality survey results.
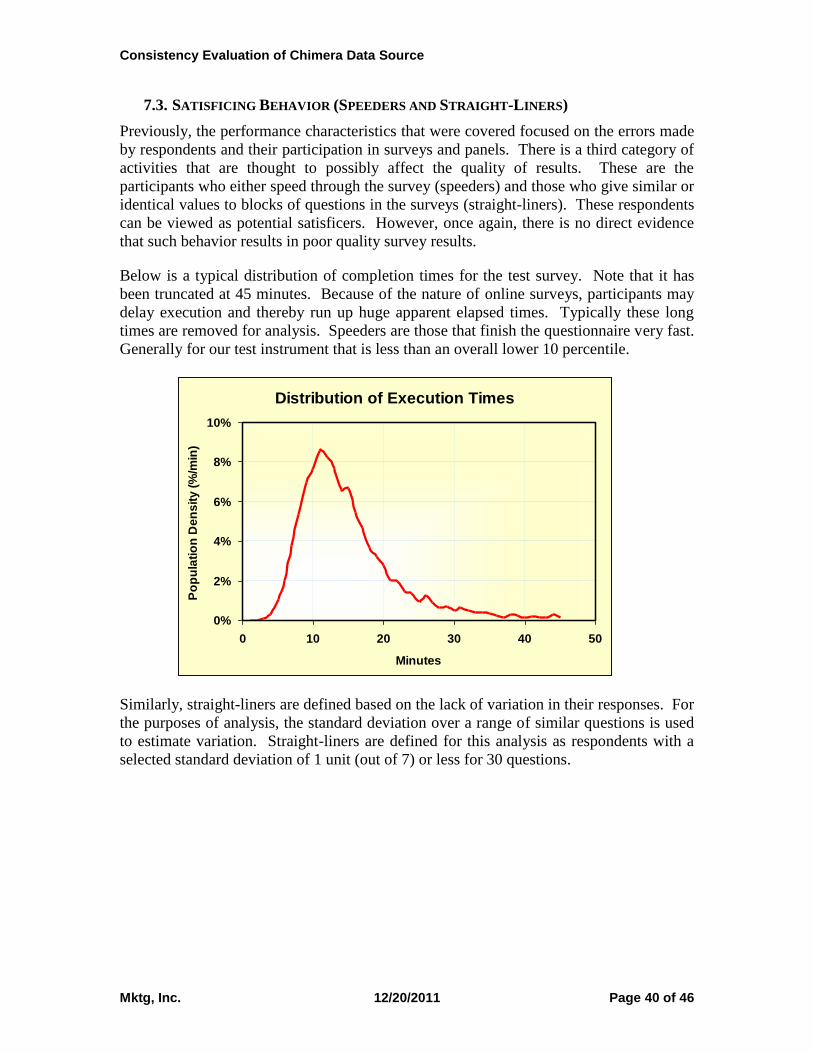
Below is a typical distribution of completion times for the test survey. Note that it has
been truncated at 45 minutes. Because of the nature of online surveys, participants may
delay execution and thereby run up huge apparent elapsed times. Typically these long
times are removed for analysis. Speeders are those that finish the questionnaire very fast.
Generally for our test instrument that is less than an overall lower 10 percentile.
Distribution of Execution Times
0%
2%
4%
6%
8%
10%
0 10 20 30 40 50
Minutes
Po
pu
lati
on
De
ns
ity
(%
/min
)
Similarly, straight-liners are defined based on the lack of variation in their responses. For
the purposes of analysis, the standard deviation over a range of similar questions is used
to estimate variation. Straight-liners are defined for this analysis as respondents with a
selected standard deviation of 1 unit (out of 7) or less for 30 questions.

Consistency Evaluation of Chimera Data Source
Mktg, Inc. 12/20/2011 Page 41 of 46
Below are shown the overall results for the Chimera sample sets and the references for
the occurrence of satisficing behavior. Consistency testing is shown on the following
control charts indicating the performance of each sample set with the same corresponding
error bound as used here along with indications for the overall average and the Grand
Mean references.
Satisficing Behavior
0%
1%
2%
3%
4%
5%
6%
Overall
Average
5/2009 3/2010 7/2010 Grand Mean
Re
sp
on
se
Ra
te
Speeders Straight-Liners (~6% Std)

Consistency Evaluation of Chimera Data Source
Mktg, Inc. 12/20/2011 Page 42 of 46
The following control chart indicates the occurrence of respondents being "Speeders" for
the Chimera sample sets. The deviation of all respondents being "Speeders" for Chimera
sample-sets compared to the overall average was within the expected error. The largest
deviation from the Grand Mean for being "Speeders" beyond the error bound is 0.4% for
the 7/2010 sample-set. Note that the Grand Mean for respondents being "Speeders" is
much larger than values of the overall average reference.
Occurrence of being "Speeders"
0%
2%
5/2009 3/2010 7/2010
Oc
cu
ren
ce
Ra
te
Speeders Overall Average Grand Mean
Range = 2 Standard Errors
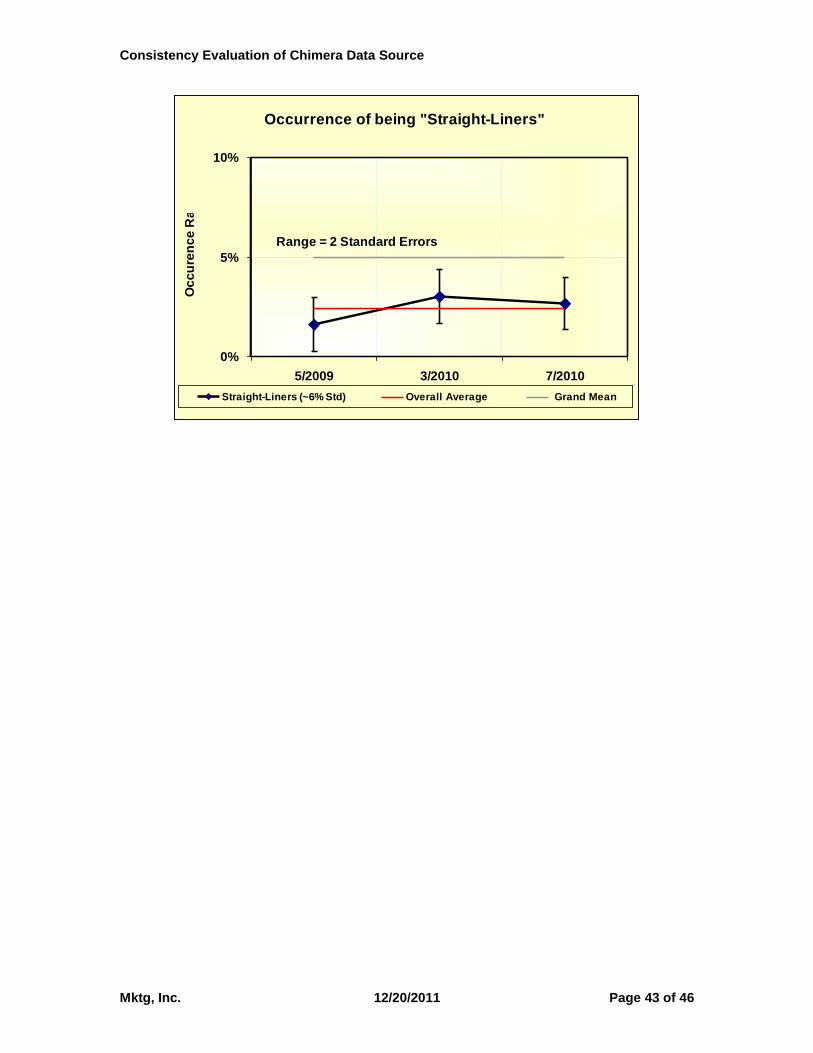
The occurrence of respondents being "Straight-Liners" for the Chimera sample sets is
shown on the following chart. The deviation of all respondents being "Straight-Liners"
for Chimera sample-sets compared to the overall average was within the expected error.
The deviation of all respondents being "Straight-Liners" for Chimera sample-sets
compared to the Grand Mean was all above the expected error. Note that the Grand
Mean for respondents being "Straight-Liners" is much larger than values of the overall
average reference. The largest deviation from the Grand Mean for being "Straight-
Liners" beyond the error bound is 2% for the 5/2009 sample-set.
Consistency Evaluation of Chimera Data Source
Mktg, Inc. 12/20/2011 Page 43 of 46
Occurrence of being "Straight-Liners"
0%
5%
10%
5/2009 3/2010 7/2010
Oc
cu
ren
ce
Ra
te
Straight-Liners (~6% Std) Overall Average Grand Mean
Range = 2 Standard Errors
Consistency Evaluation of Chimera Data Source
Mktg, Inc. 12/20/2011 Page 44 of 46
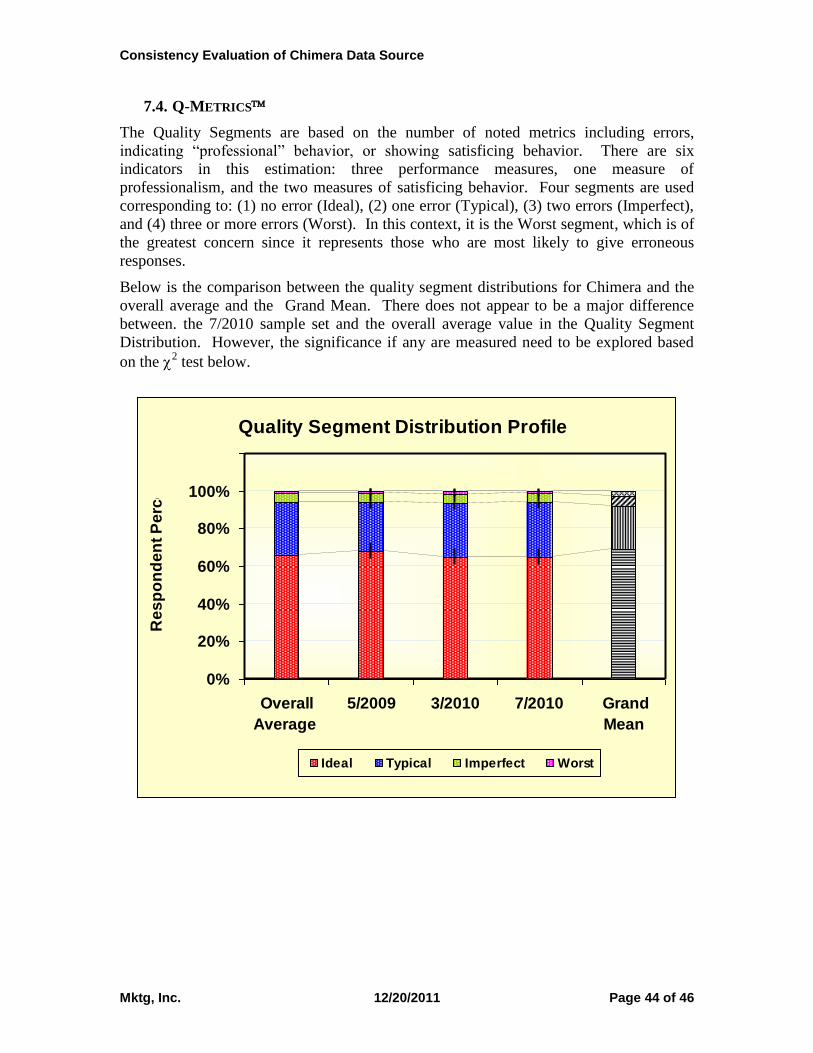
7.4. Q-METRICS
The Quality Segments are based on the number of noted metrics including errors,
indicating “professional” behavior, or showing satisficing behavior. There are six
indicators in this estimation: three performance measures, one measure of
professionalism, and the two measures of satisficing behavior. Four segments are used
corresponding to: (1) no error (Ideal), (2) one error (Typical), (3) two errors (Imperfect),
and (4) three or more errors (Worst). In this context, it is the Worst segment, which is of
the greatest concern since it represents those who are most likely to give erroneous
responses.
Below is the comparison between the quality segment distributions for Chimera and the
overall average and the Grand Mean. There does not appear to be a major difference
between. the 7/2010 sample set and the overall average value in the Quality Segment
Distribution. However, the significance if any are measured need to be explored based
on the 2 test below.
Quality Segment Distribution Profile
0%
20%
40%
60%
80%
100%
120%
Overall
Average
5/2009 3/2010 7/2010 Grand
Mean
Re
sp
on
de
nt
Pe
rce
nt
Ideal Typical Imperfect Worst
Consistency Evaluation of Chimera Data Source
Mktg, Inc. 12/20/2011 Page 45 of 46
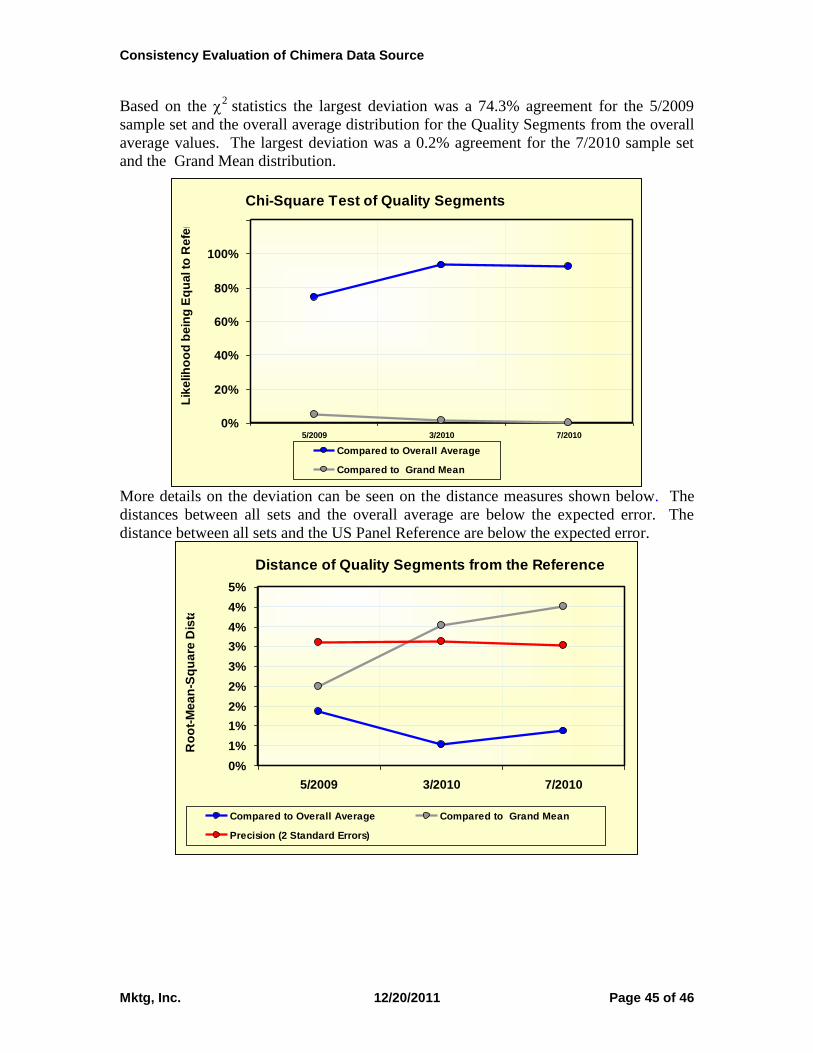
Based on the 2
statistics the largest deviation was a 74.3% agreement for the 5/2009
sample set and the overall average distribution for the Quality Segments from the overall
average values. The largest deviation was a 0.2% agreement for the 7/2010 sample set
and the Grand Mean distribution.
Chi-Square Test of Quality Segments
0%
20%
40%
60%
80%
100%
120%
5/2009 3/2010 7/2010
Lik
elih
oo
d b
ein
g E
qu
al to
Re
fere
nc
e
Compared to Overall Average
Compared to Grand Mean
More details on the deviation can be seen on the distance measures shown below. The
distances between all sets and the overall average are below the expected error. The
distance between all sets and the US Panel Reference are below the expected error.
Distance of Quality Segments from the Reference
0%
1%
1%
2%
2%
3%
3%
4%
4%
5%
5/2009 3/2010 7/2010
Ro
ot-
Me
an
-Sq
ua
re D
ista
nc
e
Compared to Overall Average Compared to Grand Mean
Precision (2 Standard Errors)

Consistency Evaluation of Chimera Data Source
Mktg, Inc. 12/20/2011 Page 46 of 46
Elaine Trimarchi Executive Vice President – PRC Certified Phone (631) 277-7000 Cell (631) 664-1308 [email protected] www.mktginc.com 200 Carleton Avenue, East Islip, NY 11730