CONSTRUCTING AN ECONOMIC COMPOSITE INDICATOR · PDF fileConstructing an Economic Composite...
14
CONSTRUCTING AN ECONOMIC COMPOSITE INDICATOR FOR THE UAE 1 ASSIL EL MAHMAH Research and Statistics Department June 2017 1 The views expressed in this paper are those of the author and should not be interpreted as those of the Central Bank of the United Arab Emirates.
Transcript of CONSTRUCTING AN ECONOMIC COMPOSITE INDICATOR · PDF fileConstructing an Economic Composite...

CONSTRUCTING AN ECONOMIC COMPOSITE
INDICATOR FOR THE UAE1
ASSIL EL MAHMAH
Research and Statistics Department
June 2017
1 The views expressed in this paper are those of the author and should not be interpreted as those of the Central Bank
of the United Arab Emirates.

2
Constructing an Economic Composite Indicator for the UAE
__________________________________________
Abstract
In order to assess the economic activity for the UAE, policymakers examine different economic
variables that could provide them high frequency information about the economic developments.
However, since the UAE GDP, the main measure of the economic activity, is available only on
an annual basis with a considerable publication delay, policymakers have to make decisions with
a large amount of information obtained from different sources.
To overcome this problem, this paper proposes to construct an Economic Composite Indicator
(ECI) that can closely track the economic activity of the UAE on a quarterly basis. Given the
absence of a reference variable, the Principal Component Analysis (PCA) is the most appropriate
method to calculate this indicator. This approach aims to extract a common factor from a group
of relevant economic series and to capture the highest level of common trend.
The results show that, the ECI reflects the economy’s historical performance since 2006 and
confirms the economic development recorded by the UAE Purchasing Managers' Index (PMI).
On an annual basis, there is a high correlation between the constructed ECI and the historical
GDP growth of the UAE. Thus, the ECI can be considered as a valuable tool for the
policymakers to provide them timely information about the development of the UAE economic
activity and an early indication of turning points.
Keywords: UAE economic activity, Composite indicator, Principal Components Analysis
JEL classification codes: C32, C51, C87, E32

3
I. INTRODUCTION
Given the increasing need to obtain an early and a clear signal about the current and future
developments of economic activity, policymakers examine different economic variables from
different sources. Nevertheless, not all economic variables are published simultaneously, with
various lags and frequencies, delaying the appropriate policy responses.
The most used tool to resolve this problem is the composite indicator, which is an aggregate
index of a large number of relevant variables reflecting the development of the economic
activity. While such indicators are widely used and well developed in all advanced economies, it
has received relatively little attention in many emerging and developing economies, because of
the lack of long historical as well as high frequency reliable data.
In the United Arab Emirates (UAE), to overcome the lack of the quarterly GDP, the Central
Bank of UAE (CBUAE) constructed an Economic Composite Indicator (ECI) to assess the
economic activity of the UAE. This is the first experience at the national level that aims to
improve the understanding of the direction of economic activity and to estimate economic
growth on a quarterly basis.
This constructed indicator could be a useful analytical and empirical tool for the policymakers
since it offers a timely clear picture about the current economic situation. The ECI has three
important advantages: first, it takes into account all important policy issues by synthesizing a
large number of economic variables, both at the national and international levels. Secondly, it
captures economic fluctuations for the UAE at relatively high frequency, compared to the
available information. Finally, it will be used to give an early indication of turning points.
This paper presents an estimation of an Economic Composite Indicator for the UAE, which aims
to provide an interesting reference for the construction of these indicators for other similar
economies and also to facilitate future research on the UAE. The remainder of this paper is
organized as follows: Section II describes the available data as well as criteria and
transformations applied in this paper. Section III gives an overview of the adopted
methodological approach, while section IV focuses on the main steps in the construction of the
ECI. The section V presents the empirical results and the interpretation of the estimated indicator
from a historical perspective. Finally, section VI concludes.

4
II. DATA DESCRIPTION
The building of the dataset represents the crucial step for the computation of the composite
indicator, since the quality of the constructed index depends highly on the quality of data. The
dataset should contain relevant variables on a quarterly basis reflecting the overall economic
activity and taking into account all important policy issues. However, the choice of the data
sample is dictated by data availability and the structure of the economy. While there are some
reliable and well-established databases for most of the advanced countries, there is no large
dataset containing a large number of macroeconomic variables for the UAE, at the requested
frequency. Therefore, the selected macroeconomic variables are collected from different sources,
in order to obtain a data set that covers a wide range of economic indicators, such as the global
economy, sectorial activity, financial markets, price trends and the money market.
To ensure objectivity throughout the selection process of most appropriate series, we have
chosen two main criteria: economic significance and statistical significance. The first
requirement is that the selected series should ensure good representation of the relevant sectors
of the economy and reflect the anticipation of future economic fluctuations. The second
requirement is the availability of long historical series on a quarterly basis, timely and easily
accessible. These variables should be highly correlated with GDP growth, with clear trends and
low volatility.
Thus, according to the two criteria and the availability of data, the final dataset consists of 14
series on a quarterly basis from 2006Q1 to 2017 Q1. It covers, as much as possible, the major
sectors of the UAE economy. It also includes some international variables that can influence the
national economic activity. The table below presents the detailed list of all variables used to
construct the ECI.
Table 1: Information on variables used to construct the ECI
Sector Variables Sources
Global Economy
• US GDP (Quarterly y-o-y, % change) International Monetary Fund
• EU GDP (Quarterly y-o-y, % change) International Monetary Fund
• Emerging market GDP (Quarterly y-o-y, % change) International Monetary Fund
• Brent oil price (Quarterly y-o-y, % change) Energy Information Administration
Financial Markets • MSCI UAE (Quarterly y-o-y, % change) Bloomberg/ MSCI
Prices • CPI (Quarterly y-o-y, % change) Federal Competitiveness and Statistics Authority
Sectorial activity
• UAE's oil production (Barrel/day) OPEC
• Industrial Production Index (IPI) (Quarterly y-o-y, % change) Statistics Centre −Abu Dhabi
• UAE airport passenger traffic (Quarterly y-o-y, % change) UAE airports
• Dubai Economic Tracker (DET) Emirate NBD / Markit
Money
• M3 (Quarterly y-o-y, % change) Central Bank of UAE
• Domestic credit (Quarterly y-o-y, % change) Central Bank of UAE
• Gross international reserves (Quarterly y-o-y, % change) Central Bank of UAE
• Real effective exchange rates Bank for International Settlements

5
III. METHODOLOGICAL APPROACH
A wide range of methodologies for estimating the composite indices have been developed over
time and used in many advanced economies, such as the weighted average method, the
regression model and the principal component approach. However, the choice of the appropriate
methodology depends highly on the quality of the data available and on the reference indicator
measuring the economic activity.
In order to construct a composite index, the first step is to determine a reference series for the
state of the economy. The main variable that more closely approximates the economic activity
and is mainly used is real GDP. According to the literature, the non-oil GDP, the non-agricultural
GDP and the Industrial Production Index (IPI) are the main reference series used in many
developed countries and international organizations for building quarterly composite indices.
Nevertheless, in the UAE, real GDP and its components are available only on an annual basis
and with a considerable publication delay, while the available (Industrial Proudction Index) IPI
provides only a partial coverage of the economy, especially with the rising share of services and
financial sector which are not taken into consideration.
Given the absence of a relevant reference variable and the lack of long historical, as well as high
frequency reliable data, the Principal Component Analysis (PCA) is the most appropriate method
to calculate this indicator for the UAE. This approach, introduced for the first time by Karl
Pearson (1901) and developed afterwards by Harold Hotelling (1933), aims to extract a common
factor from a group of relevant economic series and to capture the highest level of common
trend.
Formally, the PCA approach stipulates that for any set of variables X1, X2, X3, …, Xn, n>=1, it is
possible to create a set of variables Z1, Z2, Z3, …, Zn, n>=1 as a linear combination of the first
set. Analytically, the model can be presented as follows:
∑
Where is the coefficient of the corresponding eigenvector, to be the biggest eigenvalues of the
symmetric variance-covariance matrix of the original variables. The principal components are
ranked such that: Var( ) ≥ Var( ) ≥ … ≥ Var( ). Thus, the variation of the data set can be
described by k principal components, with k ≤ n. Therefore, with a few common factors, the
contribution of the variables to the total variance is important, especially if the original variables
are highly correlated.
In this sense, the first principal component is considered as an indicator of economic activity
since it contains the most relevant information contained in the data.

6
IV. ESTIMATION OF THE ECI
The construction procedures of this Economic Composite Indicator (ECI) consist of four main
steps (see figure 1). The first step is to determine a reference series reflecting the economic
activity fluctuation. As mentioned in section II, there is no available relevant reference variable
that can closely approximate the economic activity on a quarterly basis. To overcome this
limitation, many studies and working papers propose to interpolate quarterly real GDP from
annual real GDP. However, even if this method has often good results, there might be some
errors in the interpolation which can influence the quality and the precision of the constructed
indicator. For all these reasons, a reference series is not used in this paper.
Figure 1: Main steps in constructing this indicator
The second step is the important one, since the quality of the constructed indicator depends
highly on the quality of data. As mentioned above, according to the economic and the statistical
criteria, the final data set contains 14 time series on a quarterly basis, both at the national and
international levels, from 2006Q1 to 2017Q1.
In the third step, given the absence of a reference variable, the Principal Component Analysis
(PCA) is the most appropriate method to calculate this indicator. This approach aims to extract a
common factor from the data set and to capture the highest level of common trend.
However, the PCA is very sensitive to the unit of measurement in which the data are expressed.
For this reason, before computing the common components, each time series was normalized so
that it has a zero sample mean and a unit variance. This procedure allows the series to be
independent of any unit of measurement. This normalization is a necessary step in order to avoid
overweighting any given time series with a large variance during the estimation of the ECI.

7
The fourth step consists of applying PCA method, by using Eviews, to transform the 14 selected
variables to an equal number of orthogonal variables called principal components. Each
component contributes to the explanation of the total variance. According to the eigenvalue
criterion (Appendix Figure 2), the results obtained by Eviews shows that, there is only one
principal component to extract. The contribution of the first component exceeds 60% (see
table 2). Therefore, we can consider the first principal component as an indicator of the
economic activity of the UAE.
Table 2: Eviews output of PCA to construct the ECI
Principal Components Analysis
Sample (adjusted): 2006Q1 2017Q1
Included observations: 44 after adjustments
Computed using: Ordinary correlations
Extracting 14 of 14 possible components
Eigenvalues: (Sum = 14, Average = 1)
Cumulative Cumulative
Number Value Difference Proportion Value Proportion 1 8.740900 6.571981 0.624164 8.7409 0.6242
2 2.168919 0.873748 0.154877 10.9098 0.7790
3 1.295171 0.642080 0.092485 12.2050 0.8715
4 0.653091 0.193383 0.046635 12.8581 0.9182
5 0.459708 0.178471 0.032827 13.3178 0.9510
6 0.281237 0.131389 0.020082 13.5990 0.9711
7 0.149848 0.059669 0.010700 13.7489 0.9818
8 0.090180 0.003882 0.006439 13.8391 0.9882
9 0.086298 0.055496 0.006162 13.9212 0.9944
10 0.030802 0.009383 0.002199 13.9520 0.9966
11 0.021419 0.003501 0.001529 13.9734 0.9981
12 0.017918 0.012909 0.001279 13.9913 0.9994
13 0.005009 0.001342 0.000358 13.9963 0.9997
14 0.003667 --- 0.000262 14.0000 1.0000
Given the importance of the oil sector and its implication on the UAE economy, we construct a
second index, reflecting the development of the economic activity in the non-oil sector. To this
end, the same steps are applied, excluding the Brent oil price and the UAE oil production from
the data set (see table 3).

8
Table 3: Eviews output of PCA to construct the Non-oil ECI
Principal Components Analysis
Sample (adjusted): 2006Q1 2017Q1
Included observations: 44 after adjustments
Extracting 12 of 12 possible components
Eigenvalues: (Sum = 12, Average = 1)
Cumulative Cumulative
Number Value Difference Proportion Value Proportion 1 8.216381 6.597105 0.684698 8.216381 0.684698
2 1.619276 0.595204 0.134940 9.835657 0.819638
3 1.024072 0.616531 0.085339 10.859729 0.904977
4 0.407541 0.108029 0.033962 11.267270 0.938939
5 0.299511 0.111434 0.024959 11.566781 0.963898
6 0.188078 0.091410 0.015673 11.754859 0.979572
7 0.096667 0.039799 0.008056 11.851526 0.987627
8 0.056868 0.002330 0.004739 11.908394 0.992366
9 0.054538 0.036087 0.004545 11.962932 0.996911
10 0.018451 0.006366 0.001538 11.981383 0.998449
11 0.012085 0.005552 0.001007 11.993467 0.999456
12 0.006533 --- 0.000544 12.000000 1.000000
Thus, the results obtained by Eviews show that, there is only one principal component to extract,
according to the eigenvalue criterion (Appendix Figure 3). The contribution of the first
component is around 68% (see table 3). Therefore, we can consider the first principal component
as an indicator of the non-oil economic activity of the UAE.
V. MAIN RESULTS: ANALYSIS AND APPLICATIONS
In this section, the quarterly Economic Composite Indicator (ECI) is constructed using the
principal component analysis. The main results confirmed the historical developments observed
in the UAE economy, especially during the financial crisis 2008 (Figures 2 & 3). These results
are also consistent with the conjecture stipulating that the UAE is experiencing a slowdown amid
the continued fiscal consolidation. During the first quarter of 2017, the overall economy
expanded by 3.3%, following 3.7% in the previous quarter (Figure 2). This slowdown was due
mainly to slower rate of growth in oil production in the first quarter of 2017. In fact, oil
production increased by 3.6% in the first quarter of 2017 on a year-on- year basis against an
increase of 4.6% in the previous quarter. Moreover, the Non-Oil Economic Composite Indicator
(Non-Oil ECI), showed an improvement of the non-oil economic activity in the UAE (Figure 3),
reaching 3.1% compared to 2.8% recorded during the last quarter of 2016 on a year-on- year
basis.

9
Figure 2 : Overall ECI development (y-o-y, %) Figure 3 : Non-oil ECI development (y-o-y, %)
Source: CBUAE analysis
Therefore, this ECI can track down ongoing economic developments on a quarterly basis and
provide to the policy-makers the current situation of the UAE economy, in the absence of any
reliable information about the quarterly GDP, the main measure of the economic activity.
Moreover, given the importance of the emirates of Abu Dhabi and Dubai in the UAE economy,
Figures 4 & 5 showed the high correlation between the ECI and the GDP growth of the two
emirates, confirming the observed trends.
Figure 4: Non-oil ECI and Dubai GDP growth Figure 5 : Overall ECI and Abu Dhabi GDP growth
Source: DSC, SCAD and CBUAE analysis
In addition, the non-oil ECI is highly correlated with the Purchasing Managers’ Index2 (PMI),
the only high frequency available indicator that is commonly used to track the non-oil economy
in the UAE.
2 The Purchasing Managers’ Index (PMI) measures the performance of UAE’s companies in non-oil private sector and is derived from a survey of
400 companies, including manufacturing, services, construction and retail.
10
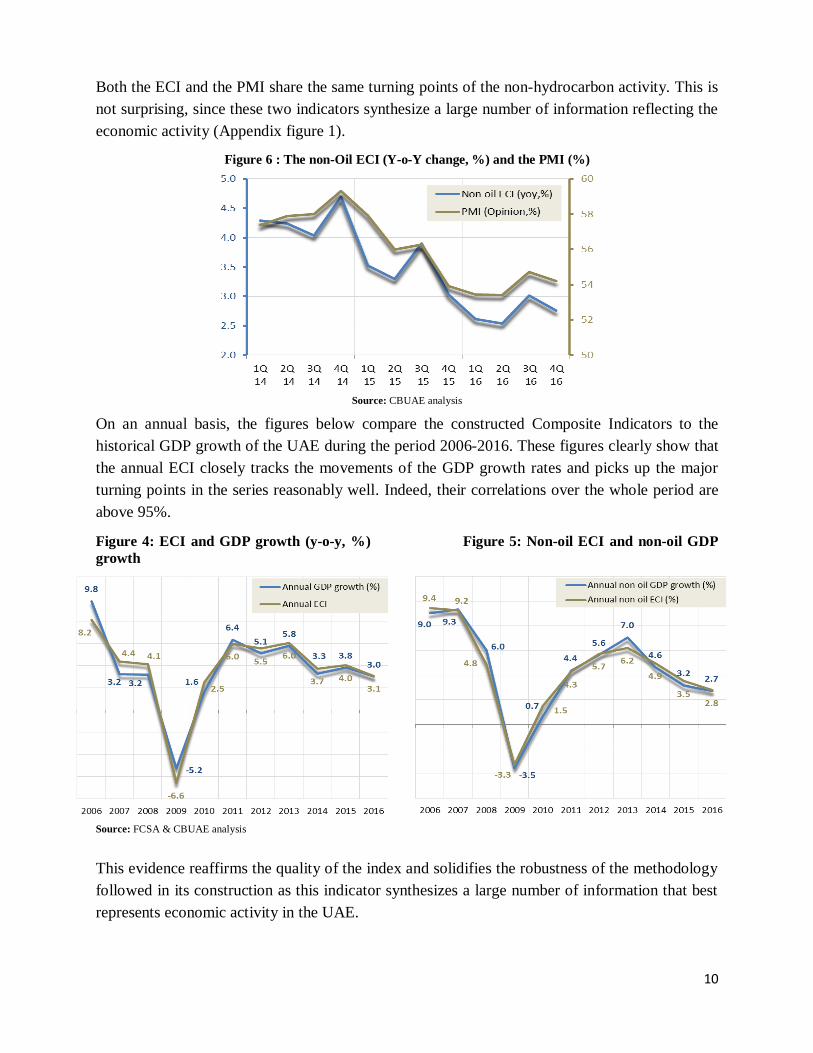
Both the ECI and the PMI share the same turning points of the non-hydrocarbon activity. This is
not surprising, since these two indicators synthesize a large number of information reflecting the
economic activity (Appendix figure 1).
Figure 6 : The non-Oil ECI (Y-o-Y change, %) and the PMI (%)
Source: CBUAE analysis
On an annual basis, the figures below compare the constructed Composite Indicators to the
historical GDP growth of the UAE during the period 2006-2016. These figures clearly show that
the annual ECI closely tracks the movements of the GDP growth rates and picks up the major
turning points in the series reasonably well. Indeed, their correlations over the whole period are
above 95%.
Figure 4: ECI and GDP growth (y-o-y, %) Figure 5: Non-oil ECI and non-oil GDP
growth
Source: FCSA & CBUAE analysis
This evidence reaffirms the quality of the index and solidifies the robustness of the methodology
followed in its construction as this indicator synthesizes a large number of information that best
represents economic activity in the UAE.

11
VI. CONCLUSION
This paper tries to construct an ECI for the UAE, in order to provide policymakers high
frequency information about the development of the UAE economic activity and an early
indication of turning points.
Based on this research, the first experiment with the ECI construction has yielded fruitful results.
We believe that the methodology adopted to construct the ECI is the most appropriate method to
calculate this indicator, taking into consideration all available data. This approach allows to
extract a common factor from a group of relevant economic series and to capture the highest
level of common trend. Thus, the constructed ECI is a useful tool, which can closely track the
economic activity of the UAE on a quarterly basis.
However, this study is still in preliminary stage due to the non-availability of the quarterly GDP
and the lack of alternative sources for evaluating economic activity. The utility and the quality of
the ECI seems promising, but could be improved if more data are available in a long-enough
time series for our purposes and if there is more information reflecting the development of
economic activity at relatively high frequency.
Going forward, quarterly estimates of the ECI will be presented in the context of the Quarterly
Review of the Central Bank on a regular basis. Revisions will be illustrated to reflect changes in
the estimate based on the most recent available data. Using the updated estimates, projections for
the year and subsequent years will be updated in the context of regular publications of the
Central Bank.

12
REFERENCES
Camba-Mendez, G., M. Kapetanios, R. J. Smith, and M. R. Weale (2001): “An automatic leading
indicator of economic activity: forecasting GDP growth for European countries,” Econometrics
Journal, 4, 56–90.
Schneider, M., and M. Spitzer, 2004, “Forecasting Austrian GDP using the generalized dynamic
factor model,”
Artis, J. M., A. Banerjee, and M. Marcellino (2002): “Factor forecasts for the UK,” CEPR
discussion paper 3119, Center for Economic and Policy Research.
Hotelling, Harold (September 1933). "Analysis of a complex of statistical variables into
principal components". Journal of Educational Psychology (American Psychological
Association) 24 (6): 417–441.
Geweke, J., 1977, The Dynamic Factor Analysis of Economic Time Series Models. Paper
presented at the Latent Variables in Socio-Economic, Amsterdam.
Bai, J., and S. Ng, 2002, “Determining the Number of Factors in Approximate Factor Models,”
Econometrica, 70(1), pp. 191–221.
Boivin, J., & S. Ng, 2006, “Are More Data Always Better for Factor Analysis?,” Journal of Econometrics, 132(1), pp. 169–194.
Cristadoro, R., M. Forni, L. Reichlin, and G. Veronese, 2005, “A Core Inflation Indicator for the
Euro Area,” Journal of Money, Credit, and Banking, 37(3), pp. 539–560.
Forni, M., M. Hallin, M. Lippi, and L. Reichlin, 2005 “The Generalized Dynamic Factor Model:
One-Sided Estimation and Forecasting,” Journal of the American Statistical Association,
100(471), pp. 830-840.

13
APPENDIX
Appendix Figure 1: The Economic Composite Indicator and the relevant variable
reflecting the UAE economy
Quarterly non-oil ECI vs MSCI Quarterly non-oil ECI vs DET
Quarterly ECI vs Credit Quarterly non-oil ECI vs US GDP
Quarterly ECI vs Brent price Quarterly non-oil ECI vs M3 growth
Source: FCSA, IMF, SCAD & CBUAE analysis

14
Appendix Figure 2: Variance Explained of the Principal Components for the ECI
Appendix Figure 3: Variance Explained of the Principal Components for the non-oil ECI