Composite Indicator of Potentially Avoidable Hospitalizations
22
Composite Indicator of Potentially Avoidable Hospitalizations Yana Gurevich, MD, MPH Canadian Institute for Health Information Presentation to HCQI experts meeting November 14, 2014 1
Transcript of Composite Indicator of Potentially Avoidable Hospitalizations

Composite Indicator of Potentially
Avoidable Hospitalizations
Yana Gurevich, MD, MPH Canadian Institute for Health Information Presentation to HCQI experts meeting November 14, 2014
1

Project Background
2
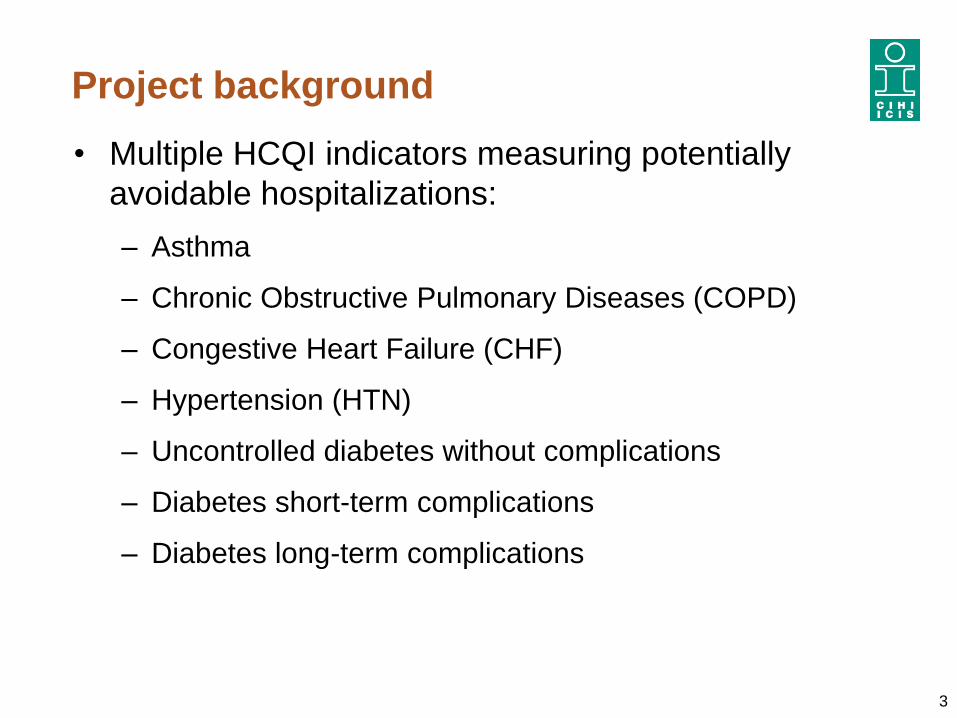
Project background • Multiple HCQI indicators measuring potentially
avoidable hospitalizations:
– Asthma
– Chronic Obstructive Pulmonary Diseases (COPD)
– Congestive Heart Failure (CHF)
– Hypertension (HTN)
– Uncontrolled diabetes without complications
– Diabetes short-term complications
– Diabetes long-term complications
3

Project background
Purpose:
• Explore validity and utility of a composite
indicator versus a number of disease specific-
indicators
• Explore the extent to which a composite
indicator improves international comparability
4

Project background
Scope:
• to utilize currently collected indicators of
potentially avoidable hospitalizations
• potentially avoidable hospitalizations for
selected chronic conditions
– for which access to appropriate primary care
could prevent the need for the current
admission to hospital
5

Results
6

Approach
• To address the potential effect of different coding
practices internationally, subgroups were created
• Subgroups represent conditions that can
potentially be coded as a principal diagnosis
interchangeably:
– Asthma + COPD
– CHF + HTN
– 3 Diabetes (uncontrolled, short-term and long-term
complications)
• The overall composite was also calculated
7
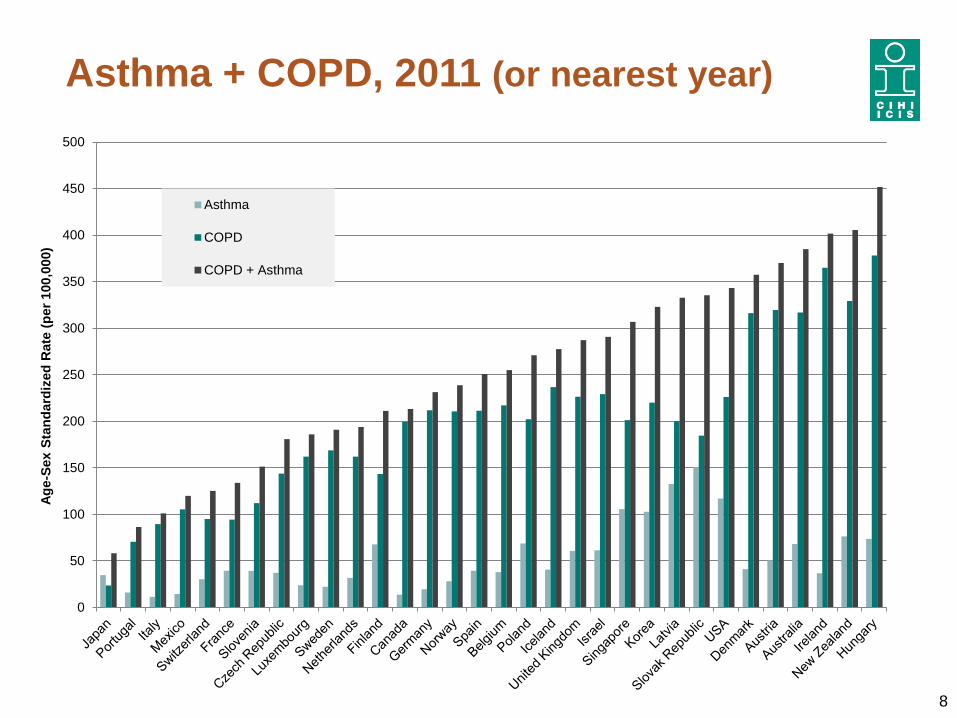
Asthma + COPD, 2011 (or nearest year)
8
0
50
100
150
200
250
300
350
400
450
500
Ag
e-S
ex S
tan
dard
ized
Rate
(p
er
100,0
00)
Asthma
COPD
COPD + Asthma

CHF + Hypertension, 2011 (or nearest year)
9
0
100
200
300
400
500
600
700
800
900
Ag
e-S
ex S
tan
dard
ized
Rate
(p
er
100,0
00)
CHF
Hypertension
CHF + Hypertension

Diabetes, 2011 (or nearest year)
10
0
50
100
150
200
250
300
350
400
450
Ag
e-S
ex S
tan
dard
ized
Rate
(p
er
100,0
00)
Uncontrolled
ST
LT
Diabetes Overall

Overall Composite, 2011 (or nearest year)
11
0
200
400
600
800
1000
1200
1400
Ag
e-S
ex S
tan
dard
ized
Rate
(p
er
100,0
00)
COPD + Asthma
CHF + Hypertension
Diabetes Overall
Overall
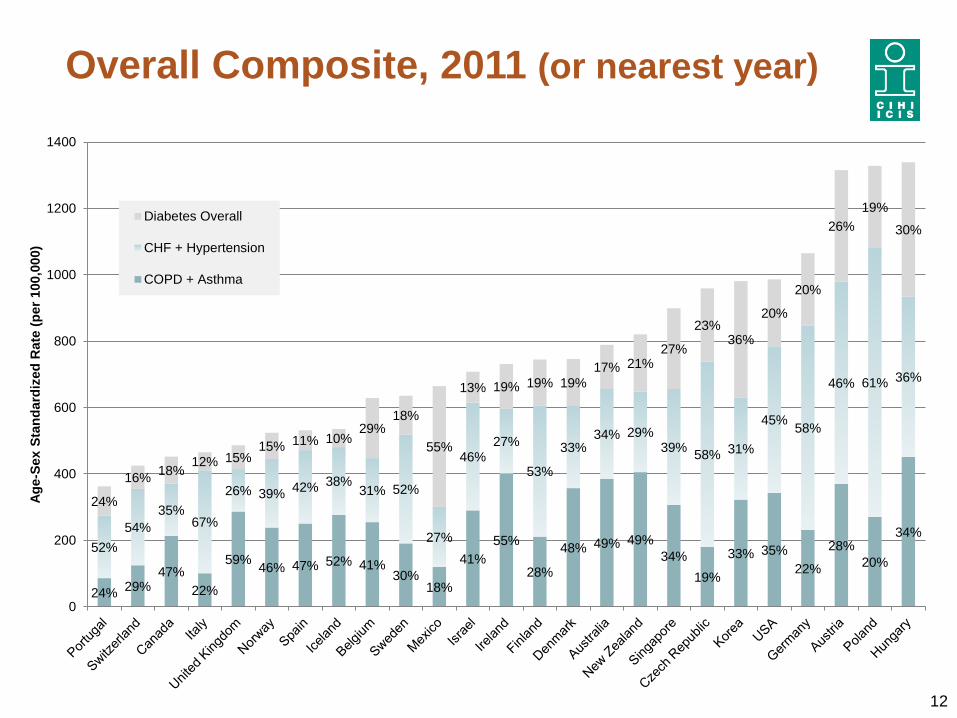
Overall Composite, 2011 (or nearest year)
12
24% 29%
47%
22%
59% 46% 47% 52% 41%
30% 18%
41%
55%
28%
48% 49% 49%
34%
19%
33% 35%
22%
28%
20%
34% 52%
54%
35% 67%
26% 39% 42% 38%
31% 52%
27%
46% 27%
53%
33% 34% 29%
39% 58% 31%
45% 58%
46% 61% 36%
24%
16% 18%
12% 15% 15% 11% 10%
29% 18%
55%
13% 19% 19% 19%
17% 21% 27%
23% 36%
20%
20%
26%
19%
30%
0
200
400
600
800
1000
1200
1400
Ag
e-S
ex S
tan
dard
ized
Rate
(p
er
100,0
00)
Diabetes Overall
CHF + Hypertension
COPD + Asthma

Overall Composite, 2011 (or nearest year)
International Variation
13
Highest Rate
(per 100,000) Lowest Rate
(per 100,000) Variation
Asthma 151 11 14-fold
COPD 378 23 16-fold
COPD and Asthma 451 58 8-fold
CHF 595 57 10-fold
Hypertension 374 1 374-fold
CHF and Hypertension 810 58 14-fold
Diabetes Uncontrolled 181 3 60-fold
Diabetes Short-term 65 8 8-fold
Diabetes Long-term 271 19 14-fold
Diabetes Overall 405 54 8-fold
Overall 1,339 363 4-fold

Summary of findings
• Results suggest that differences in coding
practices between interchangeable codes do
exist (e.g. Austria, Korea for HTN & CHF)
• Rankings continue to be similar
• Two years of results show similar patterns
• Composite indicator shows reduction in
international variation
• Additional work is required to finalize the
methodology of the composite indicator
14

Suggested methodological adjustments
• Explore exclusion of deaths:
– hospitalization where death occurs is mostly likely not
immediately avoidable
• Explore exclusion of patients age 75 and older:
– older patients have higher morbidity and mortality and are
more likely to require a hospitalization which is not
avoidable
• Refine definitions of the individual conditions as
determined by the UK R&D project
15

Discussion
16
Considerations for the composite indicator
in its current form
Advantages:
• Provides a simple, easy to communicate overall
assessment of primary care
• Has defined scope: avoidable hospitalizations for
selected chronic conditions
• Groups individual conditions in a clinically meaningful
way
• Improves face validity and international comparability
• Allows for inclusion of primary health care indicators in
Health at a Glance
17

Considerations for the composite indicator
in its current form
Disadvantages:
• Not covering the whole universe of potentially
avoidable hospitalizations
– Revising the scope will require substantial R&D work
• Several countries do not submit data for one or more
of the individual conditions, which may result in
exclusion from a composite
18

Key questions
• Do HCQI experts support reporting potentially
avoidable hospitalizations as a composite
indicator in general?
• Do HCQI experts agree with the scope of this
composite indicator as:
– Potentially avoidable hospitalizations for selected
chronic conditions, for which access to appropriate
primary care could prevent the need for the current
admission to hospital?
19

Recommendations for data collection
• Collect data for all 7 chronic conditions
(including hypertension)
• Collect information to support completion of R&D
work:
– Collect counts with and without in-hospital deaths for
the 7 conditions
– Question set to identify any country-specific coding
standards for current selection of chronic conditions
and why data is missing (e.g. not collected vs.
alternate coding practice)
20

Acknowledgments
Canada’s project team • Yana Gurevich, Sunita Karmakar-Hore, Mahbubul Haq
Ireland • Deirdre Mulholland
Israel • Yael Applbaum, Anat Ekka-Zohar, Shulamit Gordon
Italy • Fabrizio Carinci
New Zealand • Vladimir Stevanovic
Singapore • Denise Lee
South Korea • Sun Min Kim, Kyoung Hoon Kim
United Kingdom • Veena Raleigh, Candida Ballantyne
21

22
Thank You!