CONSPICUOUS COLORATION MAY FUNCTION TO DETER AVIAN ...
105
CONSPICUOUS COLORATION MAY FUNCTION TO DETER AVIAN PREDATORS IN APPALACHIAN SALAMANDERS A Thesis by MONICA MARIE WINEBARGER Submitted to the Graduate School at Appalachian State University in partial fulfillment of the requirements for the degree of MASTER OF SCIENCE May 2017 Department of Biology
Transcript of CONSPICUOUS COLORATION MAY FUNCTION TO DETER AVIAN ...
CONSPICUOUS COLORATION MAY FUNCTION TO DETER AVIAN PREDATORS IN APPALACHIAN SALAMANDERS
A Thesis by
MONICA MARIE WINEBARGER
Submitted to the Graduate School at Appalachian State University
in partial fulfillment of the requirements for the degree of MASTER OF SCIENCE
May 2017 Department of Biology

CONSPICUOUS COLORATION MAY FUNCTION TO DETER AVIAN PREDATORS IN APPALACHIAN SALAMANDERS
A Thesis by
MONICA MARIE WINEBARGER May 2017
APPROVED BY:
Lynn M. Siefferman, Ph.D. Chairperson, Thesis Committee Michael S. Osbourn, Ph.D. Member, Thesis Committee Carol M. Babyak, Ph.D. Member, Thesis Committee Zack E. Murrell, Ph.D. Chairperson, Department of Biology Max C. Poole, Ph.D. Dean, Cratis D. Williams School of Graduate Studies

Copyright by Monica Marie Winebarger 2017 All Rights Reserved

iv
Abstract
CONSPICUOUS COLORATION MAY FUNCTION TO DETER AVIAN PREDATORS IN APPALACHIAN SALAMANDERS
Monica Marie Winebarger
B.S. Appalachian State University M.S. Appalachian State University
Chairperson: Lynn Siefferman
Amphibians are renowned for the variation in the color and patterns of their skin, both within
and between species. In the southern Appalachians, three closely related salamander species
(Plethodon spp.) display vastly different coloration; yet, the signaling function of integument
coloration is not well studied. Plethodon yonahlossee have a large red dorsal patch that
covers ~40% of their dorsal region, while P. cylindraceus are black with white spots, and P.
montanus are uniformly gray. Ambystoma maculatum salamanders also occur in sympatry
with these species and display conspicuous yellow spots on dark bodies. Variation in
integument coloration within and among species offers opportunities to explore hypotheses
of adaptive signaling. Conspicuous coloration may serve as an aposematic signal in which
the conspicuous coloration of prey is used to signal unpalatability to potential predators. It is
hypothesized that larger body size, larger integument patterns, and larger group size increase
the efficacy of aposematic signals. There is evidence that the integument secretions of
species in both Plethodon and Ambystoma are unpalatable to avian predators. Thus, I
hypothesize that the integument coloration of P. yonahlossee and A. maculatum is an

v
aposematic signal to passerine avian predators. Here, I use three complementary approaches
to investigate the potential for aposematic signaling in conspicuous salamanders. First, I
used avian vision models to quantify the conspicuousness of P. yonahlossee and A.
maculatum to avian predators. I found that both species are distinguishable from typical
forest backgrounds and are chromatically distinct from two duller sympatric heterospecifics
(P. montanus and P. cylindraceus). Second, I use plasticine models of P. yonahlossee and P.
montanus to experimentally test whether predators depredate conspicuously colored models
less frequently than dull models. Predation rates on grey models were significantly higher
compared to that of red models, suggesting that the red dorsal coloration of P. yonahlossee is
interpreted as a warning signal that deters predation. Third, I use a comparative approach to
investigate associations between body size and conspicuous coloration in the genera
Ambystoma and Plethodon. I found that increased conspicuous coloration co-evolved with
increased body size in Ambystoma, but that evolution in Plethodon salamanders has favored a
negative relationship between these two traits. These results suggest that both P.
yonahlossee and A. maculatum possess traits consistent with aposematism, but more
information on unpalatability is needed for each species to further explore this hypothesis.

vi
Acknowledgements
First and foremost, I would like to thank my parents, Wayne and Phyllis Winebarger,
for their unwavering love and support. They have shown me through their own interactions
with the world the value of hard work, determination, patience, and kindness. Everything I
have and everything I am I owe to them, and I am eternally grateful. I would also like to
thank my committee members, especially my advisor, Dr. Lynn Siefferman, a force to be
reckoned with, for being the strong, intelligent person that she is. She never accepted
anything less than my very best, and taught me to learn and grow from criticism rather than
run from it. I am grateful to Drs. Carol Babyak and Michael Osbourn for always listening
when I needed to work through a problem, and for being supportive through the many
iterations of my project. I also have to thank Dr. Michael Gangloff for the numerous
opportunities to expand my skillset as an ecologist, and for his invaluable insights on life in
academia. I would like to thank M. Worth Pugh for his companionship, and for making sure
I survived my fieldwork thus far, from catching salamanders on rainy nights in deep, dark
Appalachian woods, to digging for freshwater mussels on the bottom of the Appalachicola
River. I am also grateful to every member of the Siefferman-Gangloff lab, past and present,
and to the dozens of faculty, students, and friends who helped me with fieldwork, gave me
encouragement, or just listened to yet another story about graduate school. Finally, I must
thank my financial supporters, without whom this project never would have made it off the
ground: Appalachian State University Office of Student Research, Graduate Student
Association Senate, Chicago Herpetological Society, and North Carolina Wildlife Federation.

vii
Table of Contents Abstract .............................................................................................................................. iv
Acknowledgements ............................................................................................................ vi
Foreword ............................................................................................................................ ix
Chapter 1: General Introduction .........................................................................................1
Literature Cited ........................................................................................................6
Chapter 2: Two Southern Appalachian salamanders may use color as an aposematic signal to
avian predators
Abstract ..................................................................................................................12
Introduction ............................................................................................................13
Materials and Methods ...........................................................................................18
Results ....................................................................................................................22
Discussion ..............................................................................................................25
Literature Cited ......................................................................................................29
Tables and Figures .................................................................................................36
Appendix ................................................................................................................44
Chapter 3: Experimental evidence for conspicuous coloration as a predator deterrent in
Yonahlossee salamanders
Abstract ..................................................................................................................50
Introduction ............................................................................................................51

viii
Materials and Methods ...........................................................................................53
Results ....................................................................................................................56
Discussion ..............................................................................................................56
Literature Cited ......................................................................................................60
Figures....................................................................................................................63
Chapter 4: An investigation of correlated evolution of conspicuous coloration and body size
in two salamander genera: Ambystoma and Plethodon
Abstract ..................................................................................................................66
Introduction ............................................................................................................67
Materials and Methods ...........................................................................................71
Results ....................................................................................................................73
Discussion ..............................................................................................................74
Literature Cited ......................................................................................................80
Tables and Figures .................................................................................................87
Vita .....................................................................................................................................96

ix
FOREWORD
This manuscript has been formatted according to the style guide for Copeia, a peer-
reviewed journal focused on ichthyology and herpetology.

1
CHAPTER 1
General Introduction
Biological communication is one of the most well studied aspects of animal behavior
(Wallace, 1867; Dawkins and Guilford, 1991; Stevens, 2015). Communication involves
using either morphology or behavior of an organism to signal information (i.e. the signaler)
to another organism (i.e. the receiver) that alters the receivers’ behavior in some way
(reviewed in Scott-Phillips, 2008). Animals use a diversity of signals to convey a variety of
information, from individual quality to unpalatability (Dale, 2006). Signals become
established in a population when they increase an individual’s own fitness, the fitness of the
individual’s kin, or the fitness of descendants in later generations (Owren et al., 2010).
Integument coloration is widely used as a signal by both plants and animals. For
example, conspicuously colored flowers attract pollinators, conspicuously colored avian
plumage attracts mates, and some animal coloration deters predators, either through
concealment or advertisement of toxicity (Vorobyev et al., 1999). The conspicuousness of a
color signal is dependent on the visual system of the receiver, the reflectance or patterning of
the integument, the light environment, and the background; the effect is that more
conspicuous signals are those in which the integument is more easily distinguished from the
background noise (Siddiqi et al., 2004; Uy and Endler, 2004; Endler and Mielke, 2005).
When conspicuous coloration in potential prey items is coupled with a secondary
defense, such as venom or poison, color is thought to alert predators to the unprofitability of
the prey in a phenomenon known as aposematic signaling (Summers et al., 2015). Cott
(1940) suggested that the colors red, yellow, and white, often in combination with black, are

2
used in aposematic signaling because they are easily detected and recalled; thus, they
increase predator recognition of signals of unpalatability. Predators either innately avoid
certain conspicuous colors (Smith, 1975) or learn over time to associate the color with the
defense, and thus alter their behavior to attack more profitable prey (Mappes et al., 2005).
Among organisms that have the potential to exhibit warning color (i.e. are unpalatable), these
signals are expected to be more conspicuous on larger organisms (Gamberale and Tullberg,
1996) and are expected to be more effective among gregarious species which tend to occur in
high densities (Fisher, 1930; Cott, 1940; Edmunds 1974). Both body size and gregariousness
can amplify the conspicuousness of the color signal, increase predator recognition, and
increase initial aversion in naïve predators (Gamberale and Tullberg, 1998).
Amphibians possess great variation in the color and patterns of their integument, both
within and between species (reviewed by Rudh and Qvarnstrom, 2013). Poison dart frogs
(family Dendrobatidae) are a well-known example of animals that use conspicuous
coloration to signal their unpalatability to predators. For example, the strawberry poison frog
(Dendrobates pumilio) displays bright red, yellow, orange, metallic green, or blue
integument coloration and secretes toxins that are lethal to predators (Siddiqi et al., 2004).
Color is an honest signal of unpalatability within D. pumilio; the most conspicuous
individuals are also the most unpalatable (Maan and Cummings, 2012). Additionally,
comparative analyses of species within the poison dart frog family Dendrobatidae have
demonstrated evidence of coevolution of conspicuousness and body size; larger bodied
species are often the most colorful (Hagman and Forsman, 2003; Santos and Cannatella,
2011).
3
In addition to aposematic signaling, color can allow organisms to avoid predation by
mimicking an aposematic species. Batesian mimicry occurs when a relatively scarce,
palatable species resembles an abundant unpalatable species; while Mullerian mimicry
occurs multiple aposematic species resemble one another, thus amplifying the signal of
unpalatability (Cott, 1940). There are several proposed examples of Batesian mimicry in
salamanders (Howard and Brodie, 1971; Brodie and Howard, 1973; Kutcha, 2005), and
snakes (Brodie III and Janzen, 1995). Several species of butterfly have recently been
discovered to be part of a Mullerian mimicry system (see Kapan, 2001). However, it is
difficult to determine whether one species is a mimic of another without an exhaustive study
of antipredator mechanisms and ecological characteristics of all species involved, including
unpalatability (Wollenberg and Measey, 2009). Thus far, mimicry in salamanders has been
experimentally tested using plasticine models (Kuchta, 2005), and with feeding experiments
using avian predators (e.g. Howard and Brodie, 1973; Brandon et al., 1979; Brodie and
Brodie III, 1980).
Amphibian unpalatability is often due to the chemical compounds present in
integument secretions, which can be a rich source of biologically active compounds,
including biogenic amines, peptides, bufadienolides, tetrodotoxins, and lipophilic alkaloids
(Clarke, 1997; Daly et al., 2005; Saporito et al., 2012). Integument secretions serve multiple
physiological purposes, and if poisons are present they are usually stored in granular glands
in the integument, which are controlled by the sympathetic nervous system and secrete their
contents onto the dorsal surface of the animal in response to various stimuli (Barra and
Simmaco, 1995).

4
Behavioral studies of Ambystoma species conducted by Brodie and Gibson (1969)
demonstrate that salamanders display defensive posture when confronted by predators
(mammalian, avian, and reptile predators). This defensive posture involved orienting the
body such that the predator is exposed to the granular glands in the parotid region and tail
ridge, increasing the probability that an attacking predator will be contacted. Researchers
described the granular gland secretions as being insoluble in water, ethyl alcohol, and
acetone, and causing mortality when injected into mice, voles, and rats (Brodie and Gibson,
1969). Predation studies involving Plethodon species have also shown evidence of
unpalatability in these salamanders. Avian species exhibit signs of distress upon eating (or
attempting to eat) P. jordani salamanders and avoid both P. jordani and similarly colored
Desmognathus species in subsequent trials (Hensel and Brodie, 1976). In addition, the
integument secretions of Plethodon shermani have been described as sticky and noxious and
are hypothesized to play a role in predator avoidance (Largen and Woodley, 2008). Several
other species of Plethodon have also historically been described as noxious (Brodie, 1977),
and some species, particularly Plethodon jordani, have been hypothesized to display
aposematic coloration because there is experimental evidence that they are avoided by avian
predators (Hensel and Brodie, 1976). However, there are no published studies describing the
chemical composition of integument secretions in any amphibian family except
Salamandridae, and very little research has focused on potential aposematic coloration in
salamanders.
In the Southern Appalachian Mountains, several species of salamander display
conspicuous coloring and patterning that may have evolved via aposematic signaling.
Ambystoma maculatum are large black-bodied salamanders with large (~2.0 mm in diameter)

5
bright yellow to orange spots on their dorsal side. Plethodon yonahlossee have a red dorsal
patch that covers ~40% of their dorsal region. Two other species appear more cryptic to the
human eye; P. cylindraceus are black with small (~0.5 mm diameter) white flecks, and P.
montanus are uniformly gray. All four species occur sympatrically in the montaine forests of
Watauga County, North Carolina (Petranka, 1998). Here, I explore the function of
integument coloration of Plethodon yonahlossee and Ambystoma maculatum. In Chapter 2, I
quantify conspicuousness of each species as viewed by an avian predator against typical
forest backgrounds as well as quantify whether avian predators could distinguish these
conspicuous species from duller sympatric heterospecifics. In Chapter 3, I conduct a clay
model experiment to assess the effect of the red dorsal patch of P. yonahlossee on avian
predation rates. In Chapter 4, using a comparative approach to determine whether
conspicuous coloration co-evolved with body size in salamander genera: Plethodon and
Ambystoma.
In Chapter 2, modeling of avian predator vision to demonstrates that P. yonahlossee
and A. maculatum are easily distinguishable from typical forest backgrounds and thus should
be highly conspicuous to avian predators. Moreover, avian vision models suggest that P.
yonahlossee and A. maculatum are chromatically distinct from two duller sympatric
heterospecifics (P. montanus and P. cylindraceus), suggesting that birds could easily
distinguish the two putatively aposematic species from duller heterospecifics. In Chapter 3, I
demonstrate that the plasticine models of the conspicuous P. yonahlossee are depredated by
avian predators significantly less often than the duller P. montanus. This experiment
suggests that the red dorsal coloration of P. yonahlossee is interpreted by avian receivers as a
warning signal that deters predation. In Chapter 4, the comparative approach suggests that
6
increased conspicuous coloration co-evolved with increased body size in Ambystoma, but
that evolution in Plethodon salamanders has favored a negative relationship between these
two traits. It may be that Ambystoma are more likely to benefit from an aposematic signal
than Plethodon. Ambystoma are generally larger than Plethodon (Mitchell and Gibbons,
2010), exhibit gregarious behavior while Plethodon do not (Petranka, 1998), and there is
better evidence of toxicity in Ambystoma compared to Plethodon (Brodie, 1977). Proposed
explanations for the loss of conspicuous coloration with increased body size in Plethodon are
alternative uses of color, such as mimicry or thermoregulation. Overall results from my
thesis suggest that both P. yonahlossee and A. maculatum possess traits consistent with
aposematism, and that avian predators could discriminate these signals and do actively avoid
depredating conspicuous salamander models. However, to further explore the hypothesis that
local salamanders use aposematic signaling, research should focus on identifying unpalatable
chemicals and testing behavioral responses of live predators towards salamanders that vary in
conspicuousness.
LITERATURE CITED
Barra, D., and M. Simmaco. 1995. Amphibian skin: a promising resource for antimicrobial
peptides. Trends in Biotechnology 13:205-209.
Brandon, R. A., G. M. Labanick, and J. E. Huheey. 1979. Relative palatability, defensive
behavior, and mimetic relationships of red salamanders (Pseudotriton ruber), mud
salamanders (Pseudotriton montanus), and red efts (Notophthalmus viridescens).
Herpetologica 35:289-303.

7
Brodie III, E. D., and F. J. Janzen. 1995. Experimental studies of coral snake mimicry:
generalized avoidance of ringed snake patterns by free-ranging avian predators.
Functional Ecology 1995:186-190.
Brodie, E. D., Jr. 1977. Salamander antipredator postures. Copeia 1977:523-535.
Brodie, E. D., Jr., and E. D. Brodie III. 1980. Differential avoidance of mimetic
salamanders by free-ranging birds. American Association for the Advancement of
Science 208:181-182.
Brodie, E. D., Jr., and L. S. Gibson. 1969. Defensive behavior and integument glands of
the Northwestern Salamander, Ambystoma gracile. Herpetologists’ League 25:187
194.
Brodie, E. D., Jr., and R. R. Howard. 1973. Experimental study of Batesian mimicry in the
salamanders Plethodon jordani and Desmognathus ochrophaeus. American Midland
Naturalist 38-46.
Clarke, B. T. 1997. The natural history of amphibian integument secretions, their normal
functioning and potential medical applications. Biological Reviews of the Cambridge
Philosophical Society 72:365-379.
Cott, H. B. 1940. Adaptive Coloration in Animals. Methuen and Company Limited,
London, UK.
Dale, J. 2006. Intraspecific variation in coloration, p. 36-86. In: Bird Coloration. Volume 2:
Function and Evolution. G. E. Hill and K. J. McGraw (eds.). Harvard University
Press, Cambridge, Massachusetts.

8
Daly, J. W., T. F. Spande, and H. M. Garraffo. 2005. Alkaloids from amphibian skin: a
tabulation of over eight-hundred compounds. Journal of Natural Products 68:1556
1575.
Dawkins, M. S., and T. Guilford. 1991. The corruption of honest signaling. Animal
Behaviour 41:865-863.
Edmunds, M. 1974. Defence in Animals: A Survey of Anti-predator Defenses. Longmans
Group, Essex, UK.
Endler, J. A., and P. W. Mielke. 2005. Comparing entire colour patterns as birds see them.
Biological Journal of the Linnean Society 86:405-431.
Fisher, R. A. 1930. The Genetical Theory of Natural Selection. Oxford University Press,
Oxford, UK.
Gamberale G., and B. S. Tullberg. 1996. Evidence for a peak-shift in predator
generalization among aposematic prey. Proceedings of the Royal Society of London
B: Biological Sciences 263:1329-1334.
Gamberale, G., and B. S. Tullberg. 1998. Aposematism and gregariousness: the combined
effect of group size and coloration on signal repellence. Proceedings of the Royal
Society of London B: Biological Sciences 265:889-894.
Hagman M., and A. Forsman. 2003. Correlated evolution of conspicuous coloration and
body size in poison frogs (Dendrobatidae). Evolution 57:2904-2910.
Hensel, J. L., Jr., and E. D. Brodie Jr. 1976. An experimental study of aposematic
coloration in the salamander Plethodon jordani. Copeia 1:59-65.

9
Howard, R. R., and E. D. Brodie Jr. 1971. Experimental study of mimicry in salamanders
involving Notopthalmus viridescens viridescens and Pseudotriton ruber schencki.
Nature 233:277.
Howard, R. R., and E. D. Brodie Jr. 1973. A Batesian mimetic complex in salamanders:
responses of avian predators. Herpetologica 29:33-41.
Kapan, D. D. 2001. Three-butterfly system provides a field test of Mullerian mimicry.
Nature 409: 338-340.
Kuchta, S. R. 2005. Experimental support for aposematic coloration in the salamander
Ensatina escholtzii xanthoptica; implications for mimicry of Pacific newts. Copeia
2005:265-271.
Largen, W., and S. K. Woodley. 2008. Cutaneous tail glands, noxious skin secretions, and
scent marking in terrestrial salamander (Plethodon shermani). Herpetologica 64:270
280.
Maan, M. E., and M. E. Cummings. 2012. Poison frog colors are honest signals of toxicity,
particularly for bird predators. The American Naturalist 179:E1-E14.
Mappes, J., N. Marples, and J. A. Endler. 2005. The complex business of survival by
aposematism. Trends in Ecology and Evolution 20:598-603.
Mitchell, J. C., and J. W. Gibbons. 2010. Salamanders of the Southeast. University of
Georgia Press, Athens, Georgia.
Owren, M. J., D. Rendall, and M. J. Ryan. 2010. Redefining animal signaling: influence
versus information in communication. Biology and Philosophy 25:755-780.
Petranka, J. W. 1998. Salamanders of the United States and Canada. Smithsonian
Institution Press, Washington D.C.

10
Rudh, A., and A. Qvarnstrom. 2013. Adaptive colouration in amphibians. Seminars in Cell
and Developmental Biology 24:553-561.
Santos, J. C., and D. C. Cannatella. 2011. Phenotypic integration emerges from
aposematism and scale in poison frogs. Proceedings of the National Academy of
Sciences 108:6175 6180.
Saporito, R. A., M. A. Donnelly, T. F. Spande, and H. M. Garraffo. 2012. A review of
chemical ecology in poison frogs. Chemoecology 22:159-168.
Scott-Phillips, T. C. 2008. Defining biological communication. Journal of Evolutionary
Biology 21:387-395.
Siddiqi, A., T. W. Cronin, E. R. Loew, M. Vorobyev, and K. Summers. 2004.
Interspecific and intraspecific views of color signals in the strawberry poison frog
Dendrobates pumilio. Journal of Experimental Biology 207:2471-2485.
Smith, S. M. 1975. Innate recognition of coral snake pattern by a possible avian predator.
Science 187:759-760.
Stevens, M. 2015. Anti-predator coloration and behavior: A longstanding topic with many
outstanding questions. Current Zoology 61:702-707.
Summers, K., M. P. Speed, J. D. Blount, and A. M. M. Stuckert. 2015. Are aposematic
signals honest? A review. Journal of Evolutionary Biology 28:1583-1599.
Uy, J. A. C., and J. A. Endler. 2004. Modification of the visual background increases the
conspicuousness of golden-collared manakin displays. Behavioral Ecology 15:1003
1010.
Vorobyev, M., J. Marshall, D. Osorio, N. Hempel de Ibarra, and R. Menzel. 1999.
Colorful objects through animal eyes. Color Research and Application 26:S214-S217.

11
Wallace, A. R. 1867. Mimicry and Other Protective Resemblances Among Animals. Read
Books Limited, Worcestershire, UK.
Wollenberg, K. C., and G. J. Measey. 2009. Why colour in subterranean vertebrates?
Exploring the evolution of colour patterns in caecilian amphibians. Journal of
Evolutionary Biology 22:1046-1056.
12
CHAPTER 2
Two Southern Appalachian salamanders may use color as an aposematic signal to avian
predators
ABSTRACT
Color may serve as an aposematic signal in which the conspicuous coloration of prey is used
to signal unpalatability to potential predators. For aposematic signals to be effective, they
must be conspicuous to predators. Conspicuousness is dependent upon several factors
including: the receiver’s visual capabilities, the ambient light environment, and the coloration
of both the signaler and the background. Here, I quantify the conspicuousness of two
salamanders, Plethodon yonahlossee and Ambystoma maculatum, from an avian perspective
to investigate whether their integument coloration could be an aposematic signal to avian
predators. Ambystoma maculatum are large black-bodied salamanders with bright yellow to
orange spots on their dorsal side. Plethodon yonahlossee have a red dorsal patch that covers
~40% of their dorsal region. Using an avian vision model approach, I found that both species
are distinguishable from typical forest backgrounds and are chromatically distinct from two
duller sympatric heterospecifics. I also found that larger Plethodon yonahlossee individuals
have more spectrally pure red coloration (greater red chroma) of their dorsal patches. Though
these results are consistent with aposematic theory, future investigation should focus on
quantifying unpalatability of both species to further explore whether the signals are reliable
and whether predators avoid the prey.

13
INTRODUCTION
Integument color is widely used in animal communication to signal information about one
organism (i.e. the signaler) to another organism (i.e. the receiver) that may alter the receivers’
behavior in some way (discussed by Owren et al., 2010; reviewed in Scott-Phillips, 2008).
Conspicuous color may convey information about individual quality or profitability as a prey
item, while cryptic coloration enables organisms to avoid detection (Dale, 2006). When
conspicuous coloration is combined with some form of secondary defense, such as venom or
poison, color is thought to serve as an aposematic signal in which the signaler alerts potential
predators to their unprofitability (Wallace, 1867; Cott, 1940).
Certain color combinations are commonly used in aposematic signaling, such as red
or yellow pigmentation against a black integument background (Wallace, 1867; Cott, 1940).
These colors are either innately avoided by some predators (Smith, 1975), or are easily
recalled and associated with the defense over time (Mappes et al., 2005). Among organisms
that have the potential to exhibit warning color (i.e. are unpalatable), warning colors are
expected to be more conspicuous when occurring in larger organisms (Gamberale and
Tullberg, 1996a) and are expected to be more effective among gregarious species which tend
to occur in high densities (Fisher, 1930; Cott, 1940; Edmunds 1974; Gamberale and Tullberg,
1996b). Body size, the size of the conspicuous color patch, and gregariousness can amplify
the conspicuousness of the color signal, increase predator recognition, and increase initial
aversion in naïve predators (Gamberale and Tullberg, 1998). It is also expected that
aposematic species will exhibit little intraspecific variation in color, as natural selection
should favor a convergence of color and pattern, likely to increase predator recognition and
reinforce association with the defense (Summers et al., 1997; Dale, 2006). However, if there

14
is intraspecific variation in aposematic species, it could be attributable to variation in toxicity
(some studies suggest an increase in toxicity should coincide with an increase in signal
strength (i.e. Maan and Cummings, 2012)), or color serving as both an aposematic signal and
sexual signal (Siddiqi et al., 2004).
Amphibians display a diversity of integument coloration and patterns, and nearly
every color combination is present in the three amphibian orders: Caudata, Anura, and
Gymnophiona (Rudh and Qvarnstrom, 2013). Amphibians typically possess two cell types
that control integument color and pattern: chromatophores, which contain pigments such as
melanin and pterins, and iridiphores, which contain reflective structural elements, such as
guanine (Summers et al., 2003). The pigments and/or structures absorb and reflect specific
wavelengths of light that are perceived as color by viewers (Bagnara and Hadley, 1973).
Avoiding predation is essential for survival and reproduction of all animals, including
amphibians, resulting in the evolution of diverse predator avoidance tactics, many of which
involve integument color (Darst et al., 2006). Because amphibians typically have small, soft
bodies that lack protective structures, many have taken advantage of conspicuous coloration
as a first line of defense against predation (Rudh and Qvarnstrom, 2013). Previous research
has also shown that many amphibians produce noxious integument secretions when
threatened by a potential predator, which decrease their profitability as prey (reviewed in
Clarke, 1997). There are several examples of amphibian species that use aposematic
coloration. Strawberry poison dart frogs (Dendrobates pumilio) which occur in the
neotropics, are brightly colored and secrete some of the most potent toxins known to exist in
nature (Siddiqi et al., 2004). Eastern newts (Notophthalmus viridescens), which occur in
eastern North America, secrete the neurotoxin tetrodotoxin (Mosher et al., 1964) and

15
undergoes a terrestrial juvenile stage characterized by brilliant orange integument (Petranka,
1998; Mitchell and Gibbons, 2010).
For an aposematic signal to be effective, it must be conspicuous to the intended
receiver. The conspicuousness of integument color is dependent upon multiple factors
including the visual system of the receiver, the reflectance or patterning of the integument,
the light environment, the background upon which the signaler is located, as well as the
medium between the signaler and the receiver (Siddiqi et al., 2004; Uy and Endler, 2004;
Endler and Mielke, 2005). Though natural predators of amphibians are often poorly
documented, avian predators have been most commonly used in predation simulations using
clay model replicas of amphibians (i.e. Saporito et al., 2007; Hegna et al., 2011; McElroy,
2015), and are speculated to be common predators of amphibians in North America
(Petranka, 1998 and the references therein). It is therefore typical to examine color from the
point of view of an avian predator when quantifying conspicuousness coloration in
amphibians (e.g. Siddiqi et al., 2004; Maan and Cummings, 2012).
Differences in visual sensitivity cause humans and birds to perceive color differently
(reviewed in Cuthill, 2006), and recent advances in the understanding of avian vision have
made it possible to model color from an avian perspective. Humans have trichromatic color
vision (three photoreceptors that process light between 400 nm and 700 nm on the
electromagnetic spectrum); every visible color is simulated by specific combinations of red,
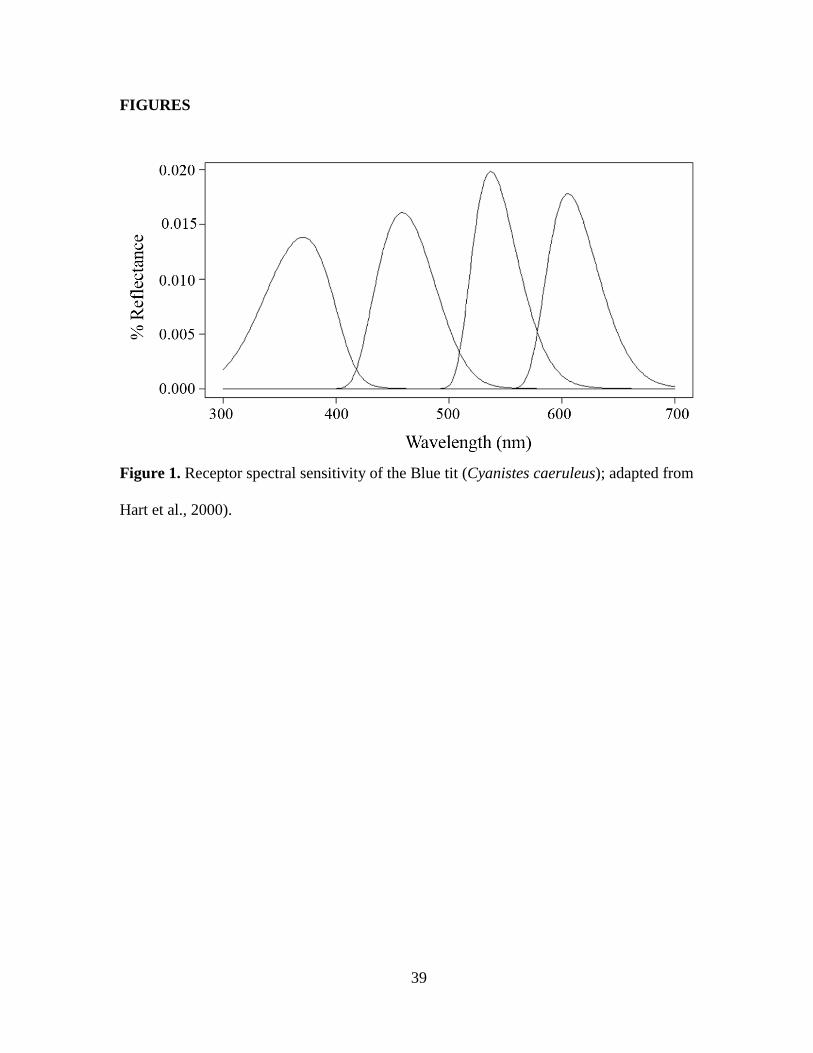
green, and blue wavelengths (Cuthill, 2006). Most birds, however, have tetrachromatic color
vision (four photoreceptors that process the same wavelengths as humans, plus wavelengths
from the ultraviolet part of the spectrum, 300 nm to 400 nm); every visible color is simulated
by specific combinations of red, green, and blue and UV (or near UV) wavelengths (Fig. 1;

16
reviewed in Osorio and Vorobyev, 2008). Also, birds also have doubles cones which allow
to have better ability to discriminate achromatic differences (i.e. brightness) between two
objects (Vorobyev et al., 1998) compared to humans. Using vision models, we can apply our
understanding of avian vision to studies of color signaling and theoretically “see” signals as
birds do (Maia et al., 2013) from both the chromatic (spectral purity or hue) and achromatic
(brightness) perspectives.
Here, I investigate potential aposematic signaling in two species of salamanders that
occur in eastern North America. In the southern Appalachians, salamanders across genera
display markedly distinct coloration; yet, the signaling function of integument coloration in
salamanders is not well studied. Two locally abundant salamanders that, to the human eye,
appear to display conspicuous coloration which could have evolved via aposematic signaling
include: Ambystoma maculatum which are large black bodied salamanders with large (~2-
3mm diameter) bright yellow to orange spots on their dorsal side (Fig. 2b) and Plethodon
yonahlossee, which have a red dorsal patch that covers ~40% of the dorsal region (Fig. 2a).
Two other species appear more cryptic to the human eye; P. cylindraceus are black with
small (~0.5 mm diameter) white flecks (Fig. 2d), and P. montanus are uniformly gray (Fig.
2c; Petranka, 1998). All four species occur sympatrically in the montaine forests of Watauga
County, North Carolina. The Plethodon species are terrestrial while Ambystoma maculatum
salamanders are seasonal pool breeders that migrate from underground burrows to shallow,
stagnant bodies of water at night during late winter/early spring rains (Petranka, 1998).
Previous research exploring unpalatability in these genera has shown that species in both
Plethodon and Ambystoma are distasteful to some predators (Hensel and Brodie, 1976;
Brodie, 1977). Further, the integument secretions of some Ambystoma are potentially lethal

17
to mammalian predators including rats and voles (Brodie and Gibson, 1969), indicating that
color in both genera may signal unpalatability to potential predators. If their coloration is
aposematic, it is expected that these species are distinguishable from an avian perspective
against typical background substrate under various lighting conditions, and that they are
distinguishable from heterospecifics that do not have red or yellow pigmentation in their
integument.
I test the hypothesis that P. yonahlossee and A. maculatum are conspicuous to avian
predators, which would be necessary if such colors have evolved via aposematic signaling. I
predict greater conspicuousness of the integument coloration of the brightly colored P.
yonahlossee and A. maculatum compared to the duller P. cylindraceus and P. montanus
species. First, I measure the spectral reflectance of the dorsal body region of salamanders
and use models of the ‘forest shade’ light environment to quantify whether each species is
visibly discriminable (both achromatically and chromatically) to avian predators against
typical forest background coloration (moss, leaf litter, etc.). Next, because P. yonahlossee
and A. maculatum display putative aposematic coloration (red and yellow coloration,
respectively), I model whether each of species is visibly discriminable from duller
heterospecifics (P. montanus and P. cylindraceus). I predict that P. yonahlossee and A.
maculatum should display greater chromatic variation (i.e., shape of the spectral curve)
visible to potential avian predators. Further, because 1) aposematic theory predicts positive
associations between body size, signal size, and signal effectiveness and 2) comparative
analyses show that larger Ambystoma species have more conspicuous coloration (Chapter 4,
p. 86), I investigate intraspecific correlations between body size and spectral reflectance in
both P. yonahlossee and A. maculatum. In these two species, I also investigate potential

18
correlations between the size of the colorful body region and the spectral reflectance to
determine whether animals with larger (more conspicuous patches) also display more
conspicuous spectral reflectance. Finally, I model whether the extremes of intraspecific
variation in both P. yonahlossee and A. maculatum would be visibly discriminable to avian
predators.
MATERIALS AND METHODS
Data collection.---I opportunistically captured Plethodon salamanders during night surveys
in forest habitat of Watauga and Avery counties, North Carolina from July 2015 to
November 2017. I marked the location of each Plethodon captured using survey flags.
During the migration/breeding period of 2016 (late February/early March), I captured adult
Ambystoma salamanders as they migrated between their terrestrial home ranges and breeding
pools at one site in Watauga County, North Carolina. For each species, I collected small
samples of substrate upon which salamanders were found, including twigs, leaves, moss, and
soil. I transported all individuals to Appalachian State University, for measurement. In the
laboratory, I measured body size (total length), determined sex of Ambystoma salamanders (I
excluded Plethodon because determining sex in individuals outside of breeding condition is
difficult (Petranka, 1998)), and measured spectral reflectance (methods below) of the dorsal
region. I photographed the dorsal region of P. yonahlossee and A. maculatum to quantify the
size of the colorful body patches (methods below). Upon completion of data collection, I
returned all salamanders to the exact site of capture.

19
Spectral measurements.---To measure the spectral reflectance of the dorsal region, I used an
Ocean Optics reflectance spectrometer (S2000: Range 250-880 nm: Dunedin, FL, USA)
equipped with both a deuterium bulb (UV light source) and a tungsten-halogen light source
(visible light source). I generated reflectance measurements relative to a white standard
(100% reflectance from 300-700 nm; Labsphere, Inc.). I then used two standard descriptors
of color for each species: a chromatic and an achromatic descriptor. Following protocol of
Jones and Siefferman (2014), I measured reflectance on five dorsal body regions of each
Plethodon species, beginning at the cervical vertebrae and moving along the spine to end at
the start of the caudal vertebrae (sacral plate) and averaged the spectral data. I quantified the
red chroma of the dorsal patch using the S1R chroma descriptor of reflectance spectra: S1R =
((Rλ605 − Rλ700) / Rλ700, where Rλi is the percent reflectance at the ith wavelength (λi)
(Montgomerie, 2006). Additionally, to attain spectral reflectance data of the yellow spots of
A. maculatum, I followed the protocol of Morgan et al. (2014) and took two measurements
each of the first and third dorsal spot from the anterior dorsal region and averaged the
spectral data. I then quantified the yellow chroma of the averaged spots using the S1Y
chroma descriptor of reflectance spectra: S1Y = ((Rλ550 − Rλ625) / Rλ700, where Rλi is the
percent reflectance at the ith wavelength (λi) (Montgomerie, 2006). I also took five
reflectance measurements of each substrate type (twigs, leaves, moss, and soil) collected
from capture sites and averaged the measurements from the five replicates of each substrate
to create each background (moss, soil, leaf litter, twig).
Vision model measurements.---To model whether salamanders are discriminable from one
another within a species, and whether salamanders are discriminable from backgrounds upon

20
which they are found, I ran the full-spectrum (300–700 nm) reflectance data through models
of avian vision: Perceptual, Analysis, Visualization, and Organization of Spectral Color
Package (pavo) in the R v.3.3.3 statistical program (Maia et al., 2013, R Core Team 2013). I
ran the model from the perspective of the European starling (Sturnus vulgaris), the blue tit
(Parus caeruleus), and the default average UV visual system function (avg.uv) in pavo,
which is based on the average peak sensitivity found in birds that have the UV type of visual
system (Endler and Mielke 2005). As results were almost identical between the three
perspectives, I only present the results from the avg.uv.
I used the color distance function, coldist, which calculates color distances based on
the receptor-noise model of Vorobyev et al. (1998), to estimate interspecific discriminability,
intraspecific discriminability, and discriminability between salamanders and backgrounds.
The coldist function calculates both chromatic differences (i.e., shape of the spectral curve)
and achromatic differences (overall % reflectance) between two objects; units of the output
of this function are just-noticeable-differences (JND) (see Vorobyev et al., 1998). Just-
noticeable-difference values > 1.0 are considered to be discriminable, with discriminability
increasing as JND values increase (Vorobyev and Osorio, 1998). Following the method of
Siddiqi et al., (2004), I considered JND values < 4 to be relatively poorly discriminable.
Achromatic differences are calculated based on the double cones responsible for chromatic
processing (Siddiqi et al., 2004); I used the double cone abundance for European Starlings in
this study (Hart et al., 1998) as I assume most crepuscular and diurnal avian predators are
passerines.
This model also incorporates ambient light environment; options are “ideal”, “blue-
sky”, “forest shade”, and standard (“D65”). Because salamanders would be viewed by most

21
crepuscular and diurnal avian predators in the early morning and evening in the forest
environment, I used “forest shade” and “D65”. As results were almost identical between the
“forest shade” and “D65” light environments, I only present the results from “forest shade”
here.
Measurement of aposematic spot characteristics.---I photographed each salamander using
an 8-megapixel camera from a distance of 0.3 m (at a 90o angle next to a cardstock rectangle
with a 20 mm by 20 mm square for a size standard). I used Adobe Photoshop to quantify the
patch surface area (mm2) and percent patch cover of each P. yonahlossee and spot surface
area (mm2) spot cover of A. maculatum. To do so, I first calculated the total surface area in
millimeters of the salamander in each standardized photograph, then calculated the total
surface area of the patch (P. yonahlossee) or spots (A. maculatum), then divided patch
surface area by total surface area to determine the percentage of the body covered by the
patch or the spots.
Statistical methods.---Statistical analyses were performed in SPSS v. 23. For P. yonahlossee
and A. maculatum, I used Pearson correlations to investigate relationships between spectral
variables (brightness and chroma), body size and patch characteristics. I also used Student’s
t-tests to identify sex differences in body size, spot area and color measurements of A.
maculatum.

22
RESULTS
Visual discriminability of salamanders against backgrounds
I contrasted each species separately against 4 backgrounds as viewed by a typical passerine
bird under the “forest shade” light environment. Results are similar between backgrounds so
I present only the results for “leaf litter” background; results for other backgrounds can be
found in the Appendix.
Plethodon yonahlossee.---Spectra of 61 P. yonahlossee were compared to a “leaf litter”
background for both chromatic and achromatic differences. For chromatic discriminability,
100% of P. yonahlossee were discriminable, 4.9% were relatively poorly discriminable, and
the highest JND value was 8.15 (Fig. 3a). For achromatic discriminability, 100% were
discriminable, and JND values ranged from 7.6 to 34.9 (Fig. 4a).
Ambystoma maculatum.---Spectra of 73 A. maculatum were compared to a “leaf litter”
background for both chromatic and achromatic differences. For chromatic discriminability,
100% of A. maculatum were discriminable, but 80.8% were relatively poorly discriminable
(JND values ranged from 1.8 to 8.0 (Fig. 3b). For achromatic differences, 11.0% were not at
all discriminable, 39.7% were relatively poorly discriminable, and JND values ranged from
0.005 to 19.7 (Fig. 4b).
Plethodon montanus.---Spectra of 74 P. montanus were compared to a “leaf litter”
background for both chromatic and achromatic differences. For chromatic discriminability,
100% of P. montanus were discriminable, and JND values ranged from 5.5 to 11.9 (Fig. 3c).

23
For achromatic discriminability, 100% were discriminable and JND values ranged from 15.9
to 38.6 (Fig. 4c).
Plethodon cylindraceus.--- Spectra of 48 P. cylindraceus were compared to a “leaf litter”
background for both chromatic and achromatic differences. For chromatic discriminability,
100% were discriminable and JND values ranged from 6.1 to 13.6 (Fig. 3d). For achromatic
discriminability, 100% were discriminable and JND values ranged from 8.8 to 37.6 (Fig. 4d).
Interspecific comparisons
I contrasted P. yonahlossee and A. maculatum separately against both P. cylindraceus and P.
montanus to determine whether species could be distinguished using only chromatic
contrasts as viewed by a typical passerine bird under the “forest shade” light environment.
Plethodon yonahlossee vs Plethodon cylindraceus.---I compared 61 spectra of P.
yonahlossee to 48 spectra of P. cylindraceus, resulting in a total of 2,928 comparisons. One
hundred percent of P. yonahlossee are discriminable against P. cylindraceus, but of those,
10.4% are relatively poorly discriminable (Fig. 5a).
Plethodon yonahlossee vs Plethodon montanus.---I compared 61 spectra of P. yonahlossee
to 74 spectra of P. montanus, resulting in a total of 4,514 comparisons. One hundred percent
of P. yonahlossee are discriminable against P. cylindraceus and, of those, 11.9% are
relatively poorly discriminable (Fig. 5b).

24
Ambystoma maculatum vs Plethodon cylindraceus.---I compared 73 spectra of A.
maculatum to 48 spectra of P. cylindraceus, resulting in a total of 3,504 comparisons. One
hundred percent of A. maculatum are discriminable against P. cylindraceus and, of those,
4.9% are relatively poorly discriminable (Fig. 5c).
Ambystoma maculatum vs Plethodon montanus.---I compared 73 spectra of A. maculatum
to 74 spectra of P. montanus, resulting in 5,402 comparisons. One hundred percent of A.
maculatum are discriminable against P. montanus and, of those, 2.1% were relatively poorly
discriminable (Fig. 5d).
Intraspecific morphology-color associations
Coefficients of variation (COV) suggest that within species variation in color measures are
greater for P. yonahlossee than A. maculatum (P. yonahlossee: n = 61, mean = 0.35, SD =
0.06, COV = 0.18; for A. maculatum: n = 73, mean = 0.28, SD = 0.03, COV = 0.10).
Plethodon yonahlossee.---I measured spectral reflectance and body size for 30 P.
yonahlossee individuals. Red chroma was significantly positively correlated with total
length; larger individuals had more spectrally pure red coloration, while brightness was not
significantly related to body size (Table 1). Red chroma was not significantly correlated with
the surface area of the red patch, nor the percentage of the body covered by the patch (Table
1). Modeling of chromatic discriminability suggests that the P. yonahlossee individual with
the greatest red chroma should be clearly distinguishable from the individual with the lowest
red chroma (chromatic JND = 9.8).
25
Ambystoma maculatum.---I measured spectral reflectance and body size for 75 A.
maculatum. Because both body size and spectral reflectance differ significantly with sex
(Table 2), I investigated correlations between body size, spectral reflectance, and % spot
coverage separately for females and males. There were no significant associations between
body size and yellow chroma or body size and brightness in either sex (Table 3). Modeling
of chromatic discriminability suggests that the A. maculatum individual with the highest
yellow chroma is only relatively poorly discriminable from the individual with the lowest
yellow chroma (JND = 2.3).
DISCUSSION
To elucidate the effectiveness of potential aposematic signaling in two salamander species, I
modeled how well potential predators can discriminate spot and patch coloration against
natural backgrounds and against less conspicuous sympatric heterospecifics. My results
indicate that Plethodon yonahlossee is both chromatically and achromatically discriminable
against a leaf litter background from an avian perspective. Further, although Ambystoma
maculatum is also both chromatically and achromatically discriminable against a leaf litter
background, most individuals are relatively poorly discriminable chromatically. However,
both P. yonahlossee and A. maculatum are chromatically discriminable from the duller P.
montanus and P. cylindraceus. Previous research has shown that species in both Plethodon
and Ambystoma are distasteful to some predators (Hensel and Brodie, 1976; Brodie, 1977),
and that integument secretions of some Ambystoma are potentially lethal to mammalian
predators (Brodie and Gibson, 1969), indicating that color in both genera may signal

26
unpalatability to potential predators. My results support the hypothesis that integument color
in P. yonahlossee and A. maculatum is conspicuous to passerine predators and these findings
support previous research suggesting that these two species could be using aposematic
signaling.
Among P. yonahlossee, larger individuals had greater red chroma in their red dorsal
patches, but there were no significant associations between relative patch size and chroma.
Moreover, from an avian perspective, the P. yonahlossee individual with the highest red
chroma is distinguishable from the individual with the lowest red chroma. From an
interspecific comparison perspective, positive associations between body size and
conspicuousness are expected because larger organisms are easily detected and therefore
more likely to benefit from conspicuous coloration (Hossie et al., 2015). That larger P.
yonahlossee individuals had greater red chroma could also be interpreted as being consistent
with aposematic theory. Plethodon yonahlossee also exhibited greater chromatic variation
than predicted, as species that use aposematic signaling generally show little intraspecific
variation in color (Dale, 2006). However, some aposematic theory suggests that an increase
in signal strength (like more intense pigmentation) should coincide with an increase in
unpalatability (Speed and Ruxton, 2007). Indeed, in poison dart frogs, the more conspicuous
morphs have greater concentrations of toxins in their integument (Maan and Cummings,
2012).
Among A. maculatum, body size and yellow chroma were not correlated. However,
from an avian perspective, the A. maculatum individual with the greatest yellow chroma
would not distinguishable from the individual with the lowest yellow chroma. Therefore, the
intraspecific variation in color of P. yonahlossee, but not A. maculatum, should be visible to

27
predators. This could be due to greater spectral sensitivity in the red portion of the visible
spectrum than in the yellow portion, but there is also more variation in red chroma in P.
yonahlossee than in yellow chroma in A. maculatum (greater coefficient of variation for
chroma). However, predators may be better able to detect A. maculatum with greater spot
coverage.
Ambient light also influences the conspicuousness of a color signal, and this study
only examined perception under forest shade light conditions. Plethodon species are most
active at night and the Ambystoma species is largely both nocturnal and fossorial, except
during the explosive annual breeding migration during which they are active above ground
for several weeks (Petranka, 1998). However, there is evidence that all species are, on
occasion, active during daylight hours, and the Plethodon species are active in the leaf litter
and under cover objects in the day, as well (Brandon and Huheey, 1975). Any opportunity of
being viewed during the day, however slight, may be enough to drive selection of integument
coloration that is conspicuous to diurnal predators (e.g. caecilians; Wollenberg and Measey,
2009). In addition, many nocturnal predators have evolved physiological adaptations to a
dim light environment, including increased perception of achromatic signals (Osorio and
Vorobyev, 2005). Thus, the high achromatic discriminability of both P. yonahlossee and A.
maculatum against forest backgrounds could be useful in signaling to nocturnal predators, in
addition to the chromatic signals that may be more accurately perceived by diurnal predators.
In addition to chromatic and achromatic discriminability, integument patterning of
both P. yonahlossee and A. maculatum likely add to their conspicuousness. In other fossorial
amphibians (i.e. caecilians), both contrasting integument patterns and yellow pigmentation
evolved in tandem with an increase in surface activity (Wollenberg and Measey, 2009).

28
Contrasting patterns elements (such as red and black or yellow and black spots or stripes) are
thought to increase conspicuousness and thus increase predator learning, recognition, and
avoidance of aposematic species, while an increase in the size of pattern elements (larger
spots, for example) has been shown to further increase signal efficacy (Gamberale and
Tullberg, 1996a, 1998; Lindstrom et al., 1999). The greater yellow chroma in A. maculatum
individuals with a greater percentage of the body covered in spots is consistent with
aposematic theory. Therefore, though many A. maculatum individuals were only relatively
poorly discriminable from the leaf litter background, the integument pattern itself may
amplify the signal and increase predator avoidance.
Though these results indicate that P. yonahlossee and A. maculatum are conspicuous
to potential avian predators, color signals can be viewed by any visually-oriented organism.
Because conspicuousness is dependent upon multiple factors, P. yonahlossee and A.
maculatum could be conspicuous to some organisms but not to others. Color can therefore
serve multiple functions simultaneously. For example, swallowtail butterfly larva (Papilio
machaon) are inconspicuous to humans at a distance but conspicuous up close, indicating
coloration is used in both crypsis and aposematism (Tullberg et al., 2005). Color in the
polymorphic Dendrobates pumilio is discriminable to both avian predators and conspecifics
and is thought to act simultaneously as an aposematic and sexual signal (Siddiqi et al., 2004).
Thus, it is possible that some variation in coloration can be attributed to sex and that sexual
selection could lead to greater conspicuousness of P. yonahlossee. I did not include sex as a
factor in analyses of P. yonahlossee coloration because determining sex using external
characteristics is difficult and likely would be inaccurate, and thus I cannot exclude the
possibility that color is related to sexual differences within the species. Ambystoma

29
maculatum coloration is sexually dimorphic; females have brighter (lighter yellow) and
larger spots (my results; Morgan et al., 2014) and are also heavier than males (Morgan et al.,
2014). Therefore, it is possible that A. maculatum coloration is simultaneously acting as an
aposematic and sexual signal. Additional exploration of perception of A. maculatum and
other potential signal receivers is needed.
This study suggests that both P. yonahlossee and A. maculatum are distinguishable to
passerine avian predators against typical forest backgrounds in forest shade ambient light
conditions. Further, both are distinguishable from duller heterospecific species that occur in
the same habitat. These results are consistent with aposematic signaling, as are the
morphological associations with color in both species. Although the results support the
hypothesis of aposematic coloration in the two species, much more work is needed to fully
address the possibility. More information on the chemical composition of integument
secretions in both species is crucial to understanding their defensive strategies and the
function of their bright integument coloration.
LITERATURE CITED Bagnara, J. T., and M. E. Hadley. 1973. Chromatophores and colour change. The
Comparative Physiology of Animal Pigmentation.
Brandon, R. A., and J. E. Huheey. 1975. Diurnal activity, avian predation, and the question
of warning coloration and cryptic coloration in salamanders. Herpetologica 31:252
255.
Brodie, E. D., Jr. 1977. Salamander antipredator postures. Copeia 1977:523-535.

30
Brodie, E. D., Jr., and L. S. Gibson. 1969. Defensive behavior and integument glands of
the Northwestern Salamander, Ambystoma gracile. Herpetologists’ League 25:187
194.
Clarke, B. T. 1997. The natural history of amphibian integument secretions, their normal
functioning and potential medical applications. Biological Reviews of the Cambridge
Philosophical Society 72:365-379.
Cott, H. B. 1940. Adaptive Coloration in Animals. Methuen and Company Limited,
London, UK.
Cuthill, I. C. 2006. Color perception, p. 3–44. In Bird Coloration. Volume 1: Mechanisms
and Measurements. G. E. Hill and K. J. McGraw. (eds.). Harvard University Press,
Cambridge, Massachusetts.
Dale, J. 2006. Intraspecific variation in coloration, p. 36-86. In: Bird Coloration. Volume 2:
Function and Evolution. G.E. Hill and K.J. McGraw (eds.). Harvard University Press,
Cambridge, Massachusetts.
Darst, C. R., M. E. Cummings, and D. C. Cannatella. 2006. A mechanism for diversity in
warning signals: Conspicuousness versus toxicity in poison frogs. Proceedings of the
National Academy of Sciences 103:5852-5857.
Edmunds, M. 1974. Defence in Animals: A Survey of Anti-predator Defenses. Longmans
Group, Essex, UK.
Endler, J. A., and P. W. Mielke. 2005. Comparing entire colour patterns as birds see them.
Biological Journal of the Linnean Society 86:405-431.
Fisher, R. A. 1930. The Genetical Theory of Natural Selection. Oxford University Press,
Oxford, UK.

31
Gamberale G., and B. S. Tullberg. 1996a. Evidence for a peak-shift in predator
generalization among aposematic prey. Proceedings of the Royal Society of London
B: Biological Sciences 263:1329-1334.
Gamberale, G., and B. S. Tullberg. 1996b. Evidence for a more effective signal in
aggregated aposematic prey. Animal Behaviour 52:597-601.
Gamberale, G., and B. S. Tullberg. 1998. Aposematism and gregariousness: the combined
effect of group size and coloration on signal repellence. Proceedings of the Royal
Society of London B: Biological Sciences 265:889-894.
Hart, N., J. Partridge, and I. C. Cuthill. 1998. Visual pigments, oil droplets and cone
photoreceptor distribution in the European Starling (Sturnus vulgaris). Journal of
Experimental Biology 201:1433–46.
Hart, N. S., J. C. Partridge, I. C. Cuthill, and A. T. D. Bennett. 2000. Visual pigments, oil
droplets, ocular media and cone photoreceptor distribution in two species of passerine
bird: the blue tit (Parus caeruleus L.) and the blackbird (Turdus merula L.). Journal
of Comparative Physiology A 186:375-387.
Hegna, R. H., R. A. Saporito, K. G. Gerow, and M. A. Donnelly. 2011. Contrasting colors
of an aposematic poison frog do not affect predation. Annales Zoologici Fennici
48:29-38.
Hensel, J. L., Jr., and E. D. Brodie Jr. 1976. An experimental study of aposematic
coloration in the salamander Plethodon jordani. Copeia 1:59-65.
Hossie, T. J., J. Skelhorn, J. W. Breinholt, A. Y. Kawahara, and T. N. Sherratt. 2015.
Body size affects the evolution of eyespots in caterpillars. Proceedings of the
National Academy of Sciences 112:6664-6669.
32
Jones, J. A., and L. Siefferman. 2014. Agonistic behaviors between chestnut-sided
(Setophaga pensylvanica) and golden-winged (Vermivora chrysoptera) warblers are
unlikely a result of plumage misidentification. The Wilson Journal of Ornithology
126:708-706.
Lindstrom, L., R. V. Alatalo, J. Mappes, M. Riipi, and L. Vertainen. 1999. Can
aposematic signals evolve by gradual change? Nature 397:249–251.
Maan, M. E., and M. E. Cummings. 2012. Poison frog colors are honest signals of toxicity,
particularly for bird predators. The American Naturalist 179:E1-E14.
Maia, R., C. M. Eliason, P. P. Bitton, S. M. Doucet, and M. D. Shawkey. 2013. Pavo: An
R package for the analysis, visualization and organization of spectral data. Methods in
Ecology and Evolution 4:906–913.
Mappes, J., N. Marples, and J. A. Endler. 2005. The complex business of survival by
aposematism. Trends in Ecology and Evolution 20:598-603.
McElroy, M. T. 2015. Teasing apart crypsis and aposematism—evidence that disruptive
coloration reduces predation on a noxious toad. Biological Journal of the Linnean
Society 117:285-294.
Mitchell, J. C., and J. W. Gibbons. 2010. Salamanders of the Southeast. University of
Georgia Press, Athens, Georgia.
Montgomerie, R. 2006. Analyzing colors, p. 90-147. In: Bird Coloration. Volume 1:
Mechanisms and Measurements. G. E. Hill and K. J. McGraw (eds.). Harvard
University Press, Cambridge, Massachusetts.
Morgan, S. K., M. W. Pugh, M. M. Gangloff, and L. Siefferman. 2014. The spots of the
spotted salamander are sexually dimorphic. Copeia 2014:251-256.
33
Mosher, H. S., F. A. Fuhrman, H. D. Buchwald, and H. G. Fischer. 1964. Tachichatoxin
tetrodotoxin: a potent neurotoxin. Science 144:1100-1110.
Osorio D., and M. Vorobyev. 2005. Photoreceptor spectral sensitivities in terrestrial
animals: adaptations for luminance and colour vision. Proceedings of the Royal
Society B: Biological Sciences 272:1745-1752.
Osorio, D., and M. Vorobyev. 2008. A review of the evolution of animal colour vision and
visual communication signals. Vision research 48:2042-2051.
Owren, M. J., D. Rendall, and M. J. Ryan. 2010. Redefining animal signaling: influence
versus information in communication. Biology and Philosophy 25:755-780.
Petranka, J. W. 1998. Salamanders of the United States and Canada. Smithsonian
Institution Press, Washington DC.
Rudh, A., and A. Qvarnstrom. 2013. Adaptive colouration in amphibians. Seminars in Cell
and Developmental Biology 24:553-561.
Saporito, R. A., R. Zuercher, M. Roberts, K. G. Gerow, and M. A. Donnelly. 2007.
Experimental evidence for aposematism in the Dendrobatid poison frog Oophaga
pumilio. Copeia 2007:1006-1011.
Scott-Phillips, T. C. 2008. Defining biological communication. Journal of Evolutionary
Biology 21:387-395.
Siddiqi, A., T. W. Cronin, E. R. Loew, M. Vorobyev, and K. Summers. 2004.
Interspecific and intraspecific views of color signals in the strawberry poison frog
Dendrobates pumilio. Journal of Experimental Biology 207:2471-2485.
Smith, S. M. 1975. Innate recognition of coral snake pattern by a possible avian predator.
Science 187:759-760.

34
Speed, M. P., and G. D. Ruxton. 2007. How bright and how nasty: explaining diversity in
warning signal strength. Evolution 61:623-635.
Summers, K., E. Bermingham, L. Wegt, S. McCafferty, and L. Dahistrom. 1997.
Phenotypic and genetic divergence in three species of dart-poison frogs with
contrasting parental behavior. Journal of Heredity 88:8-13.
Summers, K., T. W. Cronin, and T. Kennedy. 2003. Variation in spectral reflectance
among populations of Dendrobates pumilio, the strawberry poison frog, in Bocas del
Toro Archipelago, Panama. Journal of Biogeography 30:35-53.
Tullberg, B. S, S. Merilaita, and C. Wiklund. 2005. Aposematism and crypsis combined as
a result of distance dependence: functional versatility of the colour pattern in the
swallowtail butterfly larva. Proceedings of the Royal Society B: Biological Sciences
272:1315-1321.
Uy, J. A. C., and J. A. Endler. 2004. Modification of the visual background increases the
conspicuousness of golden-collared manakin displays. Behavioral Ecology 15:1003
1010.
Vorobyev, M., and D. Osorio. 1998. Receptor noise as a determinant of colour thresholds.
Proceedings of the Royal Society B: Biological Sciences 265:351-358.
Vorobyev, M., D. Osorio, A. T. D. Bennett, N. J. Marshall, and I. C. Cuthill. 1998.
Tetrachromacy, oil droplets and bird plumage colors. Journal of Comparative
Physiology A: Neuroethology, Sensory, Neural, and Behavioral Physiology 183:621
633.
Wallace, A. R. 1867. Mimicry and Other Protective Resemblances Among Animals. Read
Books Limited.

35
Wollenberg, K. C., and G. J. Measey. 2009. Why colour in subterranean vertebrates?
Exploring the evolution of colour patterns in caecilian amphibians. Journal of
Evolutionary Biology 22:1046-1056.

36
TABLES Table 1. Pearson’s correlations between color variables and morphology of Plethodon
yonahlossee, n = 30 for total length and n = 27 for patch surface area and % patch cover.
Variable Brightness Red Chroma r p r p Total Length (mm) 0.093 0.623 0.437 0.016 Patch Surface Area 0.194 0.333 0.312 0.113 % Patch Cover 0.148 0.460 -0.136 0.499

37
Table 2. Sex differences (Student’s T-tests) in morphology, coloration, and spot
characteristics of Ambystoma maculatum. For females, n = 25 for total length and % spot
cover and n = 24 for chroma and brightness, n = 50 for males.
Variable Female mean +/- SD Male mean +/- SD T p Total Length (mm) 204.6 +/- 8.8 191.2+/-12.0 5.486 <0.001 Yellow Chroma 0.2652+/-0.0616 0.2804 +/-0.0297 -1.151 0.259 Brightness 0.1769+/-0.0970 0.1131+/-0.0483 3.044 <0.001 % Spot over 10.9+/-4.3 12.7+/-2.9 -1.826 0.076

38
Table 3. Pearson’s correlations between color variables and morphology of female (n = 24)
and male (n = 50) Ambystoma maculatum.
Sex Variable Brightness Yellow chroma
r p r p Female Total Length (mm) 0.184 0.390 -0.222 0.296 Female Spot Surface Area (mm2) 0.310 0.141 0.352 0.092 Female % Spot Cover 0.294 0.163 -0.133 0.544 Male Total Length (mm) 0.061 0.674 -0.155 0.282 Male Spot Surface Area (mm2) 0.041 0.775 -0.174 0.226 Male % Spot Cover 0.149 0.301 -0.177 0.220
39
FIGURES
Figure 1. Receptor spectral sensitivity of the Blue tit (Cyanistes caeruleus); adapted from
Hart et al., 2000).

40
Figure 2. Photographs of A) Plethodon yonahlossee, B) Ambystoma maculatum, C)
Plethodon cylindraceus, D) Plethodon montanus. Photographs courtesy of M. Worth Pugh.

41
Figure 3. Histogram of chromatic Just Noticeable Differences for A) Plethodon yonahlossee,
B) Ambystoma maculatum, C) P. montanus, D) P. cylindraceus on a leaf litter background.

42
Figure 4. Histogram of achromatic Just Noticeable Differences for A) Plethodon
yonahlossee, B) Ambystoma maculatum, C) P. montanus, D) P. cylindraceus on a leaf litter
background.

43
Figure 5. Histogram of chromatic Just Noticeable Differences for interspecific comparisons.
A) P. yonahlossee vs P. montanus, B) P. yonahlossee vs P. cylindraceus, c) A. maculatum vs
P. montanus, d) A. maculatum vs P. cylindraceus.

44
APPENDIX Supplemental Figures
Figure S1. Histogram of chromatic Just Noticeable Differences for A) Plethodon
yonahlossee, B) Ambystoma maculatum, C) P. montanus, D) P. cylindraceus on a moss
background.

45
Figure S2. Histogram of achromatic Just Noticeable Differences for A) Plethodon
yonahlossee, B) Ambystoma maculatum, C) P. montanus, D) P. cylindraceus on a moss
background.

46
Figure S3. Histogram of chromatic Just Noticeable Differences for A) Plethodon
yonahlossee, B) Ambystoma maculatum, C) P. montanus, D) P. cylindraceus on a soil
background.

47
Figure S4. Histogram of achromatic Just Noticeable Differences for A) Plethodon
yonahlossee, B) Ambystoma maculatum, C) P. montanus, D) P. cylindraceus on a soil
background.

48
Figure S5. Histogram of chromatic Just Noticeable Differences for A) Plethodon
yonahlossee, B) Ambystoma maculatum, C) P. montanus, D) P. cylindraceus on a twig
background.

49
Figure S6. Histogram of achromatic Just Noticeable Differences for A) Plethodon
yonahlossee, B) Ambystoma maculatum, C) P. montanus, D) P. cylindraceus on a twig
background.

50
CHAPTER 3
Experimental evidence for conspicuous coloration as a predator deterrent in
Yonahlossee salamanders
ABSTRACT
Amphibians are renowned for the variation in the color and patterns of their integument, both
within and between species. Some amphibian taxa, particularly the poison dart frogs, are
well known for using conspicuous coloration to signal their unpalatability to potential
predators. Integument secretions contain biologically active compounds that are the source
of unpalatability. Although relatively poorly studied, salamanders are often brightly colored
and secrete mucous-like substances that may serve physiological and defensive functions. In
the southern Appalachians, two closely related salamander species, Plethodon yonahlossee
and P. montanus display vastly different coloration; yet, the signaling function of integument
coloration is not well studied. Plethodon yonahlossee has a large red dorsal patch, while P.
montanus is uniformly grey. I hypothesize that the red coloration of P. yonahlossee is an
aposematic signal that communicates unpalatability to potential predators and predict that
avian predators will avoid depredating this species. Here, I used plasticine models of both
species to experimentally test whether predators depredate conspicuously colored models less
frequently than dull models. Predation rates on grey models were significantly higher
compared to that of red models, suggesting that the red dorsal coloration of P. yonahlossee is
interpreted as a warning signal that deters predation. Future research should address whether
P. yonahlossee is unpalatable or is effectively mimicking a sympatric aposematic species.
51
INTRODUCTION
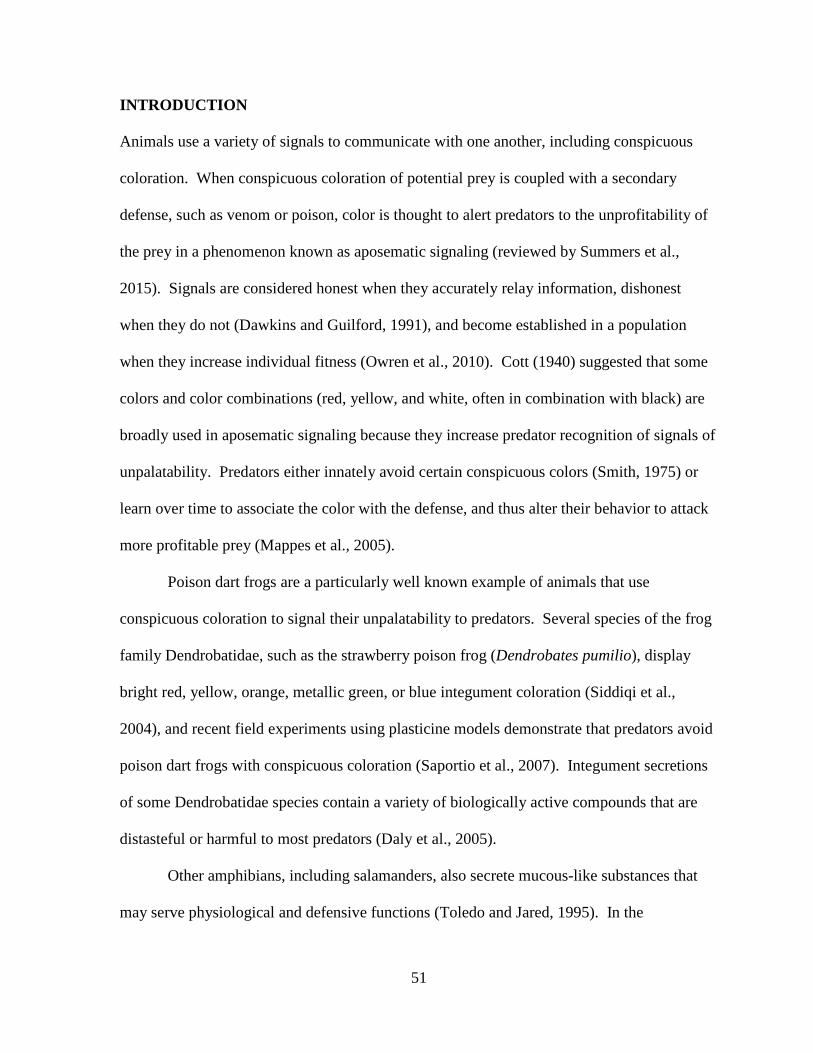
Animals use a variety of signals to communicate with one another, including conspicuous
coloration. When conspicuous coloration of potential prey is coupled with a secondary
defense, such as venom or poison, color is thought to alert predators to the unprofitability of
the prey in a phenomenon known as aposematic signaling (reviewed by Summers et al.,
2015). Signals are considered honest when they accurately relay information, dishonest
when they do not (Dawkins and Guilford, 1991), and become established in a population
when they increase individual fitness (Owren et al., 2010). Cott (1940) suggested that some
colors and color combinations (red, yellow, and white, often in combination with black) are
broadly used in aposematic signaling because they increase predator recognition of signals of
unpalatability. Predators either innately avoid certain conspicuous colors (Smith, 1975) or
learn over time to associate the color with the defense, and thus alter their behavior to attack
more profitable prey (Mappes et al., 2005).
Poison dart frogs are a particularly well known example of animals that use
conspicuous coloration to signal their unpalatability to predators. Several species of the frog
family Dendrobatidae, such as the strawberry poison frog (Dendrobates pumilio), display
bright red, yellow, orange, metallic green, or blue integument coloration (Siddiqi et al.,
2004), and recent field experiments using plasticine models demonstrate that predators avoid
poison dart frogs with conspicuous coloration (Saportio et al., 2007). Integument secretions
of some Dendrobatidae species contain a variety of biologically active compounds that are
distasteful or harmful to most predators (Daly et al., 2005).
Other amphibians, including salamanders, also secrete mucous-like substances that
may serve physiological and defensive functions (Toledo and Jared, 1995). In the

52
salamander family Salamandridae, representatives of the genera Taricha, Notophthalmus,
Cynops, and Titurus secrete varying amounts of the neurotoxin tetrodotoxin (Wakely et al.,
1966), and Salamandra salamandra terrestris have been found to secrete the steroidal
alkaloids samandarine and samandarone which are also thought to be used in chemical
defense (Mebs and Pogoda, 2005). However, salamanders outside of the family
Salamandridae are underrepresented in published literature involving chemical analysis of
integument secretions, but several studies have used behavioral trials and toxicity assays to
determine level of unpalatability in the families Plethodontidae and Ambystomatidae.
Representatives of both families secrete mucous-like substances when threatened, some of
which seem to deter predation by vertebrates and sicken or kill them when injected into the
skin (Brodie and Gibson, 1969; Dodd et al., 1974; Hensel and Brodie, 1976; Brandon and
Huheey, 1981).
In the Southern Appalachian Mountains, several species of salamanders display
conspicuous integument patterning and coloration, but the signal function of integument
color and chemical makeup of integument secretions are largely unexplored in the literature
(aside from Notophthalmus viridescens, which occurs throughout much of eastern North
America and has been extensively studied (Petranka, 1998)). To experimentally test whether
one species of conspicuously colored salamander is using integument coloration to avoid
predation, potentially as an aposematic signal, I used plasticine models of two local,
sympatric salamander species, one with conspicuous coloration (Plethodon yonahlossee) and
one without (P. montanus), to investigate predator response to differences in their coloration.
I expected that predators would avoid the more conspicuous models, as they would associate
the coloration with unpalatable integument secretions.

53
MATERIALS AND METHODS
Study species.--- Both P. yonahlossee and P. montanus occur sympatrically in the Blue
Ridge Mountains of North Carolina, northeastern Tennessee, and southwestern Virginia
(Petranka, 1998) and occur in the same habitat. Plethodon yonahlossee has a dark dorsum
with lateral white flecking (giving it a frosty appearance) and a large red to copper dorsal
patch which extends from the base of the head to the base of the tail; Plethodon montanus is
uniformly grey. The close phylogenetic relationships coupled with differences in integument
coloration make these model species to explore the signaling function of salamander
coloration.
Clay model replicas.---I used pre-colored, non-hardening, non-toxic modeling clay (Sculpey
III) to make model replicas of both P. yonahlossee and P. montanus. Plasticine models are
useful for field experiments as they retain impressions from predation attempts and have
been used successfully in previous studies of aposematic coloration and mimicry in insects,
amphibians, and reptiles (Brodie III, 1993; Brodie III and Moore, 1995; Kuchta, 2005;
Saporito et al., 2007). To make the models, I used a hardened clay mold of a P. yonahlossee
specimen that measured 15 cm total length which falls within the natural size range of both
P. yonahlossee (11-22 cm) and P. montanus (9-18.4 cm). Plethodon yonahlossee models
were uniformly dark grey with a large red dorsal patch extending from the base of the head to
the base of the tail while P. montanus models were uniformly medium grey (Fig. 1).
To select clay colors that closely matched reflectance spectra of live salamanders
(Fig. 2), I measured the spectral reflectance of 60 P. yonahlossee and 76 P. montanus as well
as each color of clay using an Ocean Optics S2000 spectrophotometer (range 250–880 nm:

54
Dunedin, FL, USA) using a bifurcated micron fiber optic probe (see Steffen and McGraw,
2007). The probe was maintained at a fixed distance (1 mm) and angle (90) from the skin
surface by placing the probe within a rubber stopper held flush with the salamander’s skin
surface. I illuminated a 2 mm measurement area with a tungsten-halogen bulb. I generated
reflectance data by comparing integument reflectance to a white standard (Labsphere, Inc.).
To quantify dorsal coloration, I used the reflectance data to calculate red chroma and
brightness. Red chroma is the measure of the proportion of light reflected in the red region,
calculated as reflectance from 605 – 700 nm divided by the total reflectance (300-700 nm;
Montgomerie, 2008), so that an animal with greater red color will have a higher value of
chromatic variation in spectral reflectance. Brightness, or the total amount of light reflected
by the skin, was calculated as the mean of the summed reflectance from 300 –700 nm, and
can be thought of as lighter (brighter) or darker coloration (achromatic variation in spectral
reflectance).
Experimental design.---To assess predation under natural conditions, I surveyed
Appalachian State University’s Gilley Field Station (Watauga County, NC) in May 2016, to
ensure both study species occurred in the area. I then conducted three separate trials, each
with 800 models: 400 P. yonahlossee and 400 P. montanus. I arranged models in a 10 x 10
model grid in 8 30 m2 plots, located throughout the study area. Each plot consisted of 50
models of each species (100 total), spaced at least 0.6 m between each model on all sides.
Plots were separated by at least 100 m. To avoid spurious loss of models, I used black
biodegradable sushi trays filled with leaf litter as foraging units. To avoid bias in model
placement, I flipped a coin or rolled a die to determine which species model to place in each

55
tray. I conducted the first trial June 16, 2016, through June 23, 2016 (8 days), the second
trial July 8, 2016, through July 1l, 2016 (4 days), and the third trial September 13, 2016,
through September 20, 2016 (8 days), and used new models for each trial.
Quantifying predation.---I assessed each model for presence/absence of attacks and assigned
each attack mark to a predator type, including only birds and mammals and disregarding
those marked by invertebrates (many marks resulted from snails). Following the method of
Saporito et al. (2007), I considered multiple marks on a single model as a single predation
attempt. For statistical analysis, I only included avian predation attempts because many of
the models appeared to have been attacked by shrews (Blarina and Sorex sp), and shrews
have poor color vision in longer wavelengths (605-700 nm) (Jacobs and Neitz, 1986),
making it unlikely that they were able to discriminate between the colors of the models.
Over the course of the 3 trials, 152 models were missing (6.8 %). I did not include
missing models in the analysis as there was a storm during the second trial and a tree fell on
one of the plots, making it impossible to recover all models from trials.
Statistical design.---All statistical analyses were performed using SPSS v. 23. To determine
whether salamander model color was a significant predictor of predation, I used a generalized
linear mixed model with a binomial error distribution and binary probit link term. I used
model type as a fixed effect and, to account for the possibility that trial influenced predation
(all trials were not of equal length), I also used trial as a fixed effect. To account for possible
non-independence of samples within the plots, I used plot ID as a random effect. To
qualitatively assess similarity of clay models to live animal coloration, I compared the range

56
of red chroma and brightness measures of all the live animals with the values generated from
the clay models.
RESULTS
Over the course of the 3 trials (2,248 models), 179 were attacked by avian predators (8.0%)
and, of the models attacked by avian predators, 107 (59.8 %) were P. montanus and 72
(40.2%) were P. yonahlossee (Fig. 3). Salamander model color was a significant predictor of
avian predation; grey models were depredated more often compared to red models (F =
7.770, p = 0.005, df = 1, 2244; Fig. 3). Trial was also a significant predictor of avian
predation, predation was lower during the 2nd (and shortest) trial (F = 28.478, p < 0.0001, df
= 2, 2244), however, plot ID was not a significant predictor of avian predation (Z = 1.457, p
= 0.145).
The red chroma of the clay models fell within the range of the red chroma measured
from the live animals for both P. yonahlossee (live model range: 0.23-0.50, clay model: 0.37)
and P. montanus (live model range: 0.09-0.29, clay model: 0.27). However, the clay models
were brighter than the live models (P. yonahlossee (live model range: 0.01-0.11, clay model:
0.20) and P. montanus (live model range: 0.004-0.15, clay model: 0.21).
DISCUSSION
I found that avian predators are more likely to attack uniformly grey models than models
with a large red dorsal patch. These results are consistent with the hypothesis that the red
dorsal patch of P. yonahlossee acts as an aposematic signal to potential predators. The plots
were designed to be analogous to a choice test such that predators would be able to view the

57
two different models simultaneously and choose which to attack. Although the data support
the hypothesis that the red patch is an aposematic signal, because of the lack of available data
on unpalatability in salamanders, it is difficult to determine whether predators avoided
models with the red patch because P. yonahlossee is unpalatable, because predators have an
innate wariness of certain colors, or because P. yonahlossee may be similar in coloration to
an aposematic species (mimicry). Nonetheless, the red coloration is likely interpreted by
predators as a warning signal that deters predation.
It is possible, but untested, that the P. yonahlossee is a mimic of N. viridescens.
Notophthalmus viridescens secretes the neurotoxin tetrodotoxin and occurs sympatrically
with P. yonahlossee throughout P. yonahlossee’s range (Petranka, 1998). During its
intermediate terrestrial stage of development (red eft stage), which can last up to 7 years, N.
viridescens displays a brilliant orange-red color (Mitchell and Gibbons, 2010). Many other
salamanders with red coloration occur sympatrically with N. viridescens, and these
geographical associations have been used as an argument in support of Batesian mimicry of
the toxic species (Brodie, 1977). However, the P. yonahlossee may be unpalable or even
toxic. Some predominantly red species of Plethodontid salamanders, such as Pseudotriton
ruber and Pseudotriton montanus, secrete toxic compounds that can induce death of chickens
and mice (Brandon and Huheey, 1981). Further, Plethodon jordani, which typically has red
patches on its cheeks, has also been found to be unpalatable to some predators in behavioral
trials (Brodie and Howard, 1973; Hensel and Brodie, 1976). Although the toxicity of P.
yonahlossee has yet to be tested, the unpalatability of other plethodontids suggest evidence in
support of signaling warning coloration or Mullerian mimicry.
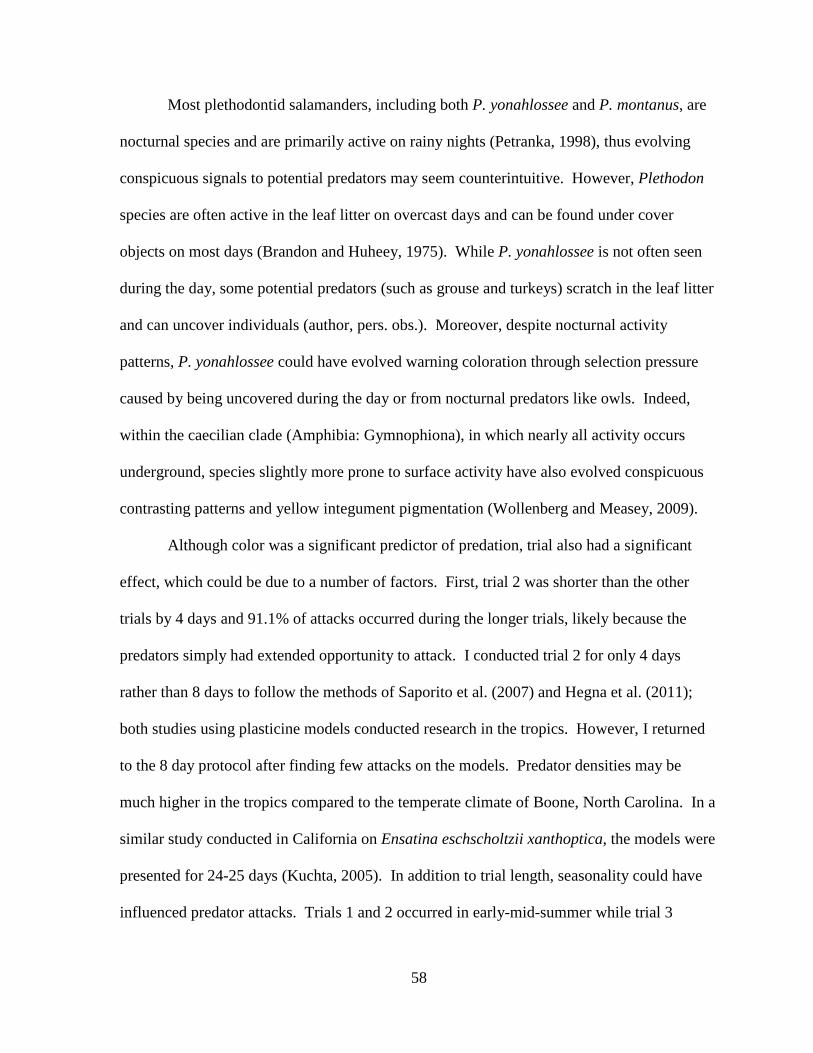
58
Most plethodontid salamanders, including both P. yonahlossee and P. montanus, are
nocturnal species and are primarily active on rainy nights (Petranka, 1998), thus evolving
conspicuous signals to potential predators may seem counterintuitive. However, Plethodon
species are often active in the leaf litter on overcast days and can be found under cover
objects on most days (Brandon and Huheey, 1975). While P. yonahlossee is not often seen
during the day, some potential predators (such as grouse and turkeys) scratch in the leaf litter
and can uncover individuals (author, pers. obs.). Moreover, despite nocturnal activity
patterns, P. yonahlossee could have evolved warning coloration through selection pressure
caused by being uncovered during the day or from nocturnal predators like owls. Indeed,
within the caecilian clade (Amphibia: Gymnophiona), in which nearly all activity occurs
underground, species slightly more prone to surface activity have also evolved conspicuous
contrasting patterns and yellow integument pigmentation (Wollenberg and Measey, 2009).
Although color was a significant predictor of predation, trial also had a significant
effect, which could be due to a number of factors. First, trial 2 was shorter than the other
trials by 4 days and 91.1% of attacks occurred during the longer trials, likely because the
predators simply had extended opportunity to attack. I conducted trial 2 for only 4 days
rather than 8 days to follow the methods of Saporito et al. (2007) and Hegna et al. (2011);
both studies using plasticine models conducted research in the tropics. However, I returned
to the 8 day protocol after finding few attacks on the models. Predator densities may be
much higher in the tropics compared to the temperate climate of Boone, North Carolina. In a
similar study conducted in California on Ensatina eschscholtzii xanthoptica, the models were
presented for 24-25 days (Kuchta, 2005). In addition to trial length, seasonality could have
influenced predator attacks. Trials 1 and 2 occurred in early-mid-summer while trial 3

59
occurred at the very end of summer, and predation rates were higher in trial 3 than trial 1 (95
vs 68 of 163 total). Predation rates may have been higher in late summer because most bird
species change from territorial to non-territorial behavior and thus forage over larger ranges.
The red-orange and grey clay models were good chromatic matches as the red chroma
fell well within the natural range of red chroma of each respective live species. However, for
both species, the clay models were brighter (expressed greater achromatic coloration)
compared to the live animals. My goal was to match the chromatic variation as the color of
two species differ mainly in chroma (spectral shape) rather than brightness (achromatic color
aspects measured as overall area under the curve). Moreover, because the clay models of
both species were brighter (~15% brighter) than their live counterparts, and because the
experimental design was set up as a choice test, I think it unlikely that greater brightness of
the clay models influenced predator choice. To my knowledge, this is one of the first studies
to compare reflectance spectra of models and live animals across all wavelengths visible to
birds (300 to 700nm).
These data suggest that avian predators avoid the conspicuously colored model
salamanders and, while the results of the experiment do not rule out the possibility of
mimicry, no studies have rigorously tested whether P. yonahlossee is a mimic of
Notophthalmus viridescens. Further, Plethodon species have large granular glands in their
integument and future research should focus on identification and quantification of
potentially noxious compounds derived from Plethodon integument.
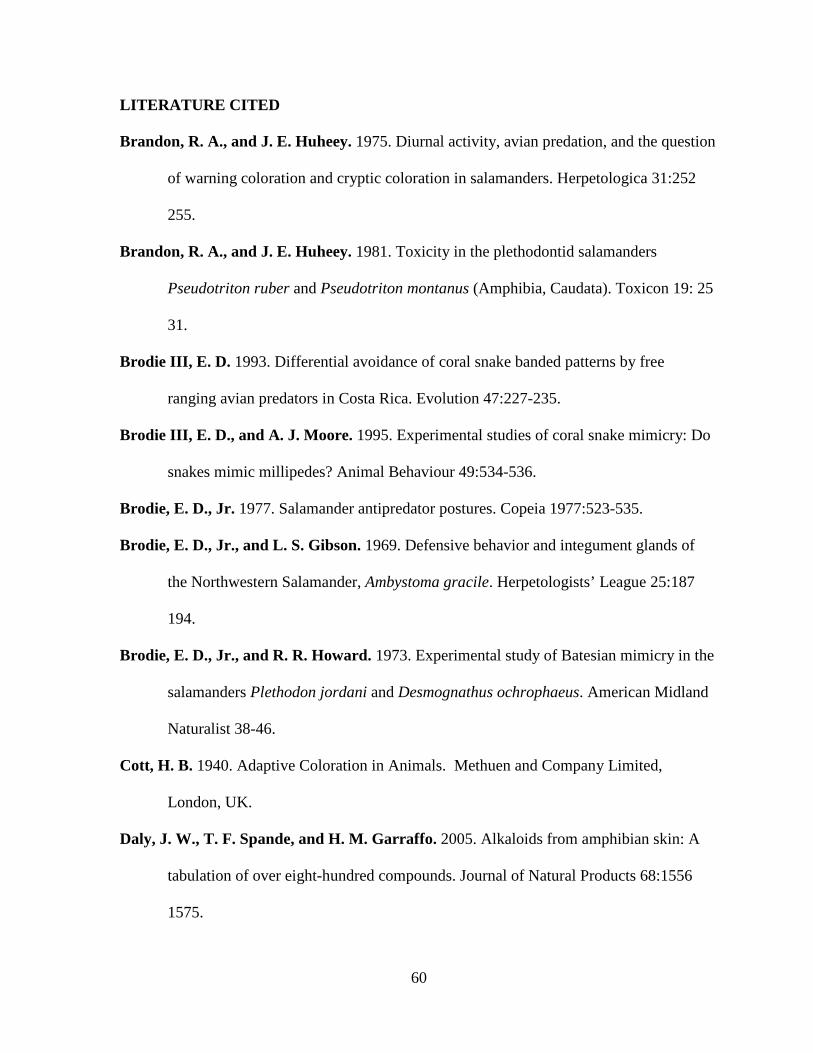
60
LITERATURE CITED
Brandon, R. A., and J. E. Huheey. 1975. Diurnal activity, avian predation, and the question
of warning coloration and cryptic coloration in salamanders. Herpetologica 31:252
255.
Brandon, R. A., and J. E. Huheey. 1981. Toxicity in the plethodontid salamanders
Pseudotriton ruber and Pseudotriton montanus (Amphibia, Caudata). Toxicon 19: 25
31.
Brodie III, E. D. 1993. Differential avoidance of coral snake banded patterns by free
ranging avian predators in Costa Rica. Evolution 47:227-235.
Brodie III, E. D., and A. J. Moore. 1995. Experimental studies of coral snake mimicry: Do
snakes mimic millipedes? Animal Behaviour 49:534-536.
Brodie, E. D., Jr. 1977. Salamander antipredator postures. Copeia 1977:523-535.
Brodie, E. D., Jr., and L. S. Gibson. 1969. Defensive behavior and integument glands of
the Northwestern Salamander, Ambystoma gracile. Herpetologists’ League 25:187
194.
Brodie, E. D., Jr., and R. R. Howard. 1973. Experimental study of Batesian mimicry in the
salamanders Plethodon jordani and Desmognathus ochrophaeus. American Midland
Naturalist 38-46.
Cott, H. B. 1940. Adaptive Coloration in Animals. Methuen and Company Limited,
London, UK.
Daly, J. W., T. F. Spande, and H. M. Garraffo. 2005. Alkaloids from amphibian skin: A
tabulation of over eight-hundred compounds. Journal of Natural Products 68:1556
1575.

61
Dawkins, M. S., and T. Guilford. 1991. The corruption of honest signaling. Animal
Behaviour 41:865-863.
Dodd Jr., K. C., J. A. Johnson, and E. D. Brodie Jr. 1974. Noxious integument secretions
of an eastern small Plethodon, P. nettingi hubrichti. Journal of Herpetology 8:89-92.
Hegna, R. H., R. A. Saporito, K. G. Gerow, and M. A. Donnelly. 2011. Contrasting colors
of an aposematic poison frog do not affect predation. Annales Zoologici Fennici
48:29-38.
Hensel, J. L., Jr., and E. D. Brodie Jr. 1976. An experimental study of aposematic
coloration in the salamander Plethodon jordani. Copeia 1:59-65.
Jacobs, G. H., and J. Neitz. 1986. Spectral mechanisms and color vision in the tree shrew
(Tupaia belangeri). Vision Research 26;291-298.
Kuchta, S. R. 2005. Experimental support for aposematic coloration in the salamander
Ensatina escholtzii xanthoptica; implications for mimicry of Pacific newts. Copeia
2005:265-271.
Mappes, J., N. Marples, and J. A. Endler. 2005. The complex business of survival by
aposematism. Trends in Ecology and Evolution 20:598-603.
Mebs, D., and W. Pogoda. 2005. Variability of alkaloids in the skin secretion of the
European fire salamander (Salamandra salamadra terrestris). Toxicon 45:603-606.
Mitchell, J. C., and J. W. Gibbons. 2010. Salamanders of the Southeast. University of
Georgia Press, Athens, Georgia.
Montgomerie, R. 2008. CLR, version 1.05. Queen’s University, Kingston, Canada.
Owren, M. J., D. Rendall, and M. J. Ryan. 2010. Redefining animal signaling: influence
versus information in communication. Biology and Philosophy 25:755-780.

62
Petranka, J. W. 1998. Salamanders of the United States and Canada. Smithsonian
Institution Press, Washington D.C.
Saporito, R. A., R. Zuercher, M. Roberts, K. G. Gerow, and M. A. Donnelly. 2007.
Experimental evidence for aposematism in the Dendrobatid poison frog Oophaga
pumilio. Copeia 2007:1006-1011.
Siddiqi, A., T. W. Cronin, E. R. Loew, M. Vorobyev, and K. Summers. 2004.
Interspecific and intraspecific views of color signals in the strawberry poison frog
Dendrobates pumilio. Journal of Experimental Biology 207:2471-2485.
Smith, S. M. 1975. Innate recognition of coral snake pattern by a possible avian predator.
Science 187:759-760.
Steffen, J. E., and K. J. McGraw. 2007. Contributions of pterin and carotenoid pigments to
dewlap coloration in two anole species. Comparative Biochemistry and Physiology
Part B: Biochemistry and Molecular Biology 146: 42-46.
Summers, K., M. P. Speed, J. D. Blount, and A. M. M. Stuckert. 2015. Are aposematic
signals honest? A review. Journal of Evolutionary Biology 28:1583-1599.
Toledo, R. C., and C. Jared. 1995. Cutaneous granular glands and amphibian venoms.
Comparative Biochemistry and Physiology 111:1-29.
Wakely, J. F., G. J. Fuhrman, F. A. Fuhrman, H. G. Fischer, and H. S. Mosher. 1966.
The occurrence of tetrodotoxin (tarichatoxin) in Amphibia and the distribution of the
toxin in the organs of newts (Taricha). Toxicon 3:195-203.
Wollenberg, K. C., and G. J. Measey. 2009. Why colour in subterranean vertebrates?
Exploring the evolution of colour patterns in caecilian amphibians. Journal of
Evolutionary Biology 22:1046-1056.

63
FIGURES
Figure 1. Images of salamander models. Top: Plethodon montanus Bottom: Plethodon
yonahlossee.

64
Figure 2. Reflectance spectra of clay color vs two live salamanders of each species (the
most and least bright individuals).

65
Figure 3. Total number of avian predation attempts on gray and red salamander models.

66
CHAPTER 4
An investigation of correlated evolution of conspicuous coloration and body size in two
salamander genera: Ambystoma and Plethodon
ABSTRACT
Conspicuous coloration coupled with secondary defensive mechanisms is known as
aposematic coloration and is used in predator avoidance and defense. Aposematic signals
tend to be more effective in larger organisms as they are intrinsically more easily detected by
predators and are also more profitable prey items. Therefore, it is hypothesized that
conspicuous coloration evolves in tandem with increased body size in aposematic prey. This
study uses a comparative phylogenetic approach to investigate associations between body
size and conspicuous coloration in two North American salamander genera: Ambystoma and
Plethodon. Results of the analysis show that increased conspicuous coloration co-evolved
with increased body size in Ambystoma, but that evolution in Plethodon salamanders has
favored a negative relationship between these two traits. This is likely because Ambystoma
are more likely to benefit from an aposematic signal; Ambystoma are generally larger than
Plethodon, exhibit gregarious behavior, and are thought to be toxic to some predators;
Plethodon are smaller, exhibit no gregarious behavior and are only thought to be noxious to
some predators. Proposed explanations for the loss of conspicuous coloration with increased
body size in Plethodon are alternative uses of color, such as mimicry or thermoregulation.

67
INTRODUCTION
Animals use a variety of visual signals to convey information to one another, including
conspicuous coloration (Wallace, 1867). When conspicuous coloration is coupled with a
secondary defense, such as venom or poison, coloration is thought to serve as a signal of
unpalatability to potential predators via aposematic signaling (Bates, 1862). Cott (1940)
suggested that most often aposematic signals involve red, yellow, or white patterns on a
black background, likely because they are easily detected, recalled, and associated with the
defense by predators (Gittleman and Harvey, 1980). It is also hypothesized that larger
animals are more likely to evolve conspicuous coloration compared to smaller animals for
several reasons. First, larger animals are intrinsically more obvious to predators than smaller
animals and are therefore more likely to evolve secondary defensive mechanisms (Hossie et
al., 2015), and are less likely to benefit from cryptic coloration (Hagman and Forsman,
2003). Second, because smaller animals are less easily detected, they are less likely to
benefit from conspicuous coloration (Hossie et al., 2015). Third, larger prey items are
expected to be more profitable than smaller prey items, increasing selection pressure for
defensive mechanisms (Penney et al., 2012). Indeed, experimental evidence from a study
examining the responses of naïve domestic chicks (Gallus gallus domesticus) to varying sizes
of conspicuously colored prey items (Tropidothorax leucopterus) suggests that the efficacy
of an aposematic signal increases with increasing body size (Gamberale and Tullberg,
1996a).
There is conflicting evidence in the literature, however, as to whether conspicuous
coloration coevolves with increased body size across taxa that employ antipredator
coloration. In the caterpillar subfamily Macroglossinae, a phylogenetically controlled

68
analysis found that conspicuous eye-like markings (eyespots), which are thought to deter
predation, are associated with larger body size (Hossie et al., 2015). Using a comparative
approach, Hagman and Forsman (2003) found that increased conspicuousness also evolved in
tandem with increased body size in poison dart frogs (Dendrobatidae); these findings are
supported in an alternative study focusing on one species of poison frog, Oophaga pumilio,
or the Strawberry Poison frog (Rudh, 2013). This species shows remarkable phenotypic
diversity throughout its range, and more conspicuous populations also have a larger mean
body size, and the phylogenetic relationships suggest that a loss of conspicuous coloration
co-evolved with a decrease in body size in several populations (Rudh, 2013). Similarly, a
phylogenetic investigation of camouflage morphology in the crab superfamily Majoidea
demonstrates that decreased camouflage decoration behavior is associated with an increase in
body size as well as an increase in alternative defensive strategies such as color change
(Hultgren and Stachowicz, 2009). All the aforementioned studies support the hypothesis that
conspicuous coloration is positively associated with body size. However, the opposite
pattern occurs in nudibranchs, with conspicuous coloration decreasing with increasing body
size (Cheney et al., 2014), despite the presence of secondary chemical defenses (indicating
their color is used as an aposematic signal). Finally, in lepidopteran larvae there is no
apparent relationship between body size and conspicuousness (Nilsson and Forsman, 2003).
In addition to body size, experimental evidence also suggests that the efficacy of an
aposematic signal increases with the size of the conspicuous body pattern (see Gamberale
and Tullberg, 1996b), and that avian predators (Parus major) are better able to discriminate
between palatable and unpalatable prey when the pattern elements are larger (Lindstrom et
al., 1999). Behavioral traits are also expected to influence the efficacy of aposematic signals;

69
efficacy of aposematic signals should be positively associated with group size because there
is greater initial unconditioned aversion by predators (Gamberale and Tullberg 1996b; 1998)
and because predators will learn more quickly to avoid unpalatable and conspicuous prey
(Gagliardo and Guilford, 1993). Finally, conspicuous behavior may both increase the
likelihood that the signal is detected and potentially help protect the prey by increasing the
likelihood of engaging the predator with any defensive compounds (Brodie, 1977; Toledo
and Jared, 1995). For example, the tail is where many of the granular (defensive secretion)
glands are located in salamanders (Toledo and Jared, 1995), and when threatened, most
salamanders will position their bodies so that the tail is closest to the threatening stimuli (e.g.
Brodie and Gibson, 1969).
Here, I use a comparative approach to investigate relationships between conspicuous
coloration and body size in two genera of North American salamanders: Plethodon (family
Plethodontidae) and Ambystoma (family Ambystomatidae). Ambystoma and Plethodon
present an interesting contrast for this type of comparative study: Ambystoma salamanders
are generally larger than Plethodon salamanders and nearly all Ambystoma species undertake
annual breeding migrations, whereas no Plethodons are known to exhibit any type of
gregarious behavior (Petranka, 1998). Species within both genera display a diversity of color
patterns and body sizes (Petranka, 1998) and their integument secretions are unpalatable to
some predators (Brodie, 1977).
Behavioral studies of Ambystoma species demonstrate that most species display
defensive posture when confronted by predators (mammalian, avian, and reptile predators)
(Brodie and Gibson, 1969; Brodie, 1977; Williams and Larsen, 1986). This defensive
posture involves orienting the body such that the predator is exposed to the granular glands in

70
the parotid region and tail ridge. Researchers described the secretions from the granular
glands as being insoluble in water, ethyl alcohol, and acetone, and fatal when injected into
mice, voles, and rats (Brodie and Gibson, 1969). Plethodon species also exhibit defensive
postures, and the genus is generally described as “noxious” (Brodie, 1977). Some species,
such as Plethodon jordani, have been hypothesized to display aposematic coloration based
on feeding trials with avian predators (Hensel and Brodie, 1976), although most species with
red coloration are thought to mimic Notophthalmus viridescens (Brodie and Brodie, 1980).
However, to date, there are no published chemical analyses exploring the chemical
composition of integument secretions in any amphibian family except Salamandridae, and
very little research has focused on potential aposematic coloration in salamanders.
In addition to interesting similarities and differences between the Ambystoma and
Plethodon genera, there are also recent phylogenies available for each genus which allow for
the distinction of associations among traits that are caused by selection versus phylogenetic
inertia, a necessity for analysis of evolutionary change (Felsenstein, 1985). The aim of this
study is to use hypothesized evolutionary relationships in a comparative analysis of
independent contrasts to investigate associations between the evolution of body size and
conspicuousness in the Ambystoma and Plethodon genera. I predict that larger-bodied
species will have more conspicuous coloration. I expect the positive trends between body
size and conspicuousness to be more pronounced in the Ambystoma genus for three reasons:
1) Ambystoma are larger than Plethodon, 2) there is more empirical support for toxicity in
Ambystoma than Plethodon, and 3) because Ambystoma aggregate during breeding while
Plethodon are solitary year round.
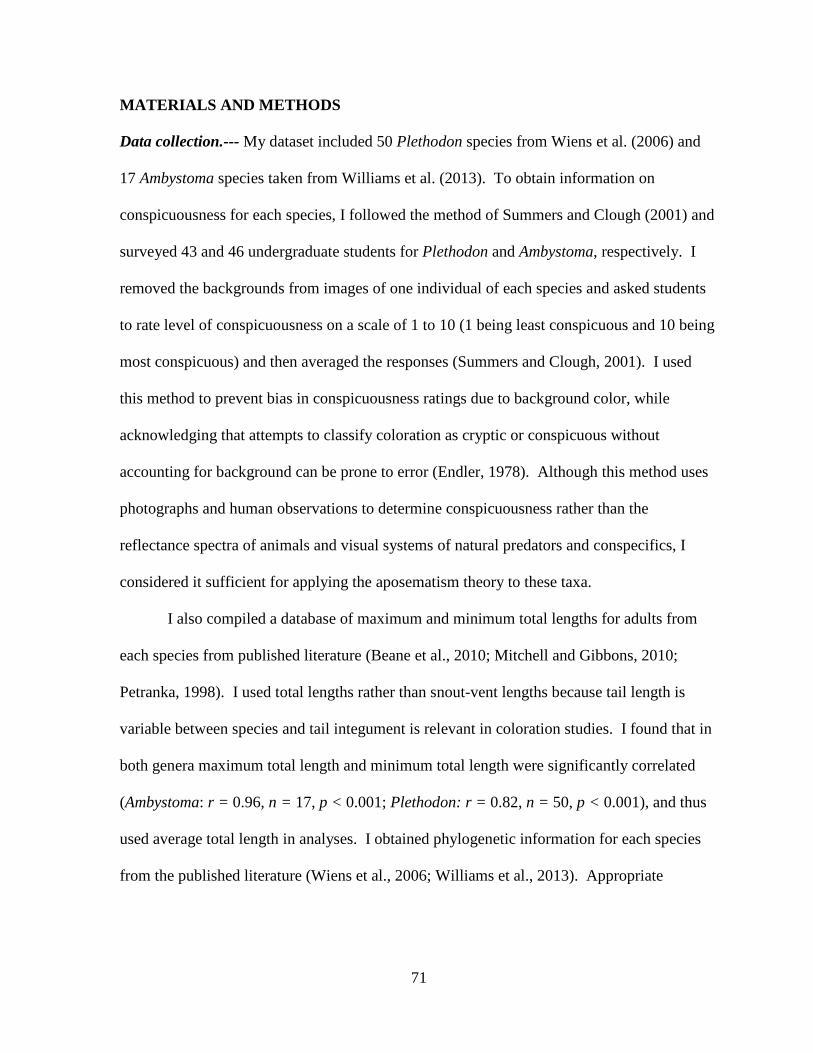
71
MATERIALS AND METHODS
Data collection.--- My dataset included 50 Plethodon species from Wiens et al. (2006) and
17 Ambystoma species taken from Williams et al. (2013). To obtain information on
conspicuousness for each species, I followed the method of Summers and Clough (2001) and
surveyed 43 and 46 undergraduate students for Plethodon and Ambystoma, respectively. I
removed the backgrounds from images of one individual of each species and asked students
to rate level of conspicuousness on a scale of 1 to 10 (1 being least conspicuous and 10 being
most conspicuous) and then averaged the responses (Summers and Clough, 2001). I used
this method to prevent bias in conspicuousness ratings due to background color, while
acknowledging that attempts to classify coloration as cryptic or conspicuous without
accounting for background can be prone to error (Endler, 1978). Although this method uses
photographs and human observations to determine conspicuousness rather than the
reflectance spectra of animals and visual systems of natural predators and conspecifics, I
considered it sufficient for applying the aposematism theory to these taxa.
I also compiled a database of maximum and minimum total lengths for adults from
each species from published literature (Beane et al., 2010; Mitchell and Gibbons, 2010;
Petranka, 1998). I used total lengths rather than snout-vent lengths because tail length is
variable between species and tail integument is relevant in coloration studies. I found that in
both genera maximum total length and minimum total length were significantly correlated
(Ambystoma: r = 0.96, n = 17, p < 0.001; Plethodon: r = 0.82, n = 50, p < 0.001), and thus
used average total length in analyses. I obtained phylogenetic information for each species
from the published literature (Wiens et al., 2006; Williams et al., 2013). Appropriate

72
phylogenetic trees were available for each genus (Ambystoma: Williams et al., 2013;
Plethodon: Wiens et al., 2006).
Statistical analysis.---To investigate general relationships between body size and
conspicuousness, I compared the average total length of each species with the average
observer response. First, I treated each species as an independent data point and used
Pearson and Spearman correlations (SigmaPlot 12.5). Then, because closely related taxa
cannot be considered independent because of shared ancestry, I calculated independent
contrasts (Felsenstein, 1985) using the computer software Mesquite (Maddison and
Maddison, 2011), with the PDAP module (Phenotypic Diversity Analysis Programs, Garland
et al., 1992). For Ambystoma species, I used a gradual model of character evolution and
obtained branch length information Williams et al. (2013), which was based on the number
of substitutions per site in mitochondrial DNA sequences. For Plethodon species, I also used
a gradual model of character evolution and obtained branch length information from Wiens
et al. (2006), which was based on the number of substitutions per site in both nuclear and
mitochondrial DNA sequences. To ensure that the data met the statistical assumptions that
body size and coloration evolution are related to phylogenetic data, I then regressed contrasts
for conspicuousness on contrasts for body size through the origin for both species and found
that the slope did not differ significantly from zero (Harvey and Pagel 1991; Garland et al.,
1992; Pagel 1993).

73
RESULTS
A Mann-Whitney Rank Sum Test shows that Ambystoma salamanders are larger than
Plethodon salamanders (Mann-Whitney U statistic = 315, T = 774, n(Ambystoma) = 17,
n(Plethodon) = 50, p = 0.049; Table 1).
Ambystoma.---Pearson correlations revealed no significant relationship between average
total length and conspicuousness (r = 0.36, n = 17, p = 0.16). However, regressions of
independent contrasts showed that conspicuousness was positively and significantly
correlated to average total length (R2 = 0.75, n = 17, p < 0.001) (Fig. 1). As this analysis
used independent contrasts, it is likely that these correlations are not simply the result of
phylogenetic inertia. A side-by-side comparison of phylogenies colored to indicate character
differences between species and ancestral states provides a visual representation of the
relationships parsed by independent contrast analysis (Fig. 2).
Plethodon.---Spearman correlations show that average total length and conspicuousness are
negatively correlated (r = -0.36, n = 50, p = 0.01). When I regressed the independent
contrasts, conspicuousness was still negatively correlated with average total length (R2 =
0.14, n = 50, p = 0.01) (Fig. 3). Because the significant relationship between average total
length and conspicuousness is still present when independent contrasts are used, it is likely
the association is not only influenced by common ancestry. A side-by-side comparison of
phylogenies colored to indicate character differences between species and ancestral states
provides a visual representation of the relationships parsed by independent contrast analysis
(Fig. 4).

74
DISCUSSION
The results for Ambystoma salamanders are consistent with the hypothesis that
conspicuousness is associated with body size and the prediction that larger species are more
conspicuous than smaller species within a genus. Moreover, in this group, the phylogeny
suggests relatively recent evolution of conspicuousness in some species (Fig. 2), suggesting
that ecological selection pressures have favored the co-evolution of larger body size and
more conspicuous coloration. The initial non-significant associations between body size and
color found in Ambystoma using the Pearson correlations are likely the result of a small
sample size and weaker relationships, which became stronger when independent contrasts
were used in lieu of raw data. The results for Plethodon salamanders, however, are not
consistent with the prediction; smaller animals tend to be more conspicuous. The phylogeny
suggests that the ancestral Plethodon state is more conspicuous and smaller in body size than
current taxa (Fig. 4), suggesting that evolution has favored increasing body size but not
conspicuousness. Although initially these results suggest equivocal support for the
hypothesis of coevolution between body size and conspicuousness in salamanders,
differences between the genera may explain these discrepancies.
The evolution of conspicuous coloration can be influenced by several factors
including unprofitability, kin selection, sexual selection, and mimicry of unprofitable
organisms (Rudh and Qvarnstrom, 2013). For coloration to be considered aposematic it must
convey information of unpalatability to potential predators, and it is expected that
conspicuousness should be positively correlated with unprofitability (Summers and Clough,
2001). There is evidence to suggest that both Ambystoma and Plethodon are unpalatable to
certain predators, as well as exhibit behavior consistent with possession of noxious

75
integument secretions (Brodie, 1977). The available evidence in the literature, however,
suggests that Ambystoma may be less profitable prey than Plethodon. Ambystoma are known
to produce integument secretions which have strong adhesive properties (Evans and Brodie,
1994), neurotoxic components (Hamning et al., 2000), and are lethal to animals such as mice
and voles (Brodie and Gibson, 1969). Plethodon species are typically avoided in feeding
trials (Hensel and Brodie, 1976; Brodie et al., 1979), but their integument secretions have not
been shown to be lethal to any potential predators. Therefore, Ambystoma may be
unpalatable enough for evolution to have favored an increase in conspicuousness even as
conspicuousness was lost in Plethodon. More comprehensive information on unpalatability
would be needed to further address this possibility.
Within the genus Plethodon, the negative trend between conspicuousness and body
size appears to be driven by a group of morphologically similar and closely related species
that consistently received low conspicuousness ratings and are among the largest species in
the genus. Phylogenetic studies of Plethodon have found that the genus underwent a rapid
diversification event roughly 5 million years ago (Highton, 1995; Wiens et al., 2006); several
lineages are currently incompletely isolated and are introgressively hybridizing, most notably
the glutinosus group. The glutinosus group encompasses over half of the currently
recognized species (Wiens et al., 2006), are among the largest Plethodons, received some of
the lowest conspicuousness ratings (Table 1), and until recently were considered geographic
variants of only two species (P. glutinosus and P. jordani) based on morphology (Petranka,
1998). Interestingly, P. glutinosus is considered one of the more unpalatable species in
Plethodon based on behavioral trials with shrews (Brodie et al., 1979), and yet is relatively
inconspicuous compared to other species in the genus. Perhaps unpalatability in this group is

76
not sufficient to warrant conspicuous coloration as a signal and therefore conspicuousness
has decreased as other selection pressures have favored an increase in body size. More data
on the ancestral state of toxicity is needed for further investigation of this hypothesis, but this
information is currently unavailable in existing literature.
Ambystoma and Plethodon salamanders have important lifestyle differences;
Ambystoma species are largely fossorial with aquatic larvae and a few (A. mexicanum, A.
ordinarium, and A. dumerilii (a data deficient species excluded from analyses)) are fully
aquatic (Petranka, 1998). Terrestrial species of Ambystoma are largely fossorial, but
explosive annual breeding migrations occur in almost all terrestrial species such that large
numbers of individuals aggregate out above ground at least once per year (Petranka, 1998).
One exception is the inconspicuously colored A. barbouri, a streamside species that does not
travel long distances to breed. Gregarious behavior is thought to amplify aposematic signals,
as large numbers of organisms gathered in one place increases the likelihood of being seen
and encountered by predators (Poulton, 1890). Models of the evolution of aposematic
coloration and gregariousness suggest that they should evolve in tandem in insects (Sillen-
Tullberg, 1988), and indeed gregarious behavior evolved with both chemical defenses and
warning coloration in Macrolepidopteran larvae (Tullberg and Hunter, 1996), but
comparative studies of gregariousness and conspicuousness are thus far limited to insects.
Plethodon species are solitary and terrestrial throughout their life cycle and tend to occur in
high densities. Most are active on warm rainy nights, as well as under leaf litter and cover
objects during the day (Brandon and Huheey, 1975; Petranka, 1998). Though they are rarely
seen on the surface during the day, some potential predators (such as grouse and turkeys)
scratch in the leaf litter and can uncover individuals (author, pers. obs.). Moreover, despite
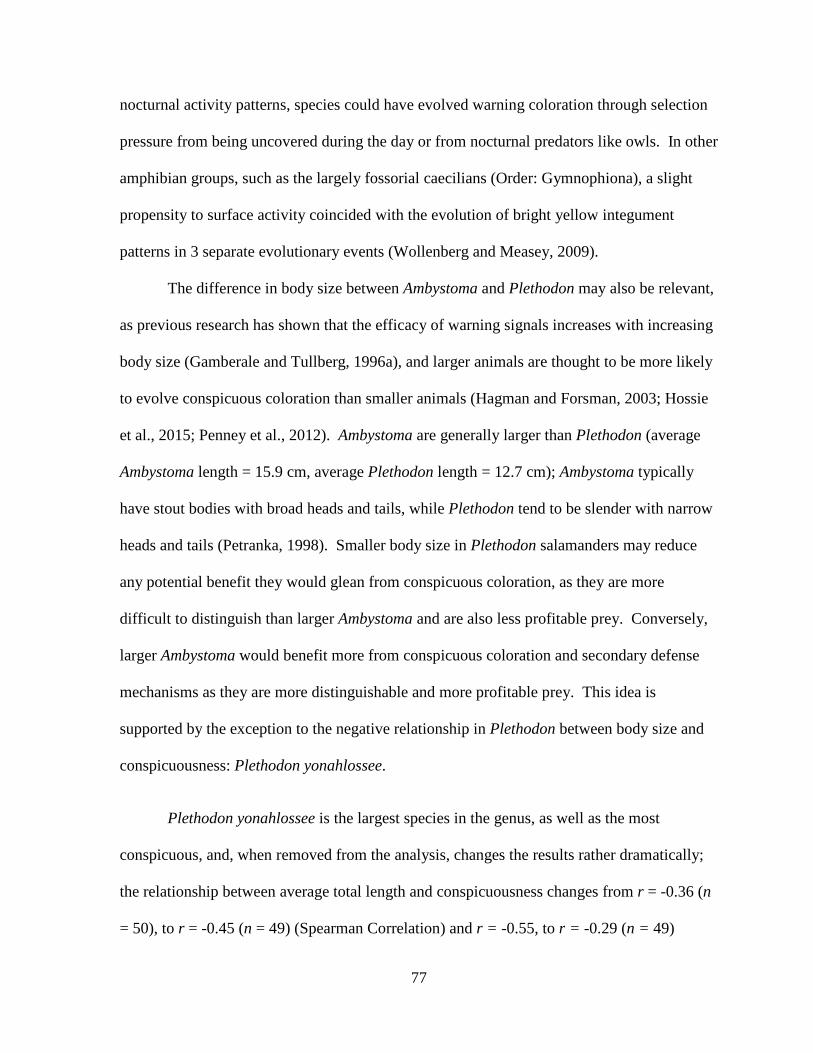
77
nocturnal activity patterns, species could have evolved warning coloration through selection
pressure from being uncovered during the day or from nocturnal predators like owls. In other
amphibian groups, such as the largely fossorial caecilians (Order: Gymnophiona), a slight
propensity to surface activity coincided with the evolution of bright yellow integument
patterns in 3 separate evolutionary events (Wollenberg and Measey, 2009).
The difference in body size between Ambystoma and Plethodon may also be relevant,
as previous research has shown that the efficacy of warning signals increases with increasing
body size (Gamberale and Tullberg, 1996a), and larger animals are thought to be more likely
to evolve conspicuous coloration than smaller animals (Hagman and Forsman, 2003; Hossie
et al., 2015; Penney et al., 2012). Ambystoma are generally larger than Plethodon (average
Ambystoma length = 15.9 cm, average Plethodon length = 12.7 cm); Ambystoma typically
have stout bodies with broad heads and tails, while Plethodon tend to be slender with narrow
heads and tails (Petranka, 1998). Smaller body size in Plethodon salamanders may reduce
any potential benefit they would glean from conspicuous coloration, as they are more
difficult to distinguish than larger Ambystoma and are also less profitable prey. Conversely,
larger Ambystoma would benefit more from conspicuous coloration and secondary defense
mechanisms as they are more distinguishable and more profitable prey. This idea is
supported by the exception to the negative relationship in Plethodon between body size and
conspicuousness: Plethodon yonahlossee.
Plethodon yonahlossee is the largest species in the genus, as well as the most
conspicuous, and, when removed from the analysis, changes the results rather dramatically;
the relationship between average total length and conspicuousness changes from r = -0.36 (n
= 50), to r = -0.45 (n = 49) (Spearman Correlation) and r = -0.55, to r = -0.29 (n = 49)

78
(Independent contrasts). Furthermore, recent experimental evidence supports the hypothesis
that predators avoid the red coloration of P. yonahlossee. Clay models of P. yonahlossee are
depredated by avian predators at a lower rate than P. montanus salamanders and P. montanus
are much duller than the conspicuous P. yonahlossee (Chapter 3, p. 55). Within a P.
yonahlossee population, larger individuals also display greater red coloration (Chapter 2, p.
22), suggesting some potential benefit of conspicuousness in larger individuals. Such
positive associations between conspicuousness (yellow pigmentation) and body size are also
present in populations of the poison frog species Phyllobates terribilis and P. bicolor
(Zimmerman, 1986; Walls, 1994). These within-population relationships suggest
ontogenetic shifts toward increased conspicuousness and body size, which corroborates the
hypothesis that larger animals may benefit more from being highly conspicuous (Hagman
and Forsman, 2003). Though the data show that selection in Plethodon currently favors large
body size and inconspicuous coloration, P. yonahlossee has either not undergone the same
selection pressures as other Plethodon species, is large enough to benefit from conspicuous
coloration, or has acquired/maintained a defense mechanism that warrants conspicuous
coloration. Because P. yonahlossee occurs sympatrically with several other inconspicuous
species in the glutinous group (and shares many of the same habitat preferences and potential
predators), it seems unlikely that differences in ecological selection pressures are driving its
coloration, indicating that some combination of the latter two hypotheses is a more likely
scenario.
There are possible alternative functions of aposematism to explain coloration in
Plethodon; the most often explored hypothesis is mimicry. Plethodon salamanders occur
exclusively in North America and a large portion of their range overlaps with that of the
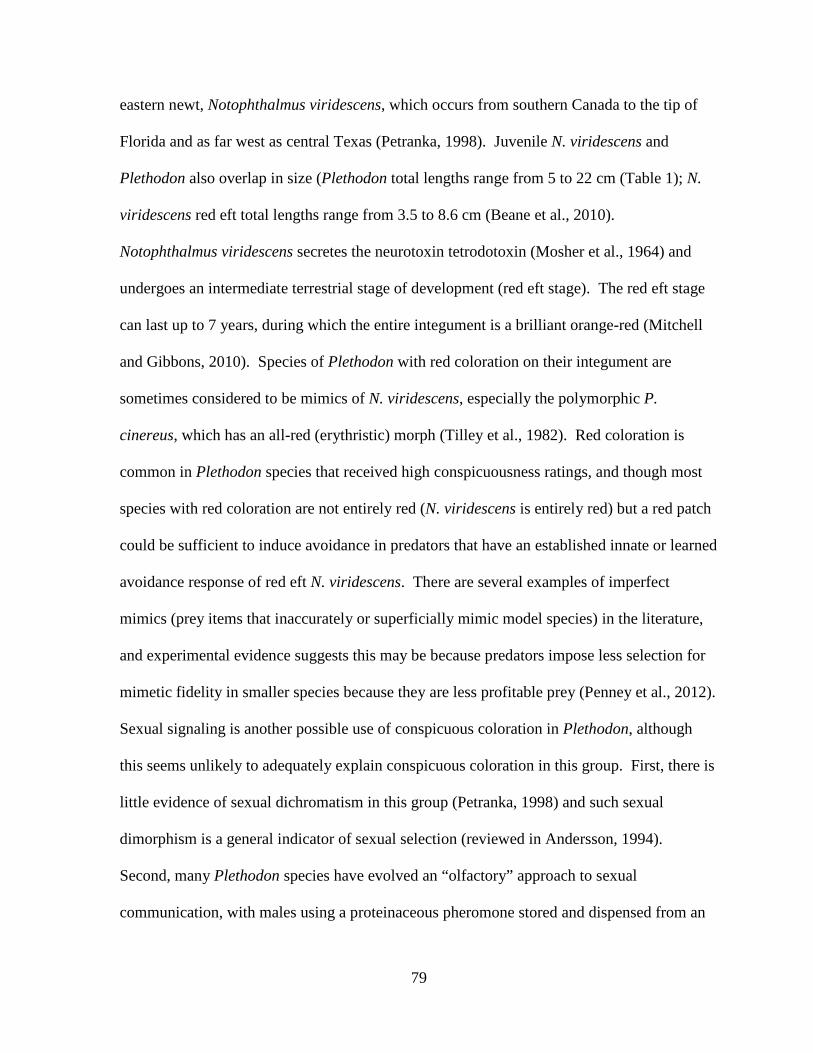
79
eastern newt, Notophthalmus viridescens, which occurs from southern Canada to the tip of
Florida and as far west as central Texas (Petranka, 1998). Juvenile N. viridescens and
Plethodon also overlap in size (Plethodon total lengths range from 5 to 22 cm (Table 1); N.
viridescens red eft total lengths range from 3.5 to 8.6 cm (Beane et al., 2010).
Notophthalmus viridescens secretes the neurotoxin tetrodotoxin (Mosher et al., 1964) and
undergoes an intermediate terrestrial stage of development (red eft stage). The red eft stage
can last up to 7 years, during which the entire integument is a brilliant orange-red (Mitchell
and Gibbons, 2010). Species of Plethodon with red coloration on their integument are
sometimes considered to be mimics of N. viridescens, especially the polymorphic P.
cinereus, which has an all-red (erythristic) morph (Tilley et al., 1982). Red coloration is
common in Plethodon species that received high conspicuousness ratings, and though most
species with red coloration are not entirely red (N. viridescens is entirely red) but a red patch
could be sufficient to induce avoidance in predators that have an established innate or learned
avoidance response of red eft N. viridescens. There are several examples of imperfect
mimics (prey items that inaccurately or superficially mimic model species) in the literature,
and experimental evidence suggests this may be because predators impose less selection for
mimetic fidelity in smaller species because they are less profitable prey (Penney et al., 2012).
Sexual signaling is another possible use of conspicuous coloration in Plethodon, although
this seems unlikely to adequately explain conspicuous coloration in this group. First, there is
little evidence of sexual dichromatism in this group (Petranka, 1998) and such sexual
dimorphism is a general indicator of sexual selection (reviewed in Andersson, 1994).
Second, many Plethodon species have evolved an “olfactory” approach to sexual
communication, with males using a proteinaceous pheromone stored and dispensed from an

80
enlarged mental gland to increase female receptivity during courtship (Palmer et al., 2005).
Further, there may be physiological selection pressure for darker (less conspicuous)
coloration in amphibians. Melanin pigmentation gives the body a darker color and aids in
thermoregulation and UV protection (Rudh and Qvarnstrom, 2013). Perhaps evolution
favored the loss of conspicuousness in larger bodied Plethodon species via physiological
pressures to increase melanin content in the integument.
The data in this comparative study show that increased body size and increased
conspicuous coloration have evolved in tandem in Ambystoma salamanders, while increased
body size has co-evolved with a loss of conspicuous coloration in Plethodon species.
Differences between the genera help explain these trends; Ambystoma are larger, presumably
more noxious, and exhibit gregarious behavior during annual breeding migrations.
Plethodon are smaller, with evidence indicating they are less noxious than Ambystoma, are
not known to exhibit gregarious behavior, and several species could potential be imperfect
mimics of the toxic N. viridescens. More information on toxicity in each genera will increase
understanding of antipredator defense mechanisms as well as the signal function of
conspicuous coloration.
LITERATURE CITED
Andersson, M. B. 1994. Sexual Selection. Princeton University Press, Princeton, New
Jersey.
Bates, H. W. 1862. XXXII. Contributions to an insect fauna of the Amazon valley.
Lepidoptera: Heliconidae. Transactions of the Linnean Society of London 23:495-
566.

81
Beane, J. C., A. L. Braswell, J. C. Mitchell, and W. M. Palmer. 2010. Amphibians and
Reptiles of the Carolinas and Virginia. University of North Carolina Press, Chapel
Hill, North Carolina.
Brandon, R. A., and J. E. Huheey. 1975. Diurnal activity, avian predation, and the question
of warning coloration and cryptic coloration in salamanders. Herpetologica 252-255.
Brodie, E. D., Jr. 1977. Salamander antipredator postures. Copeia 1977:523-535.
Brodie, E. D., Jr., and E. D. Brodie. 1980. Differential avoidance of mimetic salamanders
by free ranging birds. American Association for the Advancement of Science
208:181-182.
Brodie, E. D., Jr., and L. S. Gibson. 1969. Defensive behavior and integument glands of
the Northwestern Salamander, Ambystoma gracile. Herpetologists’ League 25:187
194.
Brodie, E. D., Jr., R. T. Nowak, and W. R. Harvey. 1979. The effectiveness of
antipredator secretions and behavior of selected salamanders against shrews. Copeia
1979:270-274.
Cheney, K. L., F. Cortesi, M. J. How, N. G. Wilson, S. P. Blomberg, A. E. Winters, S.
Umanzor, and N. J. Marshall. 2014. Conspicuous visual signals do not coevolve
with increased body size in marine sea slugs. Journal of Evolutionary Biology
27:676-687.
Cott, H. B. 1940. Adaptive Coloration in Animals. Methuen and Company Limited,
London, UK.
Evans, C. M., and E. D. Brodie Jr. 1994. Adhesive strength of amphibian skin secretions.
Journal of Herpetology 28:499-502.
82
Endler, J. A. 1978. A predator’s view of animal color patterns. Evolutionary Biology
11:319–364.
Felsenstein, J. 1985. Phylogenies and the comparative method. The American Naturalist
125:1-15.
Gagliardo, A., and T. Guilford. 1993. Why do warning-colored prey live gregariously?
Proceedings of the Royal Society of London B: Biological Sciences 251:69-74.
Gamberale, G., and B. S. Tullberg. 1996a. Evidence for a peak-shift in predator
generalization among aposematic prey. Proceedings of the Royal Society of London
B: Biological Sciences 263:1329–1334.
Gamberale, G., and B. S. Tullberg. 1996b. Evidence for a more effective signal in
aggregated aposematic prey. Animal Behaviour 52:597-601.
Gamberale, G., and B. S. Tullberg. 1998. Aposematism and gregariousness: the combined
effect of group size and coloration on signal repellence. Proceedings of the Royal
Society of London B: Biological Sciences 265:889-894.
Garland, T., P. H. Harvey, and A. R. Ives. 1992. Procedures for the analysis of
comparative data using phylogenetically independent contrasts. Systematic Biology
41:18–32.
Gittleman, J. L., and P. H. Harvey. 1980. Why are distasteful prey not cryptic? Nature
286:149–150.
Hagman M., and A. Forsman. 2003. Correlated evolution of conspicuous coloration and
body size in poison frogs (Dendrobatidae). Evolution 57:2904-2910.

83
Hamning, V. K., H. L. Yanites, and N. L. Peterson. 2000. Characterization of adhesive
neurotoxic components in skin granular gland secretions of Ambystoma tigrinum.
Copeia 2000:856-859.
Harvey, P. H., and M. D. Pagel. 1991. The Comparative Method in Evolutionary Biology.
Oxford University Press, Oxford, U.K.
Hensel, J. L., Jr., and E. D. Brodie Jr. 1976. An experimental study of aposematic
coloration in the salamander Plethodon jordani. Copeia 1:59-65.
Highton, R. 1995. Speciation in eastern North American salamanders of the genus
Plethodon. Annual Review of Ecology and Systematics 26:579-600.
Hossie, T. J., J. Skelhorn, J. W. Breinholt, A. Y. Kawahara, and T. N. Sherratt. 2015.
Body size affects the evolution of eyespots in caterpillars. Proceedings of the
National Academy of Sciences 112:6664-6669.
Hultgren, K. M., and J. J. Stachowicz. 2009. Evolution of decoration in Majoid crabs: a
comparative phylogenetic analysis of the role of body size and alternative defensive
strategies. The American Naturalist 173:566-578.
Lindstrom, L., R. V. Alatalo, J. Mappes, M. Riipi, and L. Vertainen. 1999. Can
aposematic signals evolve by gradual change? Nature 397:249–251.
Maddison, W. P., and D. R. Maddison. 2011. Mesquite: a modular system for evolutionary
analysis. Version 2.75. http://mesquiteproject.org
Mitchell, J. C., and J. W. Gibbons. 2010. Salamanders of the Southeast. University of
Georgia Press, Athens, Georgia.
Mosher, H. S., F. A. Fuhrman, H. D. Buchwald, and H. G. Fischer. 1964. Tachichatoxin
tetrodotoxin: a potent neurotoxin. Science 144:1100-1110.

84
Nilsson, M., and A. Forsman. 2003. Evolution of conspicuous colouration, body size and
gregariousness: a comparative analysis of lepidopteran larvae. Evolutionary Ecology
17:51-66.
Pagel, M. 1993. Seeking the evolutionary regression coefficient: an analysis of what
comparative methods measure. Journal of Theoretical Biology 164:191–205.
Palmer, C. A., R. A. Watts, R. G. Gregg, M. A. McCall, L. D. Houck, R. Highton, and S.
J. Arnold. 2005. Lineage-specific differences in evolutionary mode in a salamander
courtship pheromone. Molecular Biology and Evolution 22:2243-2256.
Penney, H. D., C. Hassall, J. H. Skevington, K. R. Abbott, and T. N. Sherratt. 2012. A
comparative analysis of the evolution of imperfect mimicry. Nature 483:461-464.
Petranka, J. W. 1998. Salamanders of the United States and Canada. Smithsonian
Institution Press, Washington DC.
Poulton, E. B. 1890. The Colours of Animals: Their Meaning and Use, Especially
Considered in the Case of Insects. D. Appleton, New York City, New York.
Rudh, A. 2013. Loss of conspicuous coloration has co-evolved with decreased body size in
populations of poison dart frogs. Evolutionary Ecology 17:755-767.
Rudh, A., and A. Qvarnstrom. 2013. Adaptive colouration in amphibians. Seminars in Cell
& Developmental Biology 24:553-561.
Sillen-Tullberg, B. 1988. Evolution of gregariousness in aposematic butterfly larvae: a
phylogenetic analysis. Evolution 42:293–305.
Summers, K., and M. E. Clough. 2001. The evolution of coloration and toxicity in the
poison frog family (Dendrobatidae). Proceedings of the National Academy of
Sciences 98:6227-6232.
85
Tilley, S. G., B. L. Lundrigan, and L. P. Brower. 1982. Erythrism and mimicry in the
salamander Plethodon cinereus. Herpetologica 409-417.
Toledo, R. C., and C. Jared. 1995. Cutaneous granular glands and amphibian venoms.
Comparative Biochemistry and Physiology 111:1-29.
Tullberg, B. S., and A. F. Hunter. 1996. Evolution of larval gregariousness in relation to
repellent defences and warning coloration in tree‐feeding Macrolepidoptera: a
phylogenetic analysis based on independent contrasts. Biological Journal of the
Linnean Society 57:253-276.
Wallace, A. R. 1867. Mimicry and Other Protective Resemblances Among Animals. Read
Books Limited, Worcestershire, UK.
Walls, J. G. 1994. Jewels of the Rainforest. T. F. H. Publications, Neptune City, New Jersey.
Wiens, J. J., T. N. Engstrom, and P. T. Chippindale. 2006. Rapid diversification,
incomplete isolation, and the “speciation clock” in North American salamanders
(genus Plethodon): testing the hybrid swarm hypothesis of rapid radiation. Evolution
60:2585-2603.
Williams, T. A., and J. H. Larsen. 1986. New function for the granular skin glands of the
eastern long-toed salamander, Ambystoma macrodactylum columbrianum. Journal of
Experimental Zoology Part A: Ecological Genetics and Physiology 239:329-333.
Williams J., J. Niedzwiecki, and D. Weisrock. 2013. Species tree reconstruction of a
poorly resolved clade of salamanders (Ambystomatidae) using multiple nuclear loci.
Molecular Phylogenetics and Evolution 68:671-682.

86
Wollenberg, K. C., and G. J. Measey. 2009. Why colour in subterranean vertebrates?
Exploring the evolution of colour patterns in caecilian amphibians. Journal of
Evolutionary Biology 22:1046-1056.
Zimmerman, E. 1986. Breeding Terrarium Animals. T. F. H. Publications, Neptune City,
New Jersey.
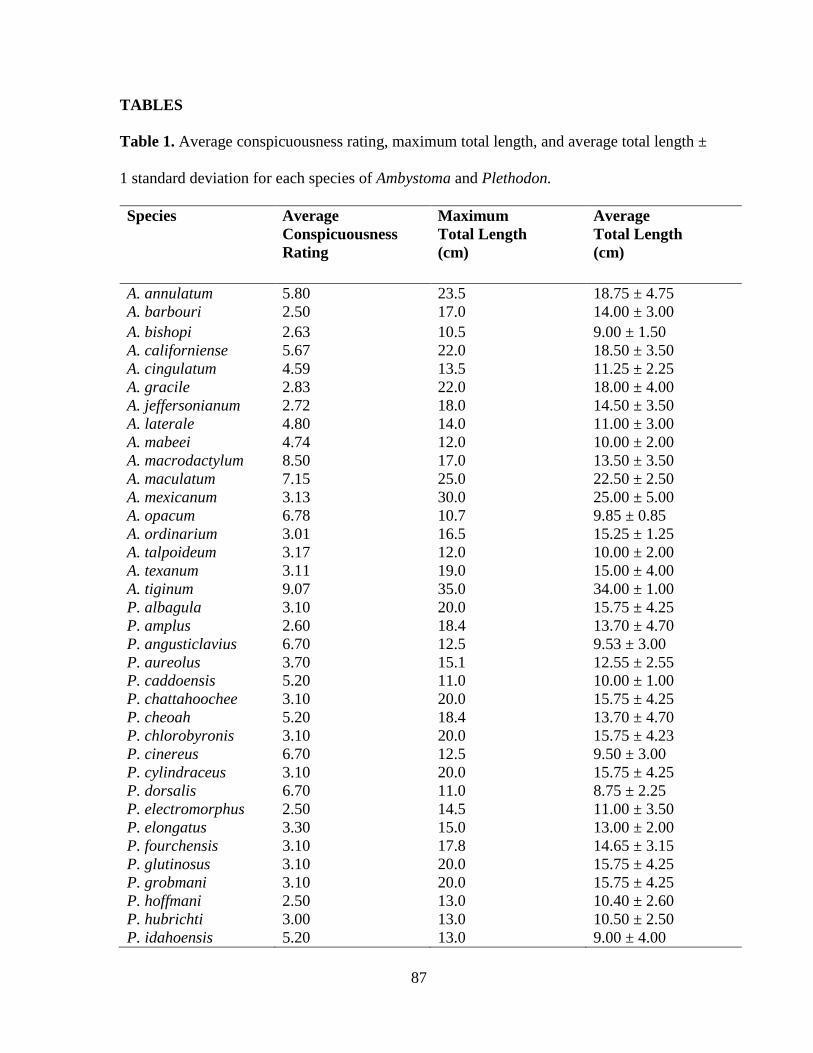
87
TABLES
Table 1. Average conspicuousness rating, maximum total length, and average total length ±
1 standard deviation for each species of Ambystoma and Plethodon.
Species Average Conspicuousness Rating
Maximum Total Length (cm)
Average Total Length (cm)
A. annulatum 5.80 23.5 18.75 ± 4.75 A. barbouri 2.50 17.0 14.00 ± 3.00 A. bishopi 2.63 10.5 9.00 ± 1.50 A. californiense 5.67 22.0 18.50 ± 3.50 A. cingulatum 4.59 13.5 11.25 ± 2.25 A. gracile 2.83 22.0 18.00 ± 4.00 A. jeffersonianum 2.72 18.0 14.50 ± 3.50 A. laterale 4.80 14.0 11.00 ± 3.00 A. mabeei 4.74 12.0 10.00 ± 2.00 A. macrodactylum 8.50 17.0 13.50 ± 3.50 A. maculatum 7.15 25.0 22.50 ± 2.50 A. mexicanum 3.13 30.0 25.00 ± 5.00 A. opacum 6.78 10.7 9.85 ± 0.85 A. ordinarium 3.01 16.5 15.25 ± 1.25 A. talpoideum 3.17 12.0 10.00 ± 2.00 A. texanum 3.11 19.0 15.00 ± 4.00 A. tiginum 9.07 35.0 34.00 ± 1.00 P. albagula 3.10 20.0 15.75 ± 4.25 P. amplus 2.60 18.4 13.70 ± 4.70 P. angusticlavius 6.70 12.5 9.53 ± 3.00 P. aureolus 3.70 15.1 12.55 ± 2.55 P. caddoensis 5.20 11.0 10.00 ± 1.00 P. chattahoochee 3.10 20.0 15.75 ± 4.25 P. cheoah 5.20 18.4 13.70 ± 4.70 P. chlorobyronis 3.10 20.0 15.75 ± 4.23 P. cinereus 6.70 12.5 9.50 ± 3.00 P. cylindraceus 3.10 20.0 15.75 ± 4.25 P. dorsalis 6.70 11.0 8.75 ± 2.25 P. electromorphus 2.50 14.5 11.00 ± 3.50 P. elongatus 3.30 15.0 13.00 ± 2.00 P. fourchensis 3.10 17.8 14.65 ± 3.15 P. glutinosus 3.10 20.0 15.75 ± 4.25 P. grobmani 3.10 20.0 15.75 ± 4.25 P. hoffmani 2.50 13.0 10.40 ± 2.60 P. hubrichti 3.00 13.0 10.50 ± 2.50 P. idahoensis 5.20 13.0 9.00 ± 4.00
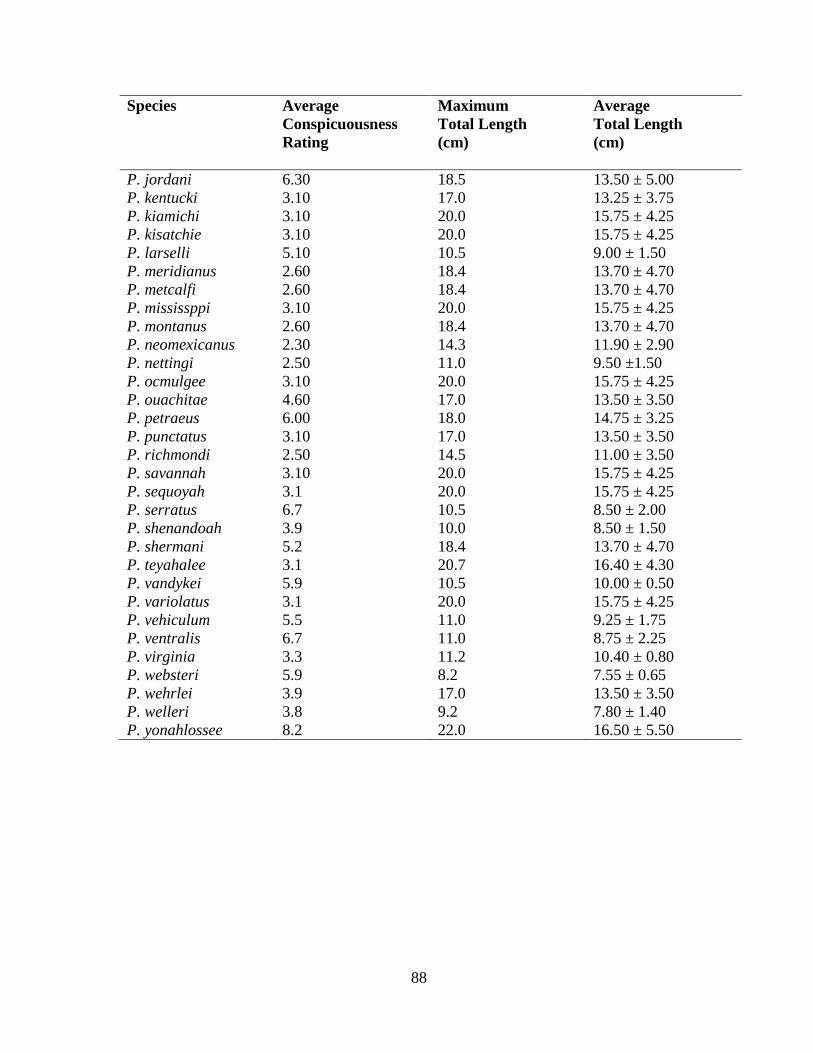
88
Species
Average Conspicuousness Rating
Maximum Total Length (cm)
Average Total Length (cm)
P. jordani 6.30 18.5 13.50 ± 5.00 P. kentucki 3.10 17.0 13.25 ± 3.75 P. kiamichi 3.10 20.0 15.75 ± 4.25 P. kisatchie 3.10 20.0 15.75 ± 4.25 P. larselli 5.10 10.5 9.00 ± 1.50 P. meridianus 2.60 18.4 13.70 ± 4.70 P. metcalfi 2.60 18.4 13.70 ± 4.70 P. mississppi 3.10 20.0 15.75 ± 4.25 P. montanus 2.60 18.4 13.70 ± 4.70 P. neomexicanus 2.30 14.3 11.90 ± 2.90 P. nettingi 2.50 11.0 9.50 ±1.50 P. ocmulgee 3.10 20.0 15.75 ± 4.25 P. ouachitae 4.60 17.0 13.50 ± 3.50 P. petraeus 6.00 18.0 14.75 ± 3.25 P. punctatus 3.10 17.0 13.50 ± 3.50 P. richmondi 2.50 14.5 11.00 ± 3.50 P. savannah 3.10 20.0 15.75 ± 4.25 P. sequoyah 3.1 20.0 15.75 ± 4.25 P. serratus 6.7 10.5 8.50 ± 2.00 P. shenandoah 3.9 10.0 8.50 ± 1.50 P. shermani 5.2 18.4 13.70 ± 4.70 P. teyahalee 3.1 20.7 16.40 ± 4.30 P. vandykei 5.9 10.5 10.00 ± 0.50 P. variolatus 3.1 20.0 15.75 ± 4.25 P. vehiculum 5.5 11.0 9.25 ± 1.75 P. ventralis 6.7 11.0 8.75 ± 2.25 P. virginia 3.3 11.2 10.40 ± 0.80 P. websteri 5.9 8.2 7.55 ± 0.65 P. wehrlei 3.9 17.0 13.50 ± 3.50 P. welleri 3.8 9.2 7.80 ± 1.40 P. yonahlossee 8.2 22.0 16.50 ± 5.50

89
FIGURES
Figure 1. Relationship between coloration and body size in Ambystoma salamanders
estimated by phylogenetically independent contrasts using a gradual model of evolutionary
change. The figure shows standardized contrasts for average total length against standardized
contrasts for average ratings of conspicuousness.

90

91
Figure 2. Evolution of average total length (top) and conspicuous coloration (bottom) in
Ambystoma salamanders using the squared-change parsimony option in computer software
Mesquite version 2.75. Orange and red shades represent a larger body size (top) and more
conspicuous coloration (bottom).
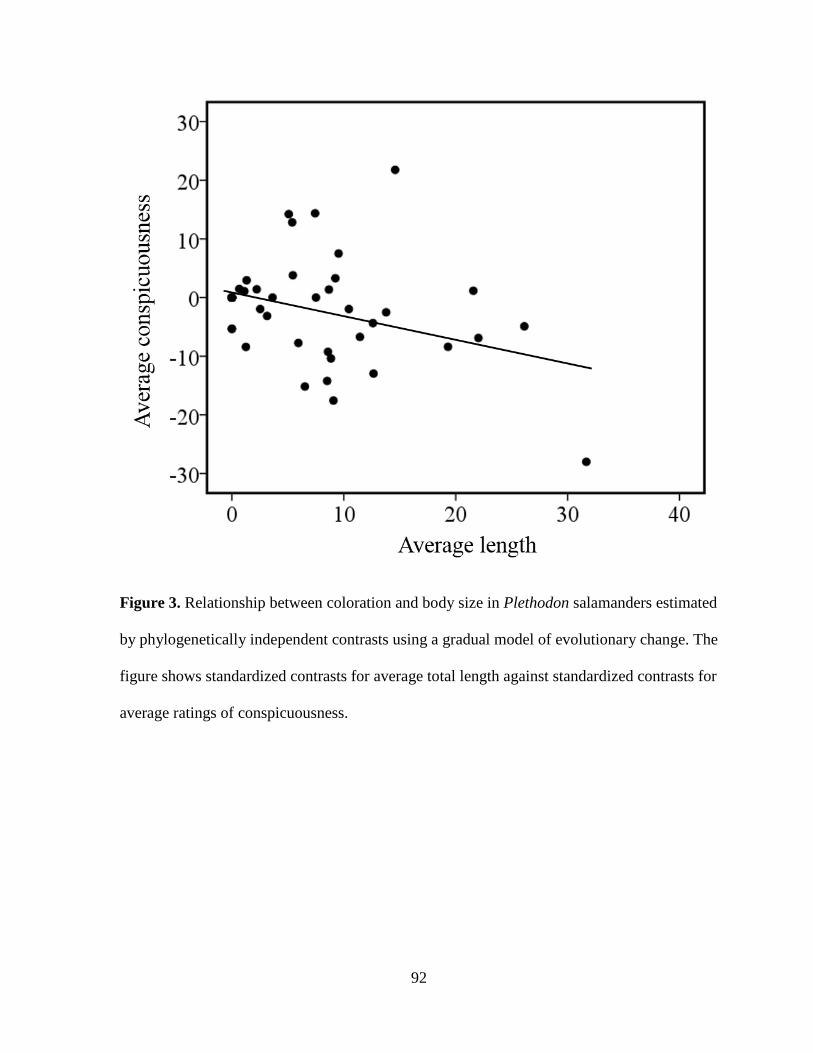
92
Figure 3. Relationship between coloration and body size in Plethodon salamanders estimated
by phylogenetically independent contrasts using a gradual model of evolutionary change. The
figure shows standardized contrasts for average total length against standardized contrasts for
average ratings of conspicuousness.

93
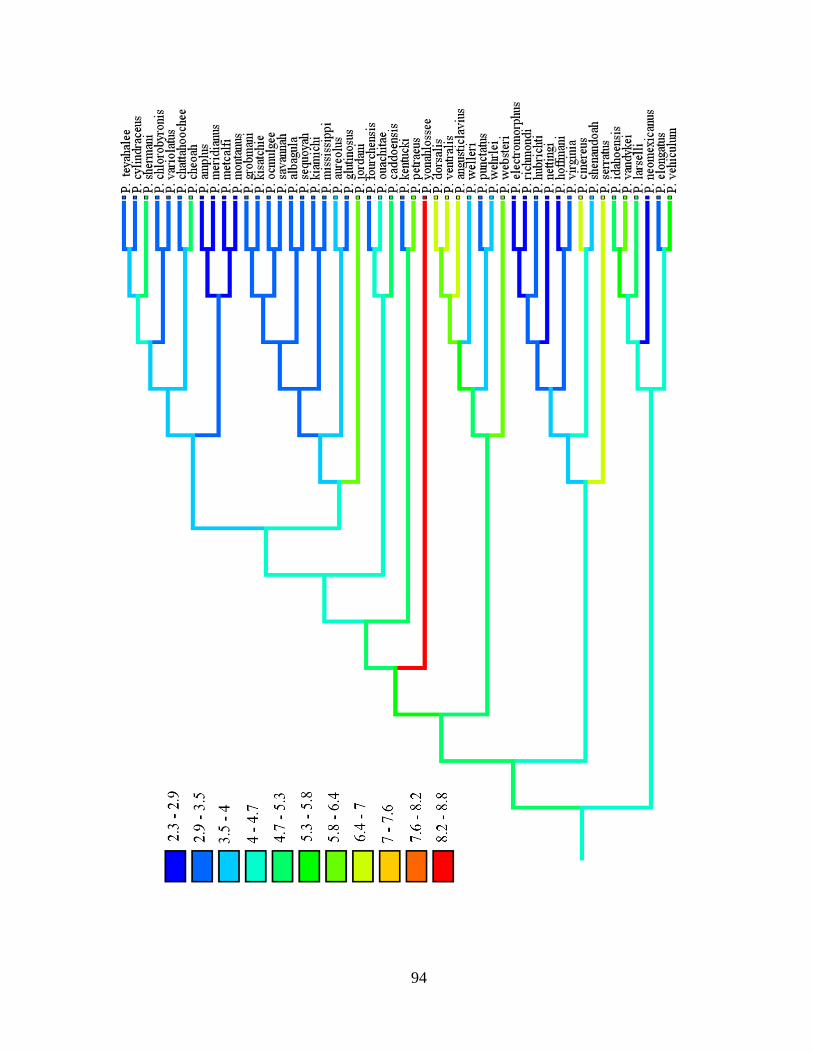
94

95
Figure 4. Evolution of average total length (top) and conspicuous coloration (bottom) in
Plethodon salamanders using the squared-change parsimony option in computer software
Mesquite version 2.75. Orange and red shades represent a larger body size (top) and more
conspicuous coloration (bottom).

96
VITA
Monica M. Winebarger was born in Boone, North Carolina, in 1990. She attended
elementary and high school in Watauga County, NC, and graduated from Watauga High
School in 2009. She was accepted into Appalachian State University for Fall 2009, and was
awarded a Bachelor of Science degree in Biology, Secondary Education in May 2014. In
August 2015, she began her Master’s program at Appalachian State University. She was
awarded her Master of Science degree in General Biology in May 2017. Monica has been
accepted into the Biological Sciences Ph.d. program at the University of Alabama, where she
will study freshwater ecology with a focus on freshwater mussels.