
Consolidated Results for Six Months Ended 2016 · FY2017/03 H1 Results Overview ... and the impacts...
31
Consolidated Results for Six Months Ended September 30, 2016 October 27, 2016 Ricoh Company, Ltd. The period under review saw the launch of the RICOH MP C8003/C6503 series of high-end full-color multifunction printers. The new offerings employ the large, full-color MultiLink panel, which with which users can download diverse applications that enhance efficiency.
Transcript of Consolidated Results for Six Months Ended 2016 · FY2017/03 H1 Results Overview ... and the impacts...

ConsolidatedResults for Six MonthsEnded September 30, 2016
October 27, 2016Ricoh Company, Ltd. The period under review saw the launch of the RICOH MP
C8003/C6503 series of high-end full-color multifunction printers. The new offerings employ the large, full-color MultiLink panel, which with which users can download diverse applications that enhance efficiency.
(C)2016 Ricoh Company, Ltd. All Rights Reserved 1October 27, 2016 (C)2015 Ricoh Company, Ltd. All Rights Reserved 1
Forward-looking statements
The plans, prospects, strategies and other statements, except for the historical events, mentioned in this material are forward-looking statements with respect to future events and business results. Those statements were made based on the judge of RICOH's Directors from the information that is now obtainable. Actual results may differ materially from those projected or implied in such forward-looking statements and from any historical trends. Please refrain from judging only from these forward-looking statements with respect to future events and business results. The following important factors, without limiting the generality of the foregoing, could affect future results and could cause those results to differ materially from those expressed in the forward-looking statements:
a. General economic conditions and business trendb. Exchange rates and their fluctuations c. Rapid technological innovation d. Uncertainty as to RICOH's ability to continue to design, develop, produce and market
products and services that achieve market acceptance in hot competitive market
No company's name and/or organization's name used, quoted and/or referenced in this material shall be interpreted as a recommendation and/or endorsement by RICOH.
This material is not an offer or a solicitation to make investments. Please do not rely on this material as your sole source of information for your actual investments, and be aware that decisions regarding investments are the responsibility of themselves.
We have adopted a net basis for reporting a portion of lease transactions from this fiscal year in place of a gross basis. Past sales figures and related indicators have also been adjusted retrospectively to conform to the current year.

(C)2016 Ricoh Company, Ltd. All Rights Reserved 2October 27, 2016 (C)2015 Ricoh Company, Ltd. All Rights Reserved 2
FY2017/03 H1 Results Overview
We have adopted a net basis for reporting a portion of lease transactions from this fiscal year in place of a gross basis. Past sales figures and related indicators have also been adjusted retrospectively to conform to the current year.
� Sales declined 11.3%, to ¥971.4 billionAdverse foreign exchange rates and downturns in core businesses in another challenging operating climate detracted from sales, while revenues rose in Industrial Products and Other businesses
� Operating profit dropped 70.5%, to ¥16.5 billionAlthough progress with structural reforms lowered costs, earnings declined owing to the absence of extraordinary factors from a year earlier and the impacts of India-related expenses and forex
� Profit attributable to owners of the parent fell 85.5%, to ¥5.0 billion
� Management has amended its full-year forecasts in view of first-half results and additional spending to accelerate structural reform activities
� Interim dividend paid as planned

(C)2016 Ricoh Company, Ltd. All Rights Reserved 3October 27, 2016
Key Indicators
Sales changeexcluding forex
Japan -0.6%The Americas -4.0%EMEA -2.9%Other -6.7%
Consolidated -2.9%
FY17/03 H1Year-on-year
change
Sales971.4 billion
yen-11.3%
Operating profit 16.5 billion yen -70.5%
Operating margin 1.7% -3.4 pt
Profit attributable toowners of the parent
5.0 billion yen -85.5%
EPS 6.90 yen -40.75 yen
Free Cash flow Excluding Finance business
-7.4 billion yen-13.4 billion
yen
R&D expenditures 57.1 billion yen -0.5 billion yen
Capital expenditures 35.9 billion yen -4.9 billion yen
Depreciation 33.1 billion yen -1.4 billion yen
Exchange rate Yen/US$
Yen/Euro
105.25 yen
118.14 yen
-16.55 yen
-16.99 yen

(C)2016 Ricoh Company, Ltd. All Rights Reserved 4October 27, 2016 (C)2015 Ricoh Company, Ltd. All Rights Reserved 4
56.1
40.2
16.5
-9.6
+5.1
-6.9
+1.4
-19.5
-39.5
+5.8
India-related
expenses
FY2017/03 H1 Operating Profit Comparisons
FY16/03H1
OperatingProfit
FY17/03H1
OperatingProfit
Forex,net
OtherexpensesR&D
(billions of yen)
Lowerproduct costs
Sales and product mix
Nonrecurringincome in previous
year
-15.9
Notwithstanding cost reductions stemming from groupwide structural reform initiatives, earnings were down in the absence of extraordinary factors froma year earlier and the impacts of India-related expenses and forex
(C)2016 Ricoh Company, Ltd. All Rights Reserved 5October 27, 2016 (C)2015 Ricoh Company, Ltd. All Rights Reserved 5
Business Segments (1)
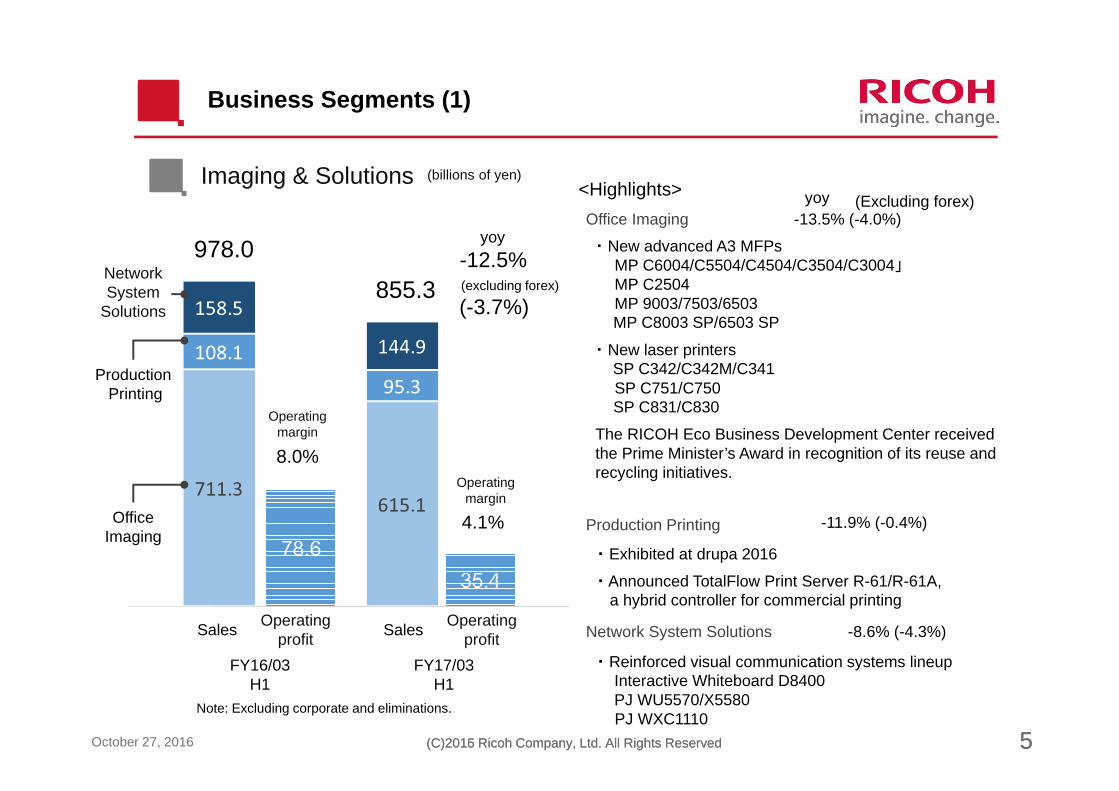
Imaging & Solutions
FY16/03H1
FY17/03H1
-12.5%
4.1%
SalesOperating
profitSales
Operatingprofit
978.0
855.3
OfficeImaging
ProductionPrinting
NetworkSystem
Solutions
Operatingmargin
8.0%
Operatingmargin
Note: Excluding corporate and eliminations.
yoy
(excluding forex)
(-3.7%)
(billions of yen)
-13.5% (-4.0%)
-11.9% (-0.4%)
-8.6% (-4.3%)
・ New advanced A3 MFPsMP C6004/C5504/C4504/C3504/C3004」MP C2504MP 9003/7503/6503MP C8003 SP/6503 SP
・ New laser printersSP C342/C342M/C341SP C751/C750SP C831/C830
The RICOH Eco Business Development Center received the Prime Minister’s Award in recognition of its reuse and recycling initiatives.
・ Exhibited at drupa 2016
・ Announced TotalFlow Print Server R-61/R-61A, a hybrid controller for commercial printing
・ Reinforced visual communication systems lineupInteractive Whiteboard D8400PJ WU5570/X5580PJ WXC1110
Office Imaging
Production Printing
Network System Solutions
yoy (Excluding forex)<Highlights>

(C)2016 Ricoh Company, Ltd. All Rights Reserved 6October 27, 2016 (C)2015 Ricoh Company, Ltd. All Rights Reserved 6
Business Segments (2)
Industrial Products
FY16/03H1
FY17/03H1
6.9%
SalesOperating
profitSales
Operatingprofit
Operatingmargin8.8%
Operatingmargin
Note: Excluding corporate and eliminations.
-6.7%yoy
(excluding forex)
(+0.4%)
(billions of yen)
・ Reinforced industrial inkjet product lineupRICOH MH5220 inkjet headNew inkjet print head employing thin-film piezo actuator
・ Stronger lineup of camera modules for factory automationRICOH SC-10A assembly support camera systemFL-BC1618-9M / FL-BC1220-9M factory automation lens
・ Stronger electronic device rangeR5112S power IC for vehicular applicationsR1580N driver controller IC for LED lighting
RICOH MH5220 industrial printing inkjet head for high-precision printing and capable of jetting high-viscosity inks
RICOH SC-10A support camera system, which can automatically check assembly work results
<Highlights>

(C)2016 Ricoh Company, Ltd. All Rights Reserved 7October 27, 2016 (C)2015 Ricoh Company, Ltd. All Rights Reserved 7
Business Segments (3)
Other
FY16/03H1
FY17/03H1
4.7%
SalesOperating
profitSales
Operatingprofit
Operatingmargin
2.5%
Operatingmargin
Note: Excluding corporate and eliminations.
+6.0%yoy
(excluding forex)
(+8.1%)
(billions of yen)
・ Bolstered digital SLR camera rangePENTAX K-70, an all-weather model for outdoor shooting
・ Launched non-GPS-based indoor positioning system serviceFirst offering was service for medical facilities
・ Standard 360-degree camera model「RICOH THETA SC」
<Highlights>
PENTAX K-70
RICOH THETA SC
(C)2016 Ricoh Company, Ltd. All Rights Reserved 8October 27, 2016
Statement of Financial Position as of September 30, 2016
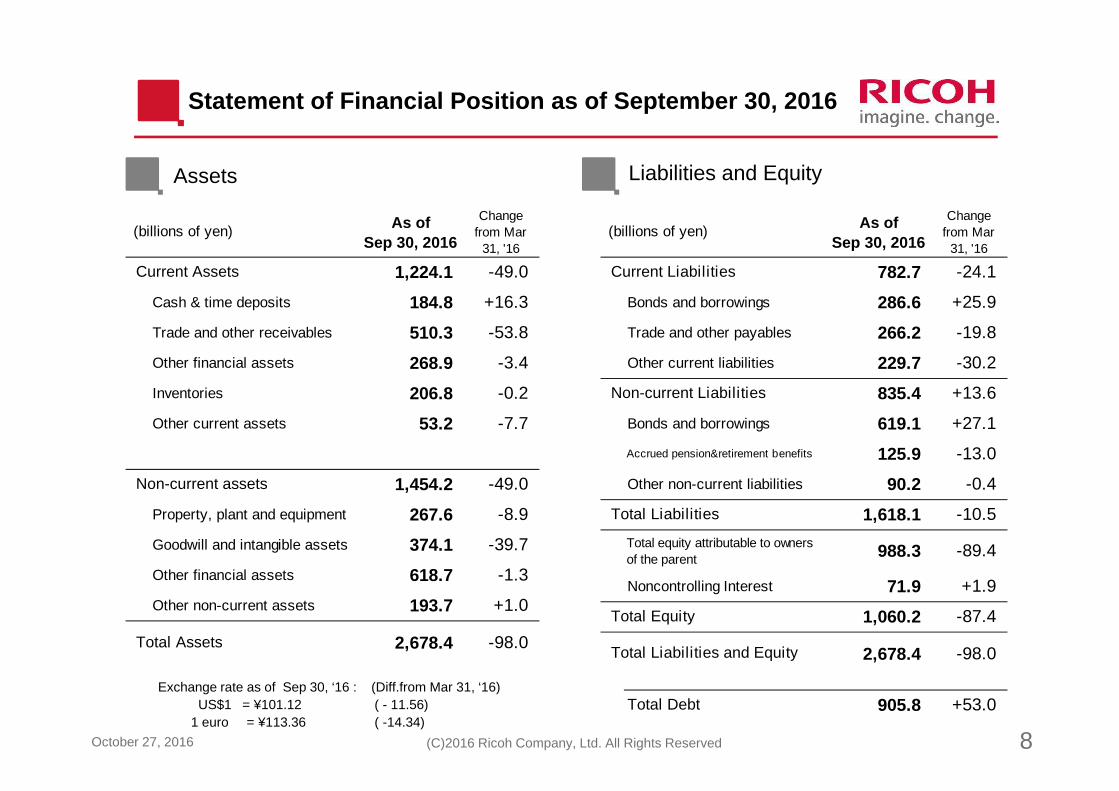
Assets Liabilities and Equity
Exchange rate as of Sep 30, ‘16 : (Diff.from Mar 31, ‘16)US$1 = ¥101.12 ( - 11.56)
1 euro = ¥113.36 ( -14.34)
As ofSep 30, 2016
Changefrom Mar
31, '16
Current Assets 1,224.1 -49.0
Cash & time deposits 184.8 +16.3
Trade and other receivables 510.3 -53.8
Other financial assets 268.9 -3.4
Inventories 206.8 -0.2
Other current assets 53.2 -7.7
Non-current assets 1,454.2 -49.0
Property, plant and equipment 267.6 -8.9
Goodwill and intangible assets 374.1 -39.7
Other financial assets 618.7 -1.3
Other non-current assets 193.7 +1.0
Total Assets 2,678.4 -98.0
(billions of yen) As ofSep 30, 2016
Changefrom Mar
31, '16
Current Liabilities 782.7 -24.1
Bonds and borrowings 286.6 +25.9
Trade and other payables 266.2 -19.8
Other current liabilities 229.7 -30.2
Non-current Liabilities 835.4 +13.6
Bonds and borrowings 619.1 +27.1
Accrued pension&retirement benefits 125.9 -13.0
Other non-current liabilities 90.2 -0.4
Total Liabilities 1,618.1 -10.5
Total equity attributable to ownersof the parent 988.3 -89.4
Noncontrolling Interest 71.9 +1.9
Total Equity 1,060.2 -87.4
2,678.4 -98.0
Total Debt 905.8 +53.0
(billions of yen)
Total Liabilities and Equity
(C)2016 Ricoh Company, Ltd. All Rights Reserved 9October 27, 2016 (C)2015 Ricoh Company, Ltd. All Rights Reserved 9
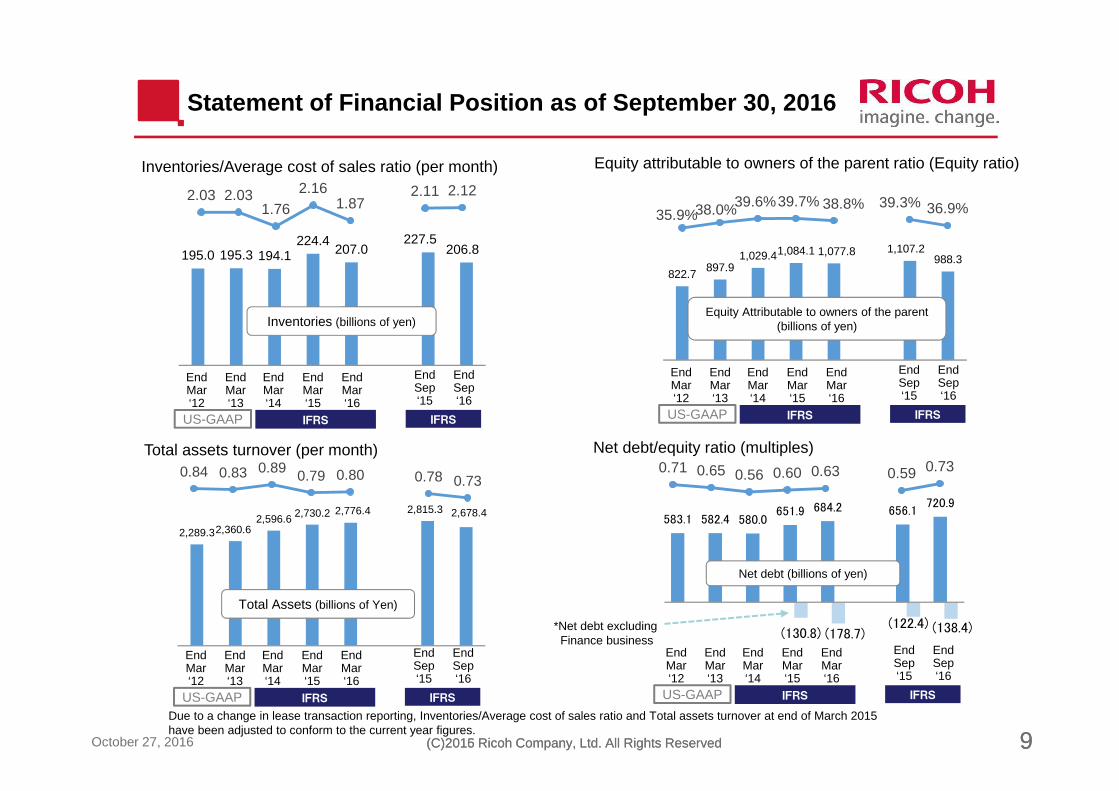
583.1 582.4 580.0 651.9 684.2 656.1
720.9
(130.8) (178.7)(122.4) (138.4)
2,289.3 2,360.6 2,596.6 2,730.2 2,776.4 2,815.3 2,678.4
822.7897.9
1,029.41,084.1 1,077.8 1,107.2988.3195.0 195.3 194.1
224.4207.0
227.5206.8
Equity attributable to owners of the parent ratio (Equity ratio)Inventories/Average cost of sales ratio (per month)
Total assets turnover (per month) Net debt/equity ratio (multiples)
Inventories (billions of yen)Equity Attributable to owners of the parent
(billions of yen)
Total Assets (billions of Yen)
*Net debt excluding Finance business
Due to a change in lease transaction reporting, Inventories/Average cost of sales ratio and Total assets turnover at end of March 2015 have been adjusted to conform to the current year figures.
IFRSUS-GAAP IFRS
EndMar‘12
EndMar‘13
EndMar‘14
EndMar‘15
EndMar‘16
EndSep‘15
EndSep‘16
IFRSUS-GAAP IFRS
EndMar‘12
EndMar‘13
EndMar‘14
EndMar‘15
EndMar‘16
EndSep‘15
EndSep‘16
IFRSUS-GAAP IFRS
EndMar‘12
EndMar‘13
EndMar‘14
EndMar‘15
EndMar‘16
EndSep‘15
EndSep‘16
IFRSUS-GAAP IFRS
EndMar‘12
EndMar‘13
EndMar‘14
EndMar‘15
EndMar‘16
EndSep‘15
EndSep‘16
Net debt (billions of yen)
Statement of Financial Position as of September 30, 2016
2.03 2.031.76
2.161.87
2.11 2.12
35.9%38.0%39.6%39.7% 38.8% 39.3% 36.9%
0.84 0.83 0.89 0.79 0.80 0.78 0.730.71 0.65 0.56 0.60 0.63 0.59 0.73
(C)2016 Ricoh Company, Ltd. All Rights Reserved 10October 27, 2016 (C)2015 Ricoh Company, Ltd. All Rights Reserved 10
-36.1 -31.5
34.0
-30.1
39.7
-51.7
37.9
1.7
-27.2-29.7-21.2
60.7
1.1 4.80.9
44.5
17.1
-24.6
-101.2
18.0 23.9
-40.9
-4.2
9.5
-25.5
29.4
51.5
6.0
-7.4
FCFFCFFCEF
*FCEF:ファイナンス事業を除くFCF
FCFFCFFCEF
2015/03
IFRSQ4 Q1 Q2Q2 Q3 Q1 Q2 Q3 Q4
2016/03 2017/03
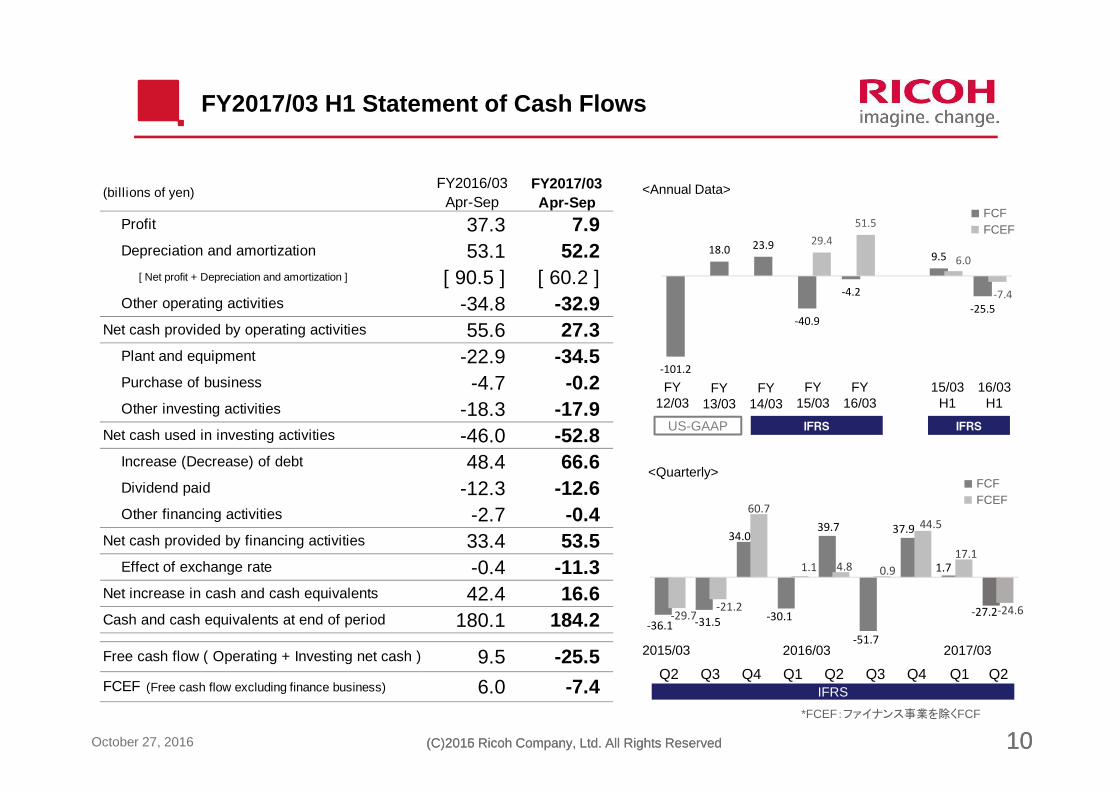
FY2017/03 H1 Statement of Cash Flows
<Annual Data>
<Quarterly>
(billions of yen)FY2016/03
Apr-SepFY2017/03Apr-Sep
Profit 37.3 7.9 Depreciation and amortization 53.1 52.2
[ Net profit + Depreciation and amortization ] [ 90.5 ] [ 60.2 ] Other operating activities -34.8 -32.9
Net cash provided by operating activities 55.6 27.3 Plant and equipment -22.9 -34.5 Purchase of business -4.7 -0.2 Other investing activities -18.3 -17.9
Net cash used in investing activities -46.0 -52.8 Increase (Decrease) of debt 48.4 66.6 Dividend paid -12.3 -12.6 Other financing activities -2.7 -0.4
Net cash provided by financing activities 33.4 53.5 Effect of exchange rate -0.4 -11.3
Net increase in cash and cash equivalents 42.4 16.6 Cash and cash equivalents at end of period 180.1 184.2
Free cash flow ( Operating + Investing net cash ) 9.5 -25.5 FCEF (Free cash flow excluding finance business) 6.0 -7.4
FY12/03
FY13/03
FY14/03
FY15/03
FY16/03
IFRSUS-GAAP
15/03H1
16/03H1
IFRS

(C)2016 Ricoh Company, Ltd. All Rights Reserved 11October 27, 2016
Outlook for FY2017/03
FY17/03Forecast
Year-on-year change
Revision from previous forecast
Sales 2,010.0 billion yen -9.0% -30.0 billion yen
Operating profit 40.0 billion yen -60.9% -15.0 billion yen
Operating margin 2.0 % -2.6 pt -0.7 pt
Profit attributable to owners of the parent
18.0 billion yen -71.4% -12.0 billion yen
EPS 24.83 yen -62.04 yen -16.56 yen
ROE 1.7% -4.1 pt -1.3 pt
FCEF* 5.0 billion yen -46.5 billion yen -15.0 billion yen
R&D expenditures 118.0 billion yen +0.5 billion yen -2.0 billion yen
Capital expenditures(tangible fixed asset)
80.0 billion yen +3.7 billion yen -5.0 billion yen
Depreciation 70.0 billion yen +1.2 billion yen ±0.0 billion yen
Yen/US$Yen/Euro
105.13 yen116.57 yen
-14.99 yen-16.11 yen
-0.64 yen-0.17 yen
*FCEF: Free Cash flow Excluding Finance business

(C)2016 Ricoh Company, Ltd. All Rights Reserved 12October 27, 2016 (C)2015 Ricoh Company, Ltd. All Rights Reserved 12
102.285.4 85.4
63.9 63.9 73.9 75.9 83.9
40.0
Previous forecast
New forecast
(billions of yen)
FY17/03Operating
ProfitForecast
R&D
Forex,net
OtherExpenses
FY16/03Operating
Profit
Lower Productcosts
Sales&
ProductMix
Nonrecurringincome in previous
year
India-related
expenses
Full-Year Operating Profit Comparisons
-16.8
-62.2
-21.5 +19.0 -11.0+10.0 +2.0
-18.6 -0.5+10.0 +17.6 - -6.5
-6.9
-32.4
-37.0
RestructuringCharge
(C)2016 Ricoh Company, Ltd. All Rights Reserved 13October 27, 2016 (C)2015 Ricoh Company, Ltd. All Rights Reserved 13
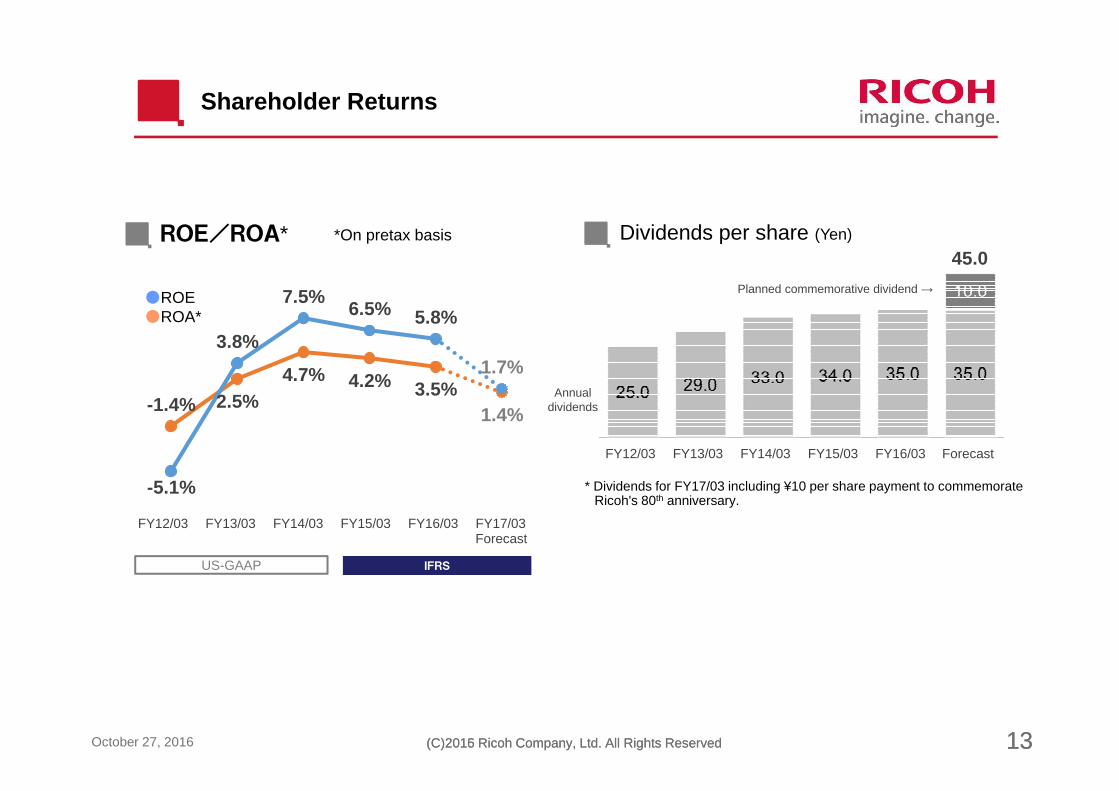
-1.4% 2.5%4.7% 4.2% 3.5%
1.4%
-5.1%
3.8%
7.5%6.5% 5.8%
1.7%
Shareholder Returns
ROE/ROA* Dividends per share (Yen)*On pretax basis
Forecast
US-GAAP IFRS
●ROE●ROA*
* Dividends for FY17/03 including ¥10 per share payment to commemorate Ricoh's 80th anniversary.
FY17/03FY16/03FY15/03FY14/03FY13/03FY12/03
ForecastFY16/03FY15/03FY14/03FY13/03FY12/03
45.0
Annual dividends
Planned commemorative dividend →
(C)2016 Ricoh Company, Ltd. All Rights Reserved 14October 27, 2016
Appendix
(C)2016 Ricoh Company, Ltd. All Rights Reserved 15October 27, 2016
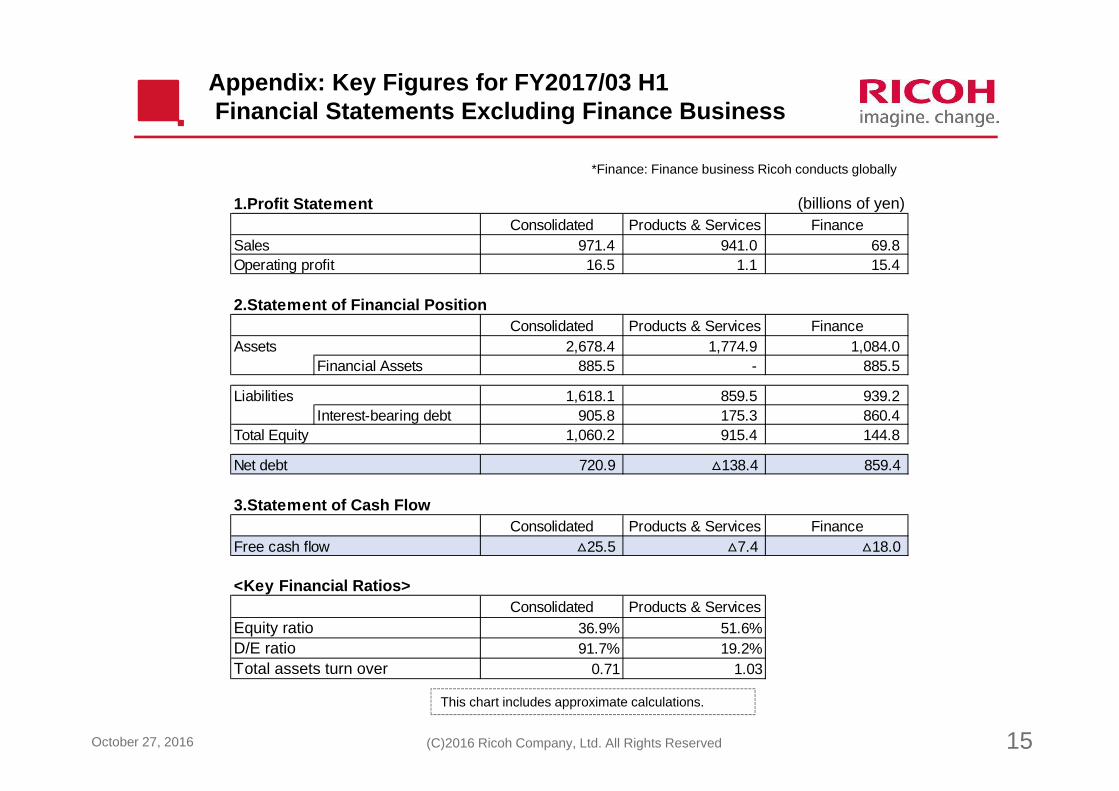
Appendix: Key Figures for FY2017/03 H1Financial Statements Excluding Finance Business
*Finance: Finance business Ricoh conducts globally
This chart includes approximate calculations.
1.Profit Statement (billions of yen)Consolidated Products & Services Finance
Sales 971.4 941.0 69.8 Operating profit 16.5 1.1 15.4
2.Statement of Financial PositionConsolidated Products & Services Finance
Assets 2,678.4 1,774.9 1,084.0 Financial Assets 885.5 - 885.5
Liabilities 1,618.1 859.5 939.2 Interest-bearing debt 905.8 175.3 860.4
Total Equity 1,060.2 915.4 144.8
Net debt 720.9 △138.4 859.4
3.Statement of Cash FlowConsolidated Products & Services Finance
Free cash flow △25.5 △7.4 △18.0
<Key Financial Ratios>Consolidated Products & Services
Equity ratio 36.9% 51.6%D/E ratio 91.7% 19.2%Total assets turn over 0.71 1.03
(C)2016 Ricoh Company, Ltd. All Rights Reserved 16October 27, 2016 (C)2015 Ricoh Company, Ltd. All Rights Reserved 16
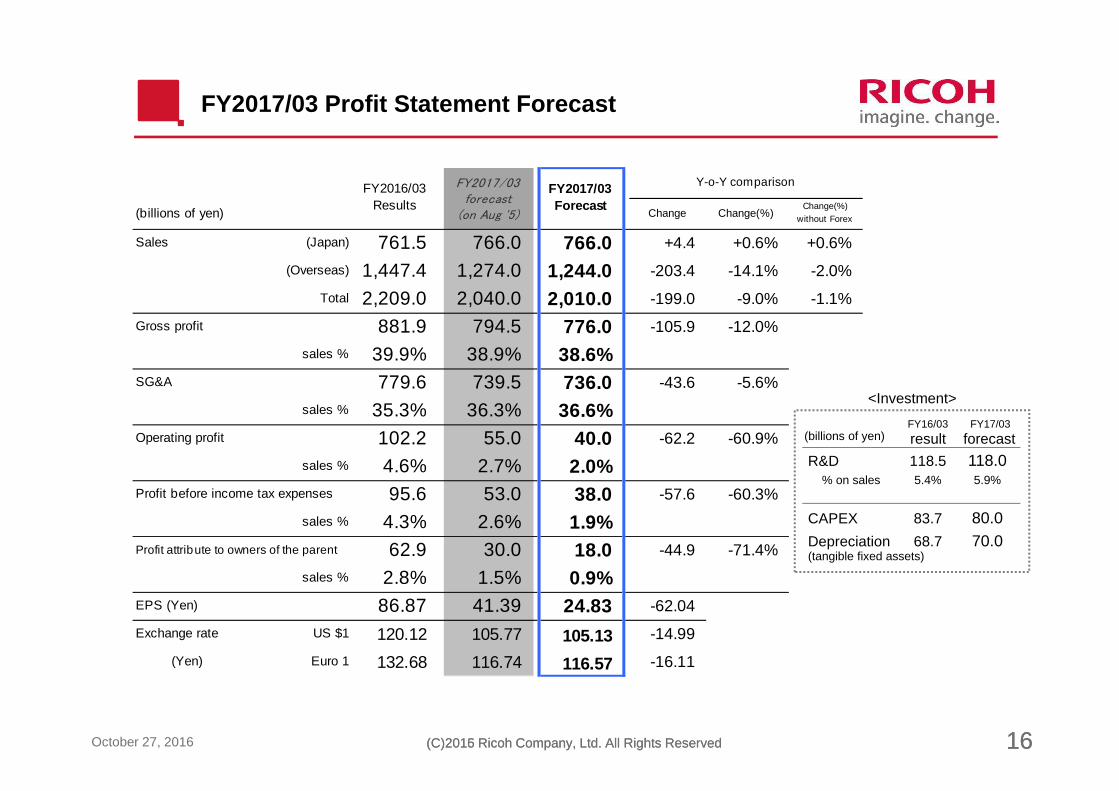
FY16/03 FY17/03
result forecast
R&D 118.5 118.0% on sales 5.4% 5.9%
CAPEX 83.7 80.0Depreciation 68.7 70.0(tangible fixed assets)
<Investment>
(billions of yen)
FY2017/03 Profit Statement Forecast
Y-o-Y comparison
(billions of yen) Change Change(%)Change(%)
without Forex
Sales (Japan) 761.5 766.0 766.0 +4.4 +0.6% +0.6%
(Overseas) 1,447.4 1,274.0 1,244.0 -203.4 -14.1% -2.0%
Total 2,209.0 2,040.0 2,010.0 -199.0 -9.0% -1.1%
Gross profit 881.9 794.5 776.0 -105.9 -12.0%
sales % 39.9% 38.9% 38.6% SG&A 779.6 739.5 736.0 -43.6 -5.6%
sales % 35.3% 36.3% 36.6% Operating profit 102.2 55.0 40.0 -62.2 -60.9%
sales % 4.6% 2.7% 2.0% Profit before income tax expenses 95.6 53.0 38.0 -57.6 -60.3%
sales % 4.3% 2.6% 1.9% Profit attribute to owners of the parent 62.9 30.0 18.0 -44.9 -71.4%
sales % 2.8% 1.5% 0.9% EPS (Yen) 86.87 41.39 24.83 -62.04
Exchange rate US $1 120.12 105.77 105.13 -14.99
(Yen) Euro 1 132.68 116.74 116.57 -16.11
FY2017/03Forecast
FY2016/03Results
FY2017/03forecast
(on Aug '5)

(C)2016 Ricoh Company, Ltd. All Rights Reserved 17October 27, 2016
FY2017/3 Sales Forecasts by Category
(billions of yen)By product line By geographic area
Industrial Products
2,209.0
FY2016/03
2,010.0
Y-o-Y (excluding Forex)
-9.0%(-1.1%)
-5.5%(-1.4%)
-11.3%(-2.5%)
FY2017/03forecast
+4.5%(+6.4%)
-1.1%(+6.4%)
-10.3%(-2.0%)
Imaging&Solutions
Network System Solutions
Office Imaging1,974.5 1,772.0
-14.2%(-2.0%)
FY2016/03 FY2017/03forecast
+0.6%(+0.6%)
Overseas
-14.1%(-2.0%)
-13.5%(-1.6%)
-14.8%(-2.7%)Other
EMEA
The Americas
1,244.01,447.4
2,209.02,010.0
Production Printing-10.2%(+0.5%)
Y-o-Y (excluding Forex)
-9.0%(-1.1%)
Japan
Other

(C)2016 Ricoh Company, Ltd. All Rights Reserved 18October 27, 2016 (C)2015 Ricoh Company, Ltd. All Rights Reserved 18
P/L by Business Segment (1)
Consolidated Imaging & Solutions
Sales
OperatingProfit
SalesChange(excluding forex)
Operating profit
Operating margin
Q3 Q42015/03
Q1 Q2Q2 Q4 Q1 Q2 Q32016/03
Q3 Q42015/03
Q1 Q2Q2 Q4 Q1 Q2 Q32016/032017/03 2017/03
(Billions of yen)

(C)2016 Ricoh Company, Ltd. All Rights Reserved 19October 27, 2016 (C)2015 Ricoh Company, Ltd. All Rights Reserved 19
Imaging & Solutions Supplement
Sales by product category
OfficeImaging
ProductionPrinting
NetworkSystemSolutions
< Products & Services sales y-o-y >
Black & White ColorMFP -8% -3%Office Printer -5% -4%PP(Cut Sheet type) -10% +16%
Services* +5%
(Value, excluding Forex)
(*Document, IT services excluding hardware sales of PC)
<FY17/03 H1>
Sales (billions of yen)
Change(excluding forex) < MFP / Printer / PP combined y-o-y >
See Appendix for more data
(Value, excluding forex)
2016/03
Q3 Q2Q2 Q4 Q1 Q2 Q3 Q4 Q1
Q3 Q42015/03
Q1 Q2Q2 Q4 Q1 Q2 Q32016/03
2015/03
2017/03
2017/03
-1%
-4%
-3% -1%
-3%
+0%
-4% -3% -2%
+5%
-3%
-5%
+1%
-3%
-2%
+1%
-7%
-2%
Hardware
Non-hardware
(C)2016 Ricoh Company, Ltd. All Rights Reserved 20October 27, 2016 (C)2015 Ricoh Company, Ltd. All Rights Reserved 20
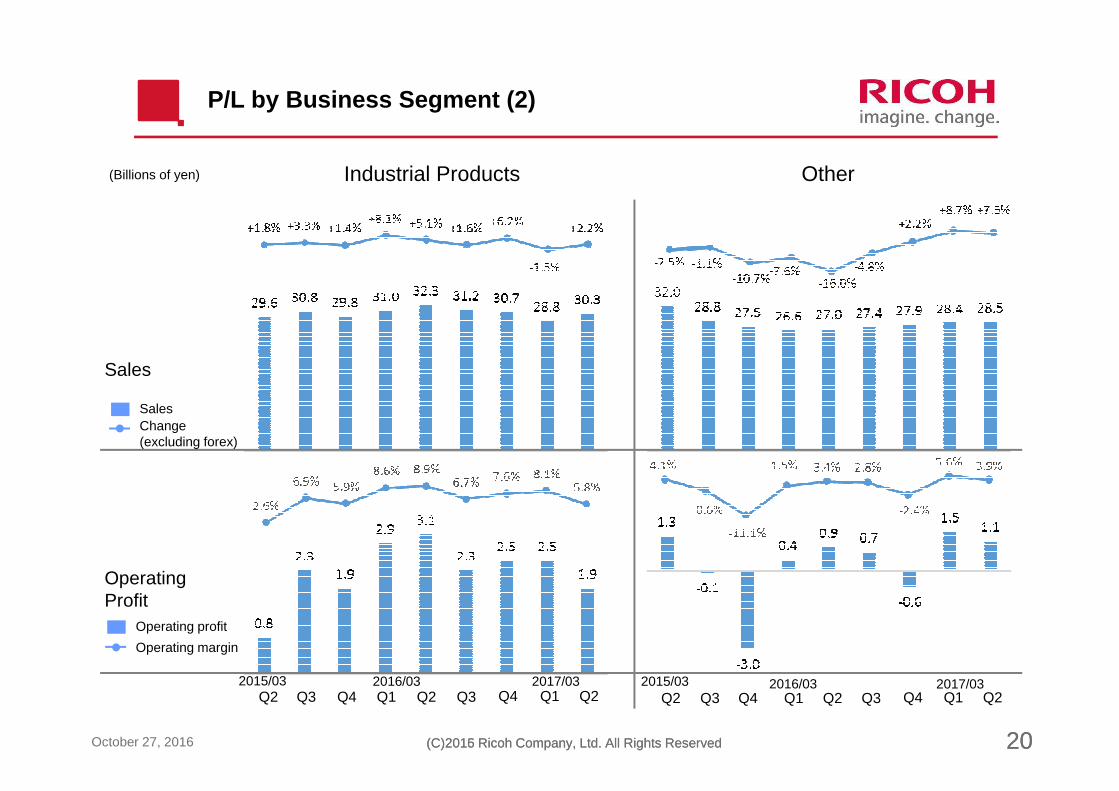
P/L by Business Segment (2)
Industrial Products Other
Sales
OperatingProfit
SalesChange(excluding forex)
Operating profit
Operating margin
Q3 Q42015/03
Q1 Q2Q2 Q4 Q1 Q2 Q32016/03
Q32017/03
Q42015/03
Q1 Q2Q2 Q4 Q1 Q2 Q32016/032017/03
(Billions of yen)

(C)2016 Ricoh Company, Ltd. All Rights Reserved 21October 27, 2016
P/L by Geographic Area (1)
Japan The Americas
Sales
OperatingIncome
SalesChange(excluding forex)
Operating profit
Operating margin
Q32017/03
Q42015/03
Q1 Q2Q2 Q4 Q1 Q2 Q32016/03
Q32017/03
Q42015/03
Q1 Q2Q2 Q4 Q1 Q2 Q32016/03
(C)2016 Ricoh Company, Ltd. All Rights Reserved 22October 27, 2016
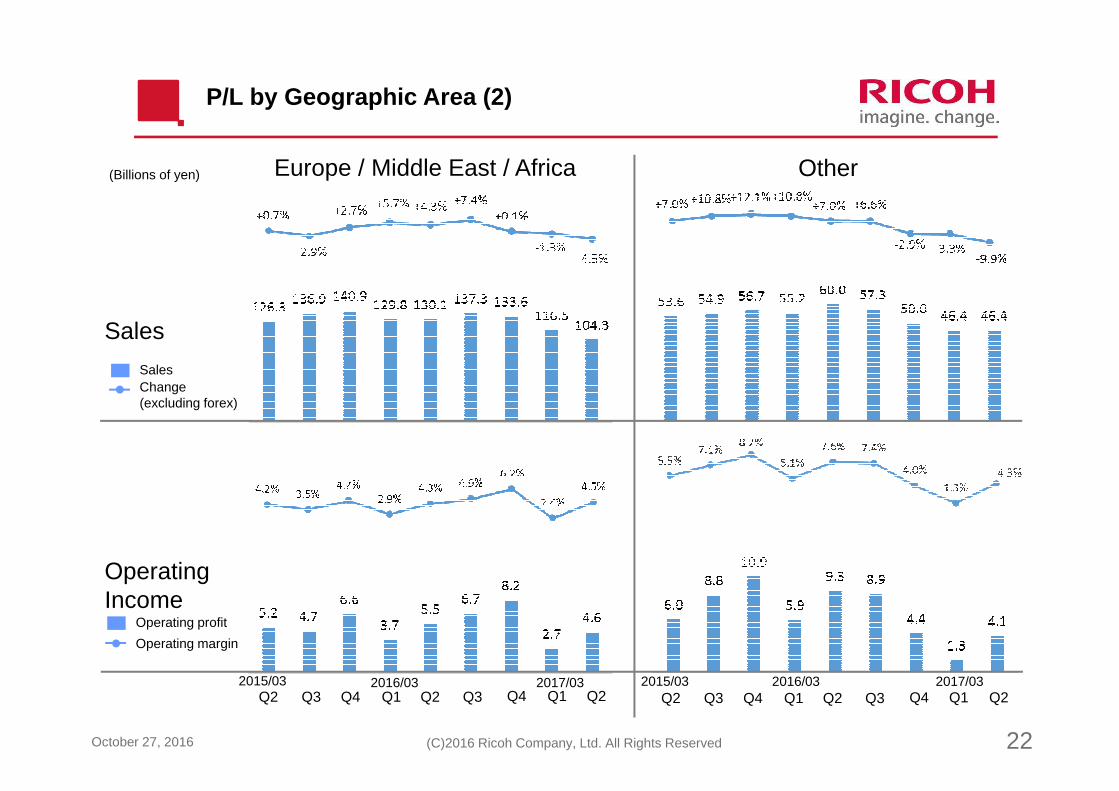
P/L by Geographic Area (2)
Europe / Middle East / Africa Other
Sales
OperatingIncome
SalesChange(excluding forex)
Operating profit
Operating margin
Q32017/03
Q42015/03
Q1 Q2Q2 Q4 Q1 Q2 Q32016/03
Q32017/03
Q42015/03
Q1 Q2Q2 Q4 Q1 Q2 Q32016/03
(Billions of yen)

(C)2016 Ricoh Company, Ltd. All Rights Reserved 23October 27, 2016
Appendix: Historical Data (1)
Imaging & Solutions sales portion by products
MFP & printer Non-hardware ratio
*Value based ratio including forex
FY2015/03 FY2016/03 FY2017/03 FY15/03 FY16/03 FY17/03 FY15/03 FY16/03
Q1 Q2 Q3 Q4 Q1 Q2 Q3 Q4 Q1 Q2 1H 1H 1H Total Total
MFP 55% 52% 54% 52% 52% 48% 48% 49% 50% 47% 53% 50% 48% 53% 49%
Office Printer 9% 9% 9% 9% 9% 9% 9% 9% 9% 9% 9% 9% 9% 9% 9%
Production Printing(PP) 9% 10% 11% 10% 11% 12% 11% 11% 11% 11% 9% 11% 11% 10% 11%
Office Imaging, other 5% 6% 4% 6% 6% 6% 8% 6% 6% 6% 6% 6% 6% 5% 6%
MDS(Labor charge) & IT Services 12% 13% 13% 14% 14% 15% 14% 15% 14% 15% 13% 15% 15% 13% 15%
Network System Solutions, other 10% 10% 9% 10% 9% 11% 10% 10% 10% 12% 10% 10% 11% 10% 10%
FY2015/03 FY2016/03 FY2017/03 FY15/03 FY16/03 FY17/03 FY15/03 FY16/03
Q1 Q2 Q3 Q4 Q1 Q2 Q3 Q4 Q1 Q2 1H 1H 1H Total Total
MFP Japan 55% 58% 56% 46% 67% 74% 67% 58% 68% 77% 56% 72% 72% 53% 66%
Overseas 56% 54% 55% 54% 56% 54% 55% 52% 59% 55% 55% 56% 57% 55% 54%
Total 56% 55% 55% 51% 59% 59% 59% 53% 61% 61% 56% 60% 61% 54% 57%
Office Printer Japan 89% 88% 91% 86% 90% 88% 88% 85% 90% 88% 88% 89% 89% 88% 88%
Overseas 69% 70% 68% 66% 69% 68% 65% 67% 67% 65% 69% 69% 66% 68% 68%
Total 78% 79% 78% 75% 79% 77% 76% 76% 78% 77% 78% 78% 78% 77% 77%
PP Japan 63% 54% 61% 52% 58% 59% 60% 51% 57% 56% 58% 59% 56% 57% 57%
Overseas 62% 59% 62% 57% 58% 59% 57% 53% 59% 55% 60% 56% 57% 60% 57%
Total 62% 58% 62% 56% 58% 59% 57% 53% 59% 55% 60% 56% 57% 59% 57%

(C)2016 Ricoh Company, Ltd. All Rights Reserved 24October 27, 2016
Appendix: Historical Data (2)
MFP & printer y-o-y (Office Imaging and Production Printing)
*Total hardware and non-hardware sales of MFP, Office printer, PP (excluding sales of solutions and third party products)
*By value
< Hardware > FY2015/03 FY2016/03 FY2017/03 FY15/03 FY16/03 FY17/03 FY15/03 FY16/03
Q1 Q2 Q3 Q4 Q1 Q2 Q3 Q4 Q1 Q2 1H 1H 1H Total Total
MFP&Printer Japan -2% +7% +0% -6% +4% -7% +2% -2% -2% +2% +2% +0% -0% -1% -1%
(Office+PP) Overseas +1% +9% +6% +2% +9% +6% +0% -0% -18% -18% +5% +7% -18% +4% +3%
(Forex excluded) -4% +4% -4% -5% +0% -3% -4% +3% -8% -3% +0% -1% -5% -2% -1%
Total +0% +9% +4% -1% +8% +4% +1% -1% -15% -15% +4% +6% -15% +3% +3%
(Forex excluded) -3% +5% -3% -5% +1% -3% -2% +1% -7% -2% +1% -1% -4% -2% -1%
< Non-hardware >
MFP&Printer Japan -6% -1% -5% -8% +0% -5% -4% -1% -4% -1% -4% +3% -2% -5% -2%
(Office+PP) Overseas +2% +5% +6% +5% +6% +5% -2% -8% -13% -18% +4% +18% -15% +4% +0%
(Forex excluded) -3% -0% -3% -1% -1% -2% +2% -4% -2% -2% -1% -1% -2% -2% -1%
Total -0% +3% +2% +1% +4% +2% -2% -7% -10% -13% +1% +13% -11% +1% -1%
(Forex excluded) -4% -1% -4% -3% -1% -3% +0% -4% -3% -2% -2% -2% -2% -3% -1%

(C)2016 Ricoh Company, Ltd. All Rights Reserved 25October 27, 2016
Appendix: Historical Data (3)
MFP & printer y-o-y (Office Imaging)
*Cut sheet PP, Continuous form PP, Wide format (excluding sales of solutions and third party products)
*By value
< Hardware > FY2015/03 FY2016/03 FY2017/03 FY15/03 FY16/03 FY17/03 FY15/03 FY16/03
Q1 Q2 Q3 Q4 Q1 Q2 Q3 Q4 Q1 Q2 1H 1H 1H Total Total
MFP&Printer Japan -3% +6% +1% -6% +2% -6% +2% -4% -3% -1% +1% -1% -2% -1% -1%
(Office Imaging) Overseas -0% +11% +8% +4% +6% +2% -5% -4% -20% -19% +5% +4% -19% +6% -0%
(Forex excluded) -5% +6% -2% -3% -2% -6% -9% +0% -10% -3% +0% -4% -7% -1% -4%
Total -1% +10% +6% +0% +5% +1% -4% -4% -16% -16% +4% +3% -16% +3% -1%
(Forex excluded) -4% +6% -1% -4% -1% -6% -7% -1% -9% -3% +1% -4% -6% -1% -4%
MFP Japan -3% +9% +4% -5% +2% -3% -0% -5% -3% -3% +2% -0% -3% +0% -2%
Overseas -1% +11% +7% +2% +6% +2% -6% -3% -20% -19% +5% +4% -20% +5% -1%
(Forex excluded) -6% +6% -3% -5% -2% -7% -10% +1% -11% -4% -0% -5% -7% -2% -5%
Total -2% +10% +6% -1% +5% +1% -5% -3% -17% -17% +4% +3% -17% +3% -1%
(Forex excluded) -5% +6% -0% -5% -1% -6% -8% -1% -9% -4% +0% -4% -6% -1% -4%
Office PrinterJapan -14% -13% -36% -16% +4% -17% +23% +10% -4% +9% -14% -8% +3% -20% +4%
Overseas +15% +11% +16% +25% +6% +11% +5% -9% -12% -15% +13% +9% -13% +17% +3%
(Forex excluded) +10% +6% +6% +16% -2% +3% +5% -4% -1% +2% +8% +0% +1% +10% +0%
Total +7% +3% +1% +11% +6% +4% +8% -4% -10% -9% +5% +5% -10% +5% +3%
(Forex excluded) +3% -1% -6% +5% -1% -3% +8% -0% -1% +4% +1% -2% +1% +0% +1%
PP * Japan +21% +23% -23% -12% +20% -15% +10% +15% +12% +26% +22% +0% +19% -2% +7%
Overseas +13% -2% -8% -9% +26% +28% +37% +18% -8% -16% +5% +27% -12% -3% +27%
(Forex excluded) +8% -7% -17% -17% +16% +18% +34% +18% +3% -0% -0% +17% +1% -10% +21%
Total +14% +1% -10% -10% +25% +22% +33% +18% -6% -12% +7% +23% -9% -3% +24%
(Forex excluded) +10% -3% -18% -16% +17% +13% +31% +17% +4% +2% +3% +15% +3% -9% +19%
(C)2016 Ricoh Company, Ltd. All Rights Reserved 26October 27, 2016
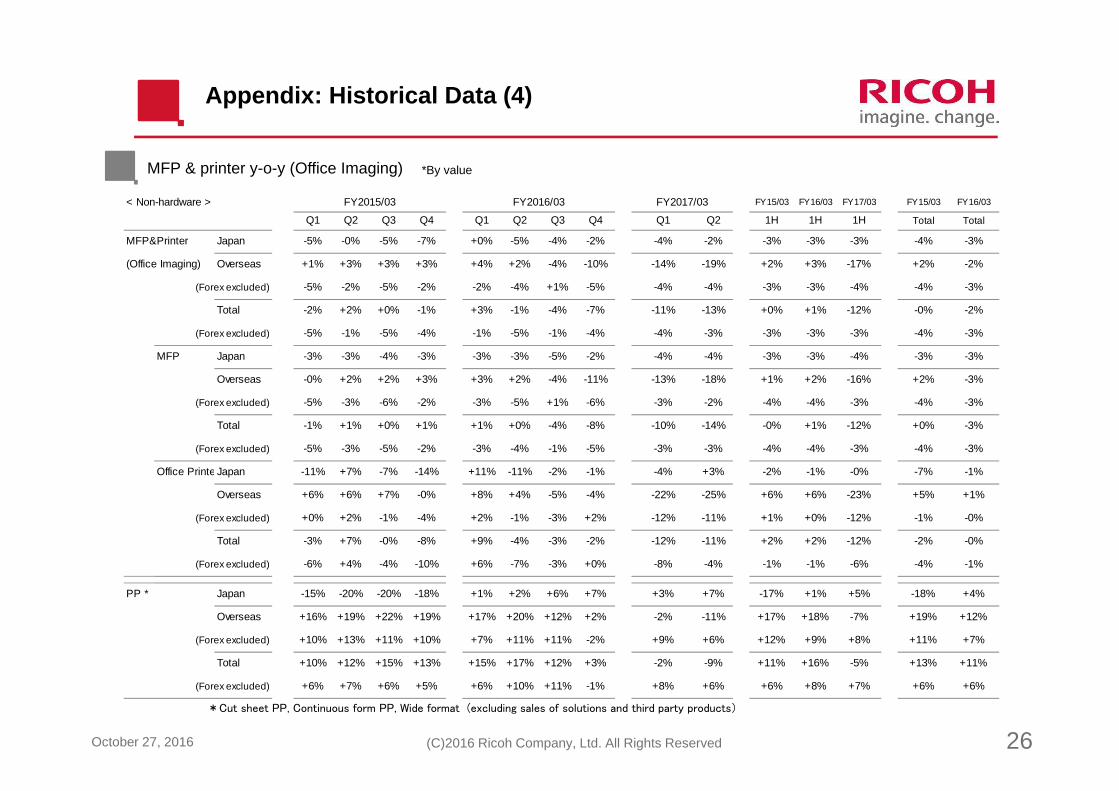
Appendix: Historical Data (4)
MFP & printer y-o-y (Office Imaging)
*Cut sheet PP, Continuous form PP, Wide format (excluding sales of solutions and third party products)
*By value
< Non-hardware > FY2015/03 FY2016/03 FY2017/03 FY15/03 FY16/03 FY17/03 FY15/03 FY16/03
Q1 Q2 Q3 Q4 Q1 Q2 Q3 Q4 Q1 Q2 1H 1H 1H Total Total
MFP&Printer Japan -5% -0% -5% -7% +0% -5% -4% -2% -4% -2% -3% -3% -3% -4% -3%
(Office Imaging) Overseas +1% +3% +3% +3% +4% +2% -4% -10% -14% -19% +2% +3% -17% +2% -2%
(Forex excluded) -5% -2% -5% -2% -2% -4% +1% -5% -4% -4% -3% -3% -4% -4% -3%
Total -2% +2% +0% -1% +3% -1% -4% -7% -11% -13% +0% +1% -12% -0% -2%
(Forex excluded) -5% -1% -5% -4% -1% -5% -1% -4% -4% -3% -3% -3% -3% -4% -3%
MFP Japan -3% -3% -4% -3% -3% -3% -5% -2% -4% -4% -3% -3% -4% -3% -3%
Overseas -0% +2% +2% +3% +3% +2% -4% -11% -13% -18% +1% +2% -16% +2% -3%
(Forex excluded) -5% -3% -6% -2% -3% -5% +1% -6% -3% -2% -4% -4% -3% -4% -3%
Total -1% +1% +0% +1% +1% +0% -4% -8% -10% -14% -0% +1% -12% +0% -3%
(Forex excluded) -5% -3% -5% -2% -3% -4% -1% -5% -3% -3% -4% -4% -3% -4% -3%
Office PrinterJapan -11% +7% -7% -14% +11% -11% -2% -1% -4% +3% -2% -1% -0% -7% -1%
Overseas +6% +6% +7% -0% +8% +4% -5% -4% -22% -25% +6% +6% -23% +5% +1%
(Forex excluded) +0% +2% -1% -4% +2% -1% -3% +2% -12% -11% +1% +0% -12% -1% -0%
Total -3% +7% -0% -8% +9% -4% -3% -2% -12% -11% +2% +2% -12% -2% -0%
(Forex excluded) -6% +4% -4% -10% +6% -7% -3% +0% -8% -4% -1% -1% -6% -4% -1%
PP * Japan -15% -20% -20% -18% +1% +2% +6% +7% +3% +7% -17% +1% +5% -18% +4%
Overseas +16% +19% +22% +19% +17% +20% +12% +2% -2% -11% +17% +18% -7% +19% +12%
(Forex excluded) +10% +13% +11% +10% +7% +11% +11% -2% +9% +6% +12% +9% +8% +11% +7%
Total +10% +12% +15% +13% +15% +17% +12% +3% -2% -9% +11% +16% -5% +13% +11%
(Forex excluded) +6% +7% +6% +5% +6% +10% +11% -1% +8% +6% +6% +8% +7% +6% +6%
(C)2016 Ricoh Company, Ltd. All Rights Reserved 27October 27, 2016
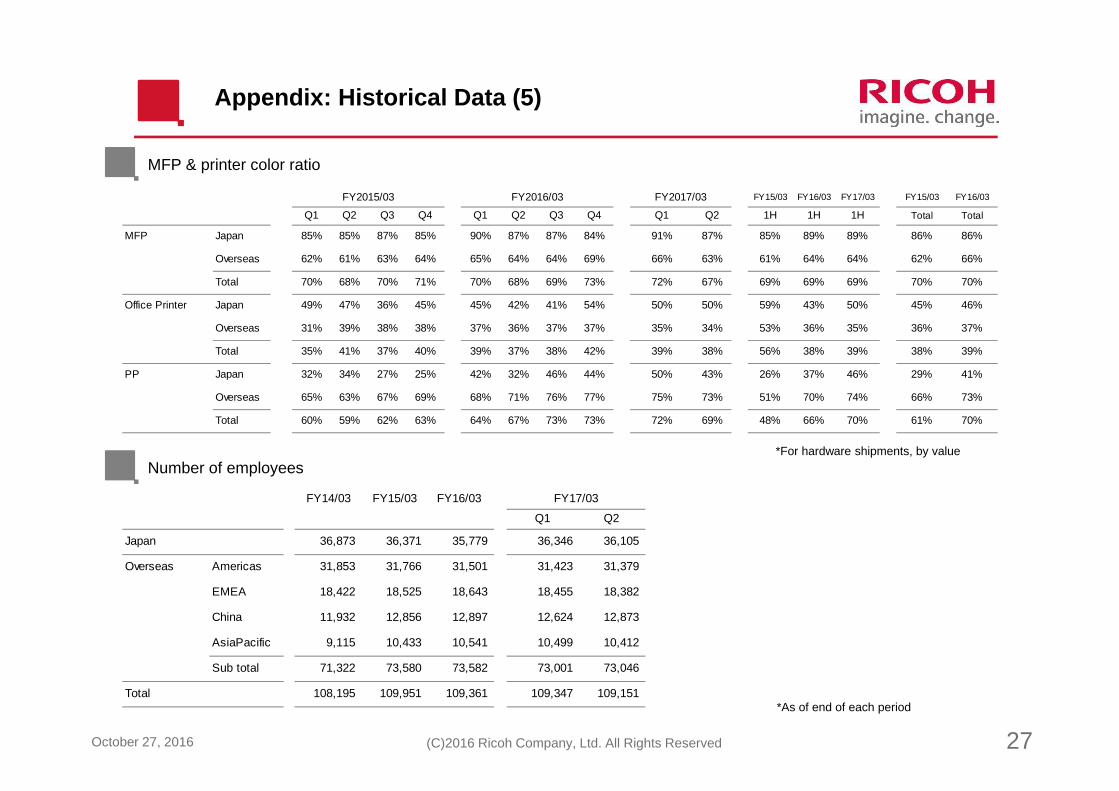
Appendix: Historical Data (5)
MFP & printer color ratio
Number of employees*For hardware shipments, by value
*As of end of each period
FY2015/03 FY2016/03 FY2017/03 FY15/03 FY16/03 FY17/03 FY15/03 FY16/03
Q1 Q2 Q3 Q4 Q1 Q2 Q3 Q4 Q1 Q2 1H 1H 1H Total Total
MFP Japan 85% 85% 87% 85% 90% 87% 87% 84% 91% 87% 85% 89% 89% 86% 86%
Overseas 62% 61% 63% 64% 65% 64% 64% 69% 66% 63% 61% 64% 64% 62% 66%
Total 70% 68% 70% 71% 70% 68% 69% 73% 72% 67% 69% 69% 69% 70% 70%
Office Printer Japan 49% 47% 36% 45% 45% 42% 41% 54% 50% 50% 59% 43% 50% 45% 46%
Overseas 31% 39% 38% 38% 37% 36% 37% 37% 35% 34% 53% 36% 35% 36% 37%
Total 35% 41% 37% 40% 39% 37% 38% 42% 39% 38% 56% 38% 39% 38% 39%
PP Japan 32% 34% 27% 25% 42% 32% 46% 44% 50% 43% 26% 37% 46% 29% 41%
Overseas 65% 63% 67% 69% 68% 71% 76% 77% 75% 73% 51% 70% 74% 66% 73%
Total 60% 59% 62% 63% 64% 67% 73% 73% 72% 69% 48% 66% 70% 61% 70%
FY14/03 FY15/03 FY16/03 FY17/03
Q1 Q2
Japan 36,873 36,371 35,779 36,346 36,105
Overseas Americas 31,853 31,766 31,501 31,423 31,379
EMEA 18,422 18,525 18,643 18,455 18,382
China 11,932 12,856 12,897 12,624 12,873
AsiaPacific 9,115 10,433 10,541 10,499 10,412
Sub total 71,322 73,580 73,582 73,001 73,046
Total 108,195 109,951 109,361 109,347 109,151

(C)2016 Ricoh Company, Ltd. All Rights Reserved 28October 27, 2016
New Products (Imaging & Solutions - Document)
FY2015/03FY2014/03
ColorMFP
MonoMFP
A4MFP
SG 3120SF
MP C8002
MP C6502
MP C6003
MP C4503MP C5503
MP C3003
MP C3503
SP 204SF
MP C305SP
MP 2253
MP 311SFN
MP 3353
SG 3120B SF
MP C2503MP C1803
SP C250SFL
MP301SPF
MP 6054MP 5054
MP 4054
SP 112SU
MP C401SP C250SF
SP 3600SF
SP 4510SF
MP 401SPF
MP 3054
MP 2554
MP 3554
MP C306Z SP
MP 305+ SPF
FY2016/03 FY2017/03
MP C6004MP C4504 MP C5504
MP C3004 MP C3504 MP C2504
MP 6503MP 7503
MP 9003
MP C6503 MP C8003
NEW NEW
(C)2016 Ricoh Company, Ltd. All Rights Reserved 29October 27, 2016
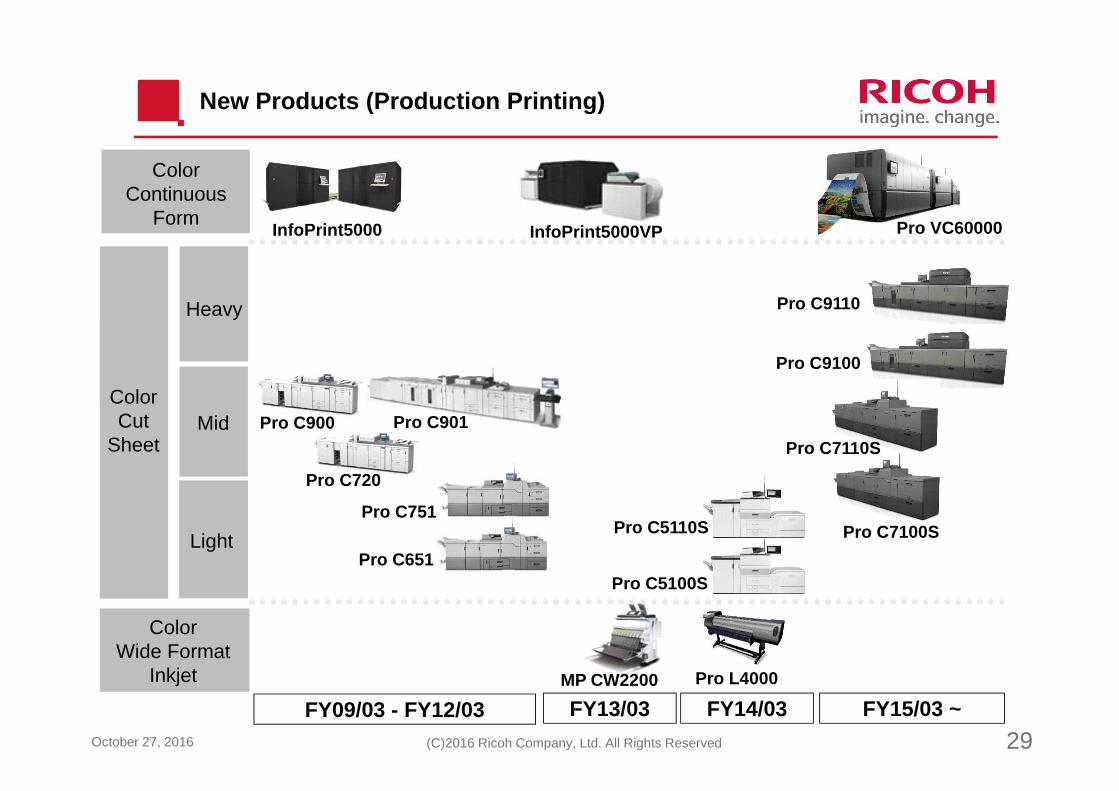
New Products (Production Printing)
CutSheetColorCut
Sheet
ColorContinuous
Form
Light
Mid
FY09/03 - FY12/03
ColorWide Format
Inkjet
Pro C900
Pro C720
InfoPrint5000
Pro L4000
InfoPrint5000VP
Pro C901
MP CW2200
Pro C651
Pro C5110S
Pro C5100S
FY13/03 FY14/03 FY15/03 ~
Pro C751
Heavy
Pro C7100S
Pro VC60000
Pro C9110
Pro C9100
Pro C7110S

(C)2016 Ricoh Company, Ltd. All Rights Reserved 30October 27, 2016 (C)2015 Ricoh Company, Ltd. All Rights Reserved 30
http://www.ricoh.com/


![FY2017 Financial Results · 2018-05-21 · ©2018 Topcon Corporation 5 FY2017 Financial Results by Business [Consolidated] FY2016 FY2017](https://static.fdocuments.us/doc/165x107/5f7157b8a702f55df61cd566/fy2017-financial-results-2018-05-21-2018-topcon-corporation-5-fy2017-financial.jpg)

