Conservation priorities for freshwater biodiversity: The Key ...
13
Conservation priorities for freshwater biodiversity: The Key Biodiversity Area approach refined and tested for continental Africa R.A. Holland ⇑ , W.R.T. Darwall, K.G. Smith Global Species Programme, IUCN (International Union for Conservation of Nature), 219c Huntingdon Road, Cambridge CB3 0DL, UK article info Article history: Received 21 January 2011 Received in revised form 4 January 2012 Accepted 10 January 2012 Available online 17 February 2012 Keywords: Key Biodiversity Areas Protected Areas Freshwaters Africa Red List Conservation Conservation planning abstract Freshwater ecosystems represent one of the most threatened broad habitat types globally. Despite con- taining around a third of all vertebrates, area-based approaches to conservation planning rarely include freshwater species as an explicit target for conservation. Here we describe and apply a globally applicable methodology comparable to those for other groups (i.e. Important Bird Areas) to identify river and lake catchments that represent, or contain, freshwater Key Biodiversity Areas. We discuss the rationale behind the methodology and propose appropriate definitions and quantitative threshold values for the selection criteria. Thresholds are developed through spatial analysis of species information for four comprehen- sively assessed freshwater taxonomic groups in continental Africa, comprising 4203 species, as recently assessed for the IUCN Red List of Threatened Species™. To illustrate application of the methodology fresh- water Key Biodiversity Areas are identified across continental Africa, and conservation planning software used to prioritise a network of catchments that captures 99% of the total species complement within catchments covering ca. 20% of the total land area. Within these prioritised catchments only 19% of river length falls within existing Protected Areas suggesting that, given the high connectivity within freshwa- ter ecosystems and their dependence upon catchment management for effective conservation, modifica- tion or expansion of the protected area network is required to increase effective conservation of freshwater species. By applying this methodology, gaps in the coverage of freshwater species by existing Protected Areas can be identified and used to inform conservation policy and investment to ensure it is inclusive of, and effective for, freshwater biodiversity. Ó 2012 Elsevier Ltd. All rights reserved. 1. Introduction Although occupying less that one per cent of the earth’s surface, freshwater ecosystems contribute disproportionately to global bio- diversity, containing around one third of all vertebrates (Dudgeon et al., 2006; Strayer and Dudgeon, 2010), and providing ecosystem goods and services estimated to be worth trillions of dollars annually (Postel and Carpenter, 1997; Millennium Ecosystem Assessment, 2005). Growth of the human population and increased socio-economic development have led to severe pressures being placed on freshwater systems globally (Vörösmarty et al., 2010), leading to an estimated extinction risk amongst freshwater species that is significantly higher than found terrestrially (Dudgeon et al., 2006; Darwall et al., 2009; WWF, 2010). For example Ricciardi and Rasmussen (1999) estimate that extinction rates of freshwater ani- mals in North America may be fives times higher than that found in terrestrial habitats. Across Europe, assessments for the IUCN Red List (IUCN, 2010) indicate significantly higher numbers of threa- tened freshwater molluscs (44%) and fish (37%) than mammals (15%), reptiles (19%), and amphibians (17%). Historically fresh water has been viewed as a human resource to be exploited (Palmer, 2010), such that over 50% of available water is now cap- tured by humans, and the natural morphology, flow regime and biogeochemical cycles of many freshwater systems are disrupted (Jackson et al., 2001; Nilsson et al., 2005; Strayer and Dudgeon, 2010). In order to halt the decline in biodiversity and the associ- ated loss of services there is a need to legitimise freshwater species as users of water (Naiman et al., 2002) and to identify and prioritise areas for conservation of freshwater biodiversity (Moilanen, 2007; Nel et al., 2009a; Linke et al., 2011). The establishment of Protected Areas (PAs) has become an important mechanism for the conservation of biodiversity (Langhammer et al., 2007; Gaston et al., 2008) as habitat loss and degradation are acknowledged as being amongst the principle threats to biodiversity globally (Vié et al., 2009). With a new global target for coverage by PAs set at 17% for terrestrial habitats and in- land water following the 10th meeting of the Conference of the Par- ties to the Convention on Biological Diversity there is a need to expand the network in a strategic way (Margules and Pressey, 2000; Eken et al., 2004; Rodrigues et al., 2004a). Locations of new PAs have been identified either for pragmatic reasons (Margules 0006-3207/$ - see front matter Ó 2012 Elsevier Ltd. All rights reserved. doi:10.1016/j.biocon.2012.01.016 ⇑ Corresponding author. Tel.: +44 (0)1223 814716. E-mail address: [email protected] (R.A. Holland). Biological Conservation 148 (2012) 167–179 Contents lists available at SciVerse ScienceDirect Biological Conservation journal homepage: www.elsevier.com/locate/biocon
Transcript of Conservation priorities for freshwater biodiversity: The Key ...

Biological Conservation 148 (2012) 167–179
Contents lists available at SciVerse ScienceDirect
Biological Conservation
journal homepage: www.elsevier .com/ locate /biocon
Conservation priorities for freshwater biodiversity: The Key Biodiversity Areaapproach refined and tested for continental Africa
R.A. Holland ⇑, W.R.T. Darwall, K.G. SmithGlobal Species Programme, IUCN (International Union for Conservation of Nature), 219c Huntingdon Road, Cambridge CB3 0DL, UK
a r t i c l e i n f o
Article history:Received 21 January 2011Received in revised form 4 January 2012Accepted 10 January 2012Available online 17 February 2012
Keywords:Key Biodiversity AreasProtected AreasFreshwatersAfricaRed ListConservationConservation planning
0006-3207/$ - see front matter � 2012 Elsevier Ltd. Adoi:10.1016/j.biocon.2012.01.016
⇑ Corresponding author. Tel.: +44 (0)1223 814716.E-mail address: [email protected] (R.A. Holl
a b s t r a c t
Freshwater ecosystems represent one of the most threatened broad habitat types globally. Despite con-taining around a third of all vertebrates, area-based approaches to conservation planning rarely includefreshwater species as an explicit target for conservation. Here we describe and apply a globally applicablemethodology comparable to those for other groups (i.e. Important Bird Areas) to identify river and lakecatchments that represent, or contain, freshwater Key Biodiversity Areas. We discuss the rationale behindthe methodology and propose appropriate definitions and quantitative threshold values for the selectioncriteria. Thresholds are developed through spatial analysis of species information for four comprehen-sively assessed freshwater taxonomic groups in continental Africa, comprising 4203 species, as recentlyassessed for the IUCN Red List of Threatened Species™. To illustrate application of the methodology fresh-water Key Biodiversity Areas are identified across continental Africa, and conservation planning softwareused to prioritise a network of catchments that captures 99% of the total species complement withincatchments covering ca. 20% of the total land area. Within these prioritised catchments only 19% of riverlength falls within existing Protected Areas suggesting that, given the high connectivity within freshwa-ter ecosystems and their dependence upon catchment management for effective conservation, modifica-tion or expansion of the protected area network is required to increase effective conservation offreshwater species. By applying this methodology, gaps in the coverage of freshwater species by existingProtected Areas can be identified and used to inform conservation policy and investment to ensure it isinclusive of, and effective for, freshwater biodiversity.
� 2012 Elsevier Ltd. All rights reserved.
1. Introduction
Although occupying less that one per cent of the earth’s surface,freshwater ecosystems contribute disproportionately to global bio-diversity, containing around one third of all vertebrates (Dudgeonet al., 2006; Strayer and Dudgeon, 2010), and providing ecosystemgoods and services estimated to be worth trillions of dollarsannually (Postel and Carpenter, 1997; Millennium EcosystemAssessment, 2005). Growth of the human population and increasedsocio-economic development have led to severe pressures beingplaced on freshwater systems globally (Vörösmarty et al., 2010),leading to an estimated extinction risk amongst freshwater speciesthat is significantly higher than found terrestrially (Dudgeon et al.,2006; Darwall et al., 2009; WWF, 2010). For example Ricciardi andRasmussen (1999) estimate that extinction rates of freshwater ani-mals in North America may be fives times higher than that found interrestrial habitats. Across Europe, assessments for the IUCN RedList (IUCN, 2010) indicate significantly higher numbers of threa-tened freshwater molluscs (44%) and fish (37%) than mammals
ll rights reserved.
and).
(15%), reptiles (19%), and amphibians (17%). Historically freshwater has been viewed as a human resource to be exploited(Palmer, 2010), such that over 50% of available water is now cap-tured by humans, and the natural morphology, flow regime andbiogeochemical cycles of many freshwater systems are disrupted(Jackson et al., 2001; Nilsson et al., 2005; Strayer and Dudgeon,2010). In order to halt the decline in biodiversity and the associ-ated loss of services there is a need to legitimise freshwater speciesas users of water (Naiman et al., 2002) and to identify and prioritiseareas for conservation of freshwater biodiversity (Moilanen, 2007;Nel et al., 2009a; Linke et al., 2011).
The establishment of Protected Areas (PAs) has become animportant mechanism for the conservation of biodiversity(Langhammer et al., 2007; Gaston et al., 2008) as habitat loss anddegradation are acknowledged as being amongst the principlethreats to biodiversity globally (Vié et al., 2009). With a new globaltarget for coverage by PAs set at 17% for terrestrial habitats and in-land water following the 10th meeting of the Conference of the Par-ties to the Convention on Biological Diversity there is a need toexpand the network in a strategic way (Margules and Pressey,2000; Eken et al., 2004; Rodrigues et al., 2004a). Locations of newPAs have been identified either for pragmatic reasons (Margules

168 R.A. Holland et al. / Biological Conservation 148 (2012) 167–179
and Pressey, 2000; Joppa and Pfaff, 2009) or on the basis of ourunderstanding of better known groups, predominantly mammals,birds and amphibians (Brooks et al., 2004; Rodrigues et al.,2004b; Ricketts et al., 2005; Rondinini et al., 2005) in the belief thatthese will act as surrogates for lesser known groups. However, sur-rogacy between taxonomic groups from differing realms (i.e. fresh-water vs. terrestrial) is low (Rodrigues and Brooks, 2007; Darwall etal., 2011) with studies in the United States (Herbert et al., 2010;Lawrence et al., 2011) and Brazil (Nogueira et al., 2010) demon-strating that existing PAs provide significantly less coverage for in-land aquatic species and habitats than for terrestrial ones (Roux etal., 2008; Darwall et al., 2011).
Here we present a framework for identifying Global Key Biodi-versity Areas (KBAs) for freshwater species (termed freshwaterKBA subsequently). The rationale and criteria for identification offreshwater KBAs are extensions of the original concept of Impor-tant Bird Areas (e.g. Grimmett and Jones, 1989) adapted and ap-plied to other taxonomic groups (Eken et al., 2004; Langhammeret al., 2007), with a preliminary framework methodology for iden-tification of freshwater KBAs proposed by Darwall and Vie (2005).KBAs are sites of global significance for conservation of species, de-rived from a set of criteria based on vulnerability and irreplaceabil-ity, standardized globally and applicable across taxonomic groups(Eken et al., 2004; Langhammer et al., 2007). Within this definition,vulnerability refers to the likelihood that species within a site willbe lost over time, and irreplaceability refers to the spatial optionsavailable for conservation of particular species (Langhammeret al., 2007). The aim of the KBA methodology presented here isidentification of all globally significant sites that contain speciesrequiring conservation action. Once sites qualifying as KBAs havebeen identified, gap analysis (e.g. Rodrigues et al., 2004a; Burgesset al., 2005) can be employed to examine the shortfall in represen-tation of species within the existing PA network. The developmentof a methodology for the identification of freshwater KBAs can beseen as critical to inform the strategic expansion of the existingPA network for freshwater species as it provides a focus on thosesites of the highest global significance.
Given the limited resources available for conservation, havingidentified KBAs, approaches based on expert knowledge and sys-tematic conservation planning (e.g. Amis et al., 2009; Nel et al.,2009a,b; Beger et al., 2010; Esselman and Allan, 2011; Rivers-Moore et al., 2011 Roux et al., 2008; Turak and Linke, 2011) canthen be used to prioritise investment. Recent years have seen agrowing interest in the application of conservation planning tech-niques, developed primarily for terrestrial and marine systems, forsetting freshwaters conservation targets (Linke et al., 2011). Theapplication of existing techniques to freshwater systems presentsnew challenges, primarily relating to connectivity within the widerlandscape (Hermoso et al., 2011; Nel et al., 2011). The identifica-tion of KBAs and the application of conservation planning ap-proaches can be seen as having a synergistic relationship wherethe former identifies sites that are important for the conservationof species diversity and the latter prioritises amongst sites to iden-tify a practical and effective network of protected or managedareas.
We consider catchments identified using the framework pre-sented here as ‘‘potential’’ freshwater KBAs for a number of rea-sons. If a species meets any of the criteria that would trigger KBAqualification, expert knowledge must be used to refine informationabout the species, prioritising the most important catchments, orareas within those catchments, across its range. To shift statusfrom a potential to confirmed freshwater KBA site designationshould ideally be approved through workshops involving stake-holders (e.g. national, regional and local government, NGOs, localusers, community groups). Through this engagement conservationplanning principles may be used to design a national or regional
reserve network that considers biodiversity targets within the so-cial, economic and political context (Margules and Pressey, 2000)thus ensuring local engagement and approval of the process (Bar-muta et al., 2011). While KBAs are identified using a set of globalstandards their protection/management depends on local imple-mentation. Often they exist outside the formal Protected Areanetwork and so such engagement is key. The process for registra-tion of confirmed KBAs is currently being examined by the WorldCommission on Protected Areas and the IUCN Species SurvivalCommission leading to the development of a global database offormally approved KBAs.
The aim of the current study is to propose criteria to identifyfreshwater KBAs and to demonstrate their application by identify-ing a network of potential freshwater KBAs across continental Afri-ca. In doing so, a primary consideration is to align our work withcriteria for the identification of KBAs for other taxa, so that the con-servation community can present a clear rationale across taxo-nomic groups for the identification of these sites to decisionmakers. Building on the work of Darwall and Vie (2005), we pro-pose and test quantitative thresholds and examine whetherthreshold values based on the knowledge of other groups areappropriate for a range of freshwater taxa. We apply these criteriato data for all known species of freshwater crabs, fish, molluscs andodonates (dragonflies and damselflies) recorded from continentalAfrica for each group individually, and identify potential freshwa-ter KBAs based on data for all four groups. Finally, we use optimi-zation software commonly used in conservation planning toidentify a set of potential freshwater KBAs that would collectivelyachieve species targets in an efficient manner.
2. Materials and methods
2.1. General methods
Data were collected based on a method developed by the IUCNGlobal Species Programme’s Freshwater Biodiversity Unit to assessthe conservation status of freshwater species. The Red Listing pro-cess is based on regional workshops that are highly participatory,involving local experts and stakeholders and as such represents amodel for local engagement that could be used in the identificationof freshwater KBAs. We describe a 7 step process first outlined byDarwall and Vie (2005) and focus on the development and testingof criteria for Step 5. Of the seven steps described, five have beenincorporated into this analysis with Steps 3 and 6 omitted due todata limitations.
Step 1: Define the geographic boundaries within which to iden-tify important sites.
The extent of our study is defined as continental Africa. Thiscontinent represents the first for which IUCN has assessed the dis-tribution and conservation status of all known freshwater crabs,fish, molluscs and odonates. These four taxonomic groups wereidentified as priorities for assessment due to the availability of reli-able information, their role in the maintenance of healthy freshwa-ter systems, and the important contribution that they make for theprovision of ecosystem goods and services and maintenance oflivelihoods.
Step 2: Define the wider ecological context of the designatedassessment area.
Defining the wider context is important in determining thescale at which conservation action should take place. Rivers andlakes cannot be evaluated in isolation from the surrounding

R.A. Holland et al. / Biological Conservation 148 (2012) 167–179 169
landscape. In some instances action can be focussed on specificareas, whereas in other instances action must be at broader scalesto consider the entirety of the catchment and connectivity in thebroader landscape (i.e. river basins), often extending across na-tional boundaries, to address ecosystem processes, threats, andmanagement issues arising beyond the assessment area. Specieswere mapped to 7079 catchments comprising continental Africa,as delineated by a cleaned version of Hydro1k Elevation DerivativeDatabase at level 6 (Appendix Fig. A1). These represent an appro-priate management unit for freshwater systems that incorporateconnectivity with the surrounding landscape both within and be-tween catchments (Luck et al., 2009a). Use of catchment units cap-tures smaller freshwater habitats (e.g. ponds, small streams) thatare within the landscape but are difficult to capture in GIS.
Step 3: Identify and map the distribution of inland water habi-tat types.
The aim of step 3 is to ensure that all habitat types are repre-sented in the final KBA network. For freshwater systems a consis-tent habitat classification has not been developed at thecontinental scale and so this step was not applied in the currentstudy (see Step 6 below).
Step 4: Assemble an inventory of the distribution and conserva-tion status of priority aquatic taxa.
Data on the distribution and conservation status of all knownspecies of freshwater fish, molluscs, odonates and crabs acrosscontinental Africa were collated and assessed at 6 regional work-shops held between 2003 and 2008. In total, 4318 freshwaterspecies were assessed composing 106 crabs, 2946 fish, 562mollusc and 704 odonates. The conservation status of eachspecies was assessed using the IUCN Red List Categories andCriteria: Version 3.1 (IUCN, 2010). For each species, presencewithin a catchment was based on both records from sampling(known distribution), and expert knowledge (inferred distribu-tion). Using these data for each species, ranges were constructedthat represented the likely distribution of the species based ontheir presence within catchments.
Step 5: Apply species based site selection criteria.
Criterion 1. A site is known or thought to hold a significant number ofone or more globally threatened species or other species of conserva-tion concern
This criterion is based on vulnerability and targets species withthe highest risk of extinction. In the current study we use globallythreatened species according to the IUCN Red List of ThreatenedSpecies™ that classifies species into three categories (CriticallyEndangered, Endangered, or Vulnerable) based on a globally ac-cepted set of quantitative criteria (IUCN, 2010). For this criterion‘‘other species of conservation concern’’ can be included, for exam-ple, species that are evolutionary distinct (e.g. EDGE species (Isaacet al., 2007)). The two principle questions that arise for the appli-cation of this criterion are: (i) what is the threshold number ofindividuals of a particular species that are to be present for aKBA to be triggered, and; (ii) how many species of each categoryshould be present for a KBA to be triggered?
Species distribution data in the current study are recorded aspresent within catchments and no information about populationsizes is provided. Data on the numbers of individuals is rarelyavailable for freshwater species so questions relating to thresholdnumbers of individuals (step (i) above) cannot be addressed,although Langhammer et al. (2007) provide provisional thresholds
where population data are available. One method to address thisdata shortfall is through the use of expert knowledge where localexperts identify the most important sites for specific species interms of likely abundance.
For each taxonomic group, catchments were selected as poten-tial freshwater KBAs based on three alternative scenarios; (1) Crit-ically Endangered species present; (2) Critically Endangered orEndangered species present and; (3) Critically Endangered, Endan-gered or Vulnerable species present. We consider that the presenceof a single species classified as Critically Endangered or Endan-gered is sufficient to trigger qualification as a potential freshwaterKBA as these species are at extremely high risk and very high riskof extinction in the wild respectively (IUCN, 2010). Our analysiswas therefore limited to testing differing threshold values for thenumber of species classified as Vulnerable.
To examine whether targeting threatened species providesco-benefits for other taxa within the taxonomic group, randomspecies accumulation curves were generated for each of the fourtaxonomic groups using the ‘‘specaccum’’ function in the R Veganpackage (Oksanen et al., 2010). The percentage of the total speciesinventory captured based on the three scenarios was comparedwith the percentage of the total species inventory captured byrandom selection.
Criterion 2. A site is known or thought to hold non-trivial numbers ofone or more species (or infraspecific taxa as appropriate) of restrictedrange
The importance of this criterion arises from the relationship be-tween the size of a species range and its extinction risk (Purviset al., 2000) with species with small (restricted) ranges more likelyto go extinct than those that are widespread. In the criterion defi-nition the term non-trivial is used to specifically exclude areaswhere species occur as vagrants as these sites will not be priorityconservation targets for that species and will artificially increasethe species range. The current study focuses on globally assessedspecies from the IUCN Red List however as discussed by Darwalland Vie (2005) this criteria could equally be applied to infraspecifictaxa, such as sub-species, or fish stocks specific to individual fresh-water systems.
The principle challenge for applying this criterion is in definingthe area threshold for a species to be classified as restricted range.To define restricted range species two approaches have been sug-gested. Firstly, the use of a percentile approach, for example the25% of species (from each taxonomic group) with the smallestranges qualify as restricted range (Langhammer et al., 2007). Sec-ondly, the use of an absolute threshold approach where any specieswith a distribution range area below a specified value qualifies(Langhammer et al., 2007). Based on knowledge of mammals, birdsand amphibians a value of 50,000 km2 has been suggested as a ro-bust limit (Eken et al., 2004). Research suggests that for mammalsand birds the two approaches yield similar results with around 25%of species being captured based on a threshold of 50,000 km2.However for amphibians the 50,000 km2 threshold capturesaround 60% of species.
To examine application of this criterion to freshwater speciesthe range of each species was calculated based on the total areaof catchments with known or inferred presence of the species.The percentage of species meeting the threshold for restrictedrange was examined iteratively using species range areas be-tween 1000 km2 and 100,000 km2 using incremental steps of1000 km2. To assess the appropriateness of thresholds developedfor other taxonomic groups we examined outputs when applying(1) the 25 percentile of smallest species ranges, and (2) the per-centage of species captured based on a threshold value of50,000 km2.

170 R.A. Holland et al. / Biological Conservation 148 (2012) 167–179
Criterion 3. A site is known or thought to hold a significantcomponent of the group of species that are confined to an appropriatebiogeographic unit or units
Criterion 3 puts species into an ecological context that cannotbe represented by looking at species individually. Heterogeneityof environmental conditions across the globe has led to the devel-opment of assemblages of species endemic to individual biogeo-graphic units (e.g. ecoregions Langhammer et al., 2007). Theseunique species assemblages represent valuable units of biodiver-sity that should be conserved. The rationale behind this criterionis to identify where groups of species restricted in this manner oc-cur as they might not be captured through individual species basedcriteria. Criterion 3 provides a mechanism to identify priority areaswhere there are few threatened species (e.g. due to inaccessibility)but high endemism. The principle challenge under Criterion 3 isidentifying catchments that contain areas of ‘‘contextual speciesrichness’’ defined as areas rich in species restricted to an individualbiogeographic unit (Langhammer et al., 2007).
While thresholds tested for Criterion 1 and 2 are based on theapproaches previously developed for the better known taxonomicgroups (e.g. birds, mammals and amphibians), Criterion 3 is theleast developed of the KBA criteria. Langhammer et al. (2007) de-tail a number of differing methodologies, for example some Impor-tant Bird Areas (IBAs) have been identified based on the selectionof a network of sites that capture all species restricted to a partic-ular biogeographic region. In Turkey, sites qualified as KBAs underthis criterion if 25% of species restricted to a biogeographic unit oc-cur there (Langhammer et al., 2007). Two principle questions arisewhen developing this criterion for freshwater ecosystems; (i) howshould a biogeographic unit be defined and, (ii) how is ‘‘a signifi-cant component of a group of species’’ defined.
Freshwater ecoregions of the world developed by Abell et al.(2008) are used as the biogeographic units in the current study.For each taxonomic group we identified all species that occur ina single freshwater ecoregion. The proportion of ecoregion re-stricted species present within each catchment was then calcu-lated. To establish an appropriate threshold for the proportionof species restricted to a ecoregion we tested values between 1and 100%. The proportion of ecoregions that would includepotential freshwater KBAs and the proportion of catchmentsper ecoregion that would qualify as potential freshwater KBAswere examined.
Criterion 4a. A site is known or thought to be critical for any lifehistory stage of a species
Criterion 4a identifies sites that are essential for the completionof the life cycle of the species. Sites identified under this criterioncould include migration routes, spawning or feeding grounds. Dur-ing the Red List assessment process information on such sites iscollated and coded for each species. Experts can draw upon thisinformation source during the KBA review procedure and willbring their own knowledge to workshops during the prioritisationexercise to identify key areas for management.
Criterion 4b. A site is known or thought to hold more than athreshold number of individuals of a congregatory species
In Criterion 4b the aim is to identify sites that hold, at sometime, a large proportion of the global population of an individualspecies and so are irreplaceable as their loss could have a signifi-cant impact on the species. For freshwater species it is most likelythat this criterion would apply to species congregations alongmigration routes, such as at the mouths of rivers, or at breedinggrounds. Within the literature there is a general consensus that be-tween 1% and 5% of the global population is an appropriate thresh-old for a site to qualify under this criterion (Langhammer et al.,
2007) so this threshold may also be appropriate for catchments.For freshwater species, population data are most commonly onlyavailable for species with a restricted range or for those classifiedas threatened, although even for these species information maynot be spatially explicit. Due to this lack of data, expert knowledgeis an important resource for the identification of sites of impor-tance, stressing the importance of engagement with stakeholdersin the KBA process.
As both Criterion 4a and 4b largely rely on expert knowledgeyet to be obtained through workshops they are not considered infurther detail within the current study.
Step 6: Ensure full representation of inland water habitatsamong those sites selected.
This step represents a ‘‘coarse filter’’ approach to be added as aprecautionary measure (Groves et al., 2002), as protecting siteswithin all habitat types is intended to capture species in poorly sur-veyed areas where existing information is insufficient for applica-tion of Step 5. Several freshwater classification approaches havebeen applied at regional scales using selection criteria that includecondition and connectivity in achieving representation targets (e.g.Thieme et al., 2007; Khoury et al., 2011). Areas with insufficientinformation for application of Step 5 represent priorities forresearch. Due to the lack of a consistent habitat classification acrosscontinental Africa Step 6 was not used in the current study.
Step 7: Ensure inclusion of keystone species.
After identifying a network of potential freshwater KBAs, aninventory of all known species was compiled to identify catch-ments with ecologically important species. The full Red List wasused to identify ecologically important species – those which playimportant roles in the life histories of other species – such as inter-mediate fish hosts for molluc larvae, or that are critical for habitatcreation, maintenance, or nutrient cycling.
2.2. Prioritisation of catchments
The aim of the freshwater KBA methodology presented here isto identify all catchments of global conservation significance. Gi-ven that there are limited funds for conservation investment it isnecessary to prioritise amongst KBAs to produce an efficient re-serve network. In the current study the conservation planning soft-ware MARXAN (Ball et al., 2009) was utilized to prioritise amongsttriggered catchments using a simple set of rules (scenarios) toexamine the efficiency with which species can be representedand overlap with the existing PA network. We stress that thiswas a simple exercise to examine efficiency of representationand we discuss the limitations in detail in the discussion.
As the Red List category indicates the vulnerability of the speciesMARXAN was set up to represent 100% of catchments containingCritically Endangered (CR) species in the final network together with75% of catchments containing Endangered (EN) and 50% of catch-ments containing Vulnerable (VU) species. Targets for other specieswere for representation in at least two disjunct catchments forredundancy to lower extirpation risk. The area (km2) of the catch-ment (min 7.3 km2, max 80,318.7 km2, median 2634.0 km2) wasused as the unit of cost for selection within the prioritised network(Moilanen et al., 2008) to minimize total area for efficiency.
Based on these settings MARXAN was run using three scenariosrelating to the existing PA network and the efficiency of implemen-tation. While few PAs are designed specifically for freshwater spe-cies we considered that the presence of a PA within a catchmentprovides an indication of management potential. The World

R.A. Holland et al. / Biological Conservation 148 (2012) 167–179 171
Database on Protected Areas (IUCN and UNEP-WCMC, 2010) wasused to identify catchments containing PAs. Of the 7079 catch-ments 2790 contain land designated as a PA under the IUCN cate-gories (Dudley, 2008). The total area covered by PAs in thesecatchments was often low (i.e. 27% of PAs incorporate an area ofless than 5% of the catchment) and not congruent with freshwaterhabitats (i.e. 24% of catchments have less than 5% of their total riv-er length within a PA). Although dependent on a number of factorssuch as intensity and type of anthropogenic impact (Paul andMeyer, 2001), once disturbance within a catchment crosses athreshold of ca. 30% there is often a marked decline in the qualityof a river system (Allan, 2004). Therefore in the first scenario, if 70%or more of a catchment intersected within PA boundaries, it wasfixed into the MARXAN solution and could not be removed. Catch-ments where the PA incorporated between 25% and 70% of the totalarea were initially included within the reserve network but thealgorithm was allowed to remove them if a more efficient solutionwas identified.
In the second scenario the constraint imposed by existing PAswas removed. In the final scenario the cost criterion was also re-moved to examine the network of catchments that would be se-lected if the sole aim was to prioritise based on the presence ofspecies and species assemblages of conservation concern. In eachscenario MARXAN was run with 1000 iterations to select an opti-mal reserve network.
3. Results and recommendations
3.1. Definition and thresholds for criteria
3.1.1. Criterion 1For crabs, molluscs, and odonates the inclusion of species clas-
sified as threatened according to the IUCN Red List triggers selec-tion of catchments representing less than 10% of the total landarea (Table 1). For fish, the corresponding figure is 21.64% of the to-tal land area. Although the number of threatened taxa is higher forfish than for other taxonomic groups this is not the principle driverof this difference, as many VU fish species are concentrated withina few catchments (i.e. Lake Victoria). The pattern is driven primar-ily by a small number of wide ranging but VU species for exampleOreochromis machochir, a common and widespread species fromsouthern Africa classified as VU due to risk of hybridisation withthe alien invasive Oreochromis niloticus.
In testing Criterion 1 the principle aim was to examine theimplications of applying a threshold for the number of VU speciesthat must be present for a catchment to qualify as a potentialfreshwater KBA. As demonstrated in Fig. 1, for fish and odonatesthere is a decrease in the total land area captured within potential
Table 1Percentage of land area and, number of threatened taxa qualifying and the percentage of
Group Threatstatus
Qualifying taxa based on the Red Liststatus
Total taxa inAfrica
Crabs CR 2 106CR, EN 12CR, EN, VU 25
Fish CR 113 2946CR, EN 257CR, EN, VU 606
Molluscs CR 49 562CR, EN 112CR, EN, VU 145
Odonates CR 13 704CR, EN 25CR, EN, VU 58
freshwater KBAs up to a threshold value of five VU species. Allcatchments containing more than five VU species also containeither a CR or EN species and would therefore already qualify asa potential freshwater KBA under this criterion. Although the pro-portion of species captured remains consistent with increasingthreshold values (Fig. 1) a threshold set at more than one VU spe-cies could lead to serious omissions in identifying potential fresh-water KBAs. For example, 27 fish classified as VU would not berepresented within any potential freshwater KBA if a threshold va-lue for VU species was applied as they occur in isolation withincatchments with no other qualifying species. A precautionary ap-proach is taken where the presence of any threatened species trig-gers qualification as a potential freshwater KBA. For the limitednumber of wide ranging VU species expert opinion can be usedto identify key areas for conservation action. For example, for O.machochir (VU) conservation action could focus on those catch-ments where barriers to the spread of invasive species exist ormight be imposed, creating strongholds for the remaining popula-tions. For such wide-ranging species, the possibility of triggeringfreshwater KBA qualification based on the presence of a singleVU species maintains the maximum number of conservation plan-ning options.
Based on catchments that would qualify as potential freshwaterKBAs, this criterion would represent >85% of the total speciesinventory of fish, molluscs and odonates across Africa at somepoint in their range (Table 1). For mollusc and odonate species de-spite less than 10% of the total area of continental Africa qualifyingas a potential freshwater KBA, a high proportion of the total speciesinventory for each of these groups is represented. As discussed pre-viously the relatively large area qualifying under this criterion forfish is due to inclusion of a number of widespread VU species.However, based solely on the presence of CR or EN species 81%of the species inventory would be captured in catchments coveringjust 9% of continental Africa. This result suggests that there is thepotential to prioritise a reserve network that can represent a highproportion of species that do not qualify under the freshwater KBAcriteria.
It is possible that this pattern is driven by chance, and thatselecting a comparable number of catchments across continentalAfrica at random would result in a similar proportion of the totalspecies inventory being represented. As can be seen in Fig. 2 for fishand molluscs prioritising based on threatened species is a signifi-cantly better strategy than selecting sites at random. For crabsand odonates the relationship is more equivocal, while more spe-cies are captured than would be expected on average the numberof species falls within the band representing the standard deviation.For these taxonomic groups we conclude that random selection andselection based on threatened species are equally effective at repre-
the total species inventory captured within potential KBAs.
group in % of African landarea
% of total taxa captured in qualifyingarea
0.05 5.660.78 35.851.93 53.77
3.45 48.309.12 81.23
21.64 94.67
1.53 53.564.00 82.568.19 85.59
0.56 55.403.21 73.727.36 84.66
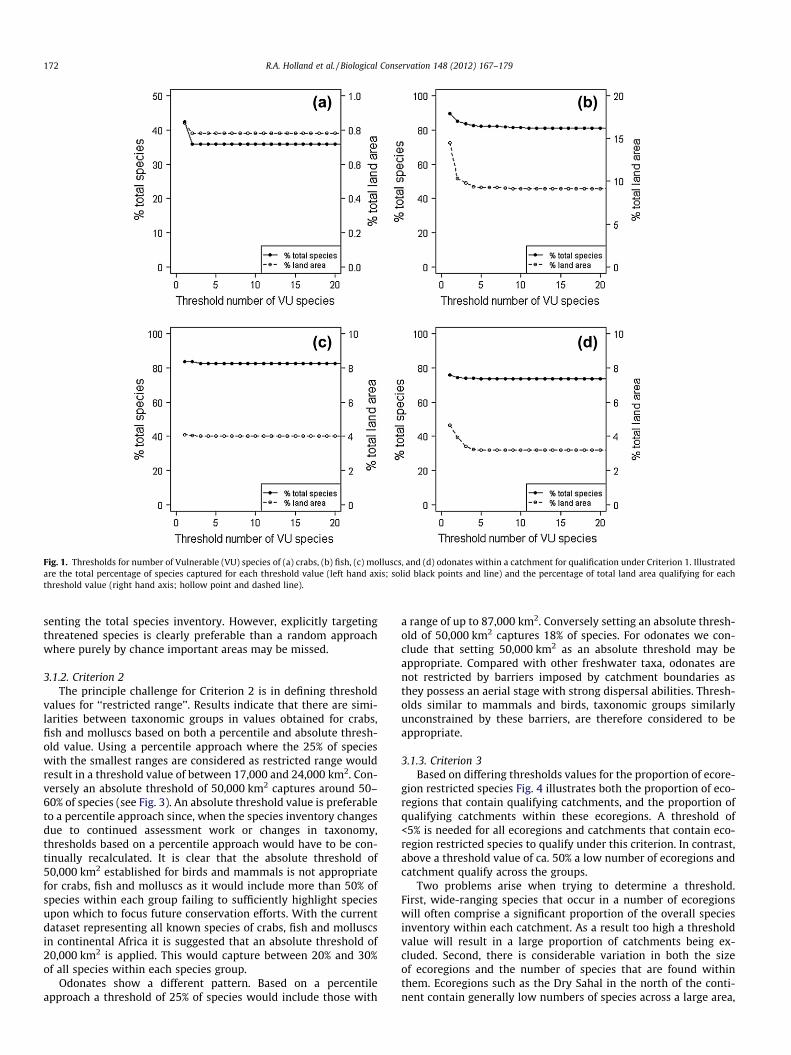
Fig. 1. Thresholds for number of Vulnerable (VU) species of (a) crabs, (b) fish, (c) molluscs, and (d) odonates within a catchment for qualification under Criterion 1. Illustratedare the total percentage of species captured for each threshold value (left hand axis; solid black points and line) and the percentage of total land area qualifying for eachthreshold value (right hand axis; hollow point and dashed line).
172 R.A. Holland et al. / Biological Conservation 148 (2012) 167–179
senting the total species inventory. However, explicitly targetingthreatened species is clearly preferable than a random approachwhere purely by chance important areas may be missed.
3.1.2. Criterion 2The principle challenge for Criterion 2 is in defining threshold
values for ‘‘restricted range’’. Results indicate that there are simi-larities between taxonomic groups in values obtained for crabs,fish and molluscs based on both a percentile and absolute thresh-old value. Using a percentile approach where the 25% of specieswith the smallest ranges are considered as restricted range wouldresult in a threshold value of between 17,000 and 24,000 km2. Con-versely an absolute threshold of 50,000 km2 captures around 50–60% of species (see Fig. 3). An absolute threshold value is preferableto a percentile approach since, when the species inventory changesdue to continued assessment work or changes in taxonomy,thresholds based on a percentile approach would have to be con-tinually recalculated. It is clear that the absolute threshold of50,000 km2 established for birds and mammals is not appropriatefor crabs, fish and molluscs as it would include more than 50% ofspecies within each group failing to sufficiently highlight speciesupon which to focus future conservation efforts. With the currentdataset representing all known species of crabs, fish and molluscsin continental Africa it is suggested that an absolute threshold of20,000 km2 is applied. This would capture between 20% and 30%of all species within each species group.
Odonates show a different pattern. Based on a percentileapproach a threshold of 25% of species would include those with
a range of up to 87,000 km2. Conversely setting an absolute thresh-old of 50,000 km2 captures 18% of species. For odonates we con-clude that setting 50,000 km2 as an absolute threshold may beappropriate. Compared with other freshwater taxa, odonates arenot restricted by barriers imposed by catchment boundaries asthey possess an aerial stage with strong dispersal abilities. Thresh-olds similar to mammals and birds, taxonomic groups similarlyunconstrained by these barriers, are therefore considered to beappropriate.
3.1.3. Criterion 3Based on differing thresholds values for the proportion of ecore-
gion restricted species Fig. 4 illustrates both the proportion of eco-regions that contain qualifying catchments, and the proportion ofqualifying catchments within these ecoregions. A threshold of<5% is needed for all ecoregions and catchments that contain eco-region restricted species to qualify under this criterion. In contrast,above a threshold value of ca. 50% a low number of ecoregions andcatchment qualify across the groups.
Two problems arise when trying to determine a threshold.First, wide-ranging species that occur in a number of ecoregionswill often comprise a significant proportion of the overall speciesinventory within each catchment. As a result too high a thresholdvalue will result in a large proportion of catchments being ex-cluded. Second, there is considerable variation in both the sizeof ecoregions and the number of species that are found withinthem. Ecoregions such as the Dry Sahal in the north of the conti-nent contain generally low numbers of species across a large area,

Fig. 2. Random species accumulation curves for (a) crabs, (b) fish, (c) molluscs, and (d) odonates. The gray band represents the standard deviation based on 1000 runs. Thenumber of species from the total species inventory captured based on Criterion 1 is indicated based on (1) presence of one Critically Endangered species, (2) presence of oneCritically Endangered or Endangered species or (3) presence of one Critically Endangered or Endangered or Vulnerable species.
R.A. Holland et al. / Biological Conservation 148 (2012) 167–179 173
whereas the Lake Tanganyika ecoregion contains high numbers ofendemic species within an comparatively small area. The thresh-old value must be set to not only capture ecoregions such asTanganyika where there are clearly unique assemblages of taxa,but also to pick up those catchments that capture more crypticassemblages of species that may not already receive globalattention.
We suggest a threshold of 25% of species being restricted tothe ecoregion to trigger qualification of a catchment. This repre-sents a compromise that (i) reduces the number of qualifyingcatchments, focussing on those with a species assemblage repre-sentative of the ecoregion and, (ii) still provides a range of catch-ment within ecoregions allowing spatial options for subsequentprioritisation.
3.2. Summary of criteria and thresholds
Box 1 summarizes the criteria and proposed thresholds for theidentification of potential freshwater KBAs examined in the cur-rent study. Fig. 5 spatially summarizes for each of the four taxo-nomic groups the catchments that are triggered as potentialfreshwater KBAs. In total, for the four combined taxa, 2309 catch-ments qualify covering 34.28% of the total land area of continen-tal Africa and capturing 99% of all the taxa at some point in theirrange (Fig. 6a). Of these priority catchments a total of 21.30% ofthe land area and 15.11% of the river length are within an existingPA.
Box 1. Summary of KBA criteria and thresholds for freshwatertaxa.
Criterion 1: A site is known or thought to hold a significantnumber of one or more globally threatened species or otherspecies of conservation concern.
Threshold: The presence of one or more CR, EN or VU spe-
cies will trigger the site as a potential freshwater KBA.
Criterion 2: A site is known or thought to hold non-trivialnumbers of one or more species (or infraspecific taxa as appro-priate) of restricted range.
Threshold: A threshold value of 20,000 km2 should be
applied for crabs, fish and molluscs and a threshold value
of 50,000 km2 applied for odonates.
Criterion 3: A site is known or thought to hold a significantcomponent of the group of species that are confined to anappropriate biogeographic unit or units.Threshold: To trigger qualification at least 25% of the total
species from a specific taxonomic group must be
restricted to the freshwater ecoregion in which the catch-
ment is located.
3.3. Coverage
Within the qualifying catchments 100% of crab, 99.2% of fish,99.1% of mollusc and 99.7% of odonate species across continental

Fig. 3. Percentile and absolute thresholds for the identification of range restricted species for: (a) crabs, (b) fish, (c) molluscs and (d) odonates.
174 R.A. Holland et al. / Biological Conservation 148 (2012) 167–179
Africa were represented to some degree. Based on data recordedfor the IUCN Red List there was no significant omission of speciesof known ecological importance (Step 7).
Species restricted to a single freshwater ecoregion were identi-fied and none were found to fall outside the network of potentialfreshwater KBAs. The importance of this check is that within someecoregions species may not have been picked up, despite being re-stricted to a single ecoregion, as they do not co-occur with largenumbers of other ecoregion restricted species (Langhammeret al., 2007). However, in all cases such species were found to al-ready qualify under either Criterion 1 or 2.
3.4. Prioritisation within the network
MARXAN prioritised between 1287 and 1343 catchments, cov-ering between 17.14% and 21.46% of the total land area (Fig. 6)depending on the simple scenarios considered. The resulting net-work based on any of the three scenarios captures identical num-bers of the total species inventory with a substantial reduction intotal land area covered (from 34.28%) indicating that it is possibleto design a more efficient (with respect to area) reserve networkwithin the qualifying freshwater KBAs.
In the first scenario, which was based on coverage by existingPAs, 30.99% of the total area of catchments prioritised for freshwa-ter biodiversity fell within a PA. Based on the intersect between theriver network and existing PAs 19.33% of the total river length forthese prioritised catchments falls within a PA, although this will
include rivers that act as boundaries of existing PAs so may bean overestimation.
4. Discussion
The main driver for development of the methodology presentedis a commitment by the World Commission on Protected Areas andthe IUCN Species Survival Commission to produce, by 2012, a con-sistent and defensible methodology to allow the identification ofsites of importance for conservation of species, under the umbrellaterminology Key Biodiversity Areas. The thresholds and criteriapresented here are the first for identifying global KBAs for freshwa-ter species within this KBA framework.
This methodology can now be applied to ensure that importantconservation sites in inland waters are identified as part of generaldevelopment and conservation actions. With the greatly increasingavailability of spatial data sets on freshwater species (Darwallet al., 2009) it should now be possible to apply this approachwidely across many parts of the world. As well as identifyingnew areas, the method can aid gap analysis in regions where theprocess of identifying important sites for freshwater is alreadyongoing (e.g. Nel et al., 2011). The method can also form the basisfor establishing thresholds for other freshwater species as newdata become available. The framework of the methodology couldbe adapted for use at national scale, for example by using data fromsub-global assessments of the conservation status of species (IUCN,

Fig. 4. The proportion of ecoregions and mean proportion of catchments per ecoregion qualifying based on differing threshold values for the proportion of (a) crabs, (b) fish,(c) molluscs and (d) odonates restricted to a single ecoregion. Proportions area calculated based on total number of catchments and ecoregions that could qualify as theycontain 1 or more ecoregion restricted species.
R.A. Holland et al. / Biological Conservation 148 (2012) 167–179 175
2003), although these should not be considered Global KBAs asthere are often difference between regional and global assessmentsof the conservation status of species. More specifically, the methodcan help Ramsar country focal points to identify potential areas forfuture designation as Wetlands of International Importance. Thisallows for broadening the scope of Ramsar sites which are cur-rently often designated on the presence of birds. Similarly, theKBA methodology has been suggested as one process with whichto identify World Heritage sites based on natural criteria (Fosteret al., 2010). KBAs are also incorporated within tools such as theIntegrated Biodiversity Assessment Tool for Business (www.ibat-forbusiness.org) that is specifically aimed at ensuring decisionsaffecting critical natural habitats are informed by the best scientificinformation. The KBA approach is aimed at identifying those sitesthat are global priorities for the conservation of vulnerable and/or irreplaceable species, and species assemblages that best repre-sent individual ecoregions. The approach is not aimed at conserva-tion of those many other widespread and/or common speciesalthough in many, but not all, cases they will also benefit.
Having identified potential freshwater KBAs at the catchmentscale, conservation of species can be achieved through a contin-uum of actions ranging from total exclusion zones at the site scalewithin a catchment, through to multiple use management at thecatchment scale and beyond. This methodology defines catch-ments that contain critical species and species assemblages, anddoes not infer the scales or places where conservation and man-agement actions should take place. KBAs are coarse-scale areasthat contain species and species assemblages of conservation con-cern. Finer-scale and more comprehensive information can be used
subsequently to define areas for conservation and managementactivities. Abell et al. (2007) present a scheme based on threenested levels of protection where (i) ‘‘Freshwater Focal Areas’’ de-scribe the specific feature requiring protection and can be quiterestrictive about activities that can take place within them, (ii)‘‘Critical Management Zones’’ are those places where managementis essential to maintain functionality of the focal area, and (iii) the‘‘Catchment Management zone’’ includes all upstream catchmentsof the critical management zone where basic catchment manage-ment principles are applied. By ensuring that there is an appropri-ate combination of management practices, such that the qualityand quantity of water is sufficient to meet the requirements of spe-cies, freshwater systems can be managed for both the maintenanceof biodiversity in its own right and also as a natural resource(Dugan et al., 2006; Dodds and Oakes, 2008; Luck et al., 2009b;Rebelo et al., 2009).
Linear features such as rivers are often used as boundaries fordelineating PAs (Abell et al., 2007) with freshwater features rarelyidentified as conservation targets in their own right. In South AfricaNel et al. (2007) demonstrated that only 50% of rivers within the PAnetwork could be considered to be intact. It may therefore be nec-essary to refine the extent of KBAs identified for other taxonomicgroups (e.g. IBAs) or alter boundaries of existing PAs for the targetedprotection of freshwater species, and to examine managementpractices within existing PAs to ensure protection of freshwaterspecies. Based on the freshwater criteria outlined here, 2309 catch-ments representing 34.28% of the total land area of continental Afri-ca qualify as potential freshwater KBAs. Subsequent prioritisationby MARXAN resulted in selection of ca. 1300 catchments covering

Fig. 5. Spatial distribution of catchments qualifying under each criterion.
176 R.A. Holland et al. / Biological Conservation 148 (2012) 167–179
a total area of around 20% of continental Africa (depending on thescenario applied). Congruence between these prioritised freshwa-ter KBAs and the existing PA network was found to be low suggest-ing that considerable investment must be made in freshwaterconservation to close this gap. The prioritisation carried out in thecurrent study was simplistic as the aim was to examine how effi-ciently the potential freshwater KBAs can represent species basedon existing PAs. To be effective for freshwater species, prioritisationof sites must take into consideration many other factors, such aslongitudinal, lateral, and temporal connectivity, condition, thecapacity for ecological processes to function, and the potential forconservation and management to be successful (Roux et al., 2008;Hermoso et al., 2011; Khoury et al., 2011; Nel et al., 2011). We jus-tify our approach in that (i) it highlights the considerable gaps thatexist in the existing PA network for freshwater species, and (ii)despite recent developments (see Turak and Linke (2011) and refer-
ences within) the methodology for prioritisation of freshwater sitesstill lags behind that for terrestrial and marine systems (Barmuta etal., 2011; Beger et al., 2010). Ultimately while conservation plan-ning tools provide useful guidance, stakeholder engagement iskey to the development of a realistic and practical network of sitesthat will be effective for conservation.
Freshwater biodiversity in its own right has largely been ig-nored in the conservation community due in part to a lack of ro-bust data on which to make decisions (Revenga and Kura, 2003).For example Abell et al. (2010) state that the resource allocationframework used by the Global Environment Facility to targetspending of $1 billion annually incorporates data on terrestrialbut not freshwater biodiversity. Here we have presented for thefirst time a methodology, aligned with other taxonomic groups,for the identification of Key Biodiversity Areas using data focusedon species. Given the significant threats to freshwater species

Fig. 6. Where (a) indicates catchments qualifying as potential freshwater KBAs based on all criteria for all four taxonomic groups, and then based on prioritisation usingMarxan where (b) existing PAs are locked into the solution, (c) no PAs are locked into the solution, (d) a uniform cost is applied to all sites.
R.A. Holland et al. / Biological Conservation 148 (2012) 167–179 177
and the disproportionate contribution that they make to overallbiodiversity, the management of freshwater ecosystems shouldbe prioritised if we are to meet ambitious targets such as thoseset by the Convention on Biological Diversity for 2020. We hopethe development of this new methodology for identifying freshwa-ter KBAs will contribute to a globally standard approach that is ap-plied to help achieve these objectives.
Acknowledgements
The authors would like to extend their thanks to Matthew N.Foster and Lincoln Fishpool for helpful comments during the devel-opment of this manuscript and the anonymous referees whosecomments improved the manuscript considerably. We would alsolike to thank representatives from Birdlife International, Conserva-tion International, WWF, Wetland International and UNEP-WCMCwho attended a workshop in Cambridge to develop the criteria.
Species level data used in this analysis are freely available todownload from the IUCN Red List website at http://www.iucnred-list.org/initiatives/freshwater.
This work was made possible through financial assistance fromConservational International and the European Commissionfunded project ‘‘Biodiversity of Freshwater Ecosystems: Trends,Pressures and Conservation Priorities (BioFresh)’’. This publicationreflects the views of the authors alone, and the European Commis-
sion cannot be held responsible for any use which may be made ofthe information contained therein.
Appendix A. Supplementary material
Supplementary data associated with this article can be found, inthe online version, at doi:10.1016/j.biocon.2012.01.016.
References
Abell, R., Allan, J.D., Lehner, B., 2007. Unlocking the potential of protected areas forfreshwaters. Biol. Conserv. 134, 48–63.
Abell, R., Thieme, M.L., Revenga, C., Bryer, M., Kottelat, M., Bogutskaya, N., Coad, B.,Mandrak, N., Balderas, S.C., Bussing, W., Stiassny, M.L.J., Skelton, P., Allen, G.R.,Unmack, P., Naseka, A., Ng, R., Sindorf, N., Robertson, J., Armijo, E., Higgins, J.V.,Heibel, T.J., Wikramanayake, E., Olson, D., López, H.L., Reis, R.E., Lundberg, J.G.,Sabaj Pérez, M.H., Petry, P., 2008. Freshwater ecoregions of the world: a newmap of biogeographic units for freshwater biodiversity conservation. Bioscience58, 403.
Abell, R., Thieme, M., Ricketts, T., Olwero, N., Ng, R., Petry, P., Dinerstein, E., Revenga,C., Hoekstra, J., 2010. Concordance of freshwater and terrestrial biodiversity.Conserv. Lett., 1–10.
Allan, J.D., 2004. Landscapes and riverscapes: the influence of land use on streamecosystems. Ann. Rev. Ecol. Evol. Syst. 35, 257–284.
Amis, M.A., Rouget, M., Lotter, M., Day, J., 2009. Integrating freshwater andterrestrial priorities in conservation planning. Biol. Conserv. 142, 2217–2226.
Ball, I.R., Possingham, H.P., Watt, M., 2009. Marxan and relatives: software forspatial conservation prioritisation. In: Moilanen, A., Wilson, K.A., Possingham,H.P. (Eds.), Spatial Conservation Prioritisation: Quantitative Methods andComputational Tools. Oxford University Press, Oxford, UK, pp. 185–195.
178 R.A. Holland et al. / Biological Conservation 148 (2012) 167–179
Barmuta, L.A., Linke, S., Turak, E., 2011. Bridging the gap between ‘‘planning’’ and‘‘doing’’ for biodiversity conservation in freshwaters. Freshwater Biol. 56, 180–195.
Beger, M., Grantham, H.S., Pressey, R.L., Wilson, K.A., Peterson, E.L., Dorfman, D.,Mumby, P.J., Lourival, R., Brumbaugh, D.R., Possingham, H.P., 2010.Conservation planning for connectivity across marine, freshwater, andterrestrial realms. Biol. Conserv. 143, 565–575.
Brooks, T.M., Bakarr, M.I., Boucher, T., Da Fonseca, G.A.B., Hilton-Taylor, C., Hoekstra,J.M., Moritz, T., Olivieri, S., Parrish, J., Pressey, R.L., Rodrigues, A.S.L., Sechrest, W.,Stattersfield, A., Strahm, W., Stuart, S.N., 2004. Coverage provided by the globalprotected-area system: is it enough? Bioscience 54, 1081.
Burgess, N., Küper, W., Mutke, J., Brown, J., Westaway, S., Turpie, S., Meshack, C.,Taplin, J., McClean, C., Lovett, J.C., 2005. Major gaps in the distribution ofprotected areas for threatened and narrow range Afrotropical plants. Biodivers.Conserv. 14, 1877–1894.
Darwall, W.R.T., Vie, J.-C., 2005. Identifying important sites for conservation offreshwater biodiversity: extending the species-based approach. Fish. Manage.Ecol. 12, 287–293.
Darwall, W.R.T., Smith, K.G., Allen, D., Seddon, M.B., Reid, G.M., Clausnitzer, V.,Kalkman, V.J., 2009. Freshwater biodiversity: a hidden resource under threat.In: Vié, J.-C., Hilton-Taylor, C., Stuart, S.N. (Eds.), Wildlife in a Changing World.IUCN, Gland, Switzerland, pp. 43–54.
Darwall, W.R.T., Holland, R.A., Smith, K.G., Allen, D., Brooks, E.G.E., Katarya, V.,Pollock, C.M., Shi, Y., Clausnitzer, V., Cumberlidge, N., Cuttelod, A., Dijkstra, K.-D.B., Diop, M.D., Garcia, N., Seddon, M.B., Skelton, P.H., Snoeks, J., Tweddle, D.,Vié, J.-C., 2011. Implications of bias in conservation research and investment forfreshwater species. Conserv. Lett. 4 (6), 474–482.
Dodds, W.K., Oakes, R.M., 2008. Headwater influences on downstream waterquality. Environ. Manage. 41, 367–377.
Dudgeon, D., Arthington, A.H., Gessner, M.O., Kawabata, Z.-I., Knowler, D.J., Lévêque,C., Naiman, R.J., Prieur-Richard, A.-H., Soto, D., Stiassny, M.L.J., Sullivan, C.A.,2006. Freshwater biodiversity: importance, threats, status and conservationchallenges. Biol. Rev. 81, 163–182.
Dudley, N., 2008. Guidelines for Applying Protected Area Management Categories.IUCN, Gland, Switzerland.
Dugan, P., Dey, M.M., Sugunan, V.V., 2006. Fisheries and water productivity intropical river basins: enhancing food security and livelihoods by managingwater for fish. Agric. Water Manage. 80, 262–275.
Eken, G., Bennun, L., Brooks, T.M., Darwall, W., Fishpool, L.D.C., Foster, M., Knox, D.,Langhammer, P., Matiku, P., Radford, E., Salaman, P., Sechrest, W., Smith, M.L.,Spector, S., Tordoff, A., 2004. Key biodiversity areas as site conservation targets.Bioscience 54, 1110.
Esselman, P.C., Allan, J.D., 2011. Application of species distribution models andconservation planning software to the design of a reserve network forthe riverine fishes of northeastern Mesoamerica. Freshwater Biol. 56, 71–88.
Foster, M.N., Mittermeier, R.A., Badman, T., Besancon, C., Bomhard, B., Brooks, T.M.,de Silva, N., Fishpool, L., Parr, M., Radford, E., Turner, W., 2010. Synergiesbetween world heritage sites and key biodiversity areas. World Heritage 56, 4–17.
Gaston, K.J., Jackson, S.E., Cantu-Salazar, L., Cruz-Pinon, G., 2008. The ecologicalperformance of protected areas. Ann. Rev. Ecol. Evol. Syst. 39, 93–113.
Grimmett, R.F.A., Jones, T.A., 1989. Important Bird Areas in Europe. ICBP TechnicalPublication No. 9. Cambridge, UK.
Groves, C.R., Jensen, D.B., Valutis, L.L., Redford, K.H., Shaffer, M.L., Scott, J.M.,Baumgartner, J.V., Higgins, J.V., Beck, M.W., Anderson, M.G., 2002. Planning forbiodiversity conservation: putting conservation science into practice.Bioscience 52, 499–512.
Herbert, M.E., McIntyre, P.B., Doran, P.J., Allan, J.D., Abell, R., 2010. Terrestrialreserve networks do not adequately represent aquatic ecosystems. Conserv.Biol. 24, 1002–1011.
Hermoso, V., Linke, S., Prenda, J., Possingham, H.P., 2011. Addressing longitudinalconnectivity in the systematic conservation planning of fresh waters.Freshwater Biol. 56, 57–70.
Isaac, N.J.B., Turvey, S.T., Collen, B., Waterman, C., Baillie, J.E.M., 2007. Mammals onthe EDGE: conservation priorities based on threat and phylogeny. PLoS ONE 2,e296.
IUCN, 2003. Guidelines for Application of IUCN Red List Criteria at Regional Levels:Version 3.0. IUCN Species Survival Commission. IUCN, Gland, Switzerland andCambridge, UK, ii + 26 pp.
IUCN, 2010. IUCN Red List of Threatened Species. Version 2010.4.IUCN, UNEP-WCMC, 2010. The World Database on Protected Areas (WDPA): Annual
Release (Online).Jackson, R.B., Carpenter, S.R., Dahm, C.N., McKnight, D.M., Naiman, R.J., Postel, S.L.,
Running, S.W., 2001. Water in a changing world. Ecol. Appl. 11, 1027–1045.
Joppa, L.N., Pfaff, A., 2009. High and far: biases in the location of protected areas.PLoS ONE 4, e8273.
Khoury, M., Higgins, J., Weitzell, R., 2011. A freshwater conservation assessment ofthe Upper Mississippi River basin using a coarse- and fine-filter approach.Freshwater Biol. 56, 162–179.
Langhammer, P.F., Bakarr, M.I., Bennun, L.A., Brooks, T.M., Clay, R.P., Darwall, W.,Silva, N.D., Edgar, G.J., Fishpool, L.D.C., Foster, M.N., Knox, D.H., Matiku, P.,Radford, E.A., Rodrigues, A.S.L., Salaman, P., Sechrest, W., Tordoff, A.W., 2007.Identification and Gap Analysis of Key Biodiversity Areas. IUCN, Gland,Switzerland.
Lawrence, D., Larson, E., Reidy Liermann, C., Mims, M., Pool, T., Olden, J., 2011.National Parks as protected areas for US freshwater fish diversity. Conserv. Lett.4 (5), 364–371.
Linke, S., Turak, E., Nel, J., 2011. Freshwater conservation planning: the case forsystematic approaches. Freshwater Biol. 56, 6–20.
Luck, G.W., Chan, K.M.A., Fay, J.P., 2009a. Protecting ecosystem services andbiodiversity in the world’s watersheds. Conserv. Lett. 2, 1–10.
Luck, G.W., Harrington, R., Harrison, P.A., Kremen, C., Berry, P.M., Bugter, R., Dawson,T.P., de Bello, F., Diaz, S., Feld, C.K., Haslett, J.R., Hering, D., Kontogianni, A.,Lavorel, S., Rounsevell, M., Samways, M.J., Sandin, L., Settele, J., Sykes, M.T., vanden Hove, S., Vandewalle, M., Zobel, M., 2009b. Quantifying the contribution oforganisms to the provision of ecosystem services. Bioscience 59, 223–235.
Margules, C.R., Pressey, R.L., 2000. Systematic conservation planning. Nature 405,243–253.
Millennium Ecosystem Assessment, 2005. Ecosystems and Human Well-Being:Wetlands and Water Synthesis. World Resource Institute, Washington, DC.
Moilanen, A., 2007. Landscape zonation, benefit functions and target-basedplanning: unifying reserve selection strategies. Biol. Conserv. 134, 571–579.
Moilanen, A., Leathwick, J., Elith, J., 2008. A method for spatial freshwaterconservation prioritization. Freshwater Biol. 53, 577–592.
Naiman, R.J., Bunn, S.E., Nilsson, C., Petts, G.E., Pinay, G., Thompson, L.C., 2002.Legitimizing fluvial ecosystems as users of water: an overview. Environ.Manage. 30, 455–467.
Nel, J.L., Roux, D.J., Maree, G., Kleynhans, C.J., Moolman, J., Reyers, B., Rouget, M.,Cowling, R.M., 2007. Rivers in peril inside and outside protected areas: asystematic approach to conservation assessment of river ecosystems. Divers.Distrib. 13, 341–352.
Nel, J.L., Roux, D.J., Abell, R., Ashton, P.J., Cowling, R.M., Higgins, J.V., Thieme, M.,Viers, J.H., 2009a. Progress and challenges in freshwater conservation planning.Aquat. Conserv. Mar. Freshwater Ecosyst. 485, 474–485.
Nel, J.L., Reyers, B., Roux, D.J., Cowling, R.M., 2009b. Expanding protected areasbeyond their terrestrial comfort zone: identifying spatial options for riverconservation. Biol. Conserv. 142, 1605–1616.
Nel, J.L., Reyers, B., Roux, D.J., Dean Impson, N., Cowling, R.M., 2011. Designing aconservation area network that supports the representation and persistence offreshwater biodiversity. Freshwater Biol. 56, 106–124.
Nilsson, C., Reidy, C.A., Dynesius, M., Revenga, C., 2005. Fragmentation and flowregulation of the world’s large river systems. Science 308, 405–408.
Nogueira, C., Buckup, P.A., Menezes, N.A., Oyakawa, O.T., Kasecker, T.P., Ramos Neto,M.B., da Silva, J.M.C., 2010. Restricted-range fishes and the conservation ofBrazilian freshwaters. In: Gratwicke, B. (Ed.), PLoS One, vol. 5, p. e11390.
Oksanen, J., Blanchet, F.G., Kindt, R., Legendre, P., O’Hara, R.B., Simpson, G.L.,Solymos, P., Stevens, M.H.H., Wagner, H., 2010. Vegan: Community EcologyPackage. R package version 2.0-2. Available from: <http://CRAN.R-project/package=vegan>.
Palmer, M.A., 2010. Beyond infrastructure. Nature 467, 534–535.Paul, M.J., Meyer, J.L., 2001. Streams in the urban landscape. Ann. Rev. Ecol. Evol.
Syst. 32, 333–365.Postel, S.L., Carpenter, S., 1997. Freshwater ecosystem services. In: Daily, G.C. (Ed.),
Nature’s Services. Island Press, Washington, DC, pp. 195–214.Purvis, A., Gittleman, J.L., Cowlishaw, G., Mace, G.M., 2000. Predicting extinction risk
in declining species. Proc. Roy. Soc. B 267, 1947–1952.Rebelo, L., McCartney, M., Finlayson, C., 2009. Wetlands of Sub-Saharan Africa:
distribution and contribution of agriculture to livelihoods. Wetlands Ecol.Manage. 18, 557–572.
Revenga, C., Kura, Y., 2003. Status and trends of biodiversity of inland waterecosystems. CBD Technical Series 11. Montreal, Canada.
Ricciardi, A., Rasmussen, J.B., 1999. Extinction rates of North American freshwaterfauna. Conserv. Biol. 13, 1220–1222.
Ricketts, T.H., Dinerstein, E., Boucher, T., Brooks, T.M., Butchart, S.H.M., Hoffmann,M., Lamoreux, J.F., Morrison, J., Parr, M., Pilgrim, J.D., Rodrigues, A.S.L., Sechrest,W., Wallace, G.E., Berlin, K., Bielby, J., Burgess, N.D., Church, D.R., Cox, N., Knox,D., Loucks, C., Luck, G.W., Master, L.L., Moore, R., Naidoo, R., Ridgely, R., Schatz,G.E., Shire, G., Strand, H., Wettengel, W., Wikramanayake, E., 2005. Pinpointingand preventing imminent extinctions. PNAS 102, 18497–18501.
Rivers-Moore, N.A., Goodman, P.S., Nel, J.L., 2011. Scale-based freshwaterconservation planning: towards protecting freshwater biodiversity inKwaZulu-Natal, South Africa. Freshwater Biol. 56, 125–141.
Rodrigues, A.S.L., Brooks, T.M., 2007. Shortcuts for biodiversity conservationplanning: the effectiveness of surrogates. Ann. Rev. Ecol. Evol. Syst. 38, 713–737.
Rodrigues, A.S.L., Akçakaya, H.R., Andelman, S.J., Bakarr, M.I., Boitani, L., Brooks, T.M.,Chanson, J.S., Fishpool, L.D.C., Fonseca, G.A.B.D., Gaston, K.J., Hoffmann, M.,Marquet, P.A., Pilgrim, J.D., Pressey, R.L., Schipper, J., Sechrest, W., Stuart, S.N.,Underhill, L.G., Waller, R.W., Watts, M.E.J., Yan, X., 2004a. Global gap analysis:priority regions for expanding the global protected-area network. Bioscience 54,1092–1100.
Rodrigues, A.S.L., Andelman, S.J., Bakarr, M.I., Boitani, L., Brooks, T.M., Cowling, R.M.,Fishpool, L.D.C., da Fonseca, G.A.B., Gaston, K.J., Hoffmann, M., Long, J.S.,Marquet, P.A., Pilgrim, J.D., Pressey, R.L., Schipper, J., Sechrest, W., Stuart, S.N.,Underhill, L.G., Waller, R.W., Watts, M.E.J., Yan, X., 2004b. Effectiveness of theglobal protected area network in representing species diversity. Nature 428,640–643.
Rondinini, C., Stuart, S., Boitani, L., 2005. Habitat suitability models and theshortfall in conservation planning for African vertebrates. Conserv. Biol. 19,1488–1497.

R.A. Holland et al. / Biological Conservation 148 (2012) 167–179 179
Roux, D.J., Nel, J.L., Ashton, P.J., Deacon, A.R., de Moor, F.C., Hardwick, D., Hill, L.,Kleynhans, C.J., Maree, G.A., Moolman, J., Scholes, R.J., 2008. Designing protectedareas to conserve riverine biodiversity: lessons from a hypothetical redesign ofthe Kruger National Park. Biol. Conserv. 141, 100–117.
Strayer, D.L., Dudgeon, D., 2010. Freshwater biodiversity conservation: recentprogress and future challenges. J. North Am. Benthol. Soc. 29, 344–358.
Thieme, M., Lehner, B., Abell, R., Hamilton, S.K., Kellndorfer, J., Powella, G., Riveros,J.C., 2007. Freshwater conservation planning in data-poor areas: an examplefrom a remote Amazonian basin (Madre de Dios River, Peru and Bolivia). Biol.Conserv. 135, 484–501.
Turak, E., Linke, S., 2011. Freshwater conservation planning: an introduction.Freshwater Biol. 56, 1–5.
Vié, J.-C., Hilton-Taylor, C., Stuart, S.N., 2009. Wildlife in a Changing World –Analysis of the IUCN Red List of Threatened Species. IUCN, Gland, Switzerland.
Vörösmarty, C.J., McIntyre, P.B., Gessner, M.O., Dudgeon, D., Prusevich, A., Green, P.,Glidden, S., Bunn, S.E., Sullivan, C.A., Liermann, C.R., Davies, P.M., 2010. Globalthreats to human water security and river biodiversity. Nature 467, 555–561.
WWF, 2010. Living Planet Report 2010: Biodiversity, Biocapacity and Development.WWF in Association with Zoological Society of London & Global FootprintNetwork.