Freshwater Key Biodiversity Areas and the Natura2000 network
26
Water Lives Symposium BioFresh/REFRESH Brussels 29‐30 January 2014 Freshwater Key Biodiversity Areas and the Natura 2000 network: designing an optimal network to address gaps in protection, now and under climate change William Darwall (IUCN) on behalf of Biofresh Work Package 7 Team “Informing Policy for Conservation Planning”
Transcript of Freshwater Key Biodiversity Areas and the Natura2000 network

Water Lives Symposium BioFresh/REFRESHBrussels 29‐30 January 2014
Freshwater Key Biodiversity Areas and the Natura 2000 network:
designing an optimal network to address gaps in protection, now and under climate change
William Darwall (IUCN) on behalf of
Biofresh Work Package 7 Team“Informing Policy for Conservation Planning”

Water Lives Symposium BioFresh/REFRESHBrussels 29‐30 January 2014
Key Science and Policy Questions1. Where are the freshwater KBAs of Europe located?
How can the BioFresh KBA initiative work with the EC to endorse and make best use of this information?
2. What subset of Freshwater KBAs will best meet targets to protect freshwater biodiversity?Can we use this approach to help meet the EU Biodiversity Strategy for 15% restoration of degraded habitats & 50% of species on the Habitat Directive to show improved conservation status?
3. Where are the current spatial gaps between the protected areas network and freshwater KBAs?What EU strategies are there to improve the efficacy of protected areas for freshwater species?
4. How will climate change alter the distribution of freshwater biodiversity?What initiatives aim to ensure protected areas are ‘future proof’?

Water Lives Symposium BioFresh/REFRESHBrussels 29‐30 January 2014
We now have much new data on the distribution and status of freshwater species in Europe
Odonata 139 spp.Fishes 530 spp.Molluscs 680 spp.Plants 368 spp.
Map of species richness for fishes, molluscs, dragonflies & damselflies, and aquatic plants: numbers range from 6 – 395 spp. per catchment

Water Lives Symposium BioFresh/REFRESHBrussels 29‐30 January 2014
Threatened species richness Degree of threat:Molluscs 44%Fishes 37%Plants 16%Odonata 8%
Southern Europe is the centre of threat
Map of globally threatened species richness of fishes, molluscs, dragonflies & damselflies, and aquatic plants
Water Lives Symposium BioFresh/REFRESHBrussels 29‐30 January 2014
Key Scientific Questions
1. Where are the KBAs of Europe located?
2. What subset of KBAs will best meet targets to protect freshwater biodiversity?
3. What are the current spatial gaps between the protected areas network and freshwater KBAs?
4. How will climate change alter the distribution of freshwater biodiversity?

Water Lives Symposium BioFresh/REFRESHBrussels 29‐30 January 2014
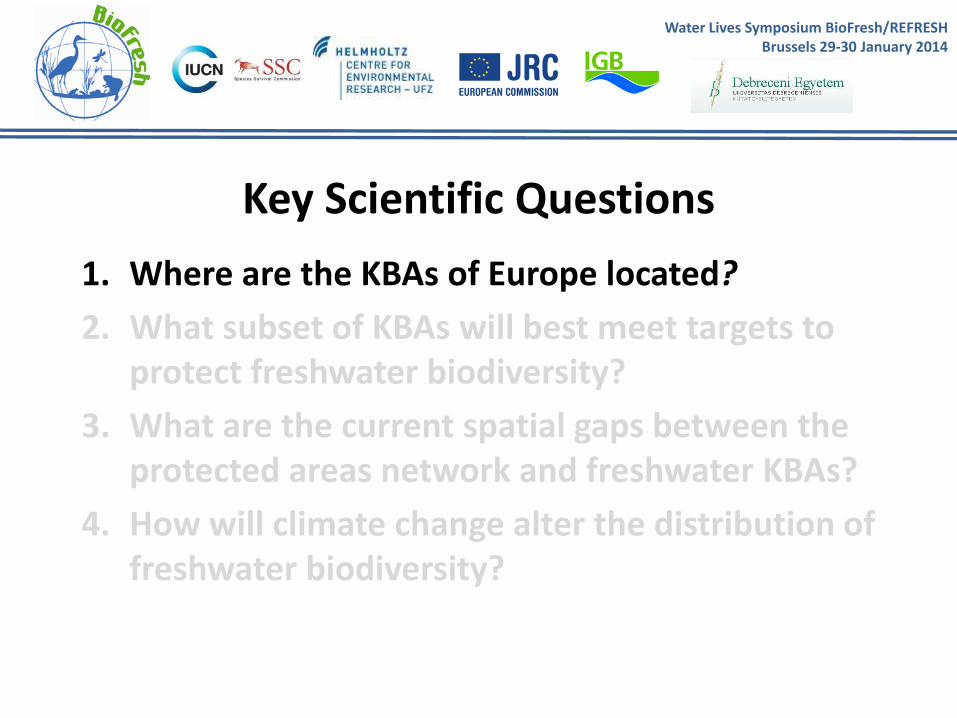
45% of Europe’s land area qualifies as FW KBA catchments
Darkest green catchments contain the highest numbers of qualifying species
FW KBAs are concentrated in southern Europe and the Mediterranean
Distribution of Freshwater KBAs

Water Lives Symposium BioFresh/REFRESHBrussels 29‐30 January 2014
Alliance for Zero Extinction catchmentsTop priority sites for species at the highest risk of extinction
Catchments holding:
At least 1 Critically Endangered or Endangered SpeciesHolding >95% of the species known populationWith a definable boundary and ecological character distinct from adjacent areas

Water Lives Symposium BioFresh/REFRESHBrussels 29‐30 January 2014
Alliance for Zero Extinction catchmentsCurrent coverage by existing Protected Areas (PAs)
65 AZE‐sites have been identified
One AZE‐site has no PA at all (Drin, Montenegro)
7 AZE‐sites have less than 3% PA coverage

Water Lives Symposium BioFresh/REFRESHBrussels 29‐30 January 2014
1. Where are the KBAs of Europe located?
2. What subset of KBAs will best meet targets to protect freshwater biodiversity?
3. What are the current spatial gaps between the protected areas network and freshwater KBAs?
4. How will climate change alter the distribution of freshwater biodiversity?
Key Scientific Questions

Water Lives Symposium BioFresh/REFRESHBrussels 29‐30 January 2014
We ran 4 Scenarios for the following data sets:
1) Global KBAs only
2) Global and Regional KBAs
3) All catchments with globally Red Listed species
4) All catchments and all species (globally and regionally Red Listed)
Systematic Conservation Planning using MARXAN
Targets:
100% occurrences of CR species; 75% of EN species; 50% VU species
Restricted Range species: 10% of occurrences
All catchments with representative assemblages of species
Maximum area set at 15% of the total area of Europe

Water Lives Symposium BioFresh/REFRESHBrussels 29‐30 January 2014
100% 85‐99% 50‐85% 25‐50% 1‐25% 0%Frequency of selection of catchments indicating their irreplaceability
Top Priority “irreplaceable” KBA catchments in dark orange = 788 catchments
Average reduction to 67% of the total number of KBA catchments
Results for Scenario 4 – all species, all catchments

Water Lives Symposium BioFresh/REFRESHBrussels 29‐30 January 2014
100% 85‐99% 50‐85% 25‐50% 1‐25% 0%
Water Lives Symposium BioFresh/REFRESHBrussels 29‐30 January 2014
100% 85‐99% 50‐85% 25‐50% 1‐25% 0%

Water Lives Symposium BioFresh/REFRESHBrussels 29‐30 January 2014
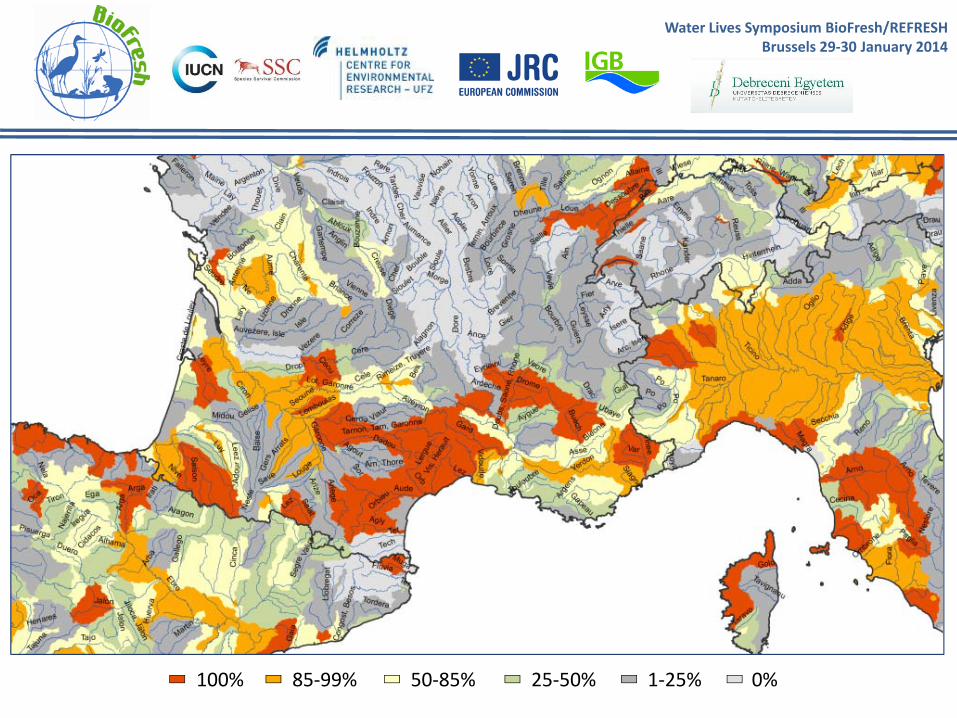
Next stepsRun a MARXAN scenario where KBA catchments included in the existing PAs network are locked into the optimal networks
These sites are locked in as the management infrastructure is already in place and the land is already set aside
Assess current management benefit to freshwater species in these PAs.
Water Lives Symposium BioFresh/REFRESHBrussels 29‐30 January 2014
Catchments with PA > 70%
100% 85‐99% 50‐85% 25‐50% 1‐25% 0%
PAs covering KBAs with 70%+ area inclusion – “locked” into the network
No PAs “locked in”

Water Lives Symposium BioFresh/REFRESHBrussels 29‐30 January 2014
1. Where are the KBAs of Europe located?
2. What subset of KBAs will best meet targets to protect freshwater biodiversity?
3. What are the current spatial gaps between the protected areas network and freshwater KBAs?
4. How will climate change alter the distribution of freshwater biodiversity?
Key Scientific Questions

Water Lives Symposium BioFresh/REFRESHBrussels 29‐30 January 2014
Spatial gaps in current protection
KBA inclusion within PAs
Water Lives Symposium BioFresh/REFRESHBrussels 29‐30 January 2014
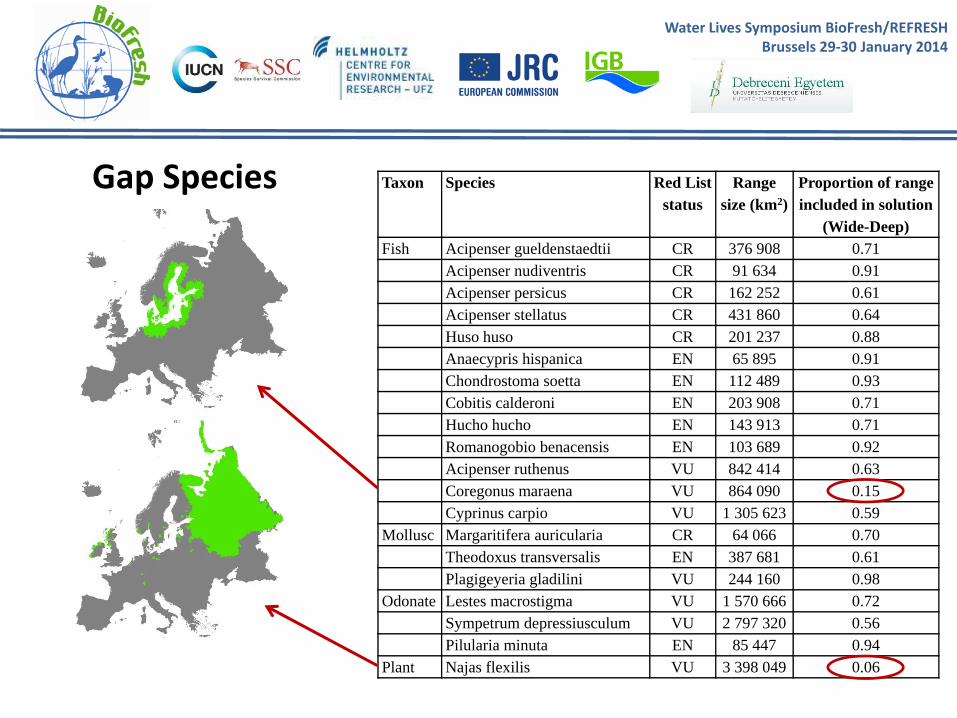
Gap Species Taxon Species Red List status
Range size (km2)
Proportion of range included in solution
(Wide-Deep)Fish Acipenser gueldenstaedtii CR 376 908 0.71
Acipenser nudiventris CR 91 634 0.91Acipenser persicus CR 162 252 0.61Acipenser stellatus CR 431 860 0.64Huso huso CR 201 237 0.88Anaecypris hispanica EN 65 895 0.91Chondrostoma soetta EN 112 489 0.93Cobitis calderoni EN 203 908 0.71Hucho hucho EN 143 913 0.71Romanogobio benacensis EN 103 689 0.92Acipenser ruthenus VU 842 414 0.63Coregonus maraena VU 864 090 0.15Cyprinus carpio VU 1 305 623 0.59
Mollusc Margaritifera auricularia CR 64 066 0.70Theodoxus transversalis EN 387 681 0.61Plagigeyeria gladilini VU 244 160 0.98
Odonate Lestes macrostigma VU 1 570 666 0.72Sympetrum depressiusculum VU 2 797 320 0.56Pilularia minuta EN 85 447 0.94
Plant Najas flexilis VU 3 398 049 0.06

Water Lives Symposium BioFresh/REFRESHBrussels 29‐30 January 2014
• Targets now met for all threatened species (CR, EN, VU)
• Decreased priority for catchments in E Europe (lower Danube, Volga), increased priority for catchments in S Portugal and S France
MARXAN re‐run excluding 20 widespread, locally rare threatened species (e.g. six sturgeons)
n = 1653 n = 1633

Water Lives Symposium BioFresh/REFRESHBrussels 29‐30 January 2014
Many Freshwater Habitats within Natura 2000 sites (EU25) remain in “bad” or “inadequate” condition
Data aggregated from Eionet ‐ ETC on Biological diversity 2009: Online report on Article 17 of the Habitats Directive (2001‐2006)

Water Lives Symposium BioFresh/REFRESHBrussels 29‐30 January 2014
1. Where are the KBAs of Europe located?
2. What subset of KBAs will best meet targets to protect freshwater biodiversity?
3. What are the current spatial gaps between the protected areas network and freshwater KBAs?
4. How will climate change alter the distribution of freshwater biodiversity?
Key Scientific Questions
Water Lives Symposium BioFresh/REFRESHBrussels 29‐30 January 2014
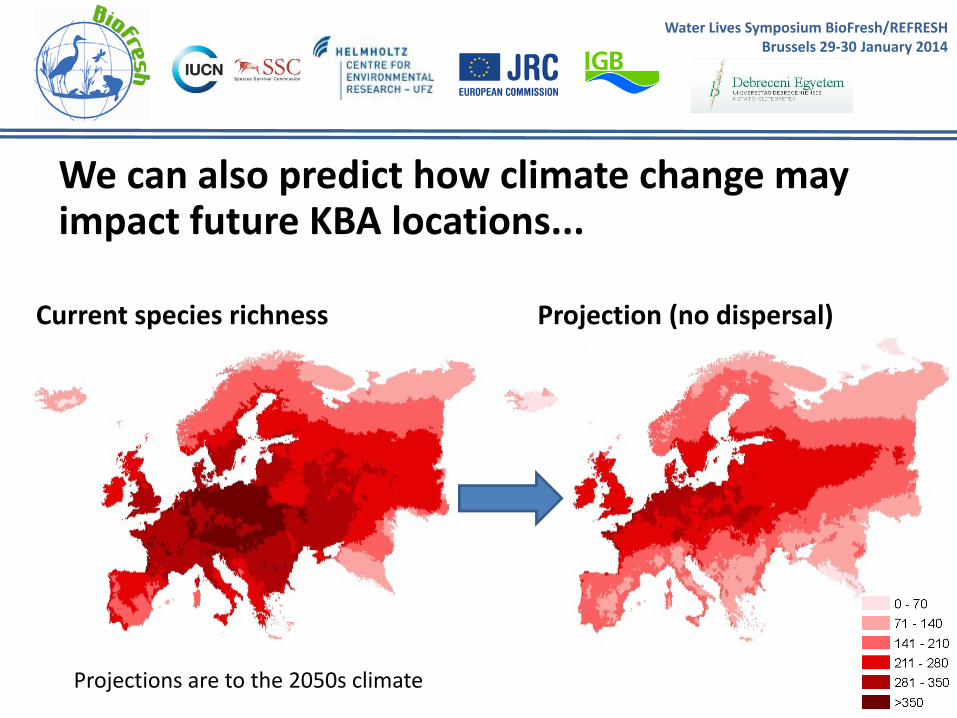
We can also predict how climate change may impact future KBA locations...
Current species richness Projection (no dispersal)
Projections are to the 2050s climate

Water Lives Symposium BioFresh/REFRESHBrussels 29‐30 January 2014
Summary of outputs from BioFresh
1. Freshwater KBAs of Europe have been mapped
2. Optimal site networks can be determined to meet specified conservation targets
3. Current gaps between the protected areas network and freshwater KBAs are identified
4. Climate change alterations to the distribution of freshwater biodiversity are predicted

Water Lives Symposium BioFresh/REFRESHBrussels 29‐30 January 2014
How can the BioFresh KBA initiative best work with the EC to endorse and make best use of this information?
Can we help the EC meet the EU Biodiversity Strategy for: i) 15% restoration of degraded habitats, and ii) 50% of species on the Habitat Directive to show improved conservation status?
What strategies does the EU have to improve the efficacy of protected areas for freshwater species?
What initiatives aim to ensure protected area locations are ‘future proof’?
Policy related questions for discussion

Water Lives Symposium BioFresh/REFRESHBrussels 29‐30 January 2014
THANK YOU
BioFresh is funded by the European Union under the 7th Framework programme, Contract No. 226874

Water Lives Symposium BioFresh/REFRESHBrussels 29‐30 January 2014
How can the BioFresh KBA initiative best work with the EC to endorse and make best use of this information?
Can we help the EC meet the EU Biodiversity Strategy for: i) 15% restoration of degraded habitats, and ii) 50% of species on the Habitat Directive to show improved conservation status?
What strategies does the EU have to improve the efficacy of protected areas for freshwater species?
What initiatives aim to ensure protected area locations are ‘future proof’?
Policy related questions for discussion