Connecticut State University System · the workforce and to contribute to the civic life of...
66
June 30, 2017 and 2016
Transcript of Connecticut State University System · the workforce and to contribute to the civic life of...

Connecticut State University System
Connecticut State Colleges & Universities
FINANCIALSTATEMENTS
including
Required Supplementary Information &Additional Supplemental Information
June 30, 2017 and 2016
Connecticut State Universities Mission Statement
As part of the Connecticut State Colleges & Universities (“CSCU”) system, the four Connecticut
State Universities offer exemplary and affordable undergraduate and graduate instruction leading
to degrees in the liberal arts, sciences, fine arts, applied fields, and professional disciplines. They
advance and extend knowledge, research, learning and culture while preparing students to enter
the workforce and to contribute to the civic life of Connecticut’s communities. Through a variety
of living and learning environments, the Universities ensure access and diversity to meet the needs
of a broad range of students. They support an atmosphere of inter-campus learning, the exploration
of technological and global influences and the application of knowledge to promote economic
growth and social justice.
Members of the Board of Regents for Higher Education
(Between 7/1/15 – 6/30/17)
Thirteen members: nine appointed by the Governor; four appointed by legislative leaders
Two students chosen by their peers (Chair and Vice Chair of Student Advisory Committee)
Six non-voting, ex-officio members:
o Four CT commissioners appointed by the Governor from the Departments of Public
Health, Education, Economic and Community Development, and Labor
o Chair and Vice Chair of the Faculty Advisory Committee
Regents as of 6/30/17 (1 vacancy)
Matt Fleury, Chairman (appt to Chair 7/1/17)
Yvette Meléndez, Vice Chair
Richard J. Balducci
Aviva D. Budd (appointed 1/25/17)
Naomi K. Cohen
Lawrence J. DeNardis
Merle W. Harris
David R. Jimenez
William J. McGurk
JoAnn H. Price
Elease E. Wright
Holly Palmer (COSC Student; elected April 2016)
Joseph Young (CCC student; elected September 2016)
Ex-Officio, Non-voting members
Barbara E. Richards – Chair of the Faculty Advisory Committee (term began January 2016)
Stephen Adair – Vice Chair of the Faculty Advisory Committee
Raul Pino – Commissioner of the CT Department of Public Health (appointed December 2015)
Dianna R. Wentzell – Commissioner of the State Board of Education
Scott Jackson – Commissioner of the CT Department of Labor (appointed January 2016)
Catherine Smith – Commissioner of the CT Department of Economic and Community Development
Former Board members (who served between 7/1/15 – 6/30/17)
Nicholas M. Donofrio (term ended June 30, 2016)
Jewel Mullen – Commissioner of the CT Department of Public Health (resigned November, 2015)
Sharon Palmer – Commissioner of the CT Department of Labor (resigned December, 2015)
Sarah E. Greco, CSU Student (resigned March 2016)
Gordon Plouffe (CCC student; term ended September 2016)
Robert E. Brown – VC of FAC (term ended December 2015)
Connecticut State Universities
Central Connecticut State University (CCSU)
1615 Stanley Street
New Britain, CT 06050
Dr. Zulma Toro, President
Eastern Connecticut State University (ECSU)
83 Windham Street
Willimantic, CT 06226
Dr. Elsa Nunez, President
Southern Connecticut State University (SCSU)
501 Crescent Street
New Haven, CT 06515
Dr. Joseph Bertolino, President
Western Connecticut State University (WCSU)
181 White Street
Danbury, CT 06810
Dr. John B. Clark, President
System Office, Connecticut State Colleges & Universities
61 Woodland Street
Hartford, CT 06105
Mark E. Ojakian, President

Connecticut State University System Index to Financial Statements
June 30, 2017 and 2016
Management’s Discussion and Analysis (Unaudited) Page
Introduction 1
Using the Financial Statements 1
Financial Highlights 2
Condensed Statements of Net Position 2
Condensed Statements of Revenues, Expenses and Changes in Net Position 6
Condensed Statements of Cash Flows 9
Economic Outlook 9
Report of Independent Certified Public Accountants 12
Financial Statements
Statements of Net Position 15
Statements of Financial Position - Component Units 17
Statements of Revenues, Expenses and Changes in Net Position 18
Statements of Activities - Component Units 19
Statements of Cash Flows 20
Notes to Financial Statements 22
Required Supplementary Information (Unaudited)
Schedule of Net Pension Liability and Related Ratios S-2
Schedule of Contributions S-4
Notes to Required Supplemental Information S-6
Supplementary Schedules
Combining Statement of Net Position S-7
Combining Statement of Revenues, Expenses and Changes in Net Position S-9
Combining Statement of Cash Flows S-11
Notes to the Supplemental Schedules S-14
Connecticut State University System
Management Discussion and Analysis (Unaudited)
June 30, 2017 and 2016
- 1 -
Introduction
Management’s Discussion and Analysis provides an overview of the comparative financial position and results of
activities of the Connecticut State University System (“CSUS” or “System”) and its component units for the fiscal
year ended June 30, 2017 with comparative information for the fiscal year ended June 30, 2016. This discussion has
been prepared by and is the responsibility of management, and should be read in conjunction with the financial
statements and footnote disclosures which follow this section.
The Board of Regents for Higher Education was established by the Connecticut General Assembly in 2011 (via
Public Act 11-48 as amended by Public Act 11-61) bringing together the governance structure for the four
Connecticut State Universities, twelve Connecticut Community Colleges and Charter Oak State College, effective
July 1, 2011. The new Board of Regents for Higher Education is authorized under the provisions of this public act
to “serve as the Board of Trustees for the Connecticut State University System.”
CSUS is a state-wide public university system of higher learning in the State of Connecticut with approximately
33,200 enrolled students. The Universities offer high-quality applied educational doctoral, graduate and
undergraduate programs in more than 147 subject areas and provide extensive opportunities for internships,
community service and cultural engagement. In total, CSUS employed approximately 3,000 full time employees at
June 30, 2017.
The CSUS system is composed of four primary Universities that make up the primary reporting entity. The System’s
four Universities include:
Central Connecticut State University (“CCSU”) in New Britain,
Eastern Connecticut State University (“ECSU”) in Willimantic,
Southern Connecticut State University (“SCSU”) in New Haven, and
Western Connecticut State University (“WCSU”) in Danbury
As comprehensive, fully accredited Universities, CSUS institutions are Connecticut’s Universities of choice for
students of all ages, backgrounds, races and ethnicities. CSUS provides affordable and high quality, active learning
opportunities, which are geographically and technologically accessible. CSUS graduates think critically, acquire
enduring problem-solving skills and meet outcome standards that embody the competencies necessary for success in
the workplace and in life.
Using the Financial Statements
CSUS’s financial report includes the following financial statements: the Statement of Net Position, the Statements
of Revenues, Expenses and Changes in Net Position and the Statements of Cash Flows. These financial statements
are prepared in accordance with accounting principles generally accepted in the United States of America as defined
by the Governmental Accounting Standards Board (“GASB”). GASB Statement No. 35 established standards for
external financial reporting for public colleges and Universities, and requires that financial statements be presented
on a basis to focus on the financial condition, results of operations, and cash flows of the System as a whole. As
required by GASB Statements No. 34 and 35, a comparative analysis of fiscal year 2016 financial data with fiscal
year 2015 is also presented, both for the CSUS primary institution, as well as for certain other organizations that
have a significant related party relationship with CSUS (the “component units”).
The component units are the CCSU Foundation, Inc., the ECSU Foundation, Inc., the Southern Connecticut State
University Foundation, Inc., the Western Connecticut State University Foundation Inc. and the Connecticut State
University System Foundation, Inc. (collectively, the “Foundations”). The Foundations are legally independent,
tax-exempt non-profit organizations separate from university control, founded to foster and promote the growth,
progress and general welfare of the Universities and to solicit, receive and administer donations for such
purposes. The Foundations manage the majority of the Universities’ endowments. However, the assets of these
component units are not available to CSUS for use at its discretion. This MD&A discusses the University’s
financial statements only and not those of its component units.

Connecticut State University System
Management Discussion and Analysis (Unaudited)
June 30, 2017 and 2016
- 2 -
During fiscal year 2016, management identified certain errors in the fiscal year 2015 financial statements related to
accounting and reporting for pensions, reporting Pell revenues and reporting bond premiums and discounts. As a
result, amounts reported in fiscal year 2015 within the fiscal year 2016 management discussion and analysis have
been restated to reflect the correction of these errors. Refer to footnote 1 of the financial statements for further
details related to amounts adjusted in connection with the pension accounting. With respect to changes in reporting
of Pell revenues, prior to fiscal year 2016, Pell revenues had been incorrectly reported as operating revenues rather
than non-operating revenues. This change impacted operating results (vs. non-operating results), but had no impact
on change in net position. With respect to changes in reporting of bond premiums and discounts, these amounts had
previously been reported as deferred outflows or deferred inflows rather than as a liability associated with the bond
principal outstanding. This change reduced deferred outflows and inflows, and increased total liabilities, but had no
impact on the change in net position or beginning net position. All amounts presented in this MD&A have been
restated to reflect the corrected amounts for fiscal year 2015.
Financial Highlights
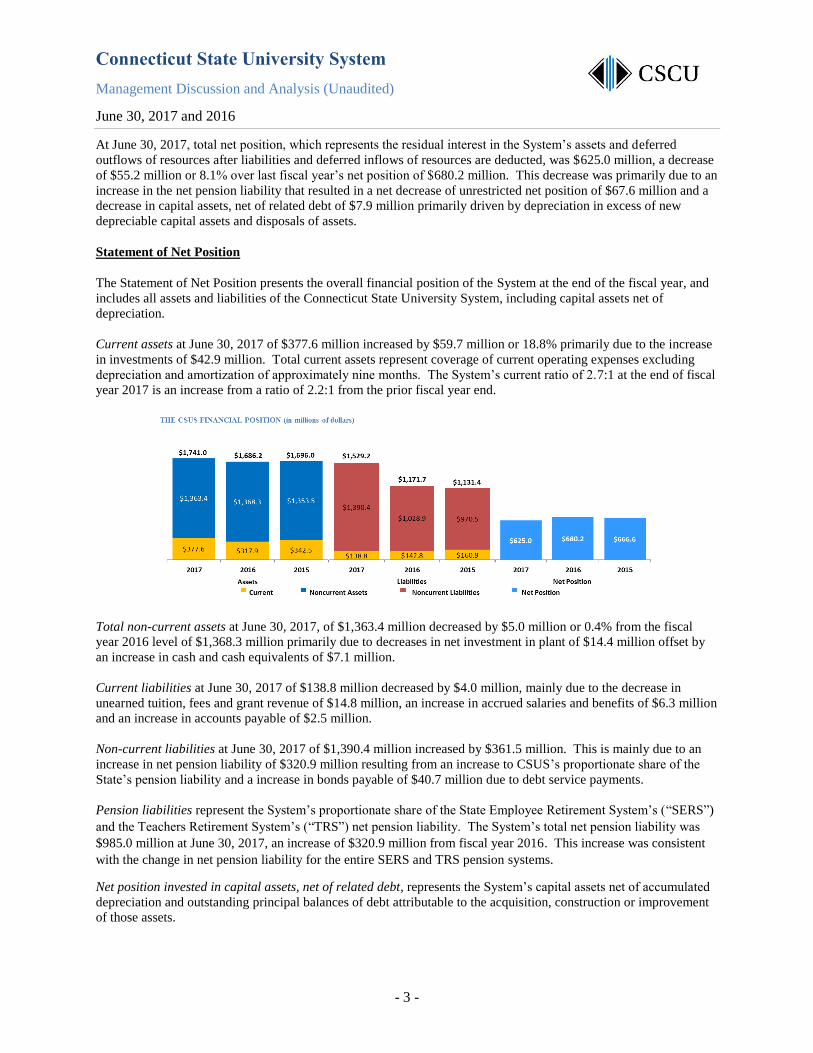
At June 30, 2017, total assets of the System were $1,741.0 million, a increase of $54.8 million or 3.2% more than
the prior year amount of $1,686.2 million, primarily due to a increase in investments of $42.9 million.
Total liabilities at June 30, 2017 of $1,529.2 million increased by $357.5 million, primarily due to an increase in
pension liability of $320.9 million resulting from an increase to CSUS’s share of the State’s net pension liability and
an increase in bonds payable of $40.7 million. In fiscal 2017, the CSUS issued $55.0 million in revenue bonds and
refunded an additional $19.5 million to take advantage of favorable interest rates.
Condensed Statements of Net Position
June 30, 2017, 2016 and 2015
(in millions)
2017 2016 2015
(Restated*) FY 16 - 17
ASSETS
Current assets 377.6$ 317.9$ 342.5$ 18.8%
Non-current assets:
Capital assets, net 1,179.4 1,193.7 1,175.2 -1.2%
Other 184.0 174.6 178.3 5.4%
Total Assets 1,741.0 1,686.2 1,696.0 3.2%
DEFERRED OUTFLOWS OF RESOURCES 414.5 165.8 123.6 150.0%
LIABILITIES
Current liabilities 138.8 142.8 161.0 -2.8%
Non-current liabilities 1,390.4 1,028.9 970.5 35.1%
Total liabilities 1,529.2 1,171.7 1,131.5 30.5%
DEFERRED INFLOWS OF RESOURCES 1.3 0.1 21.5 2400.0%
NET POSITION
Invested in capital assets - net of related debt 1,015.1 1,023.0 1,016.7 -0.8%
Restricted nonexpendable 0.5 0.5 0.5 0.0%
Restricted expendable 38.6 18.3 19.9 110.9%
Unrestricted (429.2) (361.6) (370.5) -18.7%
Total net position 625.0 680.2 666.6 -8.1%
Total liabilities and net position 2,154.2$ 1,851.9$ 1,798.1$ 16.3%
% Change
*FY 15 is restated to present student receivables for summer and fall classes of the following fiscal year net of deferred revenue.
Additionally, FY 15 is restated for certain amounts previously reported for the adoption of GASB 68 in fiscal year 2015 which
were incorrect. Finally, discounts on bond premiums was reclassified from deferred inflows to bonds payable. As a result the net
position, and deferred ouflows of fiscal year 2015 have been restated.
Connecticut State University System
Management Discussion and Analysis (Unaudited)
June 30, 2017 and 2016
- 3 -
At June 30, 2017, total net position, which represents the residual interest in the System’s assets and deferred
outflows of resources after liabilities and deferred inflows of resources are deducted, was $625.0 million, a decrease
of $55.2 million or 8.1% over last fiscal year’s net position of $680.2 million. This decrease was primarily due to an
increase in the net pension liability that resulted in a net decrease of unrestricted net position of $67.6 million and a
decrease in capital assets, net of related debt of $7.9 million primarily driven by depreciation in excess of new
depreciable capital assets and disposals of assets.
Statement of Net Position
The Statement of Net Position presents the overall financial position of the System at the end of the fiscal year, and
includes all assets and liabilities of the Connecticut State University System, including capital assets net of
depreciation.
Current assets at June 30, 2017 of $377.6 million increased by $59.7 million or 18.8% primarily due to the increase
in investments of $42.9 million. Total current assets represent coverage of current operating expenses excluding
depreciation and amortization of approximately nine months. The System’s current ratio of 2.7:1 at the end of fiscal
year 2017 is an increase from a ratio of 2.2:1 from the prior fiscal year end.
Total non-current assets at June 30, 2017, of $1,363.4 million decreased by $5.0 million or 0.4% from the fiscal
year 2016 level of $1,368.3 million primarily due to decreases in net investment in plant of $14.4 million offset by
an increase in cash and cash equivalents of $7.1 million.
Current liabilities at June 30, 2017 of $138.8 million decreased by $4.0 million, mainly due to the decrease in
unearned tuition, fees and grant revenue of $14.8 million, an increase in accrued salaries and benefits of $6.3 million
and an increase in accounts payable of $2.5 million.
Non-current liabilities at June 30, 2017 of $1,390.4 million increased by $361.5 million. This is mainly due to an
increase in net pension liability of $320.9 million resulting from an increase to CSUS’s proportionate share of the
State’s pension liability and a increase in bonds payable of $40.7 million due to debt service payments.
Pension liabilities represent the System’s proportionate share of the State Employee Retirement System’s (“SERS”)
and the Teachers Retirement System’s (“TRS”) net pension liability. The System’s total net pension liability was
$985.0 million at June 30, 2017, an increase of $320.9 million from fiscal year 2016. This increase was consistent
with the change in net pension liability for the entire SERS and TRS pension systems.
Net position invested in capital assets, net of related debt, represents the System’s capital assets net of accumulated
depreciation and outstanding principal balances of debt attributable to the acquisition, construction or improvement
of those assets.

Connecticut State University System
Management Discussion and Analysis (Unaudited)
June 30, 2017 and 2016
- 4 -
Restricted net position is divided into two classifications, expendable and nonexpendable. Restricted expendable net
position is subject to externally imposed restrictions governing its use. In the System, restricted expendable net
position primarily represents the residual balances of the System’s unexpended grant funds. Restricted
nonexpendable net position comprises the System’s permanent funds such as the Endowment Fund. Most endowed
funds are held with the individual institutions foundations for the benefit of the Universities.
Unrestricted net position represents funds available to support CSUS activities and operations at the discretion of
the Board of Regents, the President, and the University Presidents. Unrestricted net position is negative due to the
System’s share of the State’s pension plan’s net pension liability (“NPL”). Although unrestricted net position is not
subject to externally imposed restrictions, substantially all of the System’s reserves are allocated for academic
initiatives or programs and for capital and other purposes including University fee receipts and parking fee receipts
that have been designated by Universities to meet debt service obligations.
Without reflecting the net pension liability, unrestricted net position increased $6.3 million from 2016 to 2017. This
is primarily the result of increases in tuition and fee revenue totaling $14.8 million which are partially offset by
increased operating expenses.
FY13 FY14 FY15 FY16 FY17
$985.5 $1,090.8 $115.1 $136.8 $143.1
UNP Adjusted for Pension Liability ($370.5) ($361.6) ($429.2)
Connecticut State University System
Management Discussion and Analysis (Unaudited)
June 30, 2017 and 2016
- 5 -
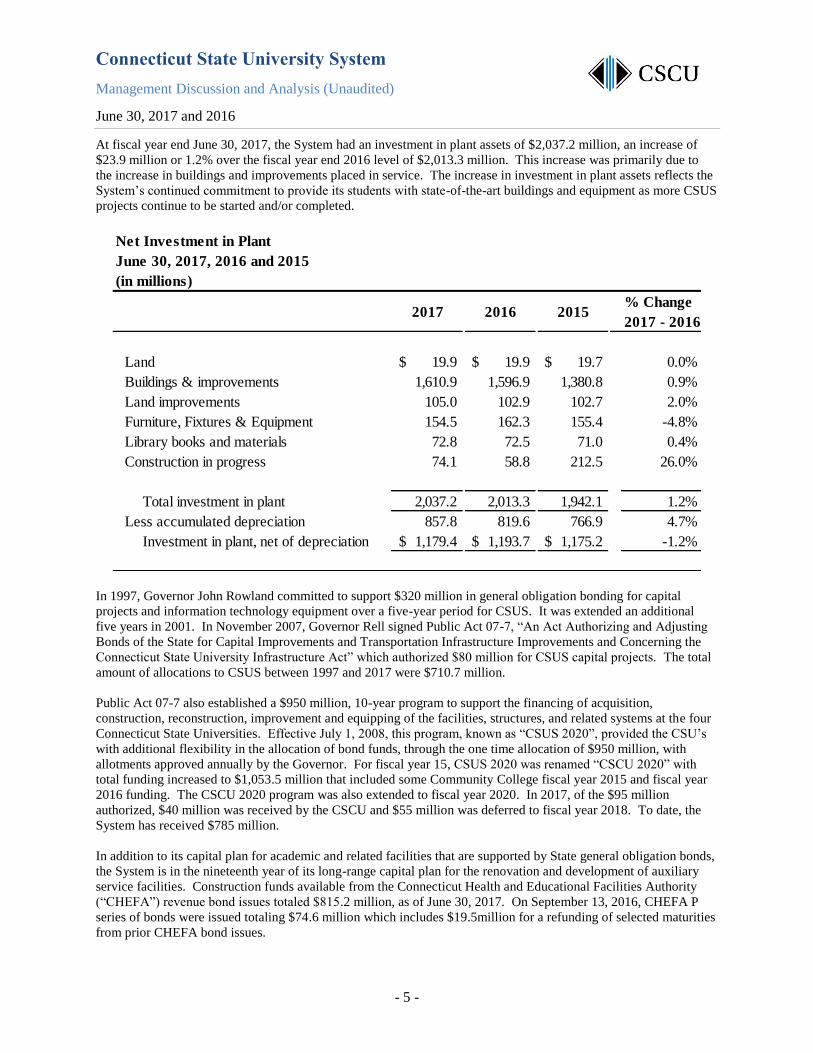
At fiscal year end June 30, 2017, the System had an investment in plant assets of $2,037.2 million, an increase of
$23.9 million or 1.2% over the fiscal year end 2016 level of $2,013.3 million. This increase was primarily due to
the increase in buildings and improvements placed in service. The increase in investment in plant assets reflects the
System’s continued commitment to provide its students with state-of-the-art buildings and equipment as more CSUS
projects continue to be started and/or completed.
In 1997, Governor John Rowland committed to support $320 million in general obligation bonding for capital
projects and information technology equipment over a five-year period for CSUS. It was extended an additional
five years in 2001. In November 2007, Governor Rell signed Public Act 07-7, “An Act Authorizing and Adjusting
Bonds of the State for Capital Improvements and Transportation Infrastructure Improvements and Concerning the
Connecticut State University Infrastructure Act” which authorized $80 million for CSUS capital projects. The total
amount of allocations to CSUS between 1997 and 2017 were $710.7 million.
Public Act 07-7 also established a $950 million, 10-year program to support the financing of acquisition,
construction, reconstruction, improvement and equipping of the facilities, structures, and related systems at the four
Connecticut State Universities. Effective July 1, 2008, this program, known as “CSUS 2020”, provided the CSU’s
with additional flexibility in the allocation of bond funds, through the one time allocation of $950 million, with
allotments approved annually by the Governor. For fiscal year 15, CSUS 2020 was renamed “CSCU 2020” with
total funding increased to $1,053.5 million that included some Community College fiscal year 2015 and fiscal year
2016 funding. The CSCU 2020 program was also extended to fiscal year 2020. In 2017, of the $95 million
authorized, $40 million was received by the CSCU and $55 million was deferred to fiscal year 2018. To date, the
System has received $785 million.
In addition to its capital plan for academic and related facilities that are supported by State general obligation bonds,
the System is in the nineteenth year of its long-range capital plan for the renovation and development of auxiliary
service facilities. Construction funds available from the Connecticut Health and Educational Facilities Authority
(“CHEFA”) revenue bond issues totaled $815.2 million, as of June 30, 2017. On September 13, 2016, CHEFA P
series of bonds were issued totaling $74.6 million which includes $19.5million for a refunding of selected maturities
from prior CHEFA bond issues.
Net Investment in Plant
June 30, 2017, 2016 and 2015
(in millions)
% Change
2017 - 2016
Land 19.9$ 19.9$ 19.7$ 0.0%
Buildings & improvements 1,610.9 1,596.9 1,380.8 0.9%
Land improvements 105.0 102.9 102.7 2.0%
Furniture, Fixtures & Equipment 154.5 162.3 155.4 -4.8%
Library books and materials 72.8 72.5 71.0 0.4%
Construction in progress 74.1 58.8 212.5 26.0%
Total investment in plant 2,037.2 2,013.3 1,942.1 1.2%
Less accumulated depreciation 857.8 819.6 766.9 4.7%
Investment in plant, net of depreciation 1,179.4$ 1,193.7$ 1,175.2$ -1.2%
201520162017

Connecticut State University System
Management Discussion and Analysis (Unaudited)
June 30, 2017 and 2016
- 6 -
Statement of Revenues, Expenses and Changes in Net Position
The Statement of Revenues, Expenses and Changes in Net Position presents CSUS’ results of operations, as well as
the non-operating revenues and expenses.
In fiscal year 2017, state appropriations of $355.8 million, representing 43.3% of the System’s total net revenues,
were $24.2 million or 6.4% below fiscal year 2016. State appropriations are received for both operating and capital
purposes. In the current year the System was allotted $276.1 million for operating purposes, a decrease of 7.2%
over the prior year, and $79.7 million for capital purposes a decrease of 3.5% from the prior year. The majority of
the State appropriation dollars for operating purposes are used to fund salaries and fringe benefits. Approximately
54% of the System’s fiscal year 2017 salary and fringe benefit costs were funded from State appropriations.
Condensed Statements of Revenues, Expenses and Changes in Net Position
June 30, 2017, 2016 and 2015
(in millions)
2017 2016 2015
(Restated*) FY 16 - 17
OPERATING REVENUES
Tuition and fees, net 271.5$ 256.7$ 245.2$ 5.8%
Auxiliary revenues 113.9 117.7 108.3 -3.2%
Grants and indirect cost recoveries 21.7 24.1 24.7 -10.0%
Other 22.1 20.0 22.9 10.5%
Total operating revenues 429.2 418.5 401.1 2.6%
OPERATING EXPENSES
Expenses before depreciation and amortization 811.2 754.8 714.4 7.5%
Depreciation 64.9 64.1 60.2 1.2%
Amortization 0.1 0.1 0.1 0.0%
Total operating expenses 876.2 819.0 774.7 7.0%
Operating loss (447.0) (400.5) (373.6) -11.6%
NON-OPERATING REVENUES (EXPENSES)
State appropriations - general fund 276.1 297.4 285.0 -7.2%
State appropriations - bond fund 79.7 82.6 111.9 -3.5%
PELL grant revenue 40.3 41.3 40.7 -2.4%
Investment income 3.2 1.7 1.1 88.2%
Other (7.5) (8.9) (8.8) 15.7%
Total non-operating revenues (expenses) 391.8 414.1 429.9 -5.4%
NET POSITION
Change in net position (55.2) 13.6 56.3 -505.9%
Net position, beginning of year 680.2 666.6 610.3 2.0%
Net position, end of year 625.0$ 680.2$ 666.6$ -8.1%
% Change
*Amounts previously reported for beginning net position for the adoption of GASB 68 in fiscal year 2015 have been
restated. In addition, PELL grant revenues has been reclassified from operating revenues to non-operating revenues.

Connecticut State University System
Management Discussion and Analysis (Unaudited)
June 30, 2017 and 2016
- 7 -
In fiscal 2017, total operating expenses less depreciation and amortization of $811.3 million increased by $56.5
million or 7.5% from the prior fiscal year. The primary cause of the increase was related to pension expense
associated with GASB 68 accounting of $73.9 million. This is CSU’s proportionate share of the pension
expense net of actual contributions made subsequent to the measurement date. Other changes included a decrease in
professional services costs of $6.7 million and a decrease of salary and wages of $5.4 million achieved through
budget reductions and holding certain positions vacant.
Connecticut State University System
Management Discussion and Analysis (Unaudited)
June 30, 2017 and 2016
- 8 -
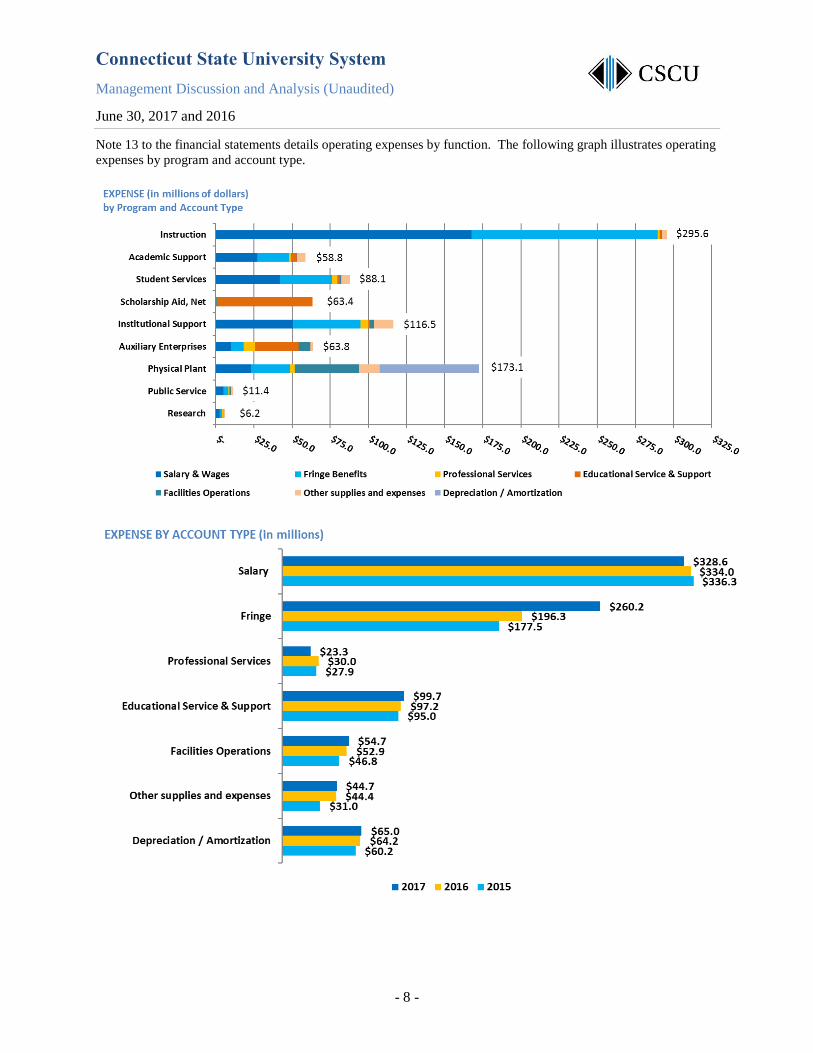
Note 13 to the financial statements details operating expenses by function. The following graph illustrates operating
expenses by program and account type.

Connecticut State University System
Management Discussion and Analysis (Unaudited)
June 30, 2017 and 2016
- 9 -
Statement of Cash Flows
The statement of cash flows presents the significant sources and uses of cash. The System’s net change in cash and
cash equivalents at June 30, 2017 increased $1.8 million or 16.8%. This was a result of a $23.0 million decrease in
cash used in operating activities, a $14.1 million decrease in state appropriations, a $74.0 million increase in cash
used in capital and related financing activities, offset by a reduction of $83.6 million in cash provided by investing
activities.
Economic Outlook
The CSUS will confront significant challenges and be afforded certain opportunities in the years ahead. The factors
that will have the greatest financial impact include the trend of flattening and declining enrollment and the current
and expected near-term fiscal condition of the state of Connecticut.
Enrollment
The following table indicates historical enrollment of undergraduate and graduate students for the 2012-2013
through 2016-2017 academic years. Also indicated is full-time equivalent student enrollment.
Condensed Statement of Cash Flows
June 30, 2017, 2016 and 2015
(in millions)
2017 2016 2015
(Restated*)
NET CASH PROVIDED BY (USED IN)
Operating activities (297.0)$ (320.0)$ (282.7)$ 7.2%
Non-Capital financing activities 321.2 333.0 330.9 -3.5%
Capital & related financing activities 31.2 (43.0) (93.5) 172.6%
Investing activities (42.9) 40.7 56.2 -205.4%
Net change in cash and cash equivalents 12.5 10.7 10.9 16.8%
CASH AND CASH EQUIVALENTS
Cash and cash equivalents, beginning of year 341.4 330.7 319.8 3.2%
Cash and cash equivalents, end of year 353.9$ 341.4$ 330.7$ 3.7%
% Change
*FY 15 is restated to reflect PELL revenue as non-capital financing activities rather than operating activities.
Year
Ending
June 30 Undergraduate % Change Graduate % Change TOTAL % Change
Full Time
Equivalent % Change
2017 27,853 -2.04% 5,334 2.34% 33,187 -1.36% 27,263 -0.75%
2016 28,434 -0.53% 5,212 -5.51% 33,646 -1.33% 27,470 -0.95%
2015 28,585 -0.40% 5,516 2.85% 34,101 0.11% 27,734 -0.70%
2014 28,699 -2.08% 5,363 -2.77% 34,062 -2.19% 27,930 -1.98%
2013 29,308 -2.14% 5,516 -9.54% 34,824 -3.39% 28,494 -2.50%
Fall Headcount Enrollment and Full Time Equivalent
Connecticut State University System
Management Discussion and Analysis (Unaudited)
June 30, 2017 and 2016
- 10 -
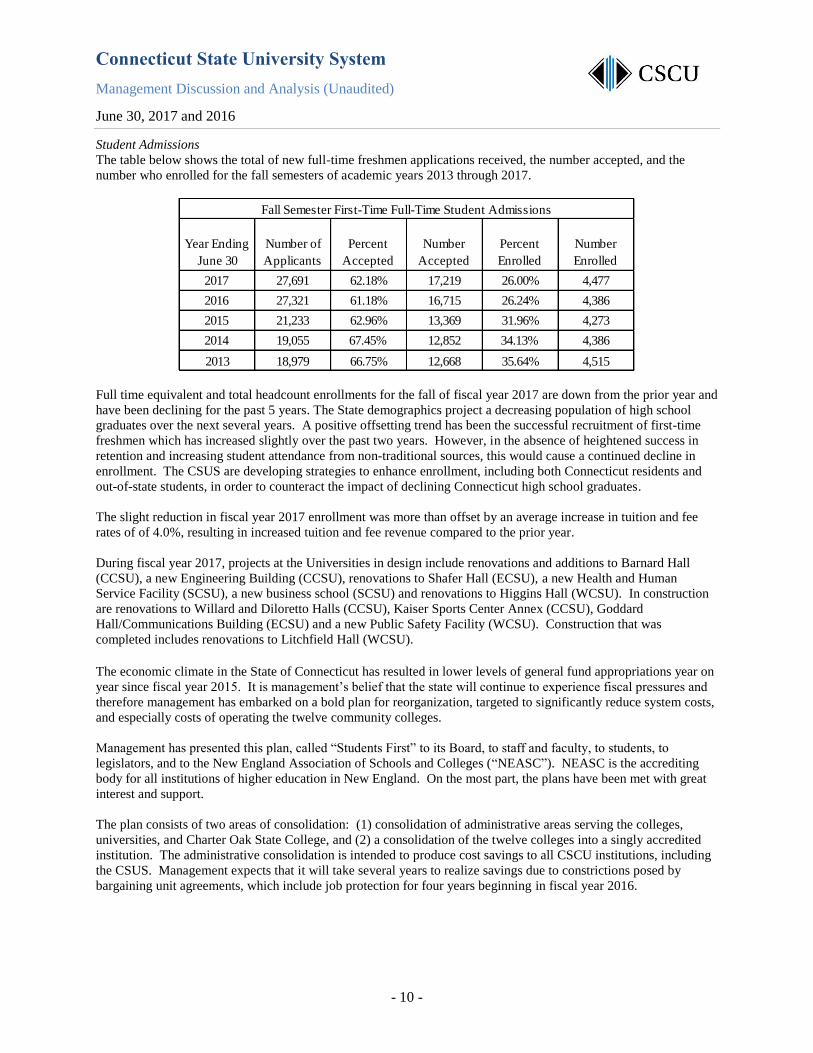
Student Admissions
The table below shows the total of new full-time freshmen applications received, the number accepted, and the
number who enrolled for the fall semesters of academic years 2013 through 2017.
Full time equivalent and total headcount enrollments for the fall of fiscal year 2017 are down from the prior year and
have been declining for the past 5 years. The State demographics project a decreasing population of high school
graduates over the next several years. A positive offsetting trend has been the successful recruitment of first-time
freshmen which has increased slightly over the past two years. However, in the absence of heightened success in
retention and increasing student attendance from non-traditional sources, this would cause a continued decline in
enrollment. The CSUS are developing strategies to enhance enrollment, including both Connecticut residents and
out-of-state students, in order to counteract the impact of declining Connecticut high school graduates.
The slight reduction in fiscal year 2017 enrollment was more than offset by an average increase in tuition and fee
rates of of 4.0%, resulting in increased tuition and fee revenue compared to the prior year.
During fiscal year 2017, projects at the Universities in design include renovations and additions to Barnard Hall
(CCSU), a new Engineering Building (CCSU), renovations to Shafer Hall (ECSU), a new Health and Human
Service Facility (SCSU), a new business school (SCSU) and renovations to Higgins Hall (WCSU). In construction
are renovations to Willard and Diloretto Halls (CCSU), Kaiser Sports Center Annex (CCSU), Goddard
Hall/Communications Building (ECSU) and a new Public Safety Facility (WCSU). Construction that was
completed includes renovations to Litchfield Hall (WCSU).
The economic climate in the State of Connecticut has resulted in lower levels of general fund appropriations year on
year since fiscal year 2015. It is management’s belief that the state will continue to experience fiscal pressures and
therefore management has embarked on a bold plan for reorganization, targeted to significantly reduce system costs,
and especially costs of operating the twelve community colleges.
Management has presented this plan, called “Students First” to its Board, to staff and faculty, to students, to
legislators, and to the New England Association of Schools and Colleges (“NEASC”). NEASC is the accrediting
body for all institutions of higher education in New England. On the most part, the plans have been met with great
interest and support.
The plan consists of two areas of consolidation: (1) consolidation of administrative areas serving the colleges,
universities, and Charter Oak State College, and (2) a consolidation of the twelve colleges into a singly accredited
institution. The administrative consolidation is intended to produce cost savings to all CSCU institutions, including
the CSUS. Management expects that it will take several years to realize savings due to constrictions posed by
bargaining unit agreements, which include job protection for four years beginning in fiscal year 2016.
Year Ending
June 30
Number of
Applicants
Percent
Accepted
Number
Accepted
Percent
Enrolled
Number
Enrolled
2017 27,691 62.18% 17,219 26.00% 4,477
2016 27,321 61.18% 16,715 26.24% 4,386
2015 21,233 62.96% 13,369 31.96% 4,273
2014 19,055 67.45% 12,852 34.13% 4,386
2013 18,979 66.75% 12,668 35.64% 4,515
Fall Semester First-Time Full-Time Student Admissions
Connecticut State University System
Management Discussion and Analysis (Unaudited)
June 30, 2017 and 2016
- 11 -
On October 31, 2017, the Governor signed a bipartisan budget passed by the General Assembly for the biennium
ending June 30, 2019. The package included an $880 million shortfall, which the Governor closed on November 17,
2017. The CSCU portion of the holdbacks and lapses totaled $26 million when considering the impact of fringe
benefits. Management continues to work on the implementation of the Students First strategic initiatives in order to
cut costs and compensate for the continued cuts in state funding.
Detailed information concerning the consolidation of administrative areas and the singly accredited college is
available on the CSCU website.
Additional Information
This financial report is designed to provide a general overview of CSUS’s finances and to show accountability for
the funds it receives. Questions about this report or requests for additional financial information should be directed
to Erika Steiner, Chief Financial Officer, Connecticut State Colleges & Universities (860-723-0251). University
specific questions may also be directed to the Vice President for Finance at each individual University.

- 12 -
REPORT OF INDEPENDENT CERTIFIED PUBLIC ACCOUNTANTS
To the Board of Regents of
Connecticut State Colleges and Universities
Report on the financial statements
We have audited the accompanying financial statements of the business-type activities and the aggregate discretely
presented component units of the Connecticut State University System (The System Office; Central Connecticut
State University; Eastern Connecticut State University; Southern Connecticut State University; and Western
Connecticut State University), an enterprise fund of the State of Connecticut (collectively, “CSUS” or the “System”)
as of and for the years ended June 30, 2017 and 2016, and the related notes to the financial statements, which
collectively comprise the System’s basic financial statements as listed in the table of contents.
Management’s responsibility for the financial statements
Management is responsible for the preparation and fair presentation of these financial statements in accordance with
accounting principles generally accepted in the United States of America; this includes the design, implementation,
and maintenance of internal control relevant to the preparation and fair presentation of financial statements that are
free from material misstatement, whether due to fraud or error.
Auditor’s responsibility
Our responsibility is to express opinions on these financial statements based on our audits. We did not audit the
financial statements of the aggregate discretely presented component units (the affiliated foundations
(“Foundations”)), which statements reflect total assets of $147.8 million and $130.8 million and total net assets of
$146.6 million and $129.6 million as of June 30, 2017 and 2016, respectively and total revenues, capital gains and
losses, and other support of $28.1 million and $13.5 million, respectively for the years then ended. Those statements
were audited by other auditors whose reports have been furnished to us, and our opinion, insofar as it relates to the
amounts included for the Foundations, is based solely on the reports of other auditors. We conducted our audit in
accordance with auditing standards generally accepted in the United States of America. Those standards require
that we plan and perform the audit to obtain reasonable assurance about whether the financial statements are free
from material misstatement.
Grant Thornton LLP 1400 Computer Drive, 3rd Floor Westborough, MA 01581
T 508.926.2200 F 508.616.2972 GrantThornton.com linkd.in/GrantThorntonUS twitter.com/GrantThorntonUS
Grant Thornton LLP U.S. member firm of Grant Thornton International Ltd
- 13 -
An audit involves performing procedures to obtain audit evidence about the amounts and disclosures in the financial
statements. The procedures selected depend on the auditor’s judgment, including the assessment of the risks of
material misstatement of the financial statements, whether due to fraud or error. In making those risk assessments,
the auditor considers internal control relevant to the System’s preparation and fair presentation of the financial
statements in order to design audit procedures that are appropriate in the circumstances, but not for the purpose of
expressing an opinion on the effectiveness of the System’s internal control. Accordingly, we express no such
opinion. An audit also includes evaluating the appropriateness of accounting policies used and the reasonableness
of significant accounting estimates made by management, as well as evaluating the overall presentation of the
financial statements.
We believe that the audit evidence we have obtained is sufficient and appropriate to provide a basis for our audit
opinions.
Opinions
In our opinion, the financial statements referred to above present fairly, in all material respects, the respective
financial position of the business-type activities and the aggregate discretely presented component units of the
Connecticut State University System as of June 30, 2017 and 2016, and the respective changes in financial position
and, where applicable, cash flows thereof for the years then ended in accordance with accounting principles
generally accepted in the United States of America.
Emphasis of Matter
As discussed in Note 1, the financial statements present only the System, an enterprise fund of the State of
Connecticut, and do not purport to, and do not, present fairly the financial position of the State of Connecticut as of
June 30, 2017 and 2016, the changes in its financial position or where applicable, its cash flows for the years then
ended in accordance with accounting principles generally accepted in the United States of America. Our opinion
is not modified with respect to this matter.
Other matters
Required supplementary information
Accounting principles generally accepted in the United States of America require that the accompanying
Management’s Discussion and Analysis on pages 1 through 11 and the Schedule of Net Pension Liability and
Related Ratios and Schedule of Contributions on pages S-2 through S-5 be presented to supplement the basic
financial statements. Such information, although not a required part of the basic financial statements, is required by
the Governmental Accounting Standards Board who considers it to be an essential part of financial reporting for
placing the basic financial statements in an appropriate operational, economic, or historical context. This required
supplementary information is the responsibility of management. We have applied certain limited procedures to the
required supplementary information in accordance with auditing standards generally accepted in the United States
of America. These limited procedures consisted of inquiries of management about the methods of preparing the
information and comparing the information for consistency with management’s responses to our inquiries, the basic
financial statements, and other knowledge we obtained during our audit of the basic financial statements. We do
not express an opinion or provide any assurance on the information because the limited procedures do not provide
us with sufficient evidence to express an opinion or provide any assurance.

- 14 -
Supplementary information
Our audit was conducted for the purpose of forming opinions on the financial statements that collectively comprise
the System’s basic financial statements. The supplemental Combining Statement of Net Position, Statement of
Revenues, Expenses and Changes in Net Position and Combining Statement of Cash Flows included on pages S-7
through S-14 are presented for purposes of additional analysis and are not a required part of the basic financial
statements. Such supplementary information is the responsibility of management and was derived from and relates
directly to the underlying accounting and other records used to prepare the basic financial statements. The
information has been subjected to the auditing procedures applied in the audit of the basic financial statements and
certain additional procedures. These additional procedures included comparing and reconciling the information
directly to the underlying accounting and other records used to prepare the basic financial statements or to the basic
financial statements themselves, and other additional procedures in accordance with auditing standards generally
accepted in the United States of America. In our opinion, the supplementary information is fairly stated, in all
material respects, in relation to the basic financial statements as a whole.
Westborough, MA
December 20, 2017
Connecticut State University System
Statements of Net Position
As of June 30, 2017 and 2016
The accompanying notes are an integral part of these financial statements.
- 15 -
2017 2016
AssetsCurrent assets
Cash and cash equivalents (Notes 2 and 6) 212,700,710$ 207,246,334$ Investments (Note 2) 76,380,273 33,477,941Student receivables, net (Note 3) 4,357,036 7,582,895Student loans receivable, net (Note 3) 3,627,030 3,791,416Grants receivable, net (Note 3) 2,654,307 2,166,687Miscellaneous receivables, net (Note 3) 1,420,285 1,231,351Due from the State of Connecticut (Note 6) 69,078,182 56,589,698Prepaid expenses and other current assets 7,425,349 5,801,603
Total current assets 377,643,172 317,887,925
Noncurrent assetsCash and cash equivalents (Notes 2 and 6) 141,185,476 134,139,202Investments (Note 2) 34,456,043 31,303,100Student loans receivable, net (Note 3) 7,837,525 7,945,577Other assets 413,806 1,219,678Investment in plant, net of accumulated depreciation (Note 4) 1,179,439,324 1,193,679,179
Total noncurrent assets 1,363,332,174 1,368,286,736
Total assets 1,740,975,346$ 1,686,174,661$
Deferred outflows of resources
Deferred outflows related to pension (Note 8) 414,122,365$ 165,782,862$
Deferred loss on bond refunding 396,167 -
Total deferred outflows of resources 414,518,532$ 165,782,862$
Connecticut State University System
Statements of Net Position
As of June 30, 2017 and 2016 (Continued)
The accompanying notes are an integral part of these financial statements.
- 16 -
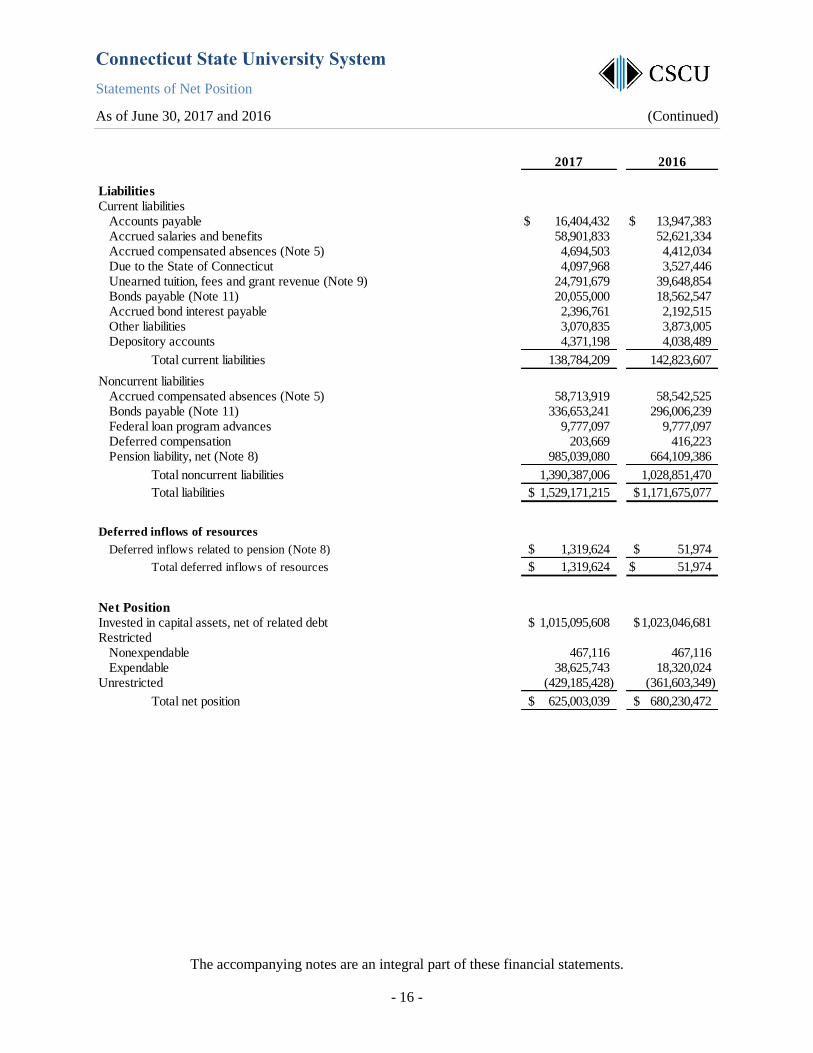
2017 2016
Liabilities
Current liabilitiesAccounts payable 16,404,432$ 13,947,383$ Accrued salaries and benefits 58,901,833 52,621,334 Accrued compensated absences (Note 5) 4,694,503 4,412,034 Due to the State of Connecticut 4,097,968 3,527,446 Unearned tuition, fees and grant revenue (Note 9) 24,791,679 39,648,854 Bonds payable (Note 11) 20,055,000 18,562,547 Accrued bond interest payable 2,396,761 2,192,515 Other liabilities 3,070,835 3,873,005 Depository accounts 4,371,198 4,038,489
Total current liabilities 138,784,209 142,823,607
Noncurrent liabilitiesAccrued compensated absences (Note 5) 58,713,919 58,542,525Bonds payable (Note 11) 336,653,241 296,006,239Federal loan program advances 9,777,097 9,777,097Deferred compensation 203,669 416,223Pension liability, net (Note 8) 985,039,080 664,109,386
Total noncurrent liabilities 1,390,387,006 1,028,851,470
Total liabilities 1,529,171,215$ 1,171,675,077$
Deferred inflows of resources
Deferred inflows related to pension (Note 8) 1,319,624$ 51,974$
Total deferred inflows of resources 1,319,624$ 51,974$
Net Position
Invested in capital assets, net of related debt 1,015,095,608$ 1,023,046,681$ Restricted
Nonexpendable 467,116 467,116Expendable 38,625,743 18,320,024
Unrestricted (429,185,428) (361,603,349)
Total net position 625,003,039$ 680,230,472$

Connecticut State University System
Combined Statements of Financial Position – Component Units
As of June 30, 2017 and 2016
The accompanying notes are an integral part of these financial statements.
- 17 -
2017 2016
Assets
Cash and cash equivalents 7,176,351$ 5,523,839$ Investments 127,948,590 109,271,002Contributions and other receivables 7,959,344 9,834,471Prepaid expenses and other assets 318,360 972,720
Investment in plant, net 4,425,222 5,178,986
Total assets 147,827,867$ 130,781,018$
Liabilities
Accounts payable 258,508$ 301,587$ Custodial obligation payable 60,473 58,200Other liabilities 928,191 726,028Long-term debt 14,563 57,019
1,261,735 1,142,834
Net assets
Unrestricted 7,311,153 2,177,957Temporarily restricted 49,339,538 41,006,906Permanently restricted 89,915,441 86,453,321
Total net assets 146,566,132 129,638,184
Total liabilities and net assets 147,827,867$ 130,781,018$

Connecticut State University System
Statements of Revenues, Expenses and Changes in Net Position
Years Ended June 30, 2017 and 2016
The accompanying notes are an integral part of these financial statements.
- 18 -
2017 2016
Operating revenuesTuition and fees
Tuition and fees (Note 1) 318,146,840$ 303,029,788$ Less
Scholarships allowance (31,112,424) (31,475,656)Waivers (15,558,083) (14,890,945)
Tuition and fees, net of scholarship allowances and waivers 271,476,333 256,663,187
Federal grants and contracts 4,574,806 4,727,211
State and local grants and contracts 11,626,763 14,846,852Nongovernment grants and contracts 5,031,522 4,208,779
Indirect cost recoveries 473,855 283,120
Auxiliary revenues (Note 1) 113,869,301 117,737,368
Other operating revenues 22,147,241 20,027,902
Total operating revenues 429,199,821 418,494,419
Operating expenses (Note 10)
Salaries and wages 328,648,052 334,041,973
Fringe benefits 260,242,533 196,319,389
Professional services and fees 23,259,388 30,034,822
Educational services and support 99,737,639 97,230,627
Travel expenses 6,367,992 6,753,943
Operation of facilities 54,654,790 52,856,778
Other operating supplies and expenses 38,354,652 37,563,493
Depreciation expense 64,860,552 64,131,356
Amortization expense 90,584 100,059
Total operating expenses 876,216,182 819,032,440
Operating loss (447,016,361) (400,538,021)
Nonoperating revenues (expenses)
State appropriations 276,121,962 297,430,651
Pell grant revenue 40,259,215 41,340,475
Gifts 3,396,620 3,818,896
Investment income 3,229,811 1,691,647
Interest expense (11,178,780) (10,147,405)
State financed plant facilities - 955,205
Other nonoperating revenues, net 1,407,256 2,322,347
Transfers to the State of Connecticut (Note 6) - (4,100,000)
Net nonoperating revenues 313,236,084 333,311,816
Loss before other changes in net position (133,780,277) (67,226,205)
Other changes in net position
State appropriations restricted for capital purposes 79,714,379 81,623,919
Loss on disposal of capital assets (1,161,535) (783,908)
Net other changes in net position 78,552,844 80,840,011
Net change in net position (55,227,433) 13,613,806
Net position
Net position - beginning of year 680,230,472 666,616,666
Net position - end of year 625,003,039$ 680,230,472$

Connecticut State University System
Statement of Activities – Component Units
Years Ended June 30, 2017 and 2016
The accompanying notes are an integral part of these financial statements.
- 19 -
Temporarily Permanently
Unrestricted Restricted Restricted 2017 2016
Revenues, gains and other support
Contributions 5,096,815$ 4,964,130$ 3,410,690$ 13,471,635$ 13,067,868$ Program income 177,149 403,407 - 580,556 408,488Investment income 253,225 4,261,096 8,241 4,522,562 1,804,981Gain (loss) on investments 241,909 9,534,556 4,674 9,781,139 (2,116,425)Other income 372,542 - - 372,542 336,648Disposal of assets gain (loss) (605,649) - - (605,649) 17,632Net assets released from restrictions and reclassifications 10,421,859 (10,413,159) (8,700) - -
Total revenues, gains and other support 15,957,850 8,750,030 3,414,905 28,122,785 13,519,192
Operating expenses -Scholarships and awards 1,386,401 - - 1,386,401 1,512,969University support 5,472,396 - - 5,472,396 5,844,311Auxiliary services 1,101,744 - - 1,101,744 1,033,041Academic enrichment 516,452 - - 516,452 574,881Fundraising 1,521,521 - - 1,521,521 1,608,123Management and general 1,196,323 - - 1,196,323 1,180,762
Total operating expenses 11,194,837 - - 11,194,837 11,754,087
Transfers between funds 28,766 (75,981) 47,215 - -
Changes in net assets 4,791,779 8,674,049 3,462,120 16,927,948 1,765,105
Net assets
Beginning of year 2,177,957 41,006,906 86,453,321 129,638,184 127,873,079
End of year 6,969,736$ 49,680,955$ 89,915,441$ 146,566,132$ 129,638,184$

Connecticut State University System
Statements of Cash Flows
Years Ended June 30, 2017 and 2016
The accompanying notes are an integral part of these financial statements.
- 20 -
2017 2016
Cash flows from operating activities
Tuition and fees 251,413,502$ 229,949,051$
Grants and contracts 20,858,463 24,188,231
Auxiliary revenues 105,259,347 115,763,132
Other operating revenues 27,558,713 32,393,105
Payments to employees for salaries and benefits (507,940,412) (511,559,867)
Payments to suppliers (10,255,623) (14,316,581)
Professional services and fees (23,493,939) (30,375,294)
Educational services and support (99,737,639) (97,230,628)
Travel expenses (6,367,992) (6,753,943)
Operation of facilities (50,466,144) (56,083,637)
Other operating supplies and expenses (24,967,399) (26,528,678)
University fee receipts 21,167,791 20,526,003
Net cash used in operating activities (296,971,332) (320,029,106)
Cash flows from noncapital financing activities
State appropriations 275,494,619 289,638,794
Gifts for other than capital purposes 3,396,620 3,818,898
Nonoperating grants and revenue other 42,340,486 43,662,810
Transfers to the State of Connecticut - (4,100,000)
Net cash provided by noncapital financing activities 321,231,725 333,020,502
Cash flows from investing activities
Proceeds from sales and maturities of investments 78,299,680 74,993,158
Purchases of investments (124,354,954) (35,963,347)
Interest and dividends received on investments 3,086,054 1,626,636
Net cash (used in) provided by investing activities (42,969,220) 40,656,447
Cash flows from capital and related financing activities
Cash paid for capital assets (54,704,099) (98,388,896)
State capital appropriations received 56,599,987 87,841,704
Proceeds from new bond issuance 61,854,803 -
Proceeds from refunding bonds 20,438,088 -
Repayments of capital debt and leases (7,492,547) (20,247,455)
Interest paid on capital debt and leases (13,467,221) (12,157,834)
Payments to refunded bond escrow agent (31,345,489) -
Bond issuance payments (674,045) -
Net cash provided by (used in) capital and related financing activities 31,209,477 (42,952,481)
Net increase in cash and cash equivalents 12,500,650 10,695,362
Cash and cash equivalents, beginning of year 341,385,536 330,690,174
Cash and cash equivalents, end of year 353,886,186$ 341,385,536$

Connecticut State University System
Statements of Cash Flows
Year Ended June 30, 2017 and 2016 (Continued)
The accompanying notes are an integral part of these financial statements.
- 21 -
2017 2016
Reconciliation of operating loss to net cash used in operating activities
Operating loss (447,016,361)$ (400,538,021)$
Adjustments to reconcile operating loss to net cash used in operating activities
Depreciation expense 64,860,552 64,131,356
Amortization 90,585 100,059
Changes in assets and liabilities:
Receivables 2,821,745 1,139,793
Prepaid expenses and other (873,050) (1,269,656)
Accounts payable 5,251,284 (3,285,587)
Accrued salaries and benefits 6,280,499 4,191,317
Other liabilities (621,611) (1,436,921)
Due to/from the State of Connecticut 570,522 (603,840)
Unearned tuition, fees and grant revenues (2,767,356) 1,765,362
Deferred compensation (212,554) (150,727)
Depository accounts 332,709 563,014
Accrued compensated absences 453,863 2,537,281
Pension Liability 320,929,694 76,492,502
Changes in deferred outflows and inflows of resources
Deferred pension contribution (248,339,503) (42,228,687)
Deferred pension asset gains 1,267,650 (21,436,351)
Net cash used in operating activities (296,971,332)$ (320,029,106)$
Noncash financing activity
Fixed assets included in accounts payable 4,117,230$ 5,252,684$
State financed plant facilities -$ 955,205$
Reconciliation of cash and cash equivalents to the combined statements of net position
Cash and cash equivalents classified as current assets 212,700,710$ 207,246,334$
Cash and cash equivalents classified as noncurrent assets 141,185,476 134,139,202
353,886,186$ 341,385,536$

Connecticut State University System
Notes to the Financial Statements
June 30, 2017 and 2016
- 22 -
1. Summary of Significant Accounting Policies
Organization
The Connecticut State Colleges and Universities System (“CSCU”) was established by the State of
Connecticut (the “State”) in 2011 via Public Act 11-48 as amended by Public Act 11-61. This
brought together the governance structure for the Connecticut State University System (“CSUS”),
the Connecticut Community College System (“CCC”) and Charter Oak State College (“COSC”)
under the newly formed Board of Regents (“BOR”) for Higher Education. The financial statements
presented herein represent only the financial activities of CSUS. Separate financial statements are
issued for CCC and COSC.
CSCU consists of seventeen separate institutions including four state universities, twelve
community colleges and Charter Oak State College. CSCU also includes the Connecticut Distance
Learning Consortium (“CTDLC”) as part of COSC, which provides services and support to help
educational institutions and other learning-focused organizations develop and deliver technology
enhanced learning opportunities to promote workforce training and development. The CSCU
system offers associate degrees, baccalaureate, graduate and certificate programs, applied doctoral
degree programs in education as well as short-term certificates and individual coursework in both
credit and noncredit programs.
The System Office (“SO”) administers certain activities centrally for the provision of management
information systems and services to the Universities. Primary among these activities are
administration of certain system-wide information systems, telecommunications, capital projects
planning and rebudgeting, technical support and debt service. Costs of such activities, including
the allocation of funds to the Universities from bond proceeds, are included in the activity of the
SO and supported by revenues from State appropriations and Universities’ tuition and fee revenues
which are allocated to the System Office through the budget allocation process. Such activities are
eliminated in the statement of revenues, expenses and changes in net position.
Basis of Presentation
The financial statements for the CSUS institutions have been prepared using the economic
resources measurement focus and the accrual basis of accounting in accordance with accounting
principles generally accepted in the United States of America, as prescribed by GASB. Revenues
are recorded when earned and expenses are recorded when a liability is incurred, regardless of the
timing of related cash flows. These financial statements include the statements of CSUS
institutions (the “System”) which include, Central Connecticut State University (CCSU), Eastern
Connecticut State University (ECSU), Southern Connecticut State University (SCSU), Western
Connecticut State University (WCSU), and SO and their aggregate discretely presented component
units (primarily the foundations that support the four universities).
CSUS’s financial statements include three statements: the statements of net position, the statements
of revenues, expenses, and changes in net position and the statements of cash flows.
The statements of net position present information on all of the system’s assets, liabilities,
deferred outflows and inflows, and net position.
The statements of revenues, expenses and changes in net position present information showing
how the incumbent system’s net position changed during the fiscal years presented. All
changes in net position are reported when the underlying event giving rise to the change

Connecticut State University System
Notes to the Financial Statements
June 30, 2017 and 2016
- 23 -
occurs, regardless of the timing of related cash flows. Thus, certain revenues and expenses are
reported in these statements for items that will only result in cash flows in future fiscal periods
(e.g., the accrual for compensated absences).
The statement of cash flows is presented using the direct method. The direct method of cash
flow reporting portrays net cash flow from operations by major class of operating receipts and
expenditures (e.g., payments to employees for salaries and benefits).
Several legally separate, tax-exempt, affiliated organizations (the “Foundations”) must be
considered component units of the CSUS and are presented discretely in these financial statements.
The Foundations act primarily as fund-raising organizations to supplement the resources that are
available to the Universities in support of their programs. Although the Universities do not control
the timing or amount of receipts from the Foundations, the majority of resources or income thereon
that the Foundations hold and invest is restricted to the activities of the Universities by the donors.
Since these restricted resources held by the Foundations can only be used by, or for the benefit of,
the Universities, the Foundations are considered component units of CSUS primary institutions.
The Foundations are private nonprofit organizations that report under FASB standards, which
include guidelines for Financial Reporting for Not-for-Profit Organizations. As such, certain
revenue recognition criteria and presentation features are different from GASB revenue recognition
criteria and presentation features. The disclosures included in the financial statements address only
the Universities and not the related Foundations. No modifications have been made to the
Foundation’s financial information in CSUS’s financial reporting entity for these differences.
Net Position
Resources are classified for reporting purposes into the following four net position categories:
Invested in Capital Assets, Net of Related Debt
Capital assets, at historical cost or fair market value on date of gift, net of accumulated
depreciation and outstanding principal balances of debt attributable to the acquisition,
construction or improvement of those assets. Similar net assets are included in unrestricted net
assets in the statements of the component units.
Restricted Nonexpendable
Net position subject to externally imposed stipulations that they be maintained in perpetuity by
CSUS. Similar net assets are referred to as permanently restricted net assets in the statements
of the component units.
Restricted Expendable
Net position whose use by CSUS is subject to externally imposed stipulations that can be
fulfilled by actions of CSUS pursuant to those stipulations or that expire by the passage of
time. Similar net assets are referred to as temporarily restricted net assets in the statements of
the component units.
Connecticut State University System
Notes to the Financial Statements
June 30, 2017 and 2016
- 24 -
Unrestricted
Net position that is not subject to externally imposed stipulations is considered unrestricted.
Unrestricted net position may be designated for the specific purpose by actions of management
or the BOR or may otherwise be utilized to satisfy certain contractual agreements with outside
parties. Substantially all unrestricted net position will be utilized for support for academic and
research programs and initiatives, and capital programs.
Classification of Assets and Liabilities
CSUS presents short-term and long-term assets and liabilities in the statements of net position.
Short-term assets include balances with maturities of one year or less, and assets expected to be
received or used within one year or less, from the reporting date. Long-term assets represent
balances with maturities of greater than one year, and assets expected to be received or used after
one year, from the reporting date. Cash and cash equivalents and investments presented as short-
term in the statements of net position include balances with a maturity of one year or less from the
reporting date. Long-term cash and cash equivalents and investments include balances with a
maturity of greater than one year from the reporting date and balances that have externally imposed
restrictions as to use.
Cash and Cash Equivalents
Cash and cash equivalents consist of cash held by the state treasurer in a Short-Term Investment
Fund (“STIF”), state general fund and capital appropriations, and petty cash. The STIF, stated at
market value, is held on behalf of CSUS by the State Treasurer and has original maturities of three
months or less (see Notes 2 and 6). CSUS has long-term investments which include debt service
reserve funds which are restricted for purposes in accordance with CHEFA regulations. Interest
income is recognized on the accrual basis.
The largest inflow of cash related to non-capital financing is State appropriations and the portion of
bond appropriations expended for non-capitalized equipment, deferred maintenance and other non-
capital items. The appropriation is treated as a cash equivalent for accounting and reporting
purposes, and is included in the cash flow statement.
Fair Value of Financial Instruments
Fair value approximates carrying value for cash and cash equivalents, notes and accounts
receivable, accounts payable, accrued interest and deposits. Investments are carried at fair value,
based upon quoted market prices.
Investment in Plant
Capital assets of the primary institutions are stated at historical cost or, in the case of donated
property, at acquisition value at the date of the gift. Land, capitalized collections, and construction
in progress are not depreciated. Construction period interest costs in excess of earnings associated
with related unspent debt proceeds are capitalized as a component of the fixed asset. Depreciation
of capital assets is calculated on a straight-line basis over the respective asset’s estimated useful
life. Useful lives assigned to assets are as follows:
Land improvements 20 years
Building and building improvements 5 - 40 years
Furniture, fixtures and equipment 5 - 15 years
Library materials 10 - 20 years
Connecticut State University System
Notes to the Financial Statements
June 30, 2017 and 2016
- 25 -
Major construction projects for new physical plant and original equipment financed by the State of
Connecticut capital outlay appropriations are managed and controlled by the Division of
Construction Services of the State of Connecticut (“DCS”). The cost value of the project is
recognized as revenue and recorded as state financed plant facilities by the Colleges and
Universities when eligibility requirements are met.
Connecticut State Colleges and Universities comprehensive long-term capital infrastructure
investment plan (“CSCU 2020”), was developed consistent with master facilities plans established
by the individual Colleges and Universities. In regards to CSCU 2020 projects, DCS administers
the larger projects – generally those with a budget in excess of $2 million. For CSCU 2020
projects, the state general obligation bond proceeds are deposited into the CSCU 2020 Fund. For
the previously mentioned projects, CSCU does not receive the appropriation, which is why the
revenue and capital asset are not recorded until project completion. The revenue recognized for
CSCU 2020 projects being administered by DCS is included in “State appropriations restricted for
capital purposes”.
Title to all assets, whether purchased, constructed or donated, is held physically by the State of
Connecticut.
Interest Capitalization
Interest expense incurred during the construction of capital assets is capitalized, if material, net of
interest income earned on related debt proceeds. CSUS incurred net interest expense of $12.0
million in each of the fiscal years ended June 30, 2017 and 2016. Interest capitalized for the fiscal
years ended June 30, 2017 and 2016 totaled $1.5 million and $2.5 million, respectively. The
cumulative capitalized interest was $25.3 million and $23.8 million as of June 30, 2017 and 2016,
respectively, and is being amortized over 35 years. Amortization of capitalized interest for each of
the years ended June 30, 2017 and 2016 was $0.7 million.
Accrued Compensated Absences (“ACA”)
Employees earn the right to be compensated during absences for vacation leave, sick leave and
related fringe benefits. The accompanying statements of net position reflect the accrual for the
amounts earned as of year-end.
Pension Obligations The System records pension obligation equal to the net pension liability for its defined benefit
plans. The net pension liability is measured as the total pension liability, less the amount of the
pension plan’s fiduciary net position. The total pension liability is determined based upon
discounting projected benefit payments based on the benefit terms and legal agreements existing at
the pension plan’s fiscal year end. Projected benefit payments are required to be discounted using a
single rate that reflects the expected rate of return on investments, to the extent that plan assets are
available to pay benefits, and a tax-exempt, high-quality municipal bond rate when plan assets are
not available.
Pension expense is recognized for benefits earned during the period, interest on the unfunded
liability and changes in benefit terms. The differences between expected and actual experience and
changes in assumptions about future economic or demographic factors are reported as deferred
inflows or outflows of resources and are recognized over the average expected remaining service
period for employees eligible for pension benefits. The differences between expected and actual
returns are reported as deferred inflows or outflows and are recognized over five years.
Connecticut State University System
Notes to the Financial Statements
June 30, 2017 and 2016
- 26 -
Unearned Tuition, Fees and Grant Revenues
Unearned tuition, fees and grant revenues consist primarily of tuition and fees that have been
collected but are applicable to the summer and fall sessions held subsequent to the reporting date.
Charges related to these sessions are reported in the period the tuition and fees are recognized as
income.
Tuition and Fees Revenue
Student tuition and fees revenue is recognized in the period earned net of scholarship allowance and
waivers. Student aid for scholarships recorded in the statement of revenues, expenses and changes
in net position includes payments made directly to students. Any aid applied directly to the
students’ accounts in payment of tuition and fees, housing charges and dining services is reflected
as a scholarship allowance.
Auxiliary Revenues
Auxiliary revenues consist of housing charges, dining services, fees for health and injury insurance
coverage and telecommunication charges. The auxiliary revenues are recognized in the period
earned.
Operating Activities
Operating activities as reported in the statement of revenues, expenses and changes in net position
are those that generally result from exchange transactions such as payments received for providing
services and payments made for services or goods received. Nearly all of CSCU expenses are from
exchange transactions. Certain significant revenue streams relied upon for operations are recorded
as non-operating revenues, including state appropriations, Pell, gifts and investment income.
Income Taxes
CSUS is a component unit of the State of Connecticut and is exempt from federal and state income
taxes under the doctrine of intergovernmental tax immunity found in the U.S. Constitution.
Accordingly, no provision for income taxes has been recorded in the accompanying financial
statements. CSUS qualifies as a public charity eligible to receive charitable contributions under
Section 170(b)(1)(A)(ii) of the Internal Revenue Code, as amended (the “Code”).
Use of Estimates
The preparation of financial statements in conformity with accounting principles generally accepted
in the United States of America requires management to make estimates and assumptions that affect
the amounts reported in the financial statements and accompanying notes and revenues and
expenses recognized during the reporting period. Major estimates include the accrual for employee
compensated absences, pension liability, estimated lives of capital assets and the allowances for
doubtful accounts. Actual results could differ from those estimates.
Recent GASB Pronouncements
In March 2015, GASB released Statement No. 72, Fair Value Measurement and Application, which
would generally require state and local governments to measure investments at fair value. GASB’s
goal is to enhance comparability of governmental financial statements by requiring fair value
measurement for certain assets and liabilities using a consistent definition and accepted valuation
techniques. This standard expands fair value disclosures to provide comprehensive information for
financial statement users about the impact of fair value measurements on a government’s financial
position. The requirements are effective for financial statements for periods beginning after
June 15, 2015, with early application encouraged. CSUS implemented GASB 72 in fiscal year
2016. There was no significant impact as a result of the adoption.

Connecticut State University System
Notes to the Financial Statements
June 30, 2017 and 2016
- 27 -
In June 2015, GASB released Statement No. 75, Accounting and Financial Reporting for
Postemployment Benefits Other Than Pensions. The primary objective of this Statement is to
improve accounting and financial reporting by state and local governments for postemployment
benefits other than pensions (other postemployment benefits or OPEB). It also improves
information provided by state and local governmental employers about financial support for OPEB
that is provided by other entities. This Statement results from a comprehensive review of the
effectiveness of existing standards of accounting and financial reporting for all postemployment
benefits (pensions and OPEB) with regard to providing decision-useful information, supporting
assessments of accountability and inter-period equity, and creating additional transparency. This
Statement replaces the requirements of Statements No. 45, Accounting and Financial Reporting by
Employers for Postemployment Benefits Other Than Pensions, as amended, and No. 57, OPEB
Measurements by Agent Employers and Agent Multiple-Employer Plans, for OPEB. The adoption
of this accounting pronouncement will occur in fiscal year 2018. Management is evaluating the
impact this pronouncement will have.
In January 2016, GASB released Statement No. 80, Blending Requirements for Certain Component
Units—an amendment of GASB Statement No. 14. This Statement amends the blending
requirements for the financial statement presentation of component units of all state and local
governments. The additional criterion requires blending of a component unit incorporated as a not-
for-profit corporation in which the primary government is the sole corporate member. The
additional criterion does not apply to component units included in the financial reporting entity
pursuant to the provisions of Statement No. 39, Determining Whether Certain Organizations Are
Component Units. This standard was adopted in fiscal year 2017 by CSUS and there was no impact
as a result of the adoption.
In March 2016, GASB released Statement No. 81, Irrevocable Split-Interest Agreements. The
objective of this Statement is to improve accounting and financial reporting for irrevocable split-
interest agreements by providing recognition and measurement guidance for situations in which a
government is a beneficiary of the agreement. Split-interest agreements are a type of giving
agreement used by donors to provide resources to two or more beneficiaries, including governments
and may include charitable lead trusts, charitable remainder trusts, and life-interests in real estate.
This Statement requires that a government that receives resources pursuant to an irrevocable split-
interest agreement recognize assets, liabilities, and deferred inflows of resources at the inception of
the agreement and that a government recognize revenue when the resources become applicable to
the reporting period. The requirements of this Statement are effective for financial statements for
periods beginning after December 15, 2016, and should be applied retroactively. Management
expects no significant impact as a result of the adoption.
In March 2016, GASB released Statement No. 82 Pension Issues—an amendment of GASB
Statements No. 67, No. 68, and No. 73. The objective of this Statement is to address certain issues
that have been raised with respect to Statements No. 67, Financial Reporting for Pension Plans,
No. 68, Accounting and Financial Reporting for Pensions, and No. 73, Accounting and Financial
Reporting for Pensions and Related Assets That Are Not within the Scope of GASB Statement 68,
and Amendments to Certain Provisions of GASB Statements 67 and 68. Specifically, this Statement
addresses issues regarding (1) the presentation of payroll-related measures in required
supplementary information, (2) the selection of assumptions and the treatment of deviations from
the guidance in an Actuarial Standard of Practice for financial reporting purposes, and (3) the
classification of payments made by employers to satisfy employee (plan member) contribution
requirements. The requirements of this Statement are effective for reporting periods beginning
after June 15, 2016. There was no significant impact as a result of the adoption.
Connecticut State University System
Notes to the Financial Statements
June 30, 2017 and 2016
- 28 -
In March 2017, GASB released Statement No. 85 Omnibus 2017. The objective of this Statement
is to address practice issues that have been identified during implementation and application of
certain GASB Statements. This Statement addresses a variety of topics including issues related to
blending component units, goodwill, fair value measurement and application, and postemployment
benefits. The requirements of this Statement are effective for reporting periods beginning after
June 15, 2017. Management is evaluating the impact this pronouncement will have.
In May 2017, GASB released Statement No. 86 Certain Debt Extinguishment Issues. The primary
objective of this Statement is to improve consistency in accounting and financial reporting for in-
substance defeasance of debt by providing guidance for transactions in which cash and other
monetary assets acquired with only existing resources—resources other than the proceeds of
refunding debt—are placed in an irrevocable trust for the sole purpose of extinguishing debt. This
Statement also improves accounting and financial reporting for prepaid insurance on debt that is
extinguished and notes to financial statements for debt that is defeased in substance. The
requirements of this Statement are effective for reporting periods beginning after June 15, 2017.
Management is evaluating the impact this pronouncement will have.
In 2016 and 2017, GASB released Statement No. 83, Certain Asset Retirement Obligations,
Statement No. 84, Fiduciary Activities and Statement No. 87 Leases. The requirements of these
Statements are effective for future reporting periods and management is evaluating the impact these
pronouncements will have.
Subsequent Events
In accordance with generally accepted accounting principles, CSCU has evaluated subsequent events
for the period after June 30, 2017 and 2016, through December 20, 2017, the date the financial
statements were issued and no items needing to be reported were noted.
2. Cash, Cash Equivalents and Investments
Cash and cash equivalents are invested in the State of Connecticut Treasurer’s Short-Term
Investment Fund (“STIF”), a combined investment pool of high quality, short-term money market
instruments. CSCU may add or withdraw monies on a daily basis with interest earned from date of
deposit to date of withdrawal. The primary investment objectives of the STIF are the preservation
of principal and the provision of liquidity to meet CSCU’s daily cash flow requirements.
The STIF is managed by investment managers in accordance with the investment guidelines
established by the State Treasurer. These guidelines prohibit investment in derivative securities
other than floating rate securities which vary in the same direction as individual short-term money
market indices, and limit the ability to enter into reverse repurchase agreements in amounts not to
exceed five percent (5%) of the STIF’s net assets at the time of execution.
Cash and cash equivalents also include operating funds held by the State of Connecticut in a
pooled, interest credit program which earns interest at a rate determined monthly by the Office of
the State Treasurer. The interest rate at June 30, 2017 and 2016 was 1.0% and 0.44%, respectively.
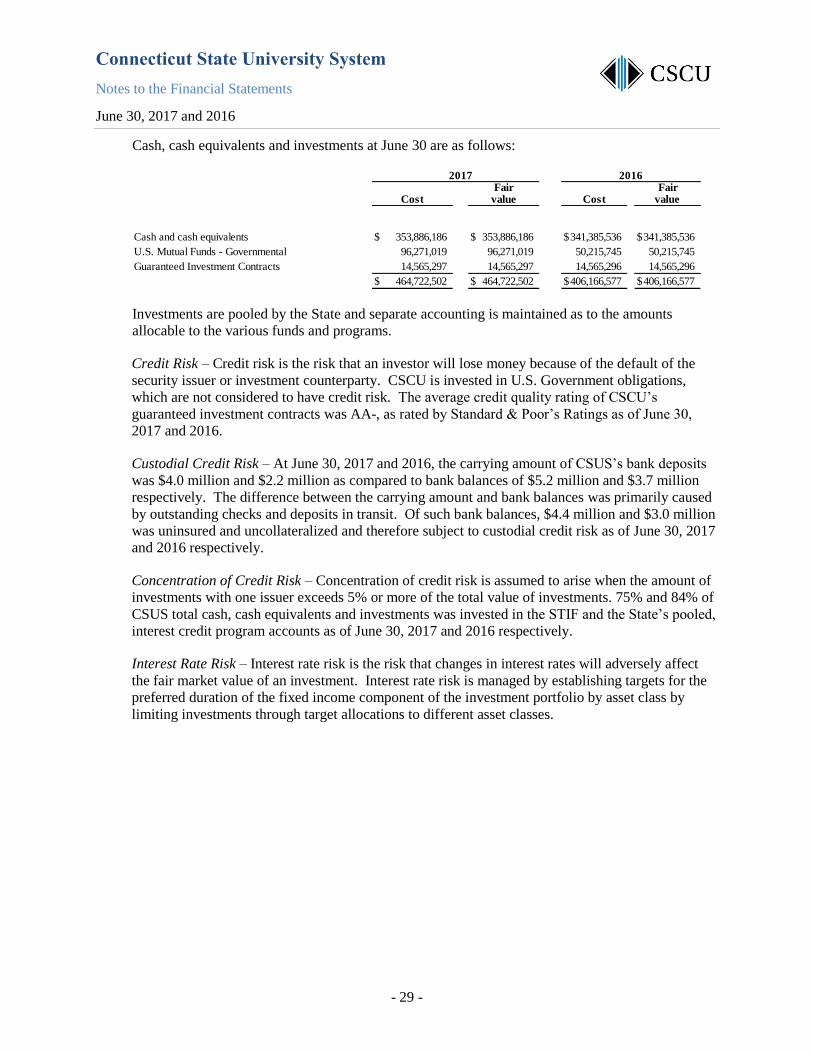
Connecticut State University System
Notes to the Financial Statements
June 30, 2017 and 2016
- 29 -
Cash, cash equivalents and investments at June 30 are as follows:
Investments are pooled by the State and separate accounting is maintained as to the amounts
allocable to the various funds and programs.
Credit Risk – Credit risk is the risk that an investor will lose money because of the default of the
security issuer or investment counterparty. CSCU is invested in U.S. Government obligations,
which are not considered to have credit risk. The average credit quality rating of CSCU’s
guaranteed investment contracts was AA-, as rated by Standard & Poor’s Ratings as of June 30,
2017 and 2016.
Custodial Credit Risk – At June 30, 2017 and 2016, the carrying amount of CSUS’s bank deposits
was $4.0 million and $2.2 million as compared to bank balances of $5.2 million and $3.7 million
respectively. The difference between the carrying amount and bank balances was primarily caused
by outstanding checks and deposits in transit. Of such bank balances, $4.4 million and $3.0 million
was uninsured and uncollateralized and therefore subject to custodial credit risk as of June 30, 2017
and 2016 respectively.
Concentration of Credit Risk – Concentration of credit risk is assumed to arise when the amount of
investments with one issuer exceeds 5% or more of the total value of investments. 75% and 84% of
CSUS total cash, cash equivalents and investments was invested in the STIF and the State’s pooled,
interest credit program accounts as of June 30, 2017 and 2016 respectively.
Interest Rate Risk – Interest rate risk is the risk that changes in interest rates will adversely affect
the fair market value of an investment. Interest rate risk is managed by establishing targets for the
preferred duration of the fixed income component of the investment portfolio by asset class by
limiting investments through target allocations to different asset classes.
2017Fair Fair
Cost value Cost value
Cash and cash equivalents 353,886,186$ 353,886,186$ 341,385,536$ 341,385,536$
U.S. Mutual Funds - Governmental 96,271,019 96,271,019 50,215,745 50,215,745
Guaranteed Investment Contracts 14,565,297 14,565,297 14,565,296 14,565,296
464,722,502$ 464,722,502$ 406,166,577$ 406,166,577$
2016

Connecticut State University System
Notes to the Financial Statements
June 30, 2017 and 2016
- 30 -
Investment maturities of CSUS’s debt securities at June 30 are as follows:
2017
Fair Less MoreDebt Securities Value Than 1 1 to 5 6 to 10 Than 10
U.S. Government obligations 96,271,019$ 96,271,019$ -$ -$ -$
Guaranteed Investment Contracts 14,565,297 - - 14,565,289 8 110,836,316$ 96,271,019$ -$ 14,565,289$ 8$
Investment Maturities (in years)
2016
Fair Less MoreDebt Securities Value Than 1 1 to 5 6 to 10 Than 10
U.S. Government obligations 50,215,745$ 50,215,745$ -$ -$ -$
Guaranteed Investment Contracts 14,565,294 - - 14,565,287 7
64,781,039$ 50,215,745$ -$ 14,565,287$ 7$
Investment Maturities (in years)
GASB No. 72, “Fair Value measurements and Application” sets forth the framework for measuring
fair value. That framework provides a fair value hierarchy that prioritizes the inputs to valuation
techniques used to measure fair value. The hierarchy gives the highest priority to unadjusted
quoted prices in active markets for identical assets or liabilities (Level 1 measurements) and the
lowest priority to unobservable inputs (Level 3 measurements). The three levels of the fair value
hierarchy under GASB No. 72 are described as follows:
Level 1 - Inputs to the valuation methodology are unadjusted quoted prices for identical assets or
liabilities in active markets that CSUS has the ability to access.
Level 2 - Inputs other than Level 1 that are observable, either directly or indirectly and include:
quoted prices for similar assets or liabilities in active markets; quoted prices for identical
or similar assets or liabilities in inactive markets; inputs other than quoted prices that are
observable for the asset or liability; inputs that are derived principally from or
corroborated by observable market data by correlation or other means.
Level 3 - Unobservable inputs that are supported by little or no market activity and that are
significant to the fair value measurement. Unobservable inputs are developed based on
the best information available in the circumstances and may include the CSUS’s own
data.
All of the investments held at June 30, 2017 and 2016 are Level 1. There are no liabilities subject
to the fair value provisions of GASB No. 72.

Connecticut State University System
Notes to the Financial Statements
June 30, 2017 and 2016
- 31 -
3. Accounts Receivables
Receivables consisted of the following at June 30:
Student loans made through the Federal Perkins Loan Program (the “Program”) comprise
substantially all of the loans receivable at June 30, 2017 and 2016. The Program provides for
cancellation of a loan at rates of 10% to 30% per year up to a maximum of 100% if the participant
complies with certain provisions. The federal government reimburses the CSUS for amounts
canceled under these provisions.
CSUS has provided an allowance for uncollectible loans, which, in management’s opinion, is
sufficient to absorb loans that will ultimately be written off. The allowance for uncollectible loans
was $3.3 million and $3.3 million as of June 30, 2017 and 2016, respectively. As management
determines that loans are uncollectible and not eligible for reimbursement by the federal
government, the loans are written off and assigned to the U.S. Department of Education.
2017 2016
Student accounts receivable 10,766,033$ 15,118,471$ Student loans receivable 14,718,825 15,040,828Grants receivable 2,769,357 2,281,737Miscellaneous receivables 1,420,285 1,231,351
29,674,500 33,672,387
Less allowance for doubtful accounts (9,778,317) (10,954,461)
Net accounts receivable 19,896,183$ 22,717,926$
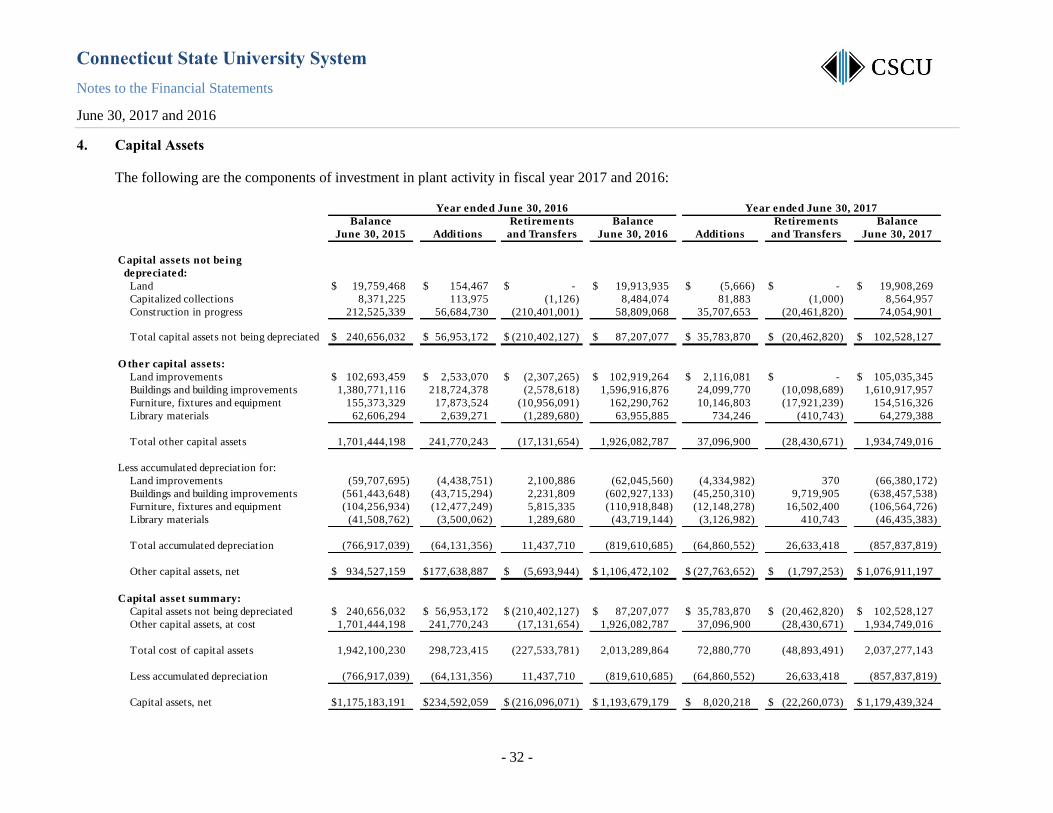
Connecticut State University System
Notes to the Financial Statements
June 30, 2017 and 2016
- 32 -
4. Capital Assets
The following are the components of investment in plant activity in fiscal year 2017 and 2016:
Balance Retirements Balance Retirements Balance
June 30, 2015 Additions and Transfers June 30, 2016 Additions and Transfers June 30, 2017
Capital assets not being
depreciated:
Land 19,759,468$ 154,467$ -$ 19,913,935$ (5,666)$ -$ 19,908,269$
Capitalized collections 8,371,225 113,975 (1,126) 8,484,074 81,883 (1,000) 8,564,957
Construction in progress 212,525,339 56,684,730 (210,401,001) 58,809,068 35,707,653 (20,461,820) 74,054,901
Total capital assets not being depreciated 240,656,032$ 56,953,172$ (210,402,127)$ 87,207,077$ 35,783,870$ (20,462,820)$ 102,528,127$
O ther capital assets:
Land improvements 102,693,459$ 2,533,070$ (2,307,265)$ 102,919,264$ 2,116,081$ -$ 105,035,345$
Buildings and building improvements 1,380,771,116 218,724,378 (2,578,618) 1,596,916,876 24,099,770 (10,098,689) 1,610,917,957
Furniture, fixtures and equipment 155,373,329 17,873,524 (10,956,091) 162,290,762 10,146,803 (17,921,239) 154,516,326
Library materials 62,606,294 2,639,271 (1,289,680) 63,955,885 734,246 (410,743) 64,279,388
Total other capital assets 1,701,444,198 241,770,243 (17,131,654) 1,926,082,787 37,096,900 (28,430,671) 1,934,749,016
Less accumulated depreciation for:
Land improvements (59,707,695) (4,438,751) 2,100,886 (62,045,560) (4,334,982) 370 (66,380,172)
Buildings and building improvements (561,443,648) (43,715,294) 2,231,809 (602,927,133) (45,250,310) 9,719,905 (638,457,538)
Furniture, fixtures and equipment (104,256,934) (12,477,249) 5,815,335 (110,918,848) (12,148,278) 16,502,400 (106,564,726)
Library materials (41,508,762) (3,500,062) 1,289,680 (43,719,144) (3,126,982) 410,743 (46,435,383)
Total accumulated depreciation (766,917,039) (64,131,356) 11,437,710 (819,610,685) (64,860,552) 26,633,418 (857,837,819)
Other capital assets, net 934,527,159$ 177,638,887$ (5,693,944)$ 1,106,472,102$ (27,763,652)$ (1,797,253)$ 1,076,911,197$
Capital asset summary:
Capital assets not being depreciated 240,656,032$ 56,953,172$ (210,402,127)$ 87,207,077$ 35,783,870$ (20,462,820)$ 102,528,127$
Other capital assets, at cost 1,701,444,198 241,770,243 (17,131,654) 1,926,082,787 37,096,900 (28,430,671) 1,934,749,016
Total cost of capital assets 1,942,100,230 298,723,415 (227,533,781) 2,013,289,864 72,880,770 (48,893,491) 2,037,277,143
Less accumulated depreciation (766,917,039) (64,131,356) 11,437,710 (819,610,685) (64,860,552) 26,633,418 (857,837,819)
Capital assets, net 1,175,183,191$ 234,592,059$ (216,096,071)$ 1,193,679,179$ 8,020,218$ (22,260,073)$ 1,179,439,324$
Year ended June 30, 2016 Year ended June 30, 2017
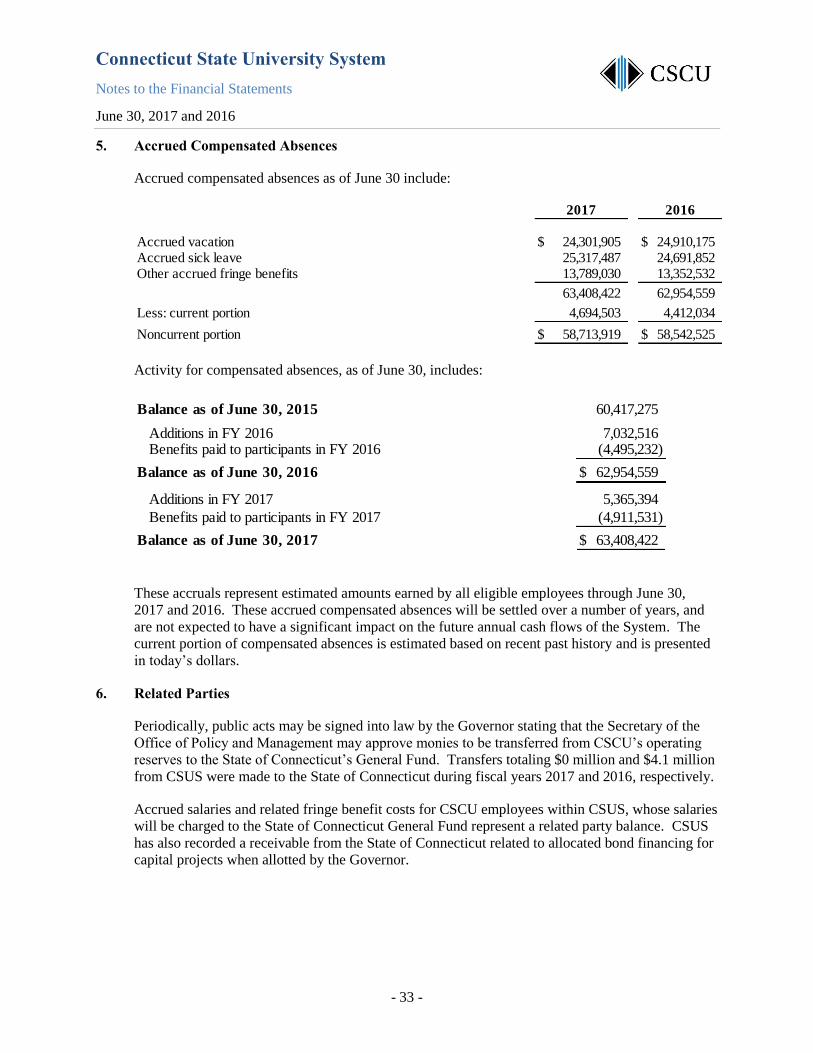
Connecticut State University System
Notes to the Financial Statements
June 30, 2017 and 2016
- 33 -
5. Accrued Compensated Absences
Accrued compensated absences as of June 30 include:
Activity for compensated absences, as of June 30, includes:
These accruals represent estimated amounts earned by all eligible employees through June 30,
2017 and 2016. These accrued compensated absences will be settled over a number of years, and
are not expected to have a significant impact on the future annual cash flows of the System. The
current portion of compensated absences is estimated based on recent past history and is presented
in today’s dollars.
6. Related Parties
Periodically, public acts may be signed into law by the Governor stating that the Secretary of the
Office of Policy and Management may approve monies to be transferred from CSCU’s operating
reserves to the State of Connecticut’s General Fund. Transfers totaling $0 million and $4.1 million
from CSUS were made to the State of Connecticut during fiscal years 2017 and 2016, respectively.
Accrued salaries and related fringe benefit costs for CSCU employees within CSUS, whose salaries
will be charged to the State of Connecticut General Fund represent a related party balance. CSUS
has also recorded a receivable from the State of Connecticut related to allocated bond financing for
capital projects when allotted by the Governor.
2017 2016
Accrued vacation 24,301,905$ 24,910,175$ Accrued sick leave 25,317,487 24,691,852Other accrued fringe benefits 13,789,030 13,352,532
63,408,422 62,954,559
Less: current portion 4,694,503 4,412,034
Noncurrent portion 58,713,919$ 58,542,525$
Balance as of June 30, 2015 60,417,275
Additions in FY 2016 7,032,516Benefits paid to participants in FY 2016 (4,495,232)
Balance as of June 30, 2016 62,954,559$
Additions in FY 2017 5,365,394
Benefits paid to participants in FY 2017 (4,911,531)
Balance as of June 30, 2017 63,408,422$

Connecticut State University System
Notes to the Financial Statements
June 30, 2017 and 2016
- 34 -
Amounts due from the State of Connecticut as of June 30 are comprised of the following:
2017 2016
Receivable for accrued salaries, interest and fringe benefits to be paid by State of Connecticut General Fund 32,583,661$ 30,929,024$
State appropriations for capital projects 36,494,521 25,660,674
69,078,182$ 56,589,698$
The accompanying statements of net position includes balances among related parties. Significant
balances for the year ended June 30, were as follows:
7. Commitments and Contingencies
CSCU makes expenditures in connection with restricted government grants and contracts which are
subject to final audit by government agencies. CSCU is of the opinion that the amount of
disallowances, if any, sustained through such audits would not materially affect the financial
position of CSCU.
CSCU is a defendant in various legal actions arising out of the normal course of its operations.
Although the final outcome of such actions cannot presently be determined, management is of the
opinion that eventual liability, if any, will not have a material effect on CSCU’s financial position.
CSCU had outstanding purchase orders and related commitments for materials, services and capital
expenditures that had not been received as of June 30, 2017 and 2016. These commitments are not
recorded as liabilities until materials or services are received. The commitments of total net
position balances at June 30, 2017 were as follows:
System Office 13,077,792$
Central Connecticut State University 3,722,900
Eastern Connecticut State University 2,013,011
Southern Connecticut State University 4,544,988
Western Connecticut State University 4,623,834
27,982,525$
8. Retirement and Other Post-Employment Benefits
Plan Description
All regular full-time employees participate in one of two retirement plans. The State of
Connecticut is statutorily responsible for the pension benefits of CSCU employees who participate
2017 2016
Cash balances held with the State of Connecticut on behalf of the CSUS 252,670,692$ 246,166,558$
Amounts invested in the STIF 97,174,800 93,048,106349,845,492$ 339,214,664$
Connecticut State University System
Notes to the Financial Statements
June 30, 2017 and 2016
- 35 -
in the State Employees’ Retirement System (“SERS”). SERS is the administrator of a single
employer defined benefit public employee retirement system (“PERS”). SERS provides retirement,
disability, death benefits and annual cost of living adjustments to plan members and their
beneficiaries. Plan benefits, cost of living adjustments, contribution requirements of plan members
and the State and other plan provisions are described in the General Statutes. SERS does not issue
standalone financial reports. Information on the plan is currently publicly available in the State of
Connecticut’s Comprehensive Annual Financial Report prepared by the Office of the State
Comptroller.
Tier III or the Hybrid Plan are the 2 primary SERS plan options available to CSCU employees first
hired into state service on or after July 1, 2011 (some employees are eligible to elect the Teachers
Retirement System – “TRS”). Employees hired before July 1, 2011 participate in Tier I, Tier II,
Tier IIA, Tier III, or TRS depending on several factors. CSCU makes contributions on behalf of
the employees in SERS plans through a fringe benefit charge assessed by the State of Connecticut.
The Hybrid Plan, which became effective July 1, 2011 under the 2011 agreement between the State
of Connecticut and the State Employee Bargaining Agent Coalition (“SEBAC”), provides a
retirement plan option for employees hired on or after July 1, 2011 in a position statutorily defined
as a state teacher or a professional staff member in higher education. The Hybrid Plan is a defined
benefit plan that provides members with a life-time defined benefit the same as the benefit provided
under SERS Tier III with the option at the time of retirement to elect to receive a lump sum
payment of their contributions with a five percent employer match and four percent interest in lieu
of a defined benefit.
Alternatively, employees may choose to participate in the Alternate Retirement Plan which is
managed by Prudential. Under this arrangement, plan participants contribute 5% of their pay and
the State contributes 8% to individual participants’ investment accounts managed by Prudential.
CSCU pays a fringe benefit charge to the State which includes the 8% employer contribution and
an administrative charge. The aforementioned 2011 SEBAC agreement provides CSCU employees
who were both hired before July 1, 2011 and participating in ARP with a one-time irrevocable
option through a date not yet determined of electing to transfer their membership from ARP to the
Hybrid Plan and purchasing credit in the Hybrid Plan for their prior services at full actuarial cost.
Funding Policy
The contribution requirements of plan members and the State are established and may be amended
by the State legislature subject to the contractual rights established by collective bargaining.
Tier I Plan B regular and Plan B Hazardous Duty members are required to contribute 2% and 4%,
respectively of their annual salary up to the Social Security Taxable Wage Base plus 5% above that
level. Tier I Plan C and Hybrid Plan members are required to contribute 5% of their annual salary.
Tier IIA Plan and Tier III Plan regular and Hazardous Duty members are required to contribute 2%
and 5% of their annual salaries, respectively.
The State is required to contribute at an actuarially determined rate, which may be reduced or
increased by an act of the State legislature. The rate was 44.31% and 43.42% for SERS and
30.35% and 30.35% for TRS for fiscal years ended June 30, 2017 and 2016, respectively. The
State contributed $54.3 million and $1.5 million for SERS and TRS respectively for fiscal year
ended June 30, 2016, equal to 99.5% of required contributions that year. The state contributed
$54.2 million and $1.6 million, on behalf of the System, for SERS and TRS respectively for fiscal
year 2017, equal to 99.2% and 148.9% of the required contributions that year. Administrative costs
of the plan are funded by the State.

Connecticut State University System
Notes to the Financial Statements
June 30, 2017 and 2016
- 36 -
Net Pension Liability
The Systems’ net pension liability is valued one year in arrears. The net pension liability recorded
in the financial statements as of June 30, 2017 was measured and valued as of June 30, 2016 and
the total pension liability used to calculate the net pension liability was determined by the most
current actuarial valuation as of that date (and the net pension liability recorded in the June 30,
2016 financial statements was measured and valued as of June 30, 2015). The System’s proportion
of the net pension liability was based on a projection of the CSUS System’s long-term share of
contributions to the pension plan relative to the projected contributions of all participating entities
and the State, actuarially determined. For the TRS plan, at June 30, 2017 and 2016 the System’s
proportion was 0.09% and 0.10%, respectively. For the SERS plan, at June 30, 2017 and 2016 the
System’s proportion was 4.23% and 3.96%, respectively.
All SERS and TRS assets are available to pay any participants benefits. However, the portion of
each plan’s net pension liability attributable to the CSU System is calculated separately. The net
pension liability for the CSU System as of June 30, 2017 and 2016 for SERS and TRS was $972.1
million and $653.6 million and $13.0 million and $10.5 million, respectively.
Actuarial Assumptions
SERS: The total pension liability was determined using the following actuarial assumptions, applied to all
periods:
Mortality rates were based on the RP-2014 White Collar Mortality Table projected to 2020 by scale
BB at 100% for males and 95% for females.
The actuarial assumptions used in the June 30, 2016 valuation (which was the basis for recording the
June 30, 2017 financial statement liabilities) were based on the results of the actuarial experience
study as of June 30, 2016.
The long-term expected rate of return on pension plan investments was determined using a log-
normal distribution analysis in which best-estimate ranges of expected future real rates of return
(expected returns, net of pension plan investment expense and inflation) are developed for each major
asset class. These ranges are combined to produce the long-term expected rate of return by weighting
the expected future rates of return by the target asset allocation percentage.
Measurement Year 2016 2015
Inflation 2.50% 2.75%
Salary increases including inflation 3.50% to 19.50% 4.00% to 20.00%
Investment rate of return net of pension plan 6.90% 8.00%
investment expense, including inflation

Connecticut State University System
Notes to the Financial Statements
June 30, 2017 and 2016
- 37 -
The best estimates of rates of return for each major asset class as of June 30, 2016 measurement year
are summarized in the following table:
TRS: The total pension liability was determined using the following actuarial assumptions, applied to all
periods:
Mortality rates were based on the RP-2014 White Collar table with employee and annuitant rates
blended from ages 50 to 80, projected to the year 2020 using the BB improvement scale and further
adjusted to grade in increases (5% for females and 8% for males) to rates over age 80 for the period
after service retirement and for dependent beneficiaries as well as for active members.
The long-term expected rate of return on pension plan investments was determined using a log-
normal distribution analysis in which best-estimate ranges of expected future real rates of return
(expected returns, net of pension plan investment expense and inflation) are developed for each major
asset class. These ranges are combined to produce the long-term expected rate of return by weighting
the expected future real rates of return by the target asset allocation percentage and by adding
expected inflation.
Long-Term Expected
Asset Class Target Allocation Real Rate of Return
Large Cap U.S. Equities 21% 5.8%
Developed Non-U.S. Equities 18% 6.6%
Emerging Market (Non-U.S.) 9% 8.3%
Real Estate 7% 5.1%
Private Equity 11% 7.6%
Alternative Investments 8% 4.1%
Fixed Income 8% 1.3%
High Yield Bonds 5% 3.9%
Emerging Market Bond 4% 3.7%
TIPS 5% 1.0%
Cash 4% 0.4%
100%
Measurement Year 2016 2015
Inflation 2.75% 3.00%
Salary increases including inflation 3.25% to 6.50% 3.75% to 7.00%
Investment rate of return net of pension plan 8.00% 8.50%
investment expense, including inflation

Connecticut State University System
Notes to the Financial Statements
June 30, 2017 and 2016
- 38 -
The target asset allocation and best estimates of rates of return for each major asset class are
summarized in the following table:
Discount Rate
SERS:
The discount rate used to measure the total pension liability was 6.9% and 8.0% in the 2016 and
2015 measurement years, respectively. The projection of cash flows used to determine the discount
rate assumed that plan member contributions will be made at the current contribution rates and the
States’s contributions will be made at rates equal to the difference between actuarially determined
contributions rates and the member rates. Based on those assumptions, the net position was
projected to be available to make all projected future benefit payments of current plan members.
Therefore, the long-term expected rate of return on pension plan investments was applied to all
periods of projected benefit payments to determine the total pension liability.
TRS:
The discount rate used to measure the total pension liability was 8.00% and 8.5% in the 2016 and
2015 measurement year, respectively. The projection of cash flows used to determine the discount
rate assumed that plan member contributions will be made at the current contribution rate and that
State contributions will be made at the actuarially determined rates in future years. Based on those
assumptions, the pension plan’s fiduciary net position was projected to be available to make all
projected future benefit payments of current plan members. Therefore, the long-term expected rate
of return on pension plan investments was applied to all periods of projected benefit payments to
determine the total pension liability.
Long-Term Expected
Asset Class Target Allocation Real Rate of Return
Large Cap U.S. Equities 21% 5.8%
Developed Non-U.S. Equities 18% 6.6%
Emerging Market (Non-U.S.) 9% 8.3%
Real Estate 7% 5.1%
Private Equity 11% 7.6%
Alternative Investments 8% 4.1%
Fixed Income 7% 1.3%
High Yield Bonds 5% 3.9%
Emerging Market Bond 5% 3.7%
Inflation Linked Bonds 3% 1.0%
Cash 6% 0.4%
100%

Connecticut State University System
Notes to the Financial Statements
June 30, 2017 and 2016
- 39 -
Sensitivity of Net Pension Liability to Changes in Discount Rate
The following presents the current-period net pension liability of the CSUS System calculated
using the current-period discount rate assumption of 6.9% for SERS and 8.0% for TRS, as well as
what the net pension liability would be if it were calculated using a discount rate that is 1-
percentage-point lower or 1-percentage-point higher than the current rate:
Pension Expense, Deferred Outflows of Resources and Deferred Inflows of Resources Related
to Defined Benefit Pension Plan
For the years ended June 30, 2017 and 2016, the System recognized pension expense of $139.3
million and $77.0 million, respectively. Deferred outflows of resources and deferred inflows of
resources for pensions attributed to the CSU System were related to the following sources for the
years ended June 30, 2017 and 2016:
1% Decrease
(SERS -5.9%)
(TRS - 7.0%)
Current
Discount
(SERS - 6.9%)
(TRS - 8.0%)
1% Increase
(SERS - 7.9%)
(TRS - 9.0%)
SERS 1,153,534,798$ 972,052,721$ 821,018,097$
TRS 15,996,911 12,986,359 10,420,602
As of June 30, 2017
SERS TRS Total
DEFERRED OUTFLOWS OF RESOURCES
Difference between expected and actual experience27,003,199$ -$ 27,003,199$
Changes of assumptions or other inputs173,310,550 1,721,359 175,031,909
Net difference between projected and actual earnings on pension plan
investements
30,482,376 1,099,823 31,582,199
Changes in proportion and differences between employer contributions
and proportionate share of contributions
114,394,771 1,429,334 115,824,105
Employer contributions after measurement date64,121,072 559,881 64,680,953
Total 409,311,968$ 4,810,397$ 414,122,365$
DEFERRED INFLOWS OF RESOURCES
Difference between expected and actual experience-$ 292,291$ 292,291$
Changes in proportion and differences between employer contributions
and proportionate share of contributions
174,432 852,901 1,027,333
Total 174,432$ 1,145,192$ 1,319,624$
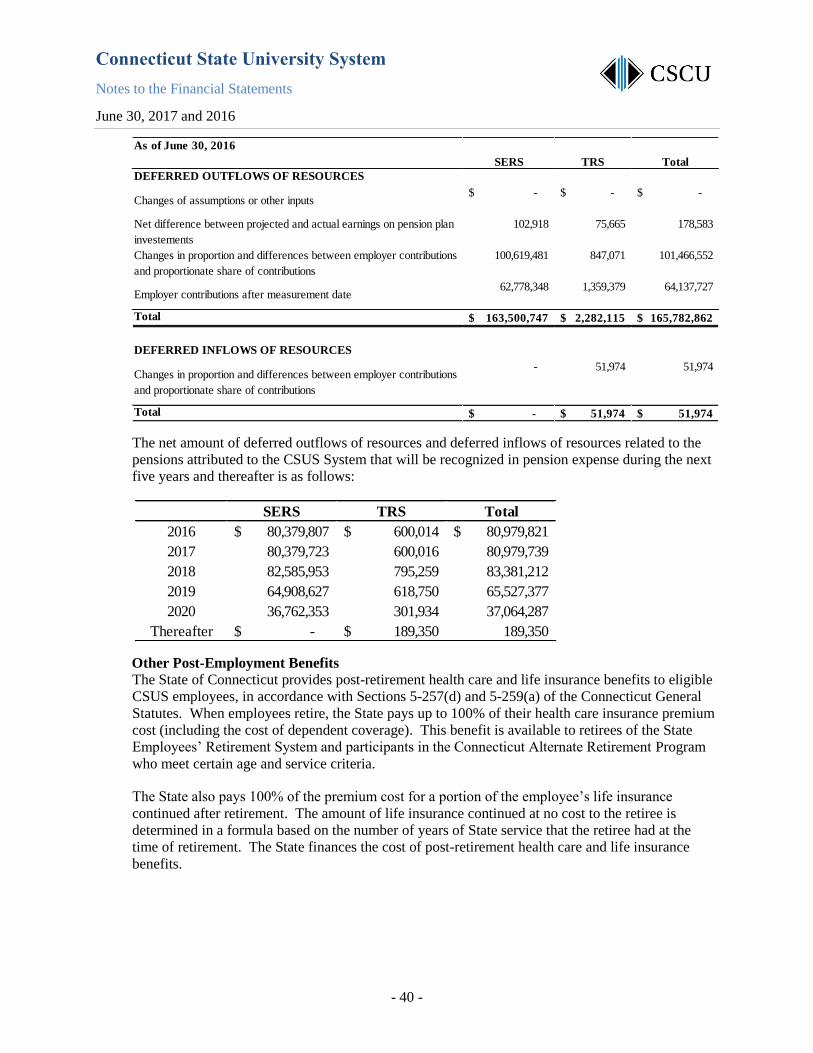
Connecticut State University System
Notes to the Financial Statements
June 30, 2017 and 2016
- 40 -
The net amount of deferred outflows of resources and deferred inflows of resources related to the
pensions attributed to the CSUS System that will be recognized in pension expense during the next
five years and thereafter is as follows:
Other Post-Employment Benefits
The State of Connecticut provides post-retirement health care and life insurance benefits to eligible
CSUS employees, in accordance with Sections 5-257(d) and 5-259(a) of the Connecticut General
Statutes. When employees retire, the State pays up to 100% of their health care insurance premium
cost (including the cost of dependent coverage). This benefit is available to retirees of the State
Employees’ Retirement System and participants in the Connecticut Alternate Retirement Program
who meet certain age and service criteria.
The State also pays 100% of the premium cost for a portion of the employee’s life insurance
continued after retirement. The amount of life insurance continued at no cost to the retiree is
determined in a formula based on the number of years of State service that the retiree had at the
time of retirement. The State finances the cost of post-retirement health care and life insurance
benefits.
As of June 30, 2016
SERS TRS Total
DEFERRED OUTFLOWS OF RESOURCES
Changes of assumptions or other inputs-$ -$ -$
Net difference between projected and actual earnings on pension plan
investements
102,918 75,665 178,583
Changes in proportion and differences between employer contributions
and proportionate share of contributions
100,619,481 847,071 101,466,552
Employer contributions after measurement date62,778,348 1,359,379 64,137,727
Total 163,500,747$ 2,282,115$ 165,782,862$
DEFERRED INFLOWS OF RESOURCES
Changes in proportion and differences between employer contributions
and proportionate share of contributions
- 51,974 51,974
Total -$ 51,974$ 51,974$
SERS TRS Total
2016 80,379,807$ 600,014$ 80,979,821$
2017 80,379,723 600,016 80,979,739
2018 82,585,953 795,259 83,381,212
2019 64,908,627 618,750 65,527,377
2020 36,762,353 301,934 37,064,287
Thereafter -$ 189,350$ 189,350

Connecticut State University System
Notes to the Financial Statements
June 30, 2017 and 2016
- 41 -
9. Unearned Tuition, Fees and Grant Revenue
Unearned tuition, fees and grant revenue consists of the following at June 30:
2017 2016
Unearned tuition and fees 22,373,469$ 25,518,480$ Grants and contracts 1,888,513 1,977,301Other 529,697 12,153,073
24,791,679$ 39,648,854$

Connecticut State University System
Notes to the Financial Statements
June 30, 2017 and 2016
- 42 -
10. Natural Classification with Functional Classification
The operating expenses by functional classification were as follows:
Professional Educational O ther operating
Salaries and Fringe services and services and Travel O peration of supplies and Depreciation Amortization
wages benefits fees support expense facilities expenses expense expense Total
Academic support 27,242,551$ 20,949,198$ 1,293,404$ 3,636,862$ 1,630,146$ 435,646$ 3,779,261$ -$ -$ 58,967,068$
Auxiliary enterprises 9,965,540 8,251,364 7,510,364 28,631,540 58,975 7,658,661 1,721,017 - - 63,797,461
Institution support 50,688,770 44,075,602 5,118,430 1,357,372 577,685 2,686,986 11,955,290 - - 116,460,135
Instruction 167,543,226 122,102,455 1,355,303 1,130,054 685,777 340,278 2,477,767 - - 295,634,860
Physical plant 23,030,473 25,600,673 3,105,126 56,995 14,734 41,982,090 13,619,927 64,859,717 90,584 172,360,319
Public service 4,991,207 3,442,093 750,096 518,324 921,481 354,590 491,999 - - 11,469,790
Research 2,458,016 1,656,686 577,634 295,454 428,295 78,375 610,271 - - 6,104,731
Scholarships, loans
and refunds 544,886 79,449 180,003 62,536,807 485 1,371 81,168 - - 63,424,169
Student services 42,183,383 34,085,013 3,369,028 1,574,231 2,050,414 1,116,793 3,617,952 835 - 87,997,649
Total expenses 328,648,052$ 260,242,533$ 23,259,388$ 99,737,639$ 6,367,992$ 54,654,790$ 38,354,652$ 64,860,552$ 90,584$ 876,216,182$
Personnel Professional Educational O ther operating
service and Fringe services and services and Travel O peration of supplies and Depreciation Amortization
fringe benefits benefits fees support expense facilities expenses expense expense Total
Academic support 28,773,164$ 16,360,133$ 1,401,943$ 2,605,247$ 1,570,514$ 596,981$ 3,869,473$ -$ -$ 55,177,455$
Auxiliary enterprises 10,733,718 6,417,362 13,746,508 25,349,031 64,796 8,479,268 2,294,141 - - 67,084,824
Institution support 52,510,819 34,540,541 4,990,774 827,992 619,176 3,362,748 8,961,215 - - 105,813,265
Instruction 168,181,404 89,799,185 1,315,244 1,340,752 795,082 323,662 2,080,283 - - 263,835,612
Physical plant 24,038,984 20,390,678 3,494,648 41,563 80,597 38,344,557 15,312,751 64,130,522 100,059 165,934,359
Public service 5,294,208 2,517,665 1,037,559 693,362 1,075,726 526,120 535,463 - - 11,680,103
Research 2,604,903 1,336,313 534,989 432,267 499,627 61,543 439,519 - - 5,909,161
Scholarships, loans
and refunds 389,554 12,428 267,194 64,157,134 3,087 1,259 70,365 - - 64,901,021
Student services 41,515,219 24,945,084 3,245,963 1,783,279 2,045,338 1,160,640 4,000,283 834 - 78,696,640
Total expenses 334,041,973$ 196,319,389$ 30,034,822$ 97,230,627$ 6,753,943$ 52,856,778$ 37,563,493$ 64,131,356$ 100,059$ 819,032,440$
Natural Classification
Year ended June 30, 2017
Natural Classification
Year ended June 30, 2016
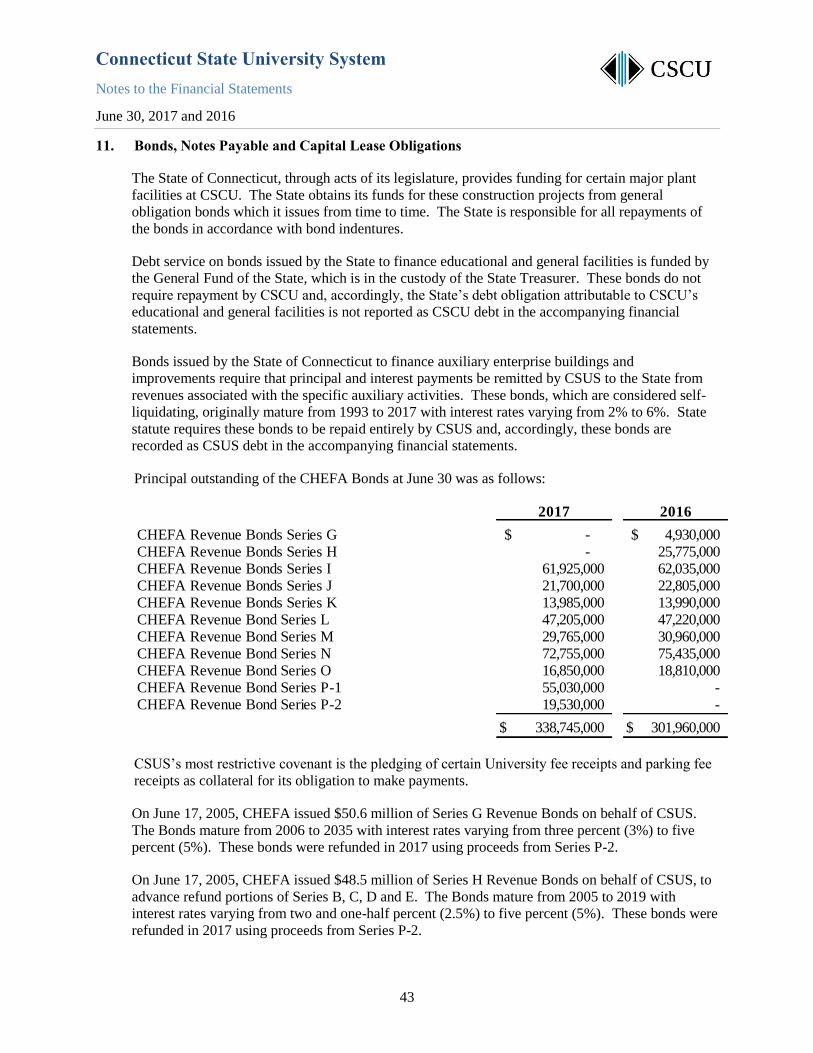
Connecticut State University System
Notes to the Financial Statements
June 30, 2017 and 2016
43
11. Bonds, Notes Payable and Capital Lease Obligations
The State of Connecticut, through acts of its legislature, provides funding for certain major plant
facilities at CSCU. The State obtains its funds for these construction projects from general
obligation bonds which it issues from time to time. The State is responsible for all repayments of
the bonds in accordance with bond indentures.
Debt service on bonds issued by the State to finance educational and general facilities is funded by
the General Fund of the State, which is in the custody of the State Treasurer. These bonds do not
require repayment by CSCU and, accordingly, the State’s debt obligation attributable to CSCU’s
educational and general facilities is not reported as CSCU debt in the accompanying financial
statements.
Bonds issued by the State of Connecticut to finance auxiliary enterprise buildings and
improvements require that principal and interest payments be remitted by CSUS to the State from
revenues associated with the specific auxiliary activities. These bonds, which are considered self-
liquidating, originally mature from 1993 to 2017 with interest rates varying from 2% to 6%. State
statute requires these bonds to be repaid entirely by CSUS and, accordingly, these bonds are
recorded as CSUS debt in the accompanying financial statements.
Principal outstanding of the CHEFA Bonds at June 30 was as follows:
CSUS’s most restrictive covenant is the pledging of certain University fee receipts and parking fee
receipts as collateral for its obligation to make payments.
On June 17, 2005, CHEFA issued $50.6 million of Series G Revenue Bonds on behalf of CSUS.
The Bonds mature from 2006 to 2035 with interest rates varying from three percent (3%) to five
percent (5%). These bonds were refunded in 2017 using proceeds from Series P-2.
On June 17, 2005, CHEFA issued $48.5 million of Series H Revenue Bonds on behalf of CSUS, to
advance refund portions of Series B, C, D and E. The Bonds mature from 2005 to 2019 with
interest rates varying from two and one-half percent (2.5%) to five percent (5%). These bonds were
refunded in 2017 using proceeds from Series P-2.
2017 2016
CHEFA Revenue Bonds Series G -$ 4,930,000$ CHEFA Revenue Bonds Series H - 25,775,000CHEFA Revenue Bonds Series I 61,925,000 62,035,000CHEFA Revenue Bonds Series J 21,700,000 22,805,000CHEFA Revenue Bonds Series K 13,985,000 13,990,000CHEFA Revenue Bond Series L 47,205,000 47,220,000CHEFA Revenue Bond Series M 29,765,000 30,960,000CHEFA Revenue Bond Series N 72,755,000 75,435,000CHEFA Revenue Bond Series O 16,850,000 18,810,000CHEFA Revenue Bond Series P-1 55,030,000 -CHEFA Revenue Bond Series P-2 19,530,000 -
338,745,000$ 301,960,000$

Connecticut State University System
Notes to the Financial Statements
June 30, 2017 and 2016
44
On April 18, 2007, CHEFA issued $62.8 million of Series I Revenue Bonds on behalf of CSUS, to
advance refund portions of Series D, E and G. The Bonds mature from 2008 to 2033 with interest
rates varying from three percent (3.0%) to five and one quarter percent (5.25%). Payment of the
principal of, and interest on, the bonds are due to the Trustee on April 1 and October 1 of each year.
On June 22, 2011, CHEFA issued $27.0 million of Series J Revenue Bonds on behalf of CSUS.
The Bonds mature from 2012 to 2031 with interest rates varying from two (2.0%) to four percent
(4.0%). Payment of the principal of, and interest on, the bonds are due to the Trustee on April 1
and October 1 of each year.
On June 22, 2011, CHEFA issued $14.0 million of Series K Revenue Bonds on behalf of CSUS, to
advance refund portions of Series E. The Bonds mature from 2012 to 2020 with interest rates
varying from three percent (3.0%) to four percent (4.0%). Payment of the principal of, and interest
on, the bonds are due to the Trustee on April 1 and October 1 of each year.
On April 4, 2012, CHEFA issued $49.0 million of Series L Revenue Bonds on behalf of CSUS to
advance refund portions of Series Bond E and current refund portions of Series Bond B. The
Bonds mature from 2012 to 2029 with interest rates varying from two and one-half percent (2.5%)
to four percent (4.0%). Payment of the principal of, and interest on, the bonds are due to the
Trustee on April 1 and October 1 of each year.
On January 10, 2013, CHEFA issued $34.1 million of Series M Revenue Bonds on behalf of CSUS.
The Bonds mature from 2014 to 2033 with interest rates varying from three percent (3.0%) to five
percent (5.0%). Payment of the principal of, and interest on, the bonds are due to the Trustee on
April 1 and October 1 of each year.
On October 23, 2013, CHEFA issued $80.3 million of Series N Revenue Bonds on behalf of CSUS.
The Bonds mature from 2015 to 2034 with interest rates varying from four percent (4.1%) to five
percent (5.0%). Payment of the principal of, and interest on, the bonds are due to the Trustee on
April 1 and October 1 of each year.
On September 11, 2014, CHEFA issued $21.2 million of Series O Revenue Bonds on behalf of
CSUS, to advance refund portions of Series F and G. The Bonds mature from 2015 to 2031 with
interest rates varying from two percent (2.0%) to four (4.00%). Payment of the principal of, and
interest on, the bonds are due to the Trustee on April 1 and October 1 of each year.
On September 12, 2016, CHEFA issued $55.0 million of Series P-1 Revenue Bonds on behalf of
CSUS. Additionally, CHEFA issued $19.5 million of Series P-2 Revenue Bonds on behalf of
CSUS, to advance refund portions of Series G and H. The Bonds mature from 2016 to 2036 with
interest rates varying from two and a half percent (2.5%) to five percent (5%). Payment of
principal of, and interest on, the bonds are due to the Trustee on April 1 and October 1 of each year.
In connection with the fiscal year 2017 refunding of portions of Series G and H, CSUS deposited
into irrevocable trust accounts sufficient funds to provide for all future debt service payments on the
refunded bonds. As a result, the refunded bonds were considered an in-substance defeasance and
the liability for those bonds has been removed from the statements of net position as of June 30,
2017. Assets held in the trust accounts had an aggregate fair value of $19.6 million at June 30,
2017. The outstanding amount of the refunded bonds totaled $19.6 million at June 30, 2017. The
refunding of the bonds resulted in a difference between the reacquisition price and the net carrying
amount of the old debt of $0.6 million. The difference, which is recorded as a deferred loss on
Connecticut State University System
Notes to the Financial Statements
June 30, 2017 and 2016
45
bond refunding, is being charged to interest expense over the remaining life of the Series H bond
before refunding of 3.5 years using the straight-line method. As a result of the defeasance, CSUS
reduced its aggregate debt service payments by $2.0 million and achieved an economic gain (the
difference between the present value of the old and new debt service payments) of $1.8 million.
In connection with the fiscal year 2015 refunding of portions of Series F and G, CSUS deposited
into irrevocable trust accounts sufficient funds to provide for all future debt service payments on the
refunded bonds. As a result, the refunded bonds were considered an in-substance defeasance and
the liability for those bonds has been removed from the statements of net position. Assets held in
the trust accounts had an aggregate fair value of $22.0 million at June 30, 2015. The outstanding
amount of the refunded bonds totaled $17.8 million and $19.8 million at June 30, 2017 and 2016,
respectively. The refunding of the bonds resulted in a difference between the reacquisition price
and the net carrying amount of the old debt of $0.8 million. The difference, which is recorded as a
reduction of bonds payable, is being charged to operations over the life of the new bonds (Series O)
using the straight-line method. As a result of the defeasance, CSUS reduced its aggregate debt
service payments by $2.2 million and achieved an economic gain (the difference between the
present value of the old and new debt service payments) of $1.5 million.
In connection with the fiscal year 2012 refunding of portions of Series B and E, CSUS deposited
into irrevocable trust accounts sufficient funds to provide for all future debt service payments on the
refunded bonds. As a result, the refunded bonds were considered an in-substance defeasance and
the liability for those bonds has been removed from the statements of net position. Assets held in
the trust accounts had an aggregate fair value of $53.6 million at June 30, 2012. The outstanding
amount of the refunded bonds totaled $47.8 million at both June 30, 2017 and 2016. The refunding
of the bonds resulted in a difference between the reacquisition price and the net carrying amount of
the old debt of $2.5 million. The difference, which is recorded as a reduction of bonds payable, is
being charged to operations over the life of new bonds using the straight-line method. As a result
of defeasance, CSUS reduced its aggregate debt service payments by $8.6 million and achieved an
economic gain (the difference between the present value of the old and new debt service payments)
of $4.2 million.
In connection with the fiscal year 2011 advance refunding of portions of Series E, CSUS deposited
into irrevocable trust accounts sufficient funds to provide for all future debt service payments on the
refunded bonds. As a result, the refunded bonds will be considered to be defeased and the liability
for those bonds has been removed from the statements of net position. Assets held in the trust
accounts had an aggregate fair market value of $15.5 million at June 30, 2011. The outstanding
amount of the refunded bonds totaled $14.7 million at both June 30, 2017 and 2016. The refunding
of the bonds resulted in a difference between the reacquisition price and the net carrying amount of
the old debt of $0.5 million. The difference, which was recorded as a reduction of bonds payable,
is being charged to operations over the life of new bonds using the straight-line method. As a result
of defeasance, CSUS reduced its aggregate debt service payments by $1.0 million and achieve an
economic gain (the difference between the present value of the old and new debt service payments)
of $0.9 million.
In connection with the fiscal year 2007 advance refunding of portions of Series D, E and G, CSUS
deposited into irrevocable trust accounts sufficient funds to provide for all future debt service
payments on the refunded bonds. As a result, the refunded bonds were considered to be defeased,
and the liability for those bonds has been removed from the statements of net position. Assets held
in the trust accounts had an aggregate fair value of $63.8 million at June 30, 2007. The refunding
of the bonds resulted in a difference between the reacquisition price and the net carrying amount of

Connecticut State University System
Notes to the Financial Statements
June 30, 2017 and 2016
46
the old debt of $2.4 million. The difference, which was recorded as a reduction of bonds payable, is
being charged to operations over the life of new bonds using the straight-line method. The
outstanding amount of these refunded bonds totaled $60.1 million at both June 30, 2017 and 2016.
In connection with the fiscal year 2005 advance refunding of portions of Series B, C, D and E,
CSUS deposited into irrevocable trust accounts sufficient funds to provide for all future debt
service payments on the refunded bonds. Assets held in the trust accounts had an aggregate fair
value of $52.8 million at June 30, 2005. The refunded bonds were considered to be defeased, and
the liability for those bonds has been removed from the statements of net position. The refunding
of the bonds resulted in a difference between the reacquisition price and the net carrying amount of
the old debt of $3.1 million. The difference, which is recorded as a reduction of bonds payable, is
being charged to operations over the life of new bonds using the straight-line method. The
outstanding amount of these refunded bonds totaled $15.0 million and $26.4 million at June 30,
2017 and 2016, respectively.
Revenue bond interest is payable to the bondholders on May 1 and November 1 of each year.
Revenue bonds mature on November 1, in the years set forth below:
Maturity Principal Interest
2018 20,055,000$ 13,943,238$ 2019 18,940,000 13,089,0062020 19,520,000 12,244,4312021 19,350,000 11,345,7062022 20,115,000 10,424,6312023-2027 91,870,000 39,048,5252028-2032 96,910,000 19,276,7382033-2037 51,985,000 2,563,897
338,745,000$ 121,936,172$
Connecticut State University System
Notes to the Financial Statements
June 30, 2017 and 2016
47
Long-term liabilities activity for the year ended June 30, 2017 and 2016 was as follows:
Balance Balance
June 30, June 30,
2016 Additions Retirements 2017
Bonds payable 302,382,547$ 74,560,000$ (38,197,547)$ 338,745,000$
Premium on bonds payable 15,107,442 7,732,891 (2,382,764) 20,457,569
Discount on bonds payable (2,921,203) - 426,875 (2,494,328) Total bonds payable 314,568,786$ 82,292,891$ (40,153,436)$ 356,708,241$
Balance Balance
June 30, June 30,
2015 Additions Retirements 2016
Bonds payable 322,630,002$ -$ (20,247,455)$ 302,382,547$
Premium on bonds payable 16,902,052 - (1,794,610) 15,107,442
Discount on bonds payable (3,252,664) - 331,461 (2,921,203) Total bonds payable 336,279,390$ -$ (21,710,604)$ 314,568,786$
Connecticut State University System
Supplemental Financial Information
S-1
Page
Schedule of Net Pension Liability and Related Ratios (Unaudited) S-2
Schedule of Contributions (Unaudited) S-4
Notes to the Required Supplemental Information (Unaudited) S-6
Combining Statement of Net Position S-7
Combining Statement of Revenues, Expenses and Changes in Net Position S-9
Combining Statement of Cash Flows S-11
Notes to the Supplemental Schedules (Unaudited) S-14

Connecticut State University System
Schedule of Net Pension Liability and Related Ratios (Unaudited)
June 30, 2017 - 2014
S-2
2017 2016 2015 2014 1
System's proportion of the net pension liability 4.23% 3.96% 3.61% 3.12%
System's proportionate share of the net pension
liability $ 972,052,721 $ 653,585,476 577,889,607$ 516,857,599$
System's covered-employee payroll $ 152,194,773 $ 154,782,123 140,369,452$ 119,305,259$
System's proportionate share of the net pension
liability as a percentage of its covered-employee
payroll 639% 422% 412% 433%
Plan Fiduciary net position as a percentage of the
total pension liability 31.69% 39.23% 39.54% N/A 1
1 Until a full 10-year trend is compiled, the System is presenting only information for years for which information is available.
Schedule of Net Pension Liability and Related Ratios
State Employee Retirement System Plan
Last 10 Fiscal Years 1
Connecticut State University System
Schedule of Net Pension Liability and Related Ratios (Unaudited)
June 30, 2017 - 2014
S-3
2017 2016 2015 2014 1
System's proportion of the net pension liability 0.09% 0.10% 0.10% 0.10%
System's proportionate share of the net pension
liability $ 12,986,359 $ 10,523,910 9,727,277$ 10,728,942$
State's proportionate share of the net pension
liability associated with the System 12,986,447 10,523,916 9,714,654
Total $ 25,972,806 $ 21,047,826 19,441,931$ 10,728,942$
System's covered-employee payroll $ 4,127,906 $ 3,930,206 3,813,448$ 3,063,073$
System's proportionate share of the net pension
liability as a percentage of its covered-employee
payroll 315% 268% 255% 350%
Plan Fiduciary net position as a percentage of the
total pension liability 52.26% 59.50% 61.56% N/A 1
Last 10 Fiscal Years 1
1 Until a full 10-year trend is compiled, the System is presenting only information for years for which information is available.
Teachers Retirement System Plan
Connecticut State University System
Schedule of Contributions (Unaudited)
June 30, 2017 - 2014
S-4
2017 2016 2015 2014
Contractually required contribution $ 64,086,201 $ 54,526,224 45,788,758$ 33,007,798$
Contributions in relation to the contractually
required contribution (63,573,511) (54,253,593) (45,788,758) (32,974,790)
Contribution deficiency (excess) $ 512,690 $ 272,631 -$ 33,008$
System's covered-employee payroll $ 152,194,773 $ 154,782,123 140,369,452$ 119,305,259$
Contributions as a percentage of covered
employee payroll 41.77% 35.05% 32.62% 27.64%
State Employee Retirement System Plan
Last 10 Fiscal Years 1
1 Until a full 10-year trend is compiled, the System is presenting only information for years for which information is available.

Connecticut State University System
Schedule of Contributions (Unaudited)
June 30, 2017 - 2014
S-5
2017 2016 2015
Contractually required contribution $ 889,376 $ 943,917 909,799$
Contributions in relation to the contractually
required contribution (1,323,934) (1,516,991) (1,343,282)
Contribution deficiency (excess) $ (434,558) $ (573,074) (433,483)$
System's covered-employee payroll $ 4,127,906 $ 3,930,206 3,813,448$
Contributions as a percentage of covered
employee payroll 32.07% 38.60% 35.22%
Teachers Retirement System Plan
Last 10 Fiscal Years 1
1 Until a full 10-year trend is compiled, the System is presenting only information for years for which information is available.
Connecticut State University System
Notes to the Required Supplemental Information (Unaudited)
June 30, 2017 and 2016
S-6
1. Changes in Benefit Terms
For the June 30, 2015 and 2016 valuation, there were no changes in benefit terms.
For the June 30, 2016 valuation, there were two changes in assumptions:
Rates of withdrawal, disability retirement, service retirement and mortality were
adjusted to more closely reflect actual and anticipated experience. The analysis and
basis for these changes are included in the latest Experience Investigation for the five-
year period ended June 30, 2015.
Economic assumptions (assumed rates of inflation and investment return), the actuarial
cost method, and the UAAL amortization methodology were changed in accordance
with Memorandum of Agreement (MOU) between the State and SEBAC effective
December 8, 2016.

Connecticut State University System
Supplemental Information – Combining Statement of Net Position
June 30, 2017
S-7
Combining
CCSU ECSU SCSU WCSU SO Adjustments 2017 2016
Assets
Current assets:
Cash and cash equivalents 64,164,311$ 31,813,698$ 62,456,429$ 25,278,558$ 28,987,714$ -$ 212,700,710$ 207,246,334$
Investments - - - - 76,380,273 - 76,380,273 33,477,941
Student receivables 3,221,033 3,752,503 1,573,641 2,218,856 - - 10,766,033 15,118,471
Allowance-doubtful student
receivables (1,537,017) (2,719,446) (938,683) (1,213,851) - - (6,408,997) (7,535,576)
Student receivables, net 1,684,016 1,033,057 634,958 1,005,005 - - 4,357,036 7,582,895
Student loans receivable 558,206 556,279 2,149,427 363,118 - - 3,627,030 3,791,416
Grant receivables, net 518,269 413,921 973,406 748,711 - - 2,654,307 2,166,687
Miscellaneous receivables, net 1,161,045 94,427 115,528 49,285 - - 1,420,285 1,231,351
Due from the State of Connecticut 14,692,142 8,509,039 16,227,113 10,646,292 19,003,596 - 69,078,182 56,589,698
Due from SO and Universities 10,501 5,890 1,494,325 2,006,307 - (3,517,023) - -
Prepaid expenses and other current
assets 2,102,358 517,584 794,519 407,000 3,603,888 - 7,425,349 5,801,603
Total current assets 84,890,848 42,943,895 84,845,705 40,504,276 127,975,471 (3,517,023) 377,643,172 317,887,925
Noncurrent assets:
Cash and cash equivalents 16,972,759 15,097,241 25,387,906 6,356,263 77,371,307 - 141,185,476 134,139,202
Investments - - - 34,456,043 - 34,456,043 31,303,100
Student loans receivable 3,594,782 1,459,188 3,885,309 2,152,516 - - 11,091,795 11,249,412
Allowance-doubtful loan receivables (934,971) (509,832) (1,328,708) (480,759) - - (3,254,270) (3,303,835)
Loans receivable, net 2,659,811 949,356 2,556,601 1,671,757 - - 7,837,525 7,945,577
Other assets - - 109,565 67,017 237,224 - 413,806 1,219,678
Investment in plant 540,498,462 460,965,318 594,596,929 402,570,958 38,645,476 - 2,037,277,143 2,013,289,864
Accumulated depreciation (246,834,951) (167,769,076) (261,846,129) (165,514,954) (15,872,709) - (857,837,819) (819,610,685)
Investment in plant, net of
accumulated depreciation 293,663,511 293,196,242 332,750,800 237,056,004 22,772,767 - 1,179,439,324 1,193,679,179
Total noncurrent assets 313,296,081 309,242,839 360,804,872 245,151,041 134,837,341 - 1,363,332,174 1,368,286,736
Total assets 398,186,929$ 352,186,734$ 445,650,577$ 285,655,317$ 262,812,812$ (3,517,023)$ 1,740,975,346$ 1,686,174,661$
Deferred outflows of resources:
Deferred outflows related to pension -$ -$ -$ -$ 414,122,365$ -$ 414,122,365$ 165,782,862$
Deferred loss on bond refunding - - - - 396,167 - 396,167 -
Total deferred outflows of
resources -$ -$ -$ -$ 414,518,532$ -$ 414,518,532$ 165,782,862$

Connecticut State University System
Supplemental Information – Combining Statement of Net Position
June 30, 2017
S-8
Combining
CCSU ECSU SCSU WCSU SO Adjustments 2017 2016
Liabilities
Current liabilities:
Accounts payable 4,216,138$ 863,276$ 5,745,972$ 3,124,102$ 2,454,944$ -$ 16,404,432$ 13,947,383$
Accrued salaries and benefits 23,523,496 8,855,453 17,606,713 8,469,492 446,679 - 58,901,833 52,621,334
Accrued compensated absences 1,441,888 533,881 1,556,910 1,021,696 140,128 - 4,694,503 4,412,034
Due to the State of Connecticut 35,570 2,204,148 3,573 1,854,677 - - 4,097,968 3,527,446
Due to SO and Universities - - 100 - 3,516,923 (3,517,023) - -
Unearned tuition,fees and grant revenue 8,919,347 3,060,560 10,107,519 2,684,822 19,431 - 24,791,679 39,648,854
Bonds payable - - - - 20,055,000 - 20,055,000 18,562,547
Accrued bond interest payable - - - - 2,396,761 - 2,396,761 2,192,515
Other liabilities 727,681 235,995 1,258,395 615,796 232,968 - 3,070,835 3,873,005
Depository accounts 977,935 757,025 2,636,238 - - - 4,371,198 4,038,489
Total current liabilities 39,842,055 16,510,338 38,915,420 17,770,585 29,262,834 (3,517,023) 138,784,209 142,823,607
Noncurrent liabilities:
Accrued compensated absences 19,887,811 10,645,796 17,021,964 9,796,573 1,361,775 - 58,713,919 58,542,525
Bonds payable - - - - 336,653,241 - 336,653,241 296,006,239
Federal loan program advances 3,136,752 1,459,188 3,549,051 1,632,106 - - 9,777,097 9,777,097
Deferred compensation - - - - 203,669 - 203,669 416,223
Pension liability, net - - - 985,039,080 - 985,039,080 664,109,386
Total noncurrent liabilities 23,024,563 12,104,984 20,571,015 11,428,679 1,323,257,765 - 1,390,387,006 1,028,851,470
Total liabilities 62,866,618$ 28,615,322$ 59,486,435$ 29,199,264$ 1,352,520,599$ (3,517,023)$ 1,529,171,215$ 1,171,675,077$
Deferred inflows of resources:
Deferred inflows related to pension -$ -$ -$ -$ 1,319,624$ -$ 1,319,624$ 51,974$
Total deferred inflows of resources -$ -$ -$ -$ 1,319,624$ -$ 1,319,624$ 51,974$
Net Position
Invested in capital assets, net of
related debt 293,651,758$ 293,163,602$ 332,750,800$ 237,056,004$ (141,526,556)$ -$ 1,015,095,608$ 1,023,046,681$
Restricted:
Nonexpendable - 60,000 - 407,116 - - 467,116 467,116
Expendable 6,342,538 2,965,584 7,797,333 4,830,155 16,690,133 - 38,625,743 18,320,024
Unrestricted 35,326,015 27,382,226 45,616,009 14,162,778 (551,672,456) - (429,185,428) (361,603,349)
Total net position 335,320,311$ 323,571,412$ 386,164,142$ 256,456,053$ (676,508,879)$ -$ 625,003,039$ 680,230,472$

Connecticut State University System
Supplemental Information – Combining Statement of Revenues, Expenses and Changes in Net Position
Year Ended June 30, 2017
S-9
Combining
CCSU ECSU SCSU WCSU SO Adjustments 2017 2016
Operating revenues:
Tuition and fees:
Tuition and fees, gross 106,913,593$ 48,620,851$ 104,459,304$ 53,865,780$ 4,287,312$ -$ 318,146,840$ 303,029,788$
Less:
Scholarships allowance (9,293,236) (8,526,815) (7,906,783) (5,385,590) - - (31,112,424) (31,475,656)
Waivers (6,297,299) (2,924,330) (4,465,347) (1,871,107) - - (15,558,083) (14,890,945)
Debt service fee (7,143,958) (3,768,892) (6,876,173) (3,749,522) 21,167,791 370,754 - -
Tuition and fees, net of
scholarship allowances and
waivers 84,179,100 33,400,814 85,211,001 42,859,561 25,455,103 370,754 271,476,333 256,663,187
Federal grants and contracts 1,521,510 515,590 1,811,900 725,806 - - 4,574,806 4,727,211
State and local grants and contracts 4,289,288 1,260,537 4,033,775 2,015,390 27,773 - 11,626,763 14,846,852
Nongovernment grants and contracts 1,681,471 473,713 2,841,338 35,000 - - 5,031,522 4,208,779
Indirect cost recoveries 148,921 14,298 310,396 240 - - 473,855 283,120
Auxiliary revenues 33,149,079 30,076,568 31,041,936 19,601,718 211,741 (211,741) 113,869,301 117,737,368
Other operating revenues 6,638,345 2,606,195 6,494,953 12,584,702 13,827,478 (20,004,432) 22,147,241 20,027,902
Total operating revenues 131,607,714 68,347,715 131,745,299 77,822,417 39,522,095 (19,845,419) 429,199,821 418,494,419
Operating expenses:
Salaries and wages 103,510,957 58,753,984 102,576,546 59,475,731 4,330,834 - 328,648,052 334,041,973
Fringe benefits 58,566,008 35,203,380 57,635,429 32,700,494 76,137,222 - 260,242,533 196,319,389
Professional services and fees 5,918,194 3,007,538 7,306,463 3,653,538 3,373,655 - 23,259,388 30,034,822
Educational services and support 34,657,068 14,994,994 32,117,084 17,962,999 5,494 - 99,737,639 97,230,627
Travel expenses 2,733,289 841,385 1,798,018 855,391 139,909 - 6,367,992 6,753,943
Operation of facilities 25,301,681 7,792,547 10,719,984 10,184,681 20,872,070 (20,216,173) 54,654,790 52,856,778
Other operating supplies and expenses 5,152,260 4,336,781 7,858,003 6,765,638 13,871,216 370,754 38,354,652 37,563,493
Depreciation expense 18,262,833 13,868,993 20,009,655 12,239,585 479,486 - 64,860,552 64,131,356
Amortization expense - - 54,702 35,882 - - 90,584 100,059
Total operating expenses 254,102,290 138,799,602 240,075,884 143,873,939 119,209,886 (19,845,419) 876,216,182 819,032,440
Operating loss (122,494,576)$ (70,451,887)$ (108,330,585)$ (66,051,522)$ (79,687,791)$ -$ (447,016,361)$ (400,538,021)$

Connecticut State University System
Supplemental Information – Combining Statement of Revenues, Expenses and Changes in Net Position
Year Ended June 30, 2017
S-10
Combining
CCSU ECSU SCSU WCSU SO Adjustments 2017 2016
Nonoperating revenues (expenses)
State appropriations 84,487,949$ 53,044,355$ 79,959,053$ 51,367,159$ 7,263,446$ -$ 276,121,962$ 297,430,651$
Pell Grant Revenue 13,490,588 6,291,149 13,006,135 7,471,343 - - 40,259,215 41,340,475
Gifts 2,416,368 522,928 330,405 126,919 - - 3,396,620 3,818,896
Investment income 568,350 310,489 583,698 233,474 1,533,800 - 3,229,811 1,691,647
Interest expense (28) - - - (11,178,752) - (11,178,780) (10,147,405)
State financed plant facilities - - - - - - - 955,205
Other nonoperating revenues (expenses), net 388,069 306,975 690,492 695,761 (674,041) - 1,407,256 2,322,347
Transfers to the State of Connecticut - - - - - - - (4,100,000)
Net nonoperating revenues (expenses) 101,351,296 60,475,896 94,569,783 59,894,656 (3,055,547) - 313,236,084 333,311,816
Income (loss) before other changes in
net position (21,143,280) (9,975,991) (13,760,802) (6,156,866) (82,743,338) - (133,780,277) (67,226,205)
Other changes in net position
State appropriations restricted for
capital purposes 13,752,537 7,193,713 11,146,970 13,493,097 34,128,062 - 79,714,379 81,623,919
Loss on disposal of capital assets (160,207) (321,027) (150,332) (234,227) (295,742) - (1,161,535) (783,908)
Interagency transfers 1,045,571 775,920 775,920 775,921 (3,373,332) - - -
Net other changes in net position 14,637,901 7,648,606 11,772,558 14,034,791 30,458,988 - 78,552,844 80,840,011
Net increase in net position (6,505,379) (2,327,385) (1,988,244) 7,877,925 (52,284,350) - (55,227,433) 13,613,806
Net Position:
Net Position - beginning of year 341,825,690 325,898,797 388,152,386 248,578,128 (624,224,529) - 680,230,472 666,616,666
Net Position - end of year 335,320,311$ 323,571,412$ 386,164,142$ 256,456,053$ (676,508,879)$ -$ 625,003,039$ 680,230,472$
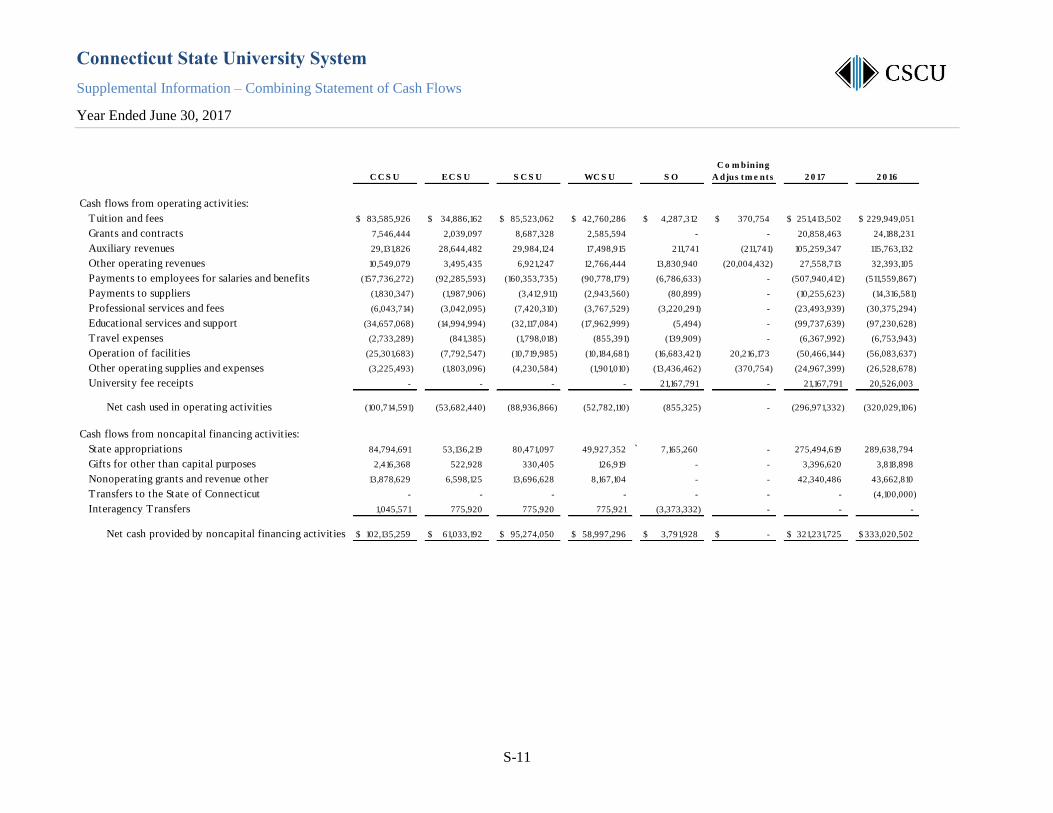
Connecticut State University System
Supplemental Information – Combining Statement of Cash Flows
Year Ended June 30, 2017
S-11
C o m bining
C C S U EC S U S C S U WC S U S O A djus tm e nts 2 0 17 2 0 16
Cash flows from operating activities:
Tuition and fees 83,585,926$ 34,886,162$ 85,523,062$ 42,760,286$ 4,287,312$ 370,754$ 251,413,502$ 229,949,051$
Grants and contracts 7,546,444 2,039,097 8,687,328 2,585,594 - - 20,858,463 24,188,231
Auxiliary revenues 29,131,826 28,644,482 29,984,124 17,498,915 211,741 (211,741) 105,259,347 115,763,132
Other operating revenues 10,549,079 3,495,435 6,921,247 12,766,444 13,830,940 (20,004,432) 27,558,713 32,393,105
Payments to employees for salaries and benefits (157,736,272) (92,285,593) (160,353,735) (90,778,179) (6,786,633) - (507,940,412) (511,559,867)
Payments to suppliers (1,830,347) (1,987,906) (3,412,911) (2,943,560) (80,899) - (10,255,623) (14,316,581)
Professional services and fees (6,043,714) (3,042,095) (7,420,310) (3,767,529) (3,220,291) - (23,493,939) (30,375,294)
Educational services and support (34,657,068) (14,994,994) (32,117,084) (17,962,999) (5,494) - (99,737,639) (97,230,628)
Travel expenses (2,733,289) (841,385) (1,798,018) (855,391) (139,909) - (6,367,992) (6,753,943)
Operation of facilities (25,301,683) (7,792,547) (10,719,985) (10,184,681) (16,683,421) 20,216,173 (50,466,144) (56,083,637)
Other operating supplies and expenses (3,225,493) (1,803,096) (4,230,584) (1,901,010) (13,436,462) (370,754) (24,967,399) (26,528,678)
University fee receipts - - - - 21,167,791 - 21,167,791 20,526,003
Net cash used in operating activities (100,714,591) (53,682,440) (88,936,866) (52,782,110) (855,325) - (296,971,332) (320,029,106)
Cash flows from noncapital financing activities:
State appropriations 84,794,691 53,136,219 80,471,097 49,927,352 ` 7,165,260 - 275,494,619 289,638,794
Gifts for other than capital purposes 2,416,368 522,928 330,405 126,919 - - 3,396,620 3,818,898
Nonoperating grants and revenue other 13,878,629 6,598,125 13,696,628 8,167,104 - - 42,340,486 43,662,810
Transfers to the State of Connecticut - - - - - - - (4,100,000)
Interagency Transfers 1,045,571 775,920 775,920 775,921 (3,373,332) - - -
Net cash provided by noncapital financing activities 102,135,259$ 61,033,192$ 95,274,050$ 58,997,296$ 3,791,928$ -$ 321,231,725$ 333,020,502$
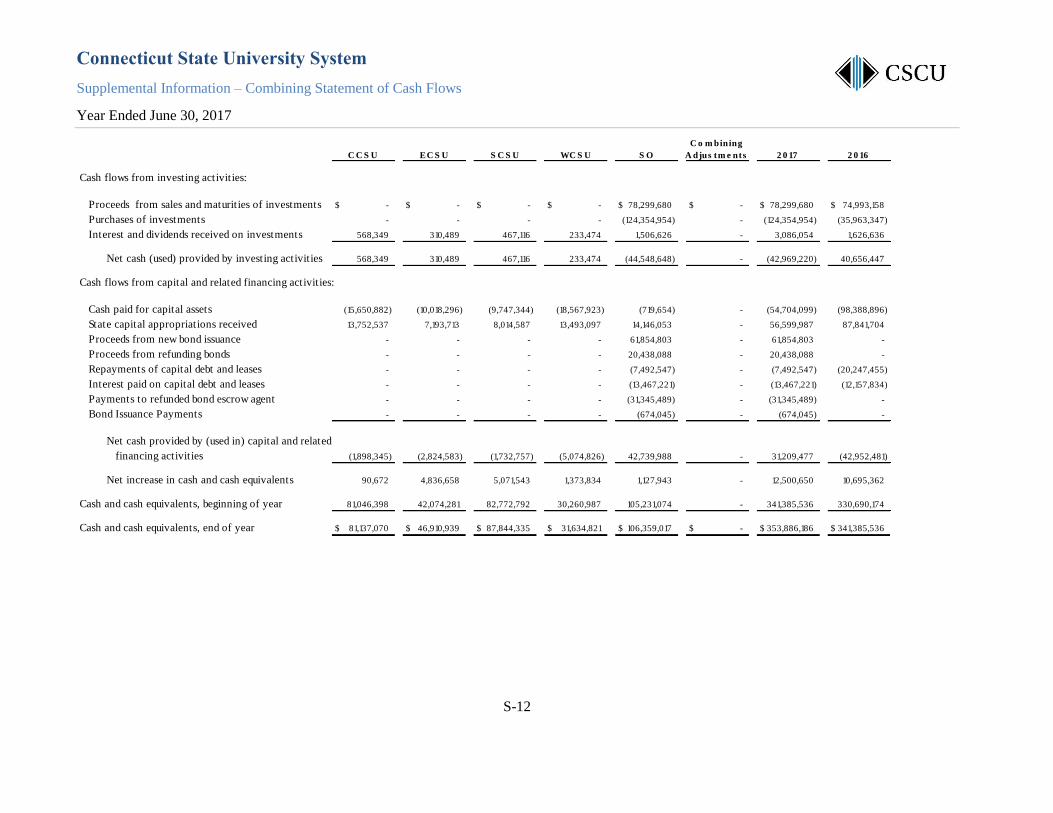
Connecticut State University System
Supplemental Information – Combining Statement of Cash Flows
Year Ended June 30, 2017
S-12
C o m bining
C C S U EC S U S C S U WC S U S O A djus tm e nts 2 0 17 2 0 16
Cash flows from investing activities:
Proceeds from sales and maturities of investments -$ -$ -$ -$ 78,299,680$ -$ 78,299,680$ 74,993,158$
Purchases of investments - - - - (124,354,954) - (124,354,954) (35,963,347)
Interest and dividends received on investments 568,349 310,489 467,116 233,474 1,506,626 - 3,086,054 1,626,636
Net cash (used) provided by investing activities 568,349 310,489 467,116 233,474 (44,548,648) - (42,969,220) 40,656,447
Cash flows from capital and related financing activities:
Cash paid for capital assets (15,650,882) (10,018,296) (9,747,344) (18,567,923) (719,654) - (54,704,099) (98,388,896)
State capital appropriations received 13,752,537 7,193,713 8,014,587 13,493,097 14,146,053 - 56,599,987 87,841,704
Proceeds from new bond issuance - - - - 61,854,803 - 61,854,803 -
Proceeds from refunding bonds - - - - 20,438,088 - 20,438,088 -
Repayments of capital debt and leases - - - - (7,492,547) - (7,492,547) (20,247,455)
Interest paid on capital debt and leases - - - - (13,467,221) - (13,467,221) (12,157,834)
Payments to refunded bond escrow agent - - - - (31,345,489) - (31,345,489) -
Bond Issuance Payments - - - - (674,045) - (674,045) -
Net cash provided by (used in) capital and related
financing activities (1,898,345) (2,824,583) (1,732,757) (5,074,826) 42,739,988 - 31,209,477 (42,952,481)
Net increase in cash and cash equivalents 90,672 4,836,658 5,071,543 1,373,834 1,127,943 - 12,500,650 10,695,362
Cash and cash equivalents, beginning of year 81,046,398 42,074,281 82,772,792 30,260,987 105,231,074 - 341,385,536 330,690,174
Cash and cash equivalents, end of year 81,137,070$ 46,910,939$ 87,844,335$ 31,634,821$ 106,359,017$ -$ 353,886,186$ 341,385,536$

Connecticut State University System
Supplemental Information – Combining Statement of Cash Flows
Year Ended June 30, 2017
S-13
C o m bining
C C S U EC S U S C S U WC S U S O A djus tm e nts 2 0 17 2 0 16
Reco ncilia tio n o f o pera ting inco me (lo s s ) to ne t cas h
pro vided by (us ed in) o pera ting ac tivities :
Opera ting lo s s (122,494,576)$ (70,451,887)$ (108,330,585)$ (66,051,522)$ (79,687,791)$ -$ (447,016,361)$ (400,538,021)$
Adjus tments to reco ncile o pera ting inco me (lo s s ) to ne t
cas h pro vided by (us ed in) o pera ting ac tivities :
Deprec ia tio n expens e 18,262,833 13,868,993 20,009,655 12,239,585 479,486 - 64,860,552 64,131,356
Amo rtiza tio n - - 54,702 35,883 - - 90,585 100,059
Changes in as s e ts and liabilities :
Receivables 7,645 1,495,015 833,989 485,096 - - 2,821,745 1,139,793
P repaid expens es and o ther (82,910) (127,028) 70,397 (80,283) (653,226) - (873,050) (1,269,656)
Acco unts payable 126,237 642,860 498,213 2,221,203 1,762,771 - 5,251,284 (3,285,587)
Accrued s a laries and benefits 3,935,062 1,072,619 325,054 941,771 5,993 - 6,280,499 4,191,317
Other liabilities 123,311 29,949 (354,103) (219,852) (200,916) - (621,611) (1,436,921)
Due to /fro m Sta te o f Co nnecticut (7,503) 569,086 (302,095) 311,034 - - 570,522 (603,840)
Due to /fro m Univers ities (124,766) (40,447) (1,529,755) (2,095,735) 3,790,703 - - -
Unearned tuitio n, fees and grant revenues (802,838) (858,184) (364,028) (714,531) (27,775) - (2,767,356) 1,765,362
Deferred co mpens a tio n - - - - (212,554) - (212,554) (150,727)
Depo s ito ry acco unts (70,219) 86,519 316,409 - - - 332,709 563,014
Accrued co mpens a ted abs ences 413,133 30,065 (164,719) 145,241 30,143 - 453,863 2,537,281
P ens io n Liability - - - - 320,929,694 - 320,929,694 76,492,502
Changes in deferred o utflo ws and inflo ws o f res o urces :
Deferred pens io n co ntributio n - - - - (248,339,503) - (248,339,503) (42,228,687)
Deferred pens o n as s e t ga ins - - - - 1,267,650 - 1,267,650 (21,436,351)
Net cas h us ed in o pera ting ac tivities (100,714,591)$ (53,682,440)$ (88,936,866)$ (52,782,110)$ (855,325)$ -$ (296,971,332)$ (320,029,106)$
No ncas h inves ting, no ncapita l financing and capita l and
re la ted financing trans ac tio ns :
Fixed as s e ts inc luded in acco unts payable 1,297,523$ 158,542$ 2,631,998$ 18,388$ 10,779$ -$ 4,117,230$ 5,252,684$
S ta te financed plant fac ilities -$ -$ -$ -$ -$ -$ -$ 955,205$
Reco ncilia tio n o f cas h and cas h equiva lents to the
co mbined s ta tements o f ne t as s e ts :
Cas h and cas h equiva lents c las s ified as current as s e ts 64,164,311$ 31,813,698$ 62,456,429$ 25,278,558$ 28,987,714$ -$ 212,700,710$ 207,246,334$
Cas h and cas h equiva lents c las s ified as no ncurrent as s e ts 16,972,759 15,097,241 25,387,906 6,356,263 77,371,307 - 141,185,476 134,139,202
81,137,070$ 46,910,939$ 87,844,335$ 31,634,821$ 106,359,021$ -$ 353,886,186$ 341,385,536$

Connecticut State University System Notes to the Supplementary Schedules
Years Ended June 30, 2017
S-14
1. Basis of Presentation of Supplemental Information
The supplementary schedules are presented to provide information from the stand-alone books and records
of the universities and system office. The supplementary schedules exclude certain eliminating entries
necessary to prepare the consolidated financial statements of CSUS. The supplementary schedules also do
not include the impact of the adoption of GASB 68, Pensions, on the individual universities as reported in
the financial statements of CSUS because the liability has not been allocated to the universities but rather is
reflected only at the CSUS system level in the financial statements.