
Confronting our FEERs - Bank of Canada · Confronting our FEERs a Bayesian-model-selection-based...
Definitions FEER Structure Bayesian model selection Estimation Robustness Analysis Conclusions Confronting our FEERs a Bayesian-model-selection-based robustness analysis D. Buscaglia 1 F. Fornari 2 C. Osbat 2 1 University of Pavia 2 European Central Bank The views expressed are the authors’ only and do not necessarily reflect those of the ECB or of the Eurosystem. 4th BoC - ECB Workshop Exchange Rates and Macroeconomic Adjustment 16 June 2011
Transcript of Confronting our FEERs - Bank of Canada · Confronting our FEERs a Bayesian-model-selection-based...

Definitions FEER Structure Bayesian model selection Estimation Robustness Analysis Conclusions
Confronting our FEERsa Bayesian-model-selection-based robustness analysis
D. Buscaglia1 F. Fornari2 C. Osbat2
1University of Pavia
2European Central BankThe views expressed are the authors’ only and do not necessarily reflect those of
the ECB or of the Eurosystem.
4th BoC - ECB WorkshopExchange Rates and Macroeconomic Adjustment
16 June 2011

Definitions FEER Structure Bayesian model selection Estimation Robustness Analysis Conclusions
Outline
1 Definitions, policy uses of EQFXEquilibrium Exchange Rate Models
2 Overview of the FEER modelFEER DefinitionThe FEER structureThe Marshall-Lerner Condition
3 Bayesian model selectionInformal sensitivity analysisA formal look at robustness: Bayesian model selection
4 EstimationThe FEER building blocks
5 Robustness AnalysisEstimated distributions
6 ConclusionsNon robustness and heterogeneity

Definitions FEER Structure Bayesian model selection Estimation Robustness Analysis Conclusions
Why do We want to Estimate EQFX?
IMF uses both BEER and FEER models for biannualexchange rate surveillanceMajor commercial banks usually also build models of thistype.ECB has been using BEERs and FEERS for many years:
International discussions on exchange rates (especiallywhen the euro is very low or very high).Input to ERM II assessment notes: for countries wishing toenter ERM II or entering the euro area.Discussions on IMF art. IV: euro area as well as individualeuro area countries.Assessment of intra-euro area imbalances.Input for stress testing in FX exposure in neighbouringcountries.Input for ESRB risk assessment

Definitions FEER Structure Bayesian model selection Estimation Robustness Analysis Conclusions
Behavioural Equilibrium Exchange Rates (BEER)
Starting point: Purchasing Power Parity (PPP): price levelsacross countries equalise.Empirical implication: real exchange rates are stationary.Empirical observation: they are not!So can some “fundamentals” explain deviations from PPP?A long list; the most uncontroversial one is relative GDPper capita: richer countries tend to have higher relativeprice levels.Other macroeconomic fundamentals: trade balance,relative government expenditure, terms of trade.

Definitions FEER Structure Bayesian model selection Estimation Robustness Analysis Conclusions
Fundamental Equilibrium Exchange Rate (FEER)
Also called “Macroeconomic Balance” model.Definition: The exchange rate consistent with internal andexternal balance.Internal balance: the country is operating at a level ofoutput consistent with full employment and low inflation.External balance: a sustainable current account positionas reflected by the underlying and desired net capitalflows, which depend on net savings that are, in turn,determined by factors such as consumption smoothing anddemographic factors.The FEER approach can be characterised as normative inthe sense that it delivers an equilibrium exchange rateconsistent with ‘ideal’ economic conditions.

Definitions FEER Structure Bayesian model selection Estimation Robustness Analysis Conclusions
FEER Pros and Cons.
FEER pros:A richer, more structuraldefinition of equilibrium.It can be used to “tell astory”.Theoretically appealing.
FEER cons:Conceptually: REER onlymechanism of CAadjustment: no role fordomestic factors.Empirically: Structuredifficult to implement:shortcuts needed.If a country runs a CAbalance its exchange rateis never misaligned (read:euro).Usually calibrated; verynon-robust when estimated.

Definitions FEER Structure Bayesian model selection Estimation Robustness Analysis Conclusions
The FEER structure: 4 building blocks
The FEER is given by this simple equation:
dCAdREER
= σ = λ (1−βM)MY
+ (λ∗(1−βX )−1)
XY
dREER =1σ
(CANORM −CAU
).
λ is the exchange rate pass-through to import prices,λ ∗ is the pass-through to export prices,βM and βX denote the absolute values of the import and exportprice elasticities,MY and X
Y are import and export ratios to GDP.CA∗, CAU are the sustainable and underlying current account

Definitions FEER Structure Bayesian model selection Estimation Robustness Analysis Conclusions
The Marshall-Lerner condition holds if σ < 0:
The trade balance will adjust when σ < 0, i.e. when
λ (1−βM)MY
+ (λ∗(1−βX )−1)
XY
< 0
βM >λ
MY −
XY + λ ∗ X
Y −βX λ ∗ XY
λMMY
βM > 1− (1−λ ∗+ βX λ ∗)
λ
XM
βM > 1− 1− (1−βX )λ ∗
λ
XM
.
In the simple case where TB=0 and ERPT =1, we get
βM > 1− XrMr
βX
βM + βX > 1

Definitions FEER Structure Bayesian model selection Estimation Robustness Analysis Conclusions
We take the FEER at face value and investigate itsrobustness
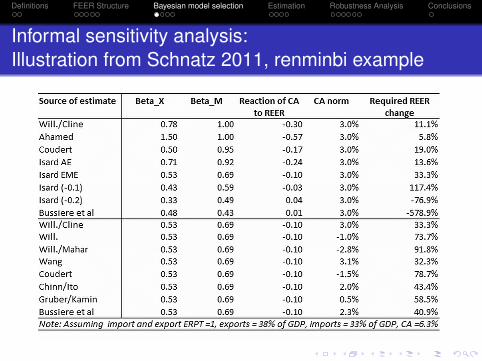
Informally: recent paper by B. Schnatz, looking at therange of uncertainty in FEER estimates focusing on theChinese renminbiFormally: using Bayesian variable selectionWe look at the effect of uncertainty about estimates of 3 ofthe 4 FEER building blocks:
Trade elasticities βX and βMExchange rate pass-through λ and λ ∗
Current account norm CA∗
We disregard the effect of uncertainty on the underlyingcurrent account (use WEO projection)
Definitions FEER Structure Bayesian model selection Estimation Robustness Analysis Conclusions
Informal sensitivity analysis:Illustration from Schnatz 2011, renminbi example

Definitions FEER Structure Bayesian model selection Estimation Robustness Analysis Conclusions
A formal look at robustness: Bayesian model selection
The starting point:Y = α + Xmβ + εt
where Xm can be any subset of X = (X1,...,XP).
Must identify which variables have a coefficient so close tozero that it is more efficient to ignore them.For P regressors, we have 2P possible choices of subsets.The exact calculation of the posterior distribution isinfeasible for large modelsMonte Carlo Markov Chain (MCMC) methods are used toexplore the model space by simulation to find models withhigh posterior probability.

Definitions FEER Structure Bayesian model selection Estimation Robustness Analysis Conclusions
The model search setup: Model space prior
Independence prior with equal weights:Letting λi index models,
p(λ ) = ∏wλii (1−wi)
1−λi
Each xi enters the model independently of the othervariables, with probability p(λi = 1) = wi .
We use a uniform prior, where wi = w = 0.5, so thatp(λ ) = 1/2p.This puts more weight on models of size p/2, while settingw smaller can put more weight on parsimonious models.

Definitions FEER Structure Bayesian model selection Estimation Robustness Analysis Conclusions
The model search setup: Parameter prior
Gaussian prior for the coefficients, centred at zeroThe distribution of the regression coefficients given themodel choice is
p(βλ |σ2,λ ) = N(0,σ2Σλ )
with an inverse gamma prior on the variance:
p(σ2|λ ) = IG(δ ,Q)
The hyperparameters:δ = 3 for the shape parameter (the smallest possible valuesuch that the mean of the distribution exists)Scale parameter Q which is comparable in size with theerror variance of yt |xt .

Definitions FEER Structure Bayesian model selection Estimation Robustness Analysis Conclusions
The core of the paper: Using Bayesian variableselection method to formally investigate robustness
Estimated each parameter underlying σ for each country,Found a lot of variability for each parameter both withineach country and among countries.Mapped uncertainty on each parameter to a distribution forσ : when the distribution crosses zero, there are areas ofthe parameter space where the Marshall-Lerner conditiondoes not hold.If M-L does not hold:
as σ → 0 no real exchange rate depreciation can make theCA moveif σ > 0 need an appreciation to reduce a deficit!

Definitions FEER Structure Bayesian model selection Estimation Robustness Analysis Conclusions
1. The current account norm
Static regression on 3-year moving averages: results across allmodels and 57 countries
10% median 90% Theory signrel GDP -0.02 0.04 0.22 +
rel trend GDP -2.28 -0.26 0.44 +rel GDP gap -0.19 -0.02 0.04 -
rel GDP growth rate -0.07 0.00 0.07 -rel gov’t deficit -0.37 0.01 0.59 -
rel age dependence -5.24 -0.04 1.19 -rel old ratio -5.42 0.02 12.18 -
rel young ratio -8.29 -2.24 1.43 -rel population growth -1.33 -0.02 4.99 -
rel energy dependence -0.01 0.00 0.00 -rel openness -0.15 -0.01 0.10 +
Table:

Definitions FEER Structure Bayesian model selection Estimation Robustness Analysis Conclusions
2. The trade elasticities
∆ log(Mvol)it = αMi +Ji
∑j=01
βM,ji ·∆ logPM,it−j +Ji
∑j=0
φM,ji ·∆ logPit−j
+Ki
∑k=0
ψM,ki ·∆ logGDPvolit−k +Li
∑l=1
ρM,li ·∆ logMvolit−l + εit
∆ log(Xvol)it = αXi +Ji
∑j=0
βX ,ji ·∆ logPX ,it−j +Ji
∑j=0
φM,ji ·∆ logP∗it−j
+Ki
∑k=0
ψX ,ki ·∆ logMvol worldt−k +Li
∑l=1
ρX ,l ·∆ logXvolit−l + νit
from which the long-run elasticities:
βLRM,i =
∑Jij=0 βM,,ji
1−∑Lil=1 ρM,li
, βLRX ,i =
∑Jij=0 βX ,,ji
1−∑Lil=1 ρX ,li

Definitions FEER Structure Bayesian model selection Estimation Robustness Analysis Conclusions
3. The exchange-rate pass-through
∆ logPMit = α +Ki
∑k=1
ρik ∆ logPMi ,t−k +Pi
∑p=0
λip∆ logNEERi ,t−p
+Qi
∑q=0
φiq∆ logPi ,t−q +Ji
∑j=0
θij∆ logP∗i ,t−j + εit
with long-run ERPT given by:
λLRit =
Pi
∑p=0
λ Mip
1−Ki
∑k=1
ρMik

Definitions FEER Structure Bayesian model selection Estimation Robustness Analysis Conclusions
Estimated distribution of βM for 4 countries

Definitions FEER Structure Bayesian model selection Estimation Robustness Analysis Conclusions
Estimated distribution of λ for 4 countries

Definitions FEER Structure Bayesian model selection Estimation Robustness Analysis Conclusions
Combining the building blocks into the distribution ofσ : robustness problem

Definitions FEER Structure Bayesian model selection Estimation Robustness Analysis Conclusions
Distribution of σ country by country: Non-robustness...
AT BE DE ES FI FRGR IE IT LU NL PT SI BGCY CZ DK EE HU LT LV MT PL ROSE SK UK AUCA−2
−1.5
−1
−0.5
0
0.5
1
CL CNHK IS JP NOSGKRCHUS DZ AR BRHR IN ID IL MYMXMA NZ PH RU ZATWTH TR VE EA−2
−1.5
−1
−0.5
0
0.5
1
Green squares indicate the median, red circles the mean

Definitions FEER Structure Bayesian model selection Estimation Robustness Analysis Conclusions
...and heterogeneity in the median estimates
using panel methods is a bad ideaeven mean-group estimators could be distorted by outliers

Definitions FEER Structure Bayesian model selection Estimation Robustness Analysis Conclusions
Heterogeneity even within country groups
Grouping the elasticities into industrial and emerging marketswould not help:

Definitions FEER Structure Bayesian model selection Estimation Robustness Analysis Conclusions
Conclusions
The uncertainty around the trade elasticities and exchangerate passthough maps into very large uncertainty aroundthe sensitivity of the current account to exchange rates(and Marshall-Lerner condition)Compounded with uncertainty about current accountbenchmarks: very large model uncertainty!This leads to doubt the robustness of FEER resultsAlso find much heterogeneity in the estimates acrosscountries: speaks against using panel methods (whichdominate the literature)