
Confirmatory Factor Analysis of the TerraNova ...pages.uoregon.edu/stevensj/papers/tn.pdf ·...
21
Confirmatory Factor Analysis of the TerraNova-Comprehensive Tests of Basic Skills/5 Joseph Stevens University of New Mexico Keith Zvoch University of Nevada-Las Vegas
Transcript of Confirmatory Factor Analysis of the TerraNova ...pages.uoregon.edu/stevensj/papers/tn.pdf ·...

Confirmatory Factor Analysis of the TerraNova-Comprehensive Tests of Basic Skills/5
Joseph Stevens
University of New Mexico
Keith Zvoch
University of Nevada-Las Vegas

Abstract Confirmatory factor analysis was used to explore the internal structural validity of scores
on the TerraNova-Comprehensive Tests of Basic Skills/5 (CTBS/5) using two data sources: a)
fourth, sixth, and eighth grade students from a large, urban southwestern school district; and b)
the fourth, sixth, and eighth grade standardization samples reported by the test publisher.
Achievement tests like the TerraNova are used nationally to fulfill a variety of assessment
purposes including identification of student strengths and weaknesses, curriculum evaluation,
and evaluation of school effectiveness. One of the benefits claimed for battery-type achievement
tests is that they provide reliable and valid samples of student achievement in specific content
areas. However, in order for achievement test scores to be used to identify the domain-specific
strengths and weaknesses of students and schools, achievement tests must be structured such that
the specific content areas are measured validly. Results of the present study showed that there
was little difference in goodness of fit between a two factor structure and a three factor structure
of instrument subtest scores. A nested series of invariance tests also showed that all parameters
of the three factor model cross-validated from the southwestern to the standardization samples.
Together with large intercorrelations between the latent achievement factors and large subtest
uniquenesses, these results raised questions about the differentiation among subtest scores as
well as how scores should be used and interpreted.
Confirmatory Analysis of the TerraNova
3
Confirmatory Factor Analysis of the TerraNova-CTBS/5
The TerraNova assessment series is a revision and expansion of the standardized
achievement tests produced by CTB/McGraw-Hill and includes the new edition of the
standardized, norm-referenced Comprehensive Tests of Basic Skills, Fifth Edition (CTBS/5;
CTB/McGraw-Hill, 1997). The TerraNova is designed to measure concepts, processes, and
skills in Reading/Language Arts, Mathematics, Science and Social Studies. Achievement tests
like the TerraNova are used nationally to fulfill a variety of assessment purposes including
identification of student strengths and weaknesses, curriculum evaluation, and evaluation of
school effectiveness. The TerraNova and other similar instruments have also been used in a
number of states to create standards-based, criterion-referenced interpretations of performance
through the use of standard setting procedures (e.g., Lewis, Green, Mitzel, Baum, & Patz, 1998)
and the creation of proficiency categories to describe performance levels. The TerraNova is
designed to provide continuity with previous editions of the CTBS assessment series, but the
instrument was also designed to reflect thematic integration of assessment content into current
curricular and classroom practices (CTB/McGraw-Hill, 1996).
While several achievement instruments in common use have substantial evidence of
content validity, there is surprisingly little published evidence that supports the structure of such
instruments and the validity of their intended use and interpretation (see Stevens, 1995). Valid
test use and interpretation depends in part on the establishment of internal structural validity;
evidence that the structure of an instrument supports the reported scores and their interpretations
(Messick, 1994). Recognizing the importance of ascertaining the factorial structure of
assessment instruments, the “Standards for Educational and Psychological Testing” (AERA,
APA, & NCME, 1999) advise that evidence of the internal structural validity of tests should be
gathered (see standards 1.11 and 1.12, p. 20). However, a review of the literature reveals that
Confirmatory Analysis of the TerraNova
4
studies of the internal, structural validity of achievement tests is rare. This is particularly
problematic given that student scores on these assessment instruments are often used to make
high stakes decisions about students and schools. Despite substantial investment in test
development and the establishment of content validity, the TerraNova is like other major
achievement tests in that there is almost no published research describing factorial or internal
construct validity. In a review of the previous edition of the instrument, the CTBS/4, Miller
(1991) concluded that while “...CTBS/4 has provided substantial documentation on the universe
represented by the test battery...little evidence has been reported for specific uses of the scores”
(p.219).
In a rare study of factorial validity, Klein (1980) examined the structure of CTBS/4
reading, vocabulary, language, and mathematics subtest scores from a sample of 348 fourth
grade and 384 sixth grade students in a large Midwest suburban school district. These subtests
represent the core subtests that are used to form the total composite reported on the CTBS.
Using principal axis exploratory factor analysis (EFA) with oblique rotation, Klein found
principal factor eigenvalues of 5.78 and .481 for the first two factors in the fourth grade sample
and eigenvalues of 5.36 and .70 for the first two factors in the sixth grade sample. KR21
estimates of subtest score reliabilities in these two samples ranged from .82 to .94 for the fourth
graders and from .66 to .85 for the sixth graders. Despite the relatively high internal consistency
estimates, Klein concluded that there was substantial redundancy among the eight CTBS subtests
suggesting that a single common factor best represented the structure of the instrument. Klein
concluded that there was “...no evidence to support the separation of achievement areas
suggested by the authors of the CTBS” and cautioned that “...the intercorrelations among the
subtests and among the subtotals appear to be too high to yield reliable and valid profiles for use
in individualized diagnosis or instruction” (p.1109).
Confirmatory Analysis of the TerraNova
5
Given the importance of an evidential basis for the internal, factorial validity of score use
and interpretation and the rarity of studies on this issue, the purpose of the present study was to
attempt to replicate Klein’s results and examine alternative structural models of the TerraNova to
evaluate internal construct validity using confirmatory factor analysis (CFA). A second objective
of the study was to cross-validate results of these models for local samples of fourth, sixth, and
eighth grade students in comparison with the published standardization samples.
Method
Samples
Test data from two samples of students were used in the present study. The first sample
was composed of 6,409 fourth grade, 6,138 sixth grade, and 5,982 eighth grade students in a
large urban school district in the southwestern United States who took the TerraNova-CTBS/5 in
1999 as part of the state mandated assessment system. For purposes of the present study, children
who had not taken all six core subtests of the TerraNova were excluded. The exclusion of
students with missing subtest scores resulted in effective sample sizes of 6,262 fourth grade
students (97.7%), 5,993 sixth grade students (97.6%), and 5,831 eighth grade students (97.5%).
The first sample was used to test alternative models of the structure of the instrument.
The second sample was composed of three grades from the national standardization
samples that corresponded to the same grades as the southwestern sample: fourth grade
(TerraNova level 2), N = 4,625; sixth grade (TerraNova level 3), N = 4,577; and eighth grade
(TerraNova level 4), N = 4,766. The purpose of the second sample was to provide a basis for
cross-validation of results obtained with the southwestern sample. Analysis of the
standardization samples was based on published matrices of subtest correlations, means, and
standard deviations reported in the TerraNova Technical Bulletin (CTB/McGraw-Hill, 1997).
It should be noted that the ethnic composition of the southwestern sample was noticeably
different from the standardization sample. Averaged across all elementary grades for public
Confirmatory Analysis of the TerraNova
6
schools, the ethnic composition of the standardization sample is reported as 2.2% Asian, 9.6%
Hispanic, 17.5% African American, and 70.7% White or Other (CTB/McGraw-Hill, 1997, p.
61). Averages in the southwestern sample across the three grade levels studied were 3.7% Asian,
46.0% Hispanic, 3.9% African American, and 46.4% White or Other.
Instrument
The present paper is concerned with an analysis of the edition of the TerraNova-CTBS/5
that uses only selected response items. The TerraNova-CTBS/5 Survey Plus is composed of nine
individual subtests: 1) Reading, 2) Vocabulary, 3) Language, 4) Language Mechanics, 5)
Mathematics, 6) Mathematics Computation, 7) Science, 8) Social Studies, and 9) Spelling. In
addition to the individual subscores, the publisher reports four composite scores. The Reading
Composite is composed of the Reading and Vocabulary subtests. The Language Composite is
composed of the Language and Language Mechanics subtests. The Mathematics Composite is
composed of the Mathematics and Mathematics Computation subtests. The Total Score is a
combination of the three composite scores. Score reports for administrators, teachers, parents
and students include reporting of all individual subtests as well as these composite scores. Our
interest in the present study was only in the structure among the core subtests contained in the
three content-area composite scores (Reading, Language, and Mathematics) that were used
operationally for high-stakes purposes and that were studied by Klein (1980). The present study
was not concerned with the Science, Social Studies, or Spelling subtests. The publisher reports
KR20 reliabilities for scores from the standardization sample for the Reading, Vocabulary,
Language, Language Mechanics, Mathematics, and Mathematics Computation subtests of .92,
.85, .83, .85, .90, and .85 in grade 4. In grade 6, for the same subtests, KR20 standardization
sample score reliabilities are reported as .90, .85, .87, .84, .88, and .89. In grade 8, for the same
subtests, KR20 standardization sample score reliabilities are reported as .91, .83, .83, .84, .87,
and .87. Lower bound estimates of subtest reliabilities were comparable across grades in the
Confirmatory Analysis of the TerraNova
7
southwestern sample and are reported for the sixth grade sample in Table 2. Reliabilities in both
samples may be somewhat low based on recommendations for values of .90 or higher in high-
stakes applications of test scores (see Henson, 2001; Nunnally & Bernstein, 1994).
Structural Models
Three competing models were tested to investigate the structure of the TerraNova. The
first model was that suggested by Klein (1980): a single general achievement factor which
accounts for a highly interrelated collection of subtests, each of which has little if any reliable
variation not accounted for by the single general achievement factor. Model 2 was a model
suggested by a conceptual review of the subtests and from observation of large pairwise
correlations among reading and language subtests. Model 2 was composed of two factors:
Reading/Language and Mathematics. In this model, there were paths from the reading,
vocabulary, language, and language mechanics subtests to a factor named reading/language and
paths from the mathematics and mathematics computation subtests to a second factor named
mathematics. Model 3 was the three factor structure suggested by the composite score reporting
methods used by the publisher: a) Reading, composed of the reading and vocabulary subtests; b)
Language, composed of the language and language mechanics subtests; and c) Mathematics,
composed of the mathematics and mathematics computation subtests. Factor variances and
covariances were freely estimated in all models and no residuals were allowed to correlate.
Several goodness of fit indices were used to evaluate model fit: the chi-square
approximation of the discrepancy function (χ2), the Comparative Fit Index (CFI), the Tucker-
Lewis Index (TLI), the Standardized Root Mean square Residual (SRMR) and the Root Mean
Square Error of Approximation (RMSEA). Hu and Bentler (1999) recommended the use of
combinations of goodness of fit measures to obtain robust evaluations of model fit. By
presenting the CFI, TLI, SRMR and RMSEA, several combinations of criteria can be used to
evaluate results in the present study. Using Hu and Bentler’s criteria, a model that fits the data

Confirmatory Analysis of the TerraNova
8
well would have CFI and TLI values of .95 or greater, SRMR values less than .08, and RMSEA
values of .06 or less.
In addition to the traditional form of the Tucker-Lewis index, we also report a variation
on the traditional TLI index:
TLI1 = (χ21/df1 - χ2
T/dfT) / (χ21/df1 - 1)
where χ21/df1 is the ratio associated with the most parsimonious one-factor model we used and
χ2T/dfT is the ratio associated with either the two factor or the three factor models (see Tucker &
Lewis, 1973; Marsh, Balla, & McDonald, 1988). The second form of the Tucker-Lewis index
(TLI1) addressed concerns raised by Sobel and Bohrnstedt (1985) regarding the appropriateness
of the null model as a baseline for comparison in many model testing situations. They argued
that the null model may be an unrealistic representation of the relationships among variables and
therefore an inappropriate standard for comparison. This may be particularly true when there are
strong relationships among the measured variables making the traditional null model an
unrealistic baseline model. In the present study, theoretical interest was in the adequacy of the
simple model (e.g., Klein's one factor general achievement model) to fully account for subtest
relationships. To fully capture this interest, the TLI1 index was computed using the one-factor
model rather than the null model as the baseline for comparison. Thus, the index described the
relative reduction in lack-of-fit of the two or three factor models over the more parsimonious
one-factor model.
The availability of two independent samples for analysis allowed cross-validation of
results. In order to determine whether the tested models of instrument structure would generalize
across samples, the degree of cross-validation was evaluated using a series of nested invariance
tests in which results for the southwestern samples (used as calibration samples) were applied to
the standardization samples (used as cross-validation samples). The nested series of tests
proceeded from less to more restrictive hypotheses of invariance across samples in four steps

Confirmatory Analysis of the TerraNova
9
examining the equivalence of: a) model structure, b) model structure and factor regression
weights (Λ), c) model structure, factor regression weights (Λ), and latent variable variances and
covariances (Φ), and d) model structure, factor regression weights (Λ), latent variances-
covariances (Φ), and variable uniquenesses (θδ). This hierarchy of invariance tests covered the
full range of strategies from “full” to “partial” cross-validation as described by Bandalos, (1993),
Cudeck and Browne (1983), and MacCallum, Roznowski, Mar, and Reith (1994) and allowed an
evaluation of whether observed results were sample specific. In evaluating the invariance tests,
we used the critical value of a .02 change in CFI or TLI as an indication of a significant
difference in fit as proposed by Cheung and Rensvold (2002).
Results
Maximum likelihood confirmatory factor analysis (CFA) using AMOS 4.0 (Arbuckle &
Wothke, 1999) was conducted to test the alternative models in each sample. Analyses were based
on variance-covariance matrices of the subtest scores. Mardia’s test was applied to the
southwestern samples and showed no significant departures from multivariate normality. No
evaluation of normality was conducted on the standardization samples because analyses were
based on published summary statistics and score level data were not available. Means and
standard deviations were similar in size in the southwestern and standardization samples at each
grade level. Correlations among the subtests were similar in size and pattern across all samples.
All subtest correlations were positive and at least moderate in size, ranging from .44 to .83.
Complete summary data can be obtained on request from the author.
Model Testing
The first CFA model tested was the single factor representation of achievement.
Goodness of fit measures for both the southwestern and the standardization samples across the
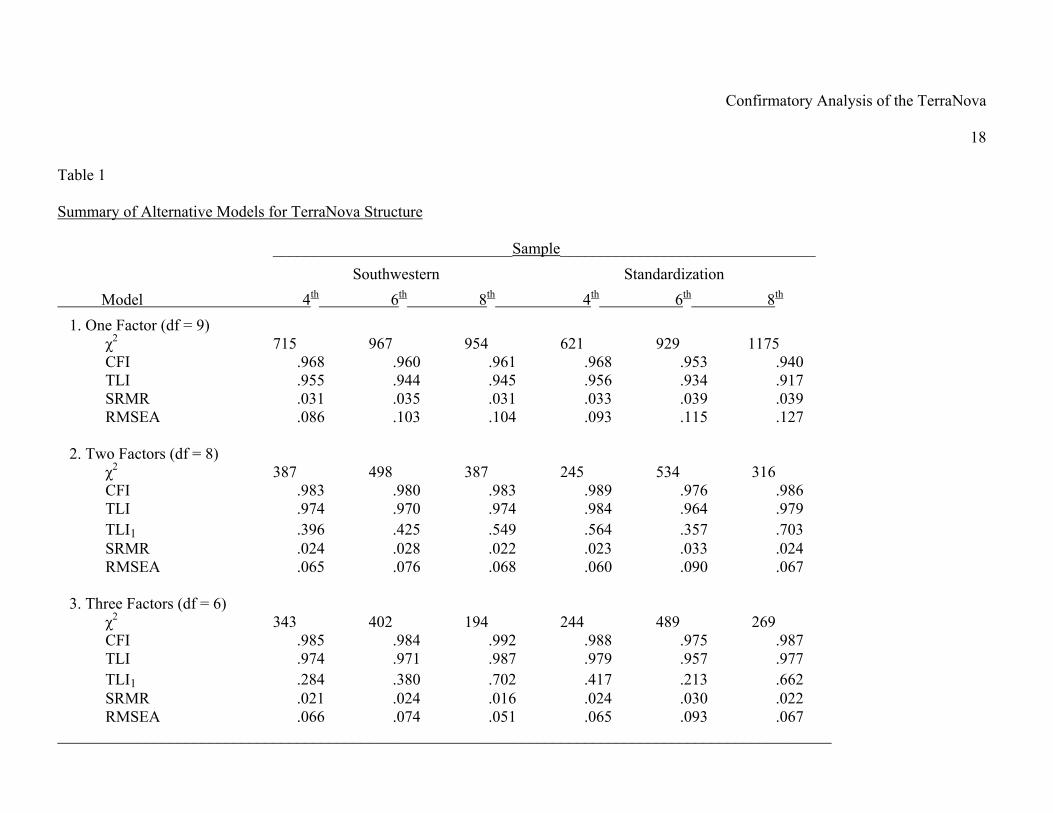
three grade levels appear in Table 1. The one-factor model provided moderate fit to the sample
data, with values of the CFI and TLI of .92 and above, values of SRMR below .04 and values of

Confirmatory Analysis of the TerraNova
10
RMSEA from .086 to .127. These results suggest that the one factor model does not provide an
entirely satisfactory fit to the data.
____________________________________
Insert Table 1 About Here
____________________________________
Application of Model 2, composed of a Reading/Language factor and a Mathematics
factor, resulted in statistically significant improvements in model fit for both samples (all ∆χ2
larger than 328, p < .001). Values of CFI were all above .97 and TLI values were all above .96.
Values of SRMR were at or below .033 and values of the RMSEA were at or below .09. While
the CFI and TLI values suggest good model fit, the RMSEA values do not meet the strict criteria
for fit suggested by Hu and Bentler (1999). Application of the second version of the Tucker-
Lewis index (TLI1) produced noticeable improvements in model fit of the two factor model over
the one factor model for all grades in both samples.
The three factor model corresponding to the Reading, Language, and Mathematics
composite scores and the score reports used by the test publisher produced inconsistent changes
in model fit when compared to the two factor model. There were statistically significant
improvements in fit of Model 3 over Model 2 for five of the six samples (all ∆χ2 larger than 44, p
< .001). The exception was the 4th grade standardization sample which showed no difference
between the two models (p = .61). Also in Model 3, all CFI values were larger by only .002 to
.009 in the southwestern sample while in the standardization sample CFI values were virtually
the same. Values of the TLI were approximately the same for the 4th and 6th grade, but .013
larger for the 8th grade in the southwestern sample. In the standardization sample, values of the
TLI were slightly smaller. In addition, values of the SRMR were smaller in all but one case
compared to the two-factor model but values of the RMSEA were smaller in only two of six
cases. In five of the six samples the second version of the Tucker-Lewis index (TLI1) produced

Confirmatory Analysis of the TerraNova
11
less improvement in model fit for the three factor model than was shown by the two-factor
model.
These results demonstrated that although the three factor model produced a statistically
significant improvement in fit in five of six cases, the size of the improvements were small in
comparison to the two factor model. Because the three factor model represents the structure used
by the test publisher in score reporting and interpretation and the differences in fit between the
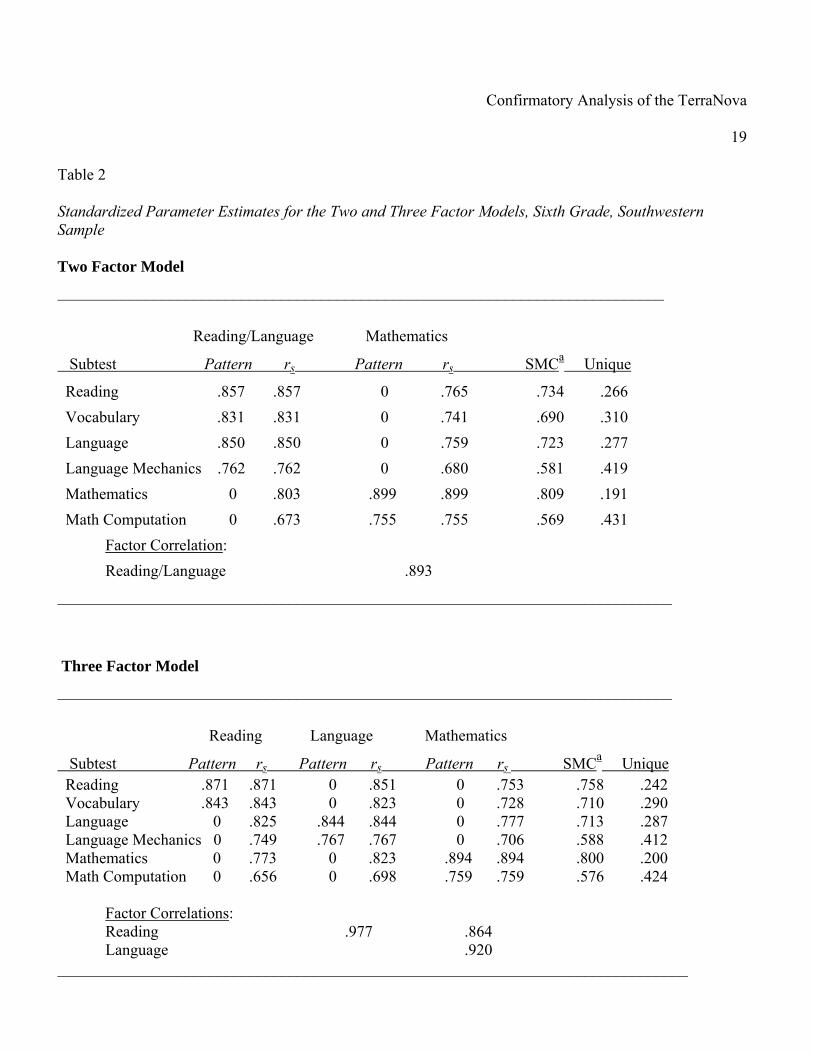
two and three factor models were not large, the three factor model for the sixth grade
southwestern sample is used to further illustrate the results. Standardized parameter estimates
(pattern coefficients) as well as structure coefficients (rs) for the sixth grade southwestern sample
are presented in Table 2. Coefficients for the other samples were quite similar in magnitude and
pattern from one sample to another. All parameter estimates were positive and statistically
significant. The structure coefficients were also uniformly positive and large in magnitude even
when indicating relationships of subtest scores to off-pattern factors. The size of the correlations
among the three factors is noteworthy ranging from .86 to .98. The common factor variance for
the six subtests ranged from .58 to .81 indicating that, while the subtests shared a substantial
amount of variance with the factors, there were significant amounts of variance that remained
specific to each subtest.
____________________________________
Insert Table 2 About Here
____________________________________
Cross-validation
In order to evaluate the comparability and generalizability of these results across the two
samples, cross-validation of the three factor model was conducted using the southwestern sample
as a calibration sample in a nested series of tests. The standardization sample was used as the
cross-validation sample. In the least restrictive test, the three factor model was applied to the
Confirmatory Analysis of the TerraNova
12
cross-validation sample and parameters were freely estimated at each grade level (see Table 3,
all rows labeled II.A.). For all three grades for the cross-validation samples, the structure of the
three factor model had similar fit to the calibration sample. Although some indices changed from
the calibration to cross-validation samples, in general the goodness of fit was comparable across
samples. The next three statistical comparisons introduced increasingly greater constraints on the
three factor model by fixing parameters in the cross-validation samples to the values estimated
for the calibration sample. Holding factor regression weights (Λ Fixed), factor variances and
covariances (Λ, Φ Fixed), and subtest uniquenesses (Λ, Φ, Θδ Fixed) invariant introduced
successively greater lack of fit as indicated by the increases in obtained χ2 values for each
comparison at each grade level (see rows II.B., II.C., and II.D. in Table 3). While all of these
comparisons were statistically significant (p < .001) given the sample sizes in the present study,
the magnitude of the changes in model fit were quite small. Even when all parameters were
constrained, goodness-of-fit indices in the two cross-validation samples were quite comparable
to the unconstrained models. For example, the change in CFI from the least to the most
restrictive model was .015, .000, and .004 for the three grades. Using Cheung and Rensvold’s
criterion of a difference of .02, these differences were not substantively important.
____________________________________
Insert Table 3 About Here
____________________________________
Discussion
The present study examined the application of three a priori conceptualizations of the
internal structure of scores from two samples of children who took the TerraNova achievement
test. Although a three factor model provided statistically significant improvements in model fit in
comparison to one and two factor models, the size of the improvements over the two-factor
model were negligible. A nested series of invariance tests of cross-validation showed statistically
Confirmatory Analysis of the TerraNova
13
significant but functionally small differences across the two samples. The representation of the
TerraNova subtest scores presented in published manuals and suggested by score reports
received only marginal support and was not noticeably superior to a more parsimonious two-
factor model representing a combined reading/language factor and a mathematics factor.
As noted in the TerraNova Technical Bulletin (1996), patterns of intercorrelations among
the subtests should demonstrate convergent and divergent validity: “For example, the
TerraNova Language Mechanics test is expected to correlate highly with the Reading/Language
Arts test, while its correlation with the TerraNova Mathematics test should be lower” (p. 6).
However, taking this very example, in the southwestern sample in this study the correlation of
language mechanics was .61 with reading, .65 with language, and .65 with mathematics. This
lack of divergence was also evidenced in the very high intercorrelations of the latent factors.
The correlation of Reading and Language was .98 suggesting that these two constructs are
functionally equivalent. The high intercorrelations of the Mathematics factor with Reading (.86)
and Language (.92) raised the question of whether there is sufficient differentiation in
achievement performance among these constructs to have utility for many uses and
interpretations of the instrument.
In a previous study, Stevens (2001) found results similar to those reported here using ex
post facto model respecification. When three residual variances were allowed to covary, a one-
factor model fit the data well. Interrelationships among the unique variance of the subtests
suggested a two or three factor conceptualization of the TerraNova. Results also showed that
scores from some subtests were associated with other factors that are nominally and conceptually
distinct (e.g., language mechanics with the mathematics factor). These results are underscored in
the present study by the large values of the structure coefficients of subtest scores with off-
pattern factors. The lack of differentiation in the magnitude of the structure coefficients between

Confirmatory Analysis of the TerraNova
14
subtests and their intended factor versus other off-pattern factors suggests possible problems of
instrument interpretation (Graham, Guthrie, & Thompson, 2003).
These results may be due to either task specific features in common across subtests or
subtests that are measuring common, non-achievement features of performance like decoding or
problem-solving. These concerns are amplified by the size of the unique variances for several of
the TerraNova subtests in the present study. Unique variance is a combination of unreliable
variance and subtest specific variance unrelated to the common variance in the factor model.
The current study results suggest that there may be large components of subtest performance that
are due to specific variance arising from unknown, construct irrelevant factors. In the case of the
Language Mechanics and Mathematics Computation subtests (unique variances of .419 and .431
respectively), there may be as much as 40% of the variance of subtest scores that is not construct
relevant.
Messick (1989) argued that validity must be apparent in the use and interpretation of
score information. This suggests that score reports, summaries, examinee profiles, and
interpretive materials should be supported by validity evidence and patterned after scores on
dimensions of an instrument that are demonstrably reliable and valid. The present study calls into
question the evidential basis for the way in which TerraNova results are scored and reported.
Although the current study results do not unequivocally support one instrument structure, neither
was there support for the separation of CTBS subtests into the composite scores used and
reported by the publisher. There was little differentiation among the composite scores and for
some subtests a large proportion of the total variance of the subtests was specific variance
unrelated to the latent factors. As Klein concluded in 1980 for the CTBS/4, interpretations using
the instrument should be tempered accordingly.
Confirmatory Analysis of the TerraNova
15
References
American Educational Research Association, American Psychological Association, and National
Council on Measurement in Education. (1999). Standards for educational and
psychological testing. Washington, DC: AERA.
Arbuckle, J. L., & Wothke, W. (1999). AMOS 4.0 user’s guide. Chicago, IL: Smallwaters
Corporation.
Bandalos, D. L. (1993). Factors influencing cross-validation of confirmatory factor analysis
models. Multivariate Behavioral Research, 28, 351-374.
Browne, M. W., & Cudeck, R. (1989). Single sample cross-validation indices for covariance
structures. Multivariate Behavioral Research, 24, 445-455.
Byrne, B. M. (1989). A primer of LISREL: Basic applications and programming for
confirmatory factor analytic models. New York: Springer-Verlag.
Cheung, G.W., & Rensvold, R.B. (2002). Evaluating goodness-of-fit indexes for testing
measurement invariance. Structural Equation Modeling: A Multidisciplinary Journal, 9,
233-255.
CTB/McGraw-Hill. (1996). TerraNova prepublication technical bulletin.
Monterey, CA: Author.
CTB/McGraw-Hill. (1997). TerraNova technical bulletin 1. Monterey, CA:
Author.
Cudeck, R., & Browne, M. W. (1983). Cross-validation of covariance structures. Multivariate
Behavioral Research, 18, 147-167.
Graham, J. M., Guthrie, A. C., & Thompson, B. (2003). Consequences of not interpreting
Confirmatory Analysis of the TerraNova
16
structure coefficients in published CFA research: A reminder. Structural Equation
Modeling, 10, 142-153.
Henson, R. K. (2001). Understanding internal consistency reliability estimates: A
conceptual primer on coefficient alpha. Measurement and Evaluation in Counseling and
Development, 34, 177-189.
Jöreskog, K. G. (1993). Testing structural equation models. In K. A. Bollen and J. S. Long
(Eds.), Testing structural equation models (pp. 294-316). Newbury Park, CA: Sage.
Klein, A. E. (1980). Redundancy in the Comprehensive Tests of Basic Skills. Educational and
Psychological Measurement, 40, 1105-1110.
Lewis, D. M., Green, D. R., Mitzel, H. C., Baum, K. & Patz, R. J. (1998). The bookmark
standard setting procedure: Methodology and recent implementations. Paper presented at
the annual meeting of the National Council on Measurement in Education, San Diego,
CA.
MacCallum, R. C., Roznowski, M., Mar, C., & Reith, J. V. (1994). Alternative strategies for
cross-validation of covariance structure models. Multivariate Behavioral Research, 29,
1-32.
Marsh, H. W., Balla, J., & McDonald, R. P. (1988). Goodness-of- fit indices in confirmatory
factor analysis: The effect of sample size. Psychological Bulletin, 103, 391-410.
Messick, S. (1989). Validity. In R.L. Linn (Ed.), Educational measurement (3rd Ed., pp. 13-
103). New York: MacMillan.
Messick, S. (1994). The interplay of evidence and consequences in the validation of
performance assessments. Educational Researcher, 23, 13-23.
Confirmatory Analysis of the TerraNova
17
Miller, M. D. (1992). Review of the Comprehensive Tests of Basic Skills, fourth edition. In J. J.
Kramer, & J. C. Conoley (Eds.), The eleventh mental measurements yearbook. Lincoln,
NE: Buros Institute of Mental Measurements.
Nunnally, J. C., & Bernstein, I. H. (1994). Psychometric theory (3rd ed.). New York:
McGraw-Hill.
Sobel, M. E., & Bohrnstedt, G. W. (1985). Use of null models in evaluating the fit of covariance
structure models. In N.B. Tuma (Ed.), Sociological methodology (pp.152-178). San
Francisco, CA: Jossey-Bass.
Stevens, J. J. (1995). Confirmatory factor analysis of the Iowa Tests of Basic Skills . Structural
Equation Modeling: A Multidisciplinary Journal, 2, 214-231.
Stevens, J. J. (2001). Confirmatory factor analysis of the CTBS5/TerraNova. Paper presented at
the annual meeting of the American Educational Research Association, Seattle, WA.
Tucker, L. R., & Lewis, C. (1973). The reliability coefficient for maximum likelihood factor
analysis. Psychometrika, 38, 1-10.
Confirmatory Analysis of the TerraNova
18
Table 1
Summary of Alternative Models for TerraNova Structure
______________________________Sample________________________________ Southwestern Standardization Model 4th 6th 8th 4th 6th 8th 1. One Factor (df = 9) χ2 715 967 954 621 929 1175 CFI .968 .960 .961 .968 .953 .940 TLI .955 .944 .945 .956 .934 .917 SRMR .031 .035 .031 .033 .039 .039 RMSEA .086 .103 .104 .093 .115 .127 2. Two Factors (df = 8) χ2 387 498 387 245 534 316 CFI .983 .980 .983 .989 .976 .986 TLI .974 .970 .974 .984 .964 .979 TLI1 .396 .425 .549 .564 .357 .703 SRMR .024 .028 .022 .023 .033 .024 RMSEA .065 .076 .068 .060 .090 .067 3. Three Factors (df = 6) χ2 343 402 194 244 489 269 CFI .985 .984 .992 .988 .975 .987 TLI .974 .971 .987 .979 .957 .977 TLI1 .284 .380 .702 .417 .213 .662 SRMR .021 .024 .016 .024 .030 .022 RMSEA .066 .074 .051 .065 .093 .067 _________________________________________________________________________________________________
Confirmatory Analysis of the TerraNova
19
Table 2 Standardized Parameter Estimates for the Two and Three Factor Models, Sixth Grade, Southwestern Sample Two Factor Model ____________________________________________________________________________ Reading/Language Mathematics
Subtest Pattern rs Pattern rs SMCa Unique
Reading .857 .857 0 .765 .734 .266 Vocabulary .831 .831 0 .741 .690 .310 Language .850 .850 0 .759 .723 .277 Language Mechanics .762 .762 0 .680 .581 .419 Mathematics 0 .803 .899 .899 .809 .191 Math Computation 0 .673 .755 .755 .569 .431 Factor Correlation: Reading/Language .893 _____________________________________________________________________________ Three Factor Model _____________________________________________________________________________ Reading Language Mathematics
Subtest Pattern rs Pattern rs Pattern rs SMCa Unique Reading .871 .871 0 .851 0 .753 .758 .242 Vocabulary .843 .843 0 .823 0 .728 .710 .290 Language 0 .825 .844 .844 0 .777 .713 .287 Language Mechanics 0 .749 .767 .767 0 .706 .588 .412 Mathematics 0 .773 0 .823 .894 .894 .800 .200 Math Computation 0 .656 0 .698 .759 .759 .576 .424 Factor Correlations: Reading .977 .864 Language .920 _______________________________________________________________________________
Confirmatory Analysis of the TerraNova
20
a SMC = Squared Multiple Correlation, a lower-bound estimate of subtest score reliability.

Confirmatory Analysis of the TerraNova
21
Table 3 Comparisons of the Calibration and Cross-validation Samples Using the Two and Three Factor Models Two Factor Model Three Factor Model _______________________________________________________________________________________________________________ Comparison χ2 df χ2
∆ df∆ CFI RMSEA TLI SRMR χ2 df χ2∆ df∆ CFI RMSEA TLI SRMR
_______________________________________________________________________________________________________________ Fourth Grade Samples I. Calibration: Southwestern Sample 387 8 – – .983 .065 .974 .024 343 6 – – .985 .066 .974 .021 II. Cross-validation: Standardization Sample A. Freely Estimated 632 16 – – .985 .059 .978 .024 586 12 – – .986 .066 .976 .021 B. Λ Fixed 739 20 107 4 .983 .057 .977 .029 700 15 114 3 .984 .065 .975 .027 C. Λ, Φ Fixed 929 23 190 3 .978 .060 .974 .033 914 18 214 3 .979 .063 .973 .032 D. All Parameters Fixed 1444 29 516 6 .966 .067 .965 .037 1422 24 508 6 .966 .069 .964 .035 Sixth Grade Samples I. Calibration: Southwestern Sample 498 8 – – .980 .076 .970 .028 402 6 – – .984 .074 .971 .024 II. Cross-validation: Standardization Sample A. Freely Estimated 1032 16 – – .977 .078 .965 .028 892 12 – – .980 .083 .965 .024 B. Λ Fixed 1100 20 68 4 .975 .071 .968 .029 946 15 54 3 .979 .077 .967 .025 C. Λ, Φ Fixed 1175 23 74 3 .974 .069 .968 .031 1052 18 106 3 .976 .068 .970 .027 D. All Parameters Fixed 1307 29 133 6 .971 .065 .970 .032 1180 24 128 6 .974 .064 .972 .028 Eighth Grade Samples I. Calibration: Southwestern Sample 387 8 – – .984 .068 .977 .022 194 6 – – .992 .051 .987 .016 II. Cross-validation: Standardization Sample A. Freely Estimated 703 16 – – .984 .064 .977 .022 463 12 – – .990 .060 .982 .016 B. Λ Fixed 721 20 18 4 .984 .057 .979 .023 482 15 19 3 .990 .054 .984 .016 C. Λ, Φ Fixed 806 23 85 3 .982 .057 .979 .029 596 18 114 3 .987 .051 .984 .024 D. All Parameters Fixed 1070 29 265 6 .976 .058 .976 .027 855 24 259 6 .981 .054 .980 .023 _______________________________________________________________________________________________________________
Note. All χ2∆ values were statistically significant at p < .001.


