Conference on Thailand-Mexico and Southeast Asia-Latin ...
58
INTEGRATION PROCESSES OF THAILAND WITH ASEAN ECONOMIC COMMUNITY AND LATIN AMERICA Bhanupong Nidhiprabha Faculty of Economics Thammasat University [email protected] Conference on Thailand-Mexico and Southeast Asia-Latin American Relations University of Colima September 23, 2011
Transcript of Conference on Thailand-Mexico and Southeast Asia-Latin ...
INTEGRATION PROCESSES OF THAILAND WITH ASEAN ECONOMIC COMMUNITY AND LATIN AMERICA Bhanupong Nidhiprabha
Faculty of Economics Thammasat University [email protected]
Conference on Thailand-Mexico and Southeast Asia-Latin American Relations University of Colima September 23, 2011
Main themes
Globalization
Free trade agreements
Trade and geography
Thailand’s direction of trade
Shocks and transmission mechanism
Asian Economic Community
Fiscal and monetary spaces
2
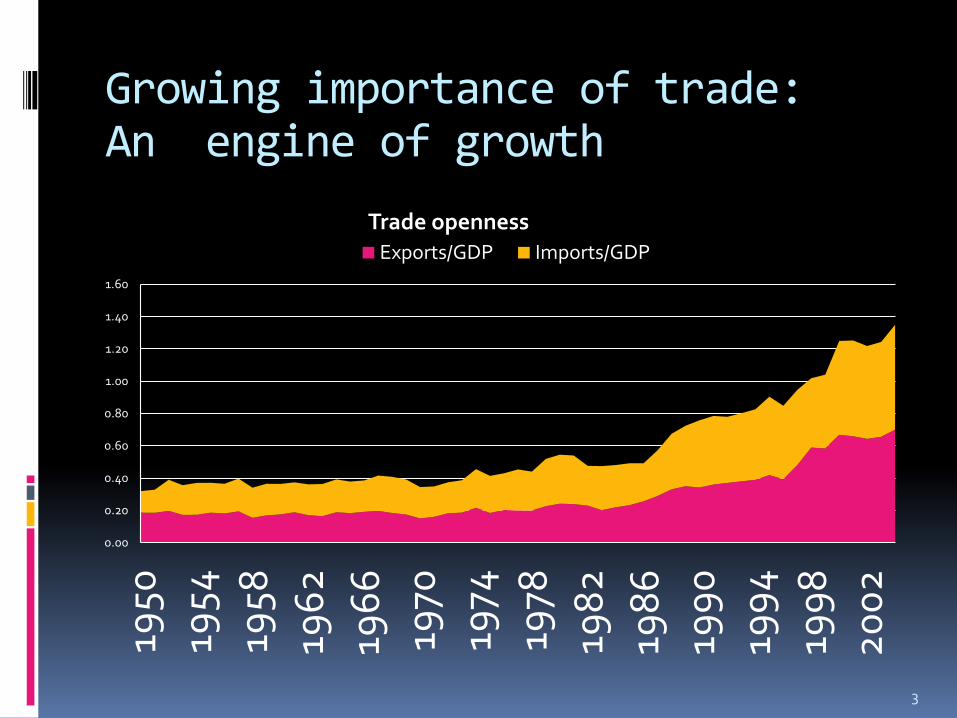
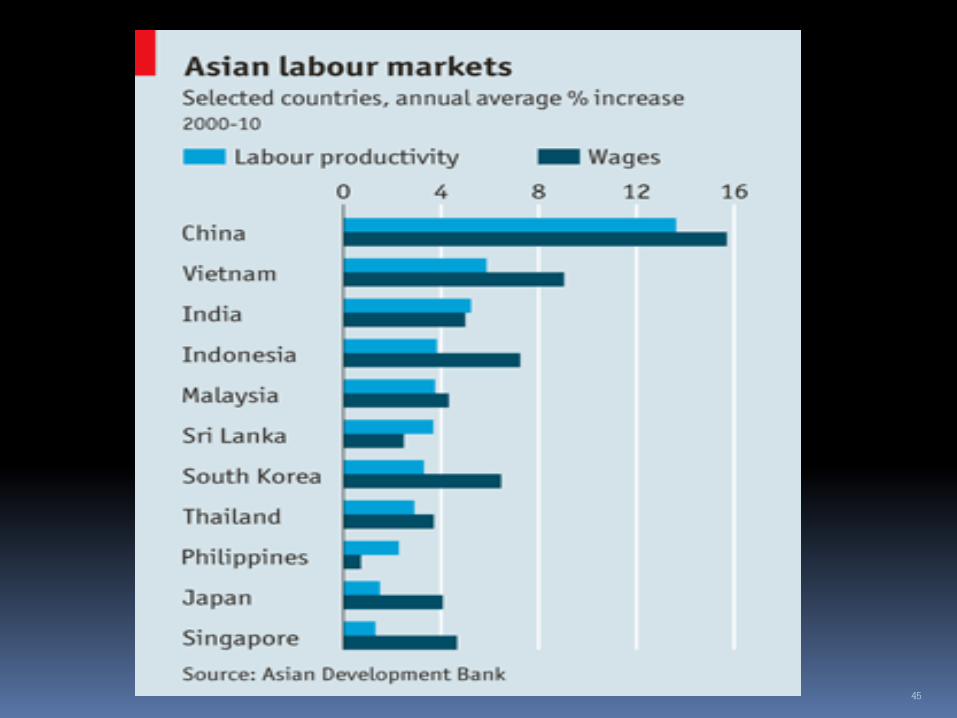
Growing importance of trade: An engine of growth
0.00
0.20
0.40
0.60
0.80
1.00
1.20
1.40
1.60
1950
1954
1958
196
2
196
6
1970
1974
1978
198
2
198
6
199
0
199
4
199
8
20
02
Trade openness Exports/GDP Imports/GDP
3
4
0
0.2
0.4
0.6
0.8
1
1.2
1.4
19
79
19
80
19
81
19
82
19
83
19
84
19
85
19
86
19
87
19
88
19
89
19
90
19
91
19
92
19
93
19
94
19
95
19
96
19
97
19
98
19
99
20
00
20
01
20
02
20
03
20
04
20
05
20
06
20
07
20
08
20
09
p
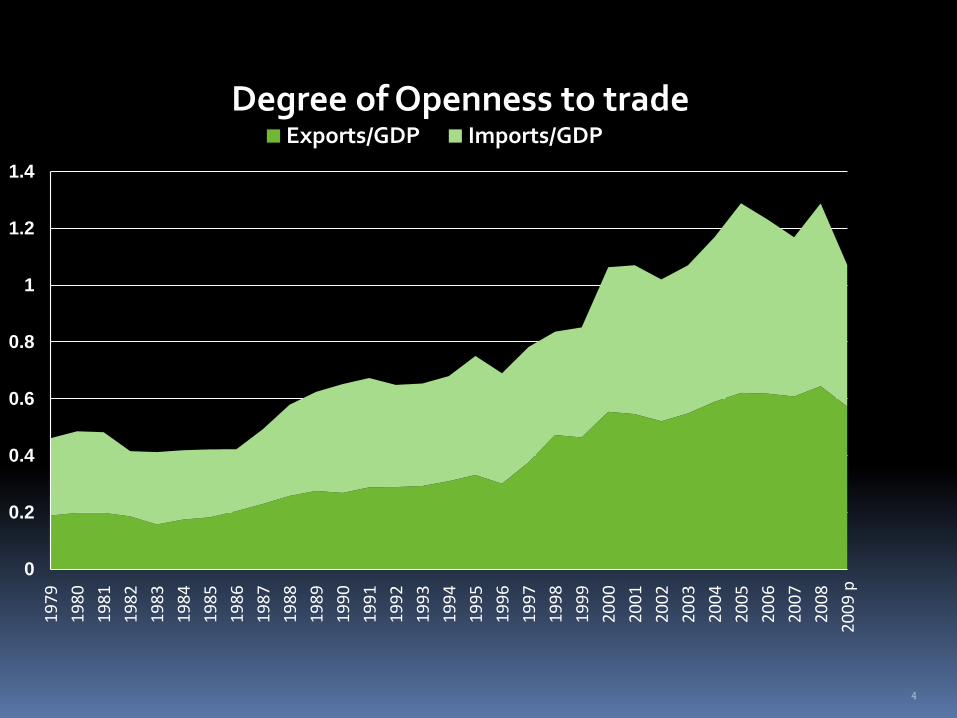
Degree of Openness to trade Exports/GDP Imports/GDP
5
Jan
-06
Feb
-06
Mar
-06
Ap
r-0
6
May
-06
Jun
-06
Jul-
06
Au
g-0
6
Sep
-06
Oct
-06
No
v-0
6
Dec
-06
Jan
-07
Feb
-07
Mar
-07
Ap
r-0
7
May
-07
Jun
-07
Jul-
07
Au
g-0
7
Sep
-07
Oct
-07
No
v-0
7
Dec
-07
Jan
-08
Feb
-08
Mar
-08
Ap
r-0
8
May
-08
Jun
-08
Jul-
08
Au
g-0
8
Sep
-08
Oct
-08
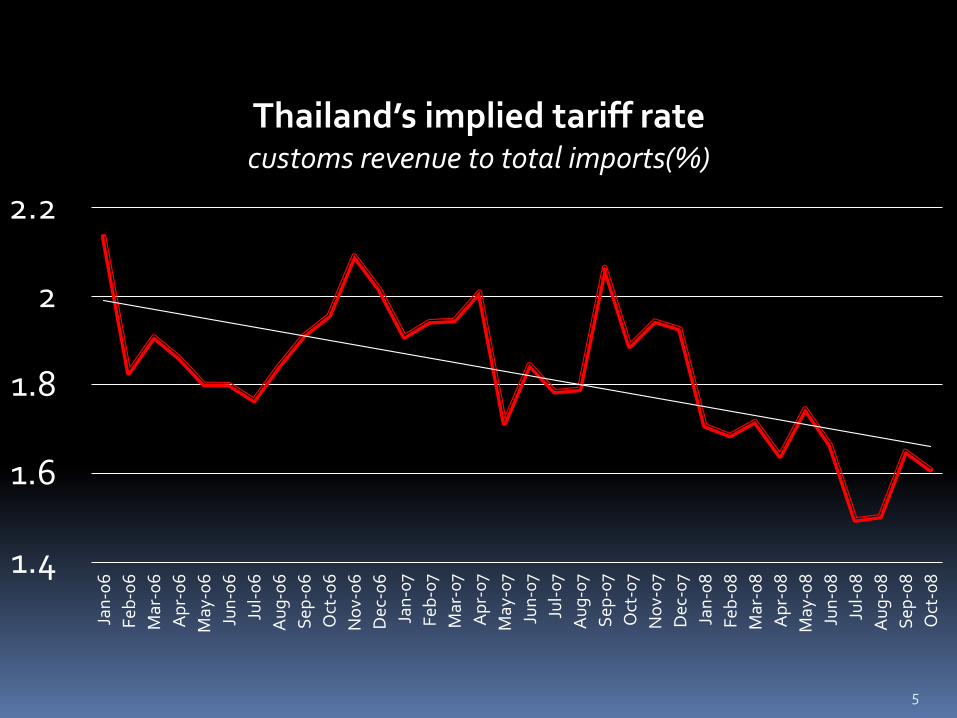
1.4
1.6
1.8
2
2.2
Thailand’s implied tariff rate customs revenue to total imports(%)
6
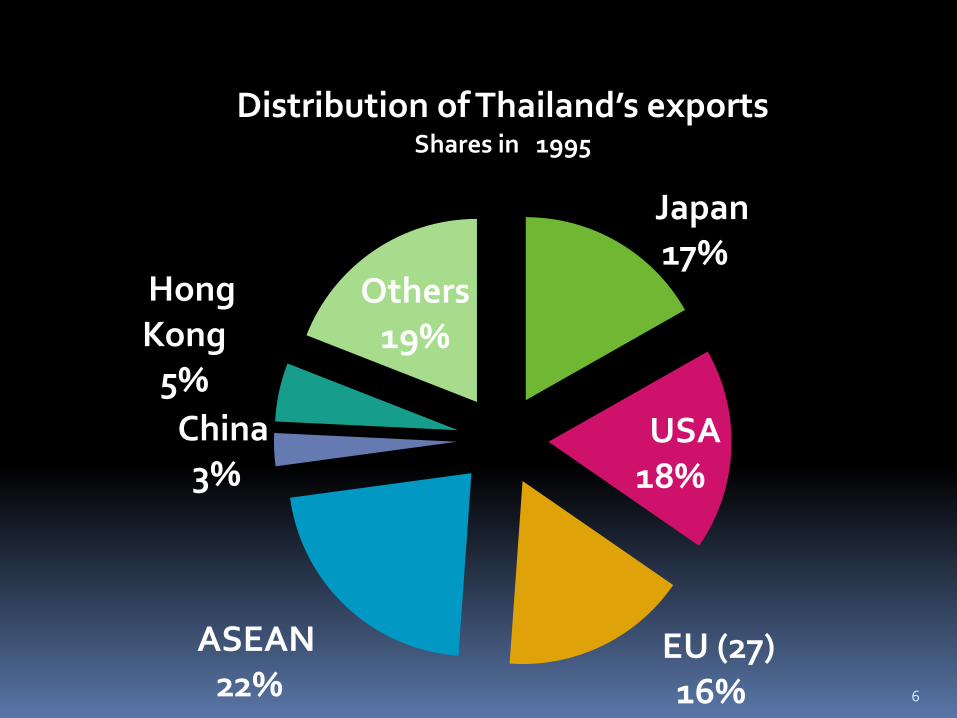
Japan 17%
USA 18%
EU (27) 16%
ASEAN 22%
China 3%
Hong Kong
5%
Others 19%
Distribution of Thailand’s exports Shares in 1995
7
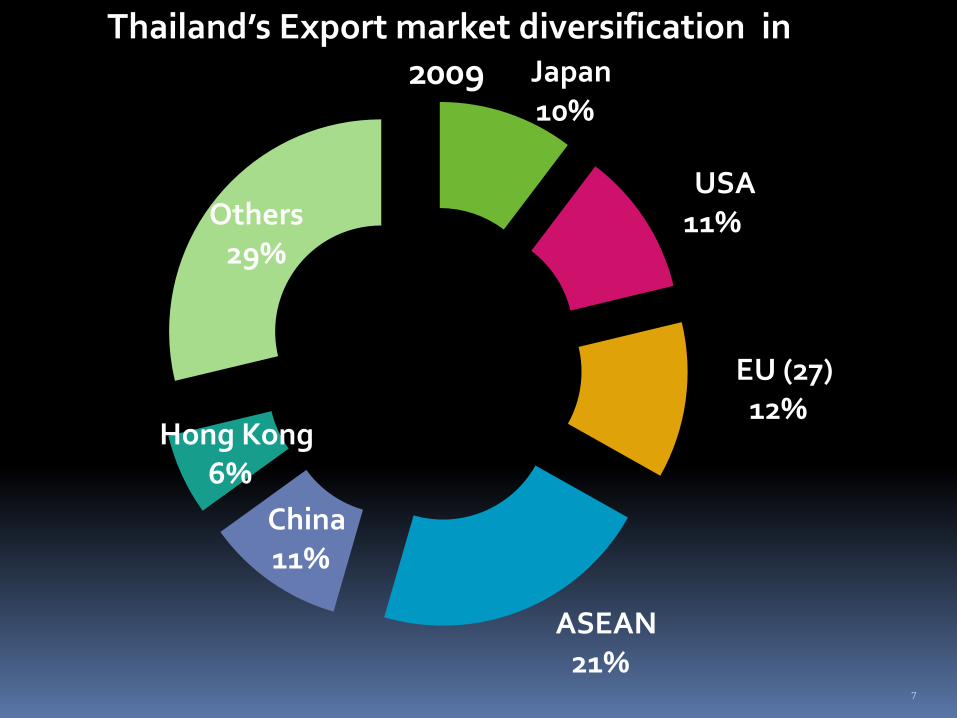
Japan 10%
USA 11%
EU (27) 12%
ASEAN 21%
China 11%
Hong Kong 6%
Others 29%
Thailand’s Export market diversification in 2009
ASEAN Countries
Small countries in South East Asia can avoid the limitation of their domestic market by exploiting the economies of scale from the ASEAN’s 550 million population with a GDP of 1.4 trillion USD
8
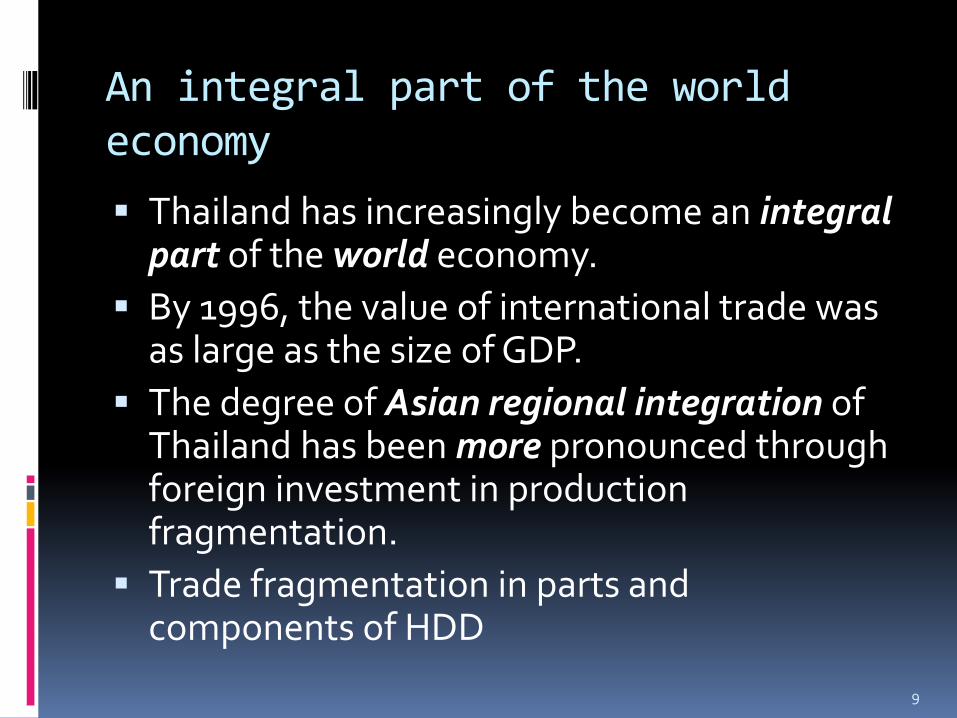
An integral part of the world economy
Thailand has increasingly become an integral part of the world economy.
By 1996, the value of international trade was as large as the size of GDP.
The degree of Asian regional integration of Thailand has been more pronounced through foreign investment in production fragmentation.
Trade fragmentation in parts and components of HDD
9
10
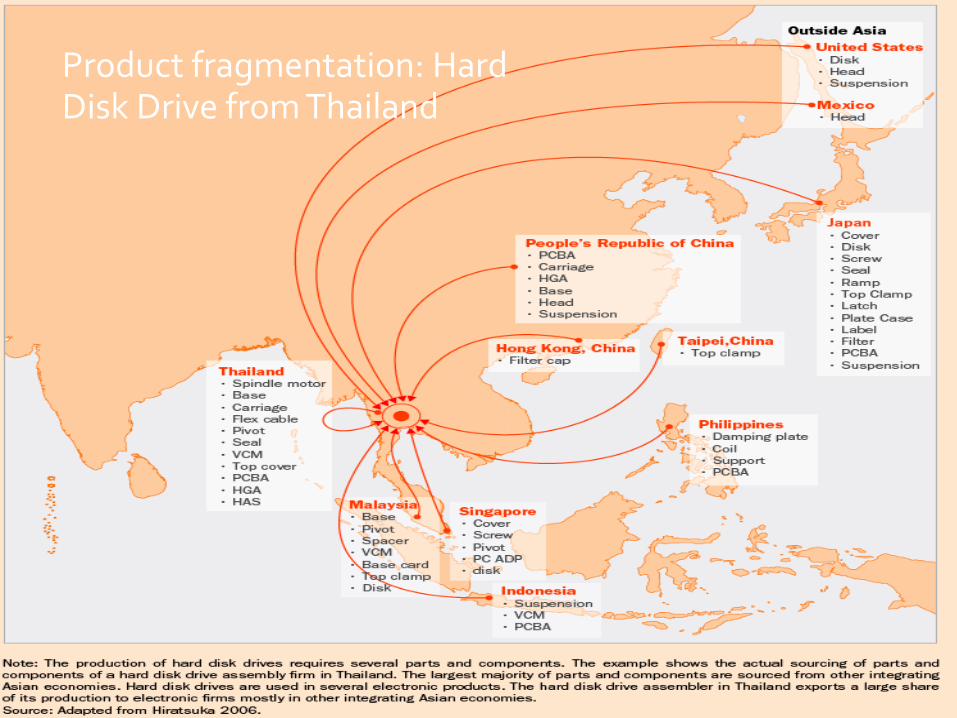
Product fragmentation: Hard Disk Drive from Thailand
11
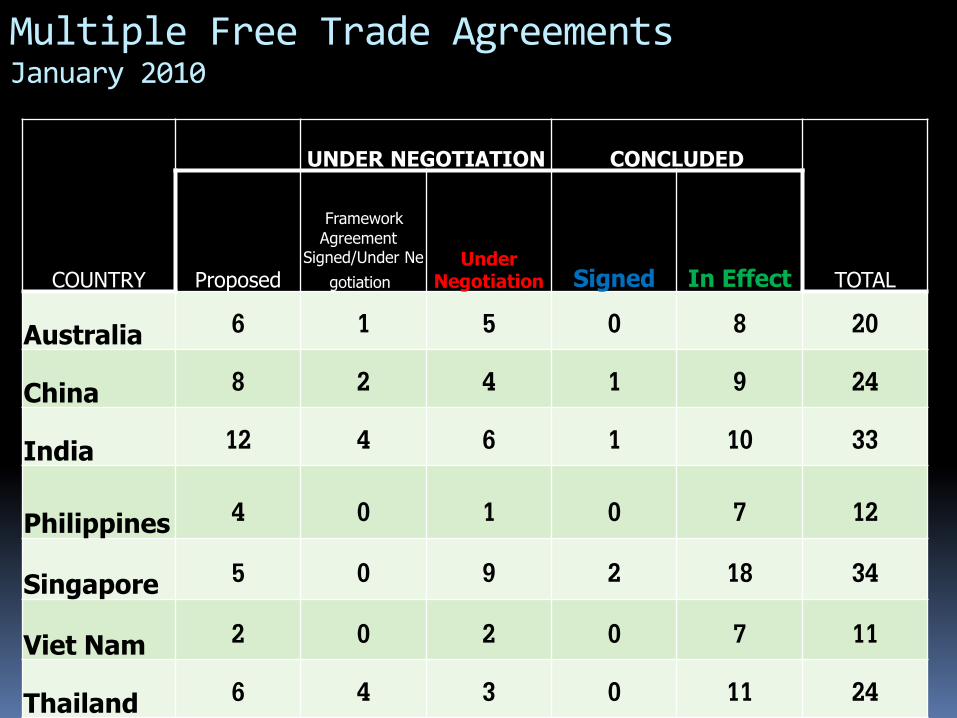
Multiple Free Trade Agreements January 2010
COUNTRY
UNDER NEGOTIATION CONCLUDED
TOTAL Proposed
Framework
Agreement Signed/Under Ne
gotiation Under
Negotiation Signed In Effect
Australia 6 1 5 0 8 20
China 8 2 4 1 9 24
India 12 4 6 1 10 33
Philippines 4 0 1 0 7 12
Singapore 5 0 9 2 18 34
Viet Nam 2 0 2 0 7 11
Thailand 6 4 3 0 11 24
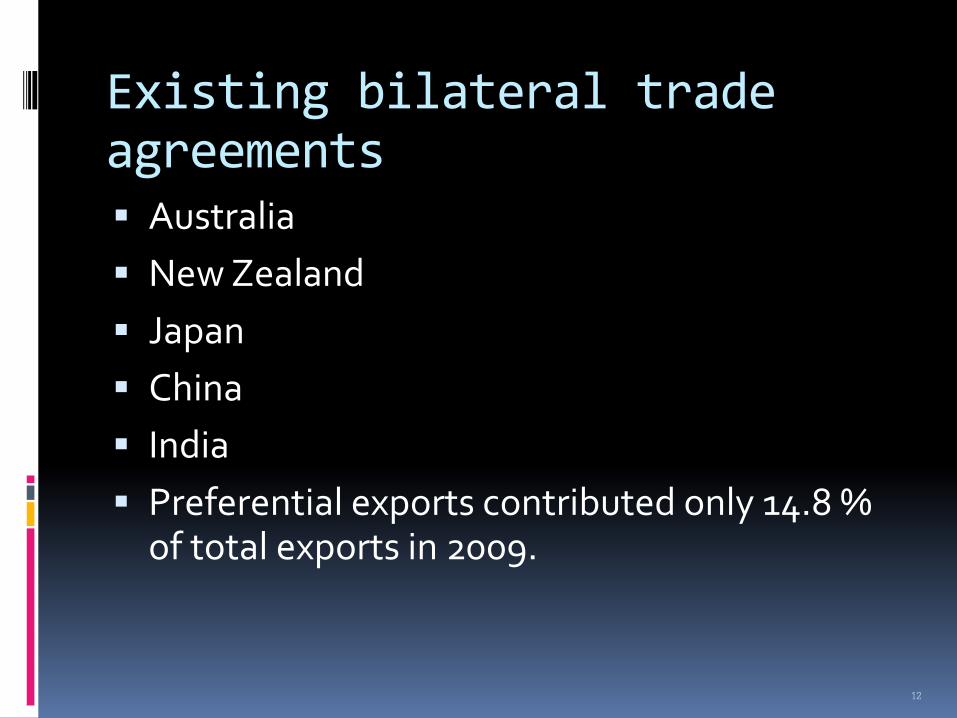
Existing bilateral trade agreements
Australia
New Zealand
Japan
China
India
Preferential exports contributed only 14.8 % of total exports in 2009.
12
ROO and NTBs
Rules of origin must be simplified to facilitate administration procedure without causing trade diversion or act as a hidden instrument to protect domestic industry.
If Thailand continues to reduce MFN tariff rates, the cost associated with the rules of origin can also be reduced.
The spaghetti bowl effect has been exaggerated.
Non-tariff barriers such as Sanitary and Phytosanitary (SPS) conditions must be agreed upon to make sure that they are not substitutes for the tariff reductions.
13
Political economy and leaders’ willpower
The comparative disadvantage sectors would strongly oppose FTAs, fearing that they would not be able to compete and would soon be wiped out.
Political economy plays an important part in deciding the direction of the FTAs.
Political will is a crucial factor in determining the speed and the coverage of the regional integration.
14
To forge ahead with integration There are trade-offs between benefits and
adverse consequences of new regionalism.
As long as the net benefits of expansion along the line of globalization exist, we should cautiously go ahead with multiple FTAs.
We should not let short-term micro adverse impacts obscure the long-term macro dynamic gains from rapid integrating into the world economy.
15
New Regionalism: Multiple FTAs
Thailand’s rush to negotiate FTAs with many countries, including USA, Japan, Australia, New Zealand, Bahrain, India, China, Chile, and Peru, can be described as new regionalism.
Although Japan had already established FTAs with Singapore, Thailand was a more difficult case for Japan, since negotiations involved agriculture and labor issues.
Singapore had already removed most of her tariff barriers, while the two countries’ levels of per capita income do not differ much.
16
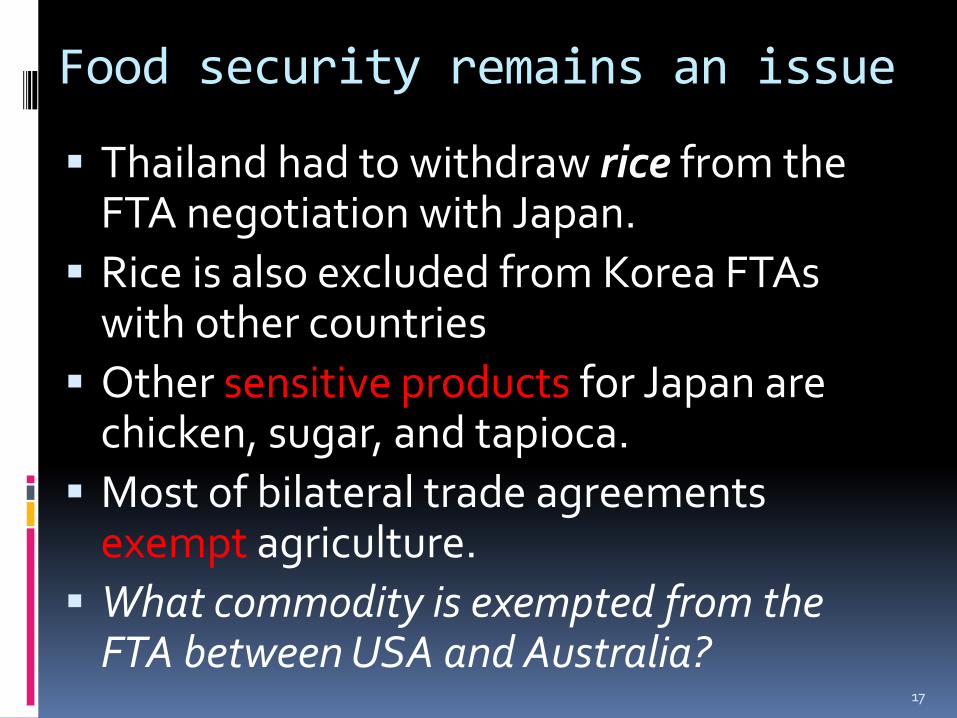
Food security remains an issue
Thailand had to withdraw rice from the FTA negotiation with Japan.
Rice is also excluded from Korea FTAs with other countries
Other sensitive products for Japan are chicken, sugar, and tapioca.
Most of bilateral trade agreements exempt agriculture.
What commodity is exempted from the FTA between USA and Australia?
17
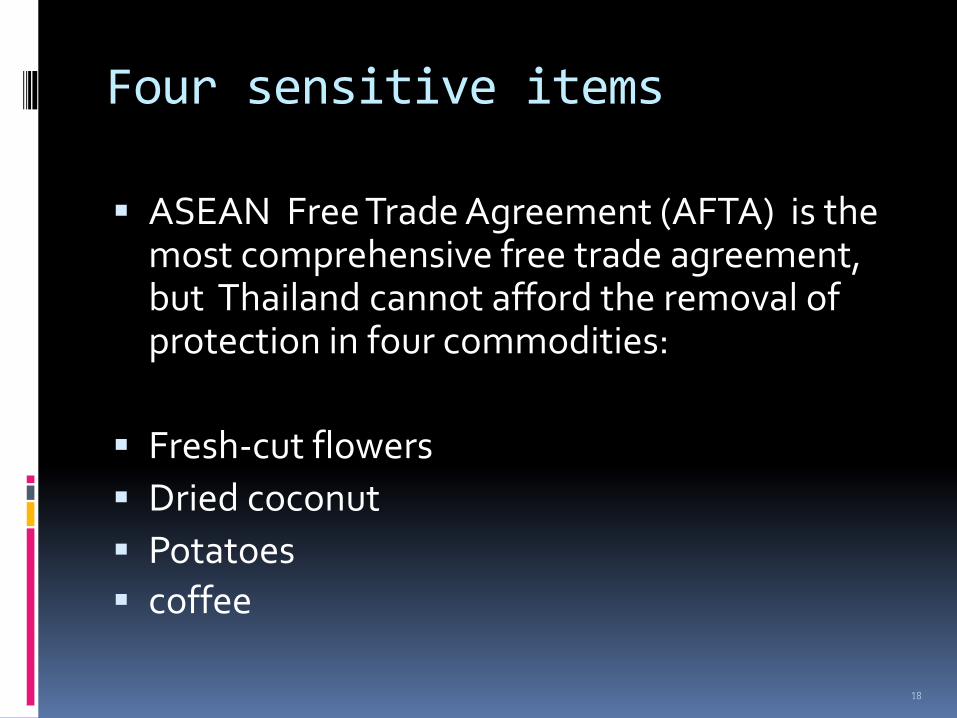
Four sensitive items
ASEAN Free Trade Agreement (AFTA) is the most comprehensive free trade agreement, but Thailand cannot afford the removal of protection in four commodities:
Fresh-cut flowers
Dried coconut
Potatoes
coffee
18
Aspects of economic integration
Free flows of trade
Free flows of services
Mobility in skilled labor
Free flows of capital
Free flows of investment
19
ASEAN Economic Community
Trade liberalization under the AEC builds upon achievements over the past decades which began with trade integration under the ASEAN Free Trade Area (AFTA), signed in 1992.
Under AFTA, a substantial reduction of tariffs has already been achieved.
As of January 2010, ASEAN-6 applied zero tariffs to 99 percent of goods, while the CLMV countries plan to achieve the same goal by 2015.
20
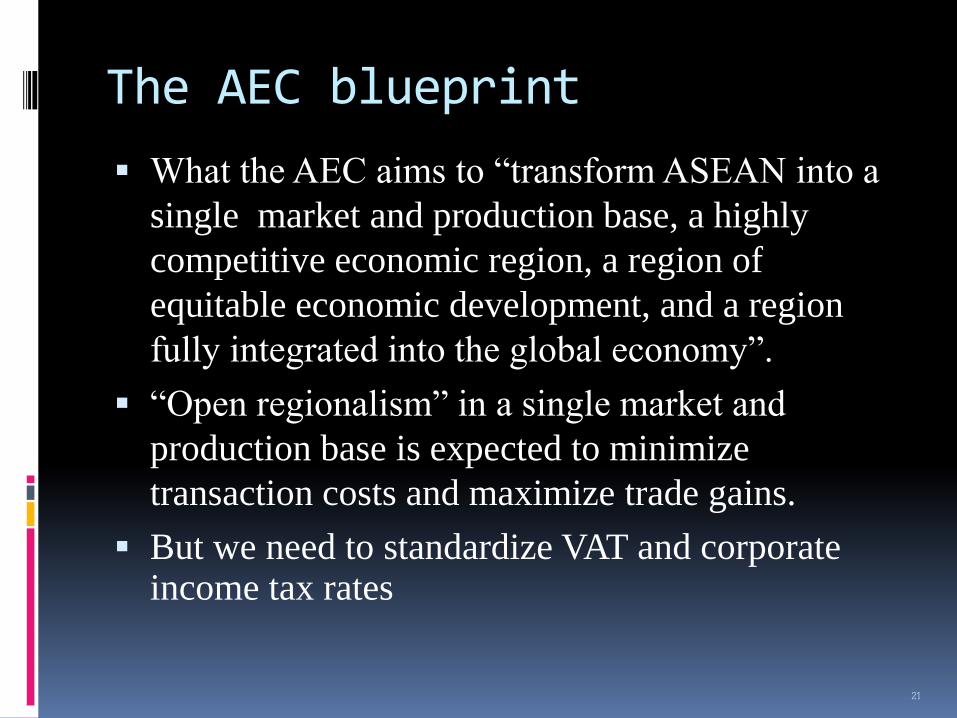
The AEC blueprint
What the AEC aims to “transform ASEAN into a
single market and production base, a highly
competitive economic region, a region of
equitable economic development, and a region
fully integrated into the global economy”.
“Open regionalism” in a single market and
production base is expected to minimize
transaction costs and maximize trade gains.
But we need to standardize VAT and corporate income tax rates
21
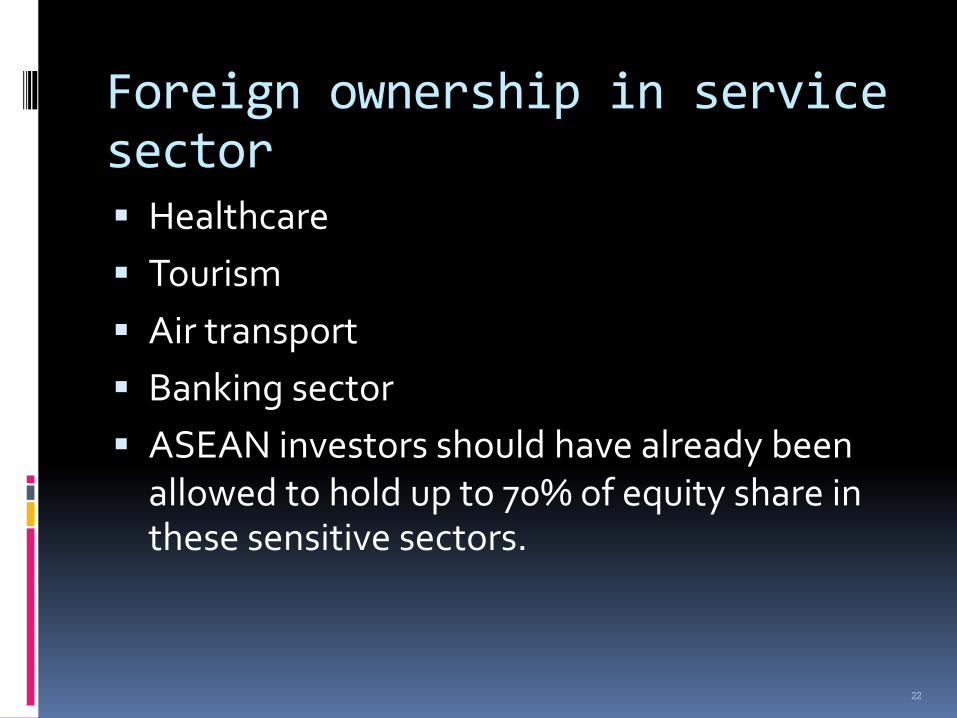
Foreign ownership in service sector
Healthcare
Tourism
Air transport
Banking sector
ASEAN investors should have already been allowed to hold up to 70% of equity share in these sensitive sectors.
22
23
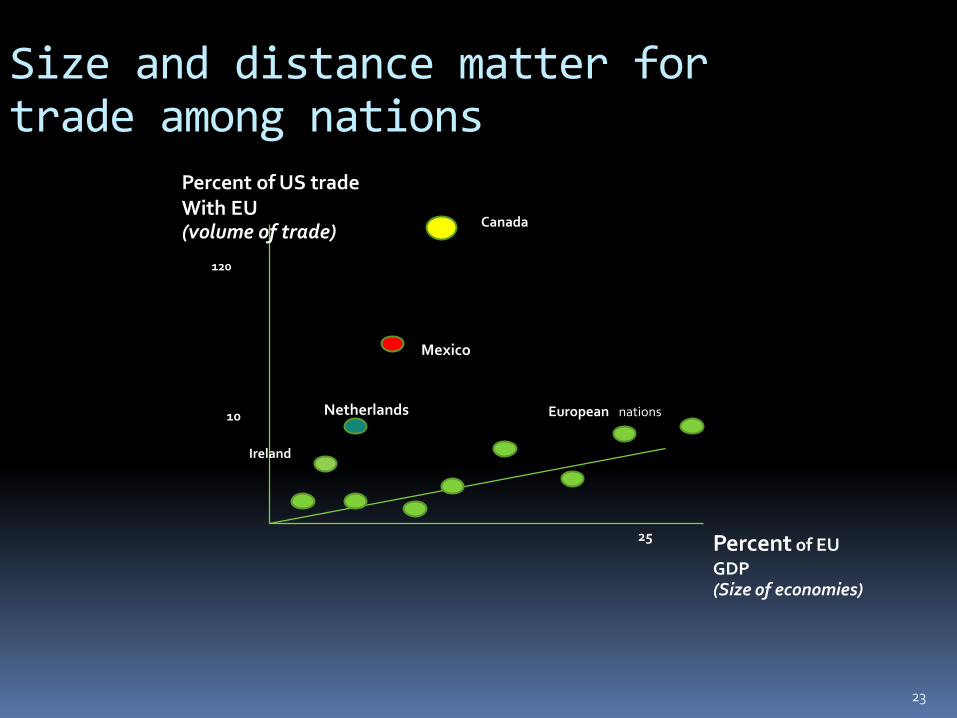
Size and distance matter for trade among nations
Percent of EU
GDP (Size of economies)
Percent of US trade With EU (volume of trade)
European nations
Canada
Mexico
Netherlands
Ireland
10
120
25
24
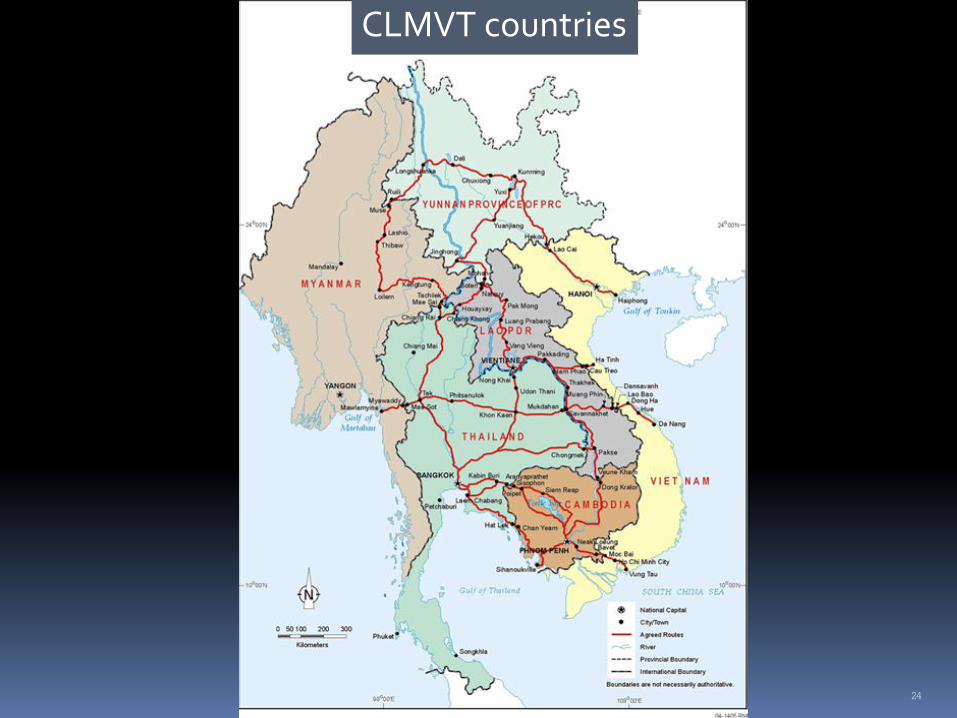
CLMVT countries
25
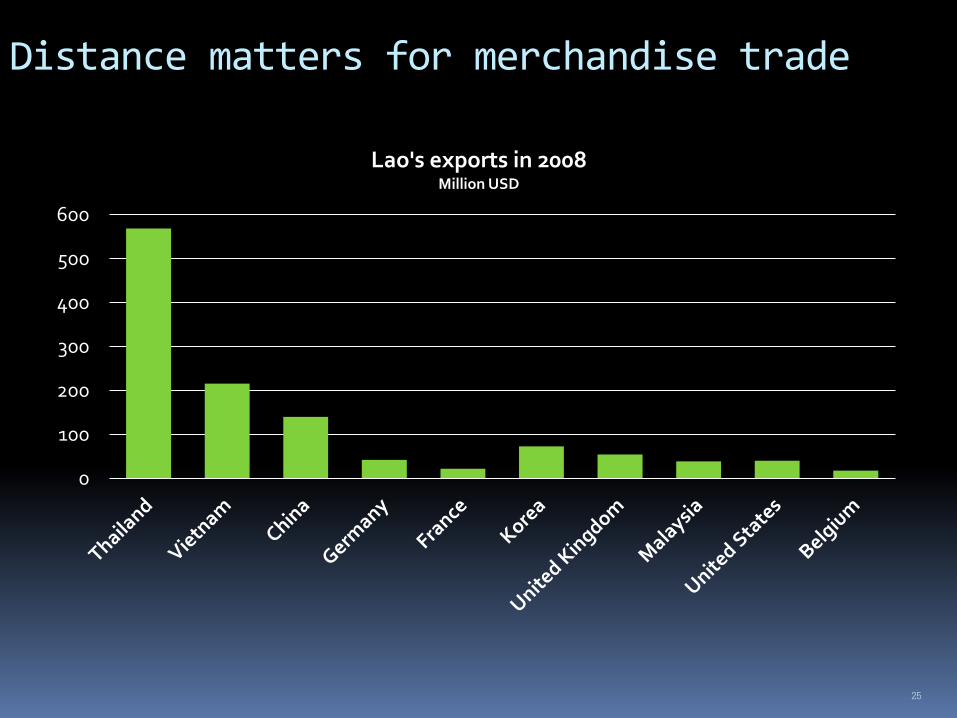
Distance matters for merchandise trade
0
100
200
300
400
500
600
Lao's exports in 2008 Million USD
Public investment in cross boarder transportation promote intra-regional trade
Transportation costs play a crucial role in shaping international and interregional trade. (Distance matters)
The interaction of market size with increasing returns plays an important role in determining the location of production.
Home market effect is a major explanation of trade through differences in population density and localized specialization.
A cumulative process in which large markets (ASEAN single market) attract production leads to agglomeration.
26
27
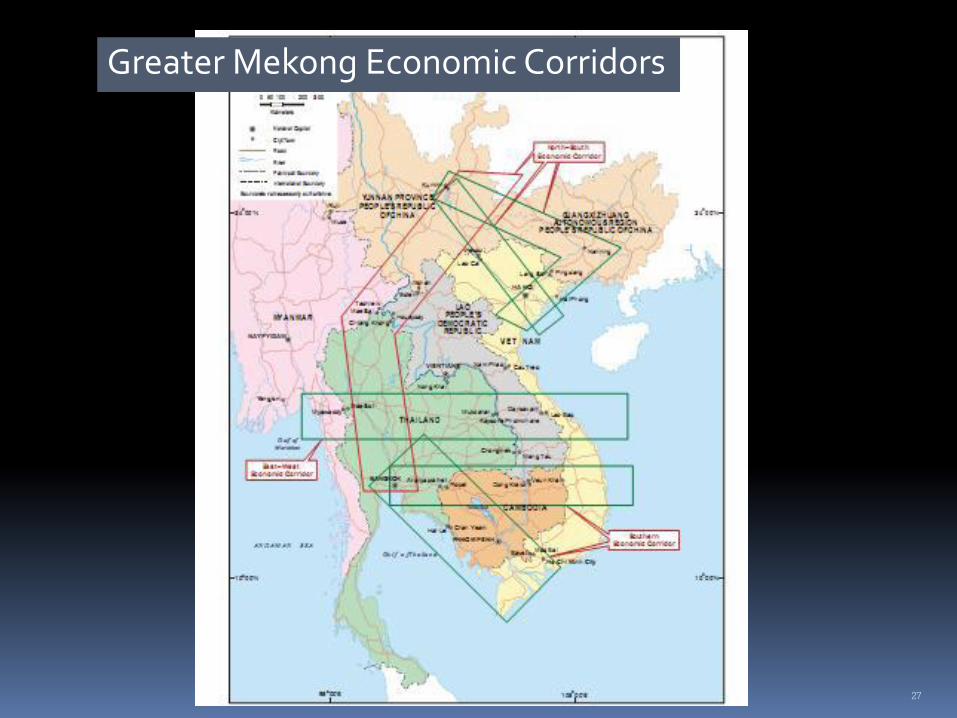
Greater Mekong Economic Corridors
But there is adverse impact of globalization
Exposure to external shocks
Export dependency
Increase business synchronization
Destroy traditional (uncompetitive) sectors
28
29
-20
-15
-10
-5
0
5
10
15
20
25
30
35
199
6
199
7
199
8
199
9
200
0
200
1
200
2
200
3
200
4
200
5
200
6
200
7
200
8
200
9
2010
pe
rce
nt
Export (%change) World Income (%change)
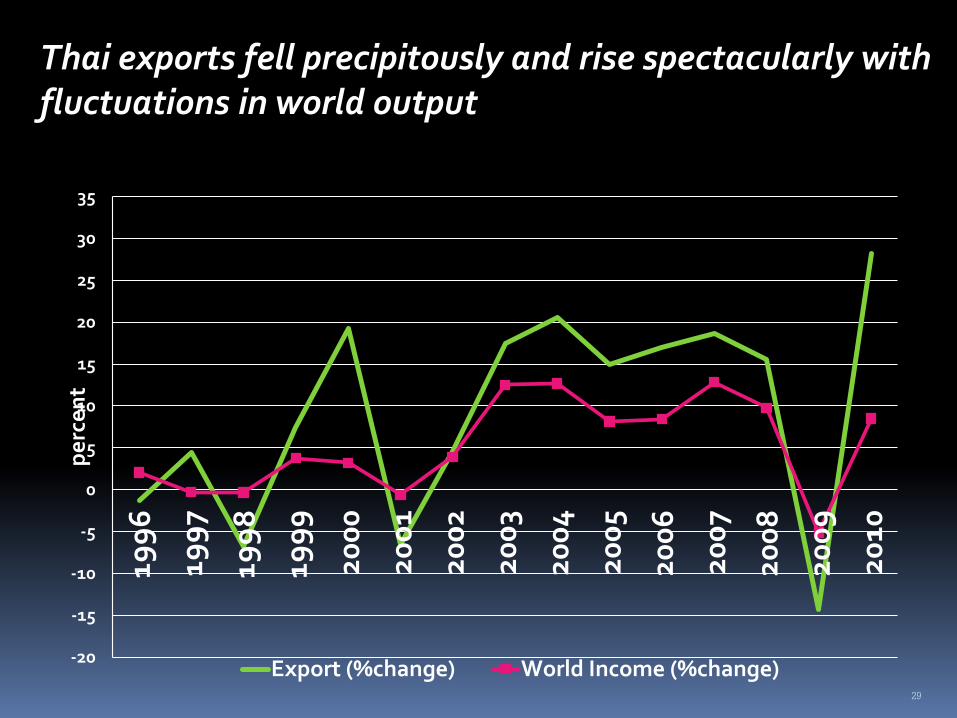
Thai exports fell precipitously and rise spectacularly with fluctuations in world output
Global recession is imminent
The IMF: Global growth will shrink to 4% in 2012, from 5% last year due to "major financial turbulence in the eurozone".
ASEAN needs a new growth pole
30
31
32
-15
-10
-5
0
5
10
15
20
199
3
199
4
199
5
199
6
199
7
199
8
199
9
200
0
200
1
200
2
200
3
200
4
200
5
200
6
200
7
200
8
200
9
2010
Ou
tpu
t g
row
th:
pe
rce
nt
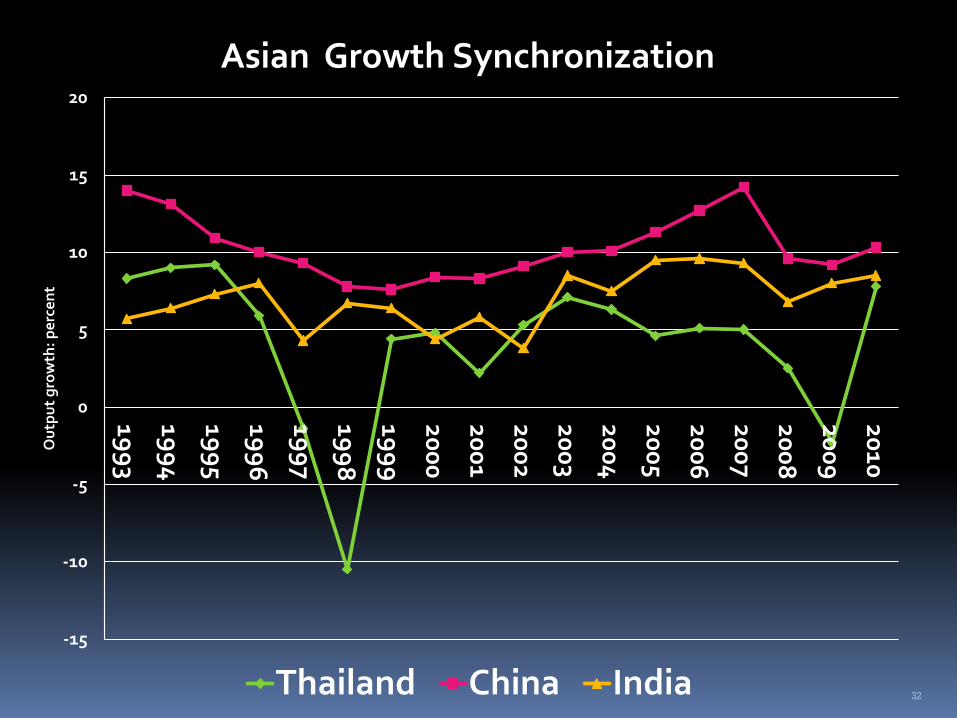
Asian Growth Synchronization
Thailand China India
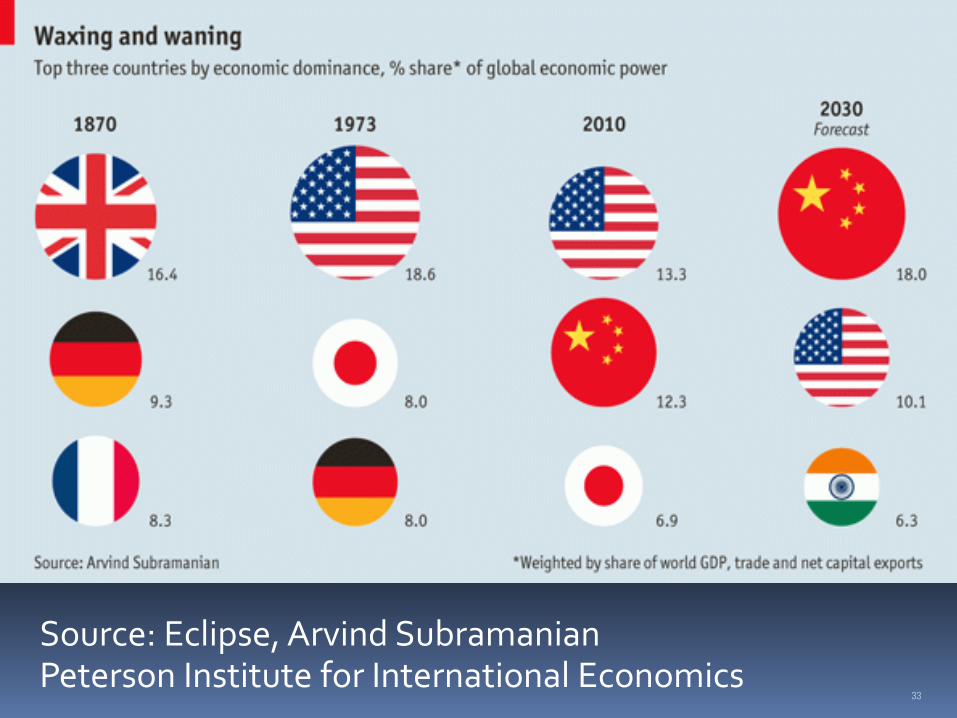
33
Source: Eclipse, Arvind Subramanian Peterson Institute for International Economics
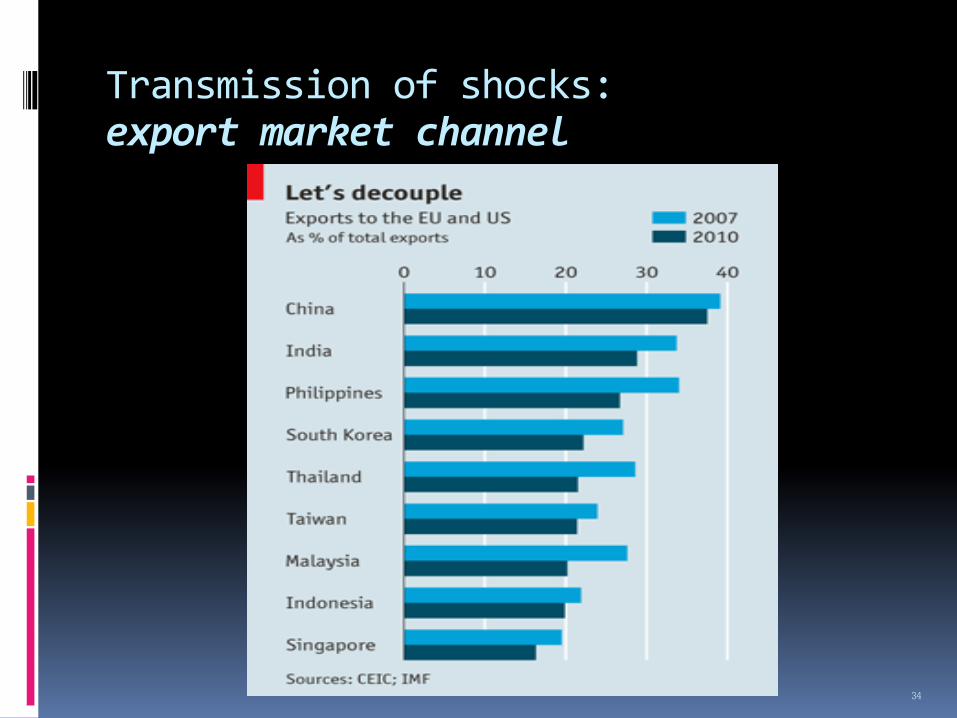
Transmission of shocks: export market channel
34
35
0
5000
10000
15000
20000
25000
199
3
199
5
199
7
199
9
20
01
20
03
20
05
20
07
20
09
mil
lion
US
D
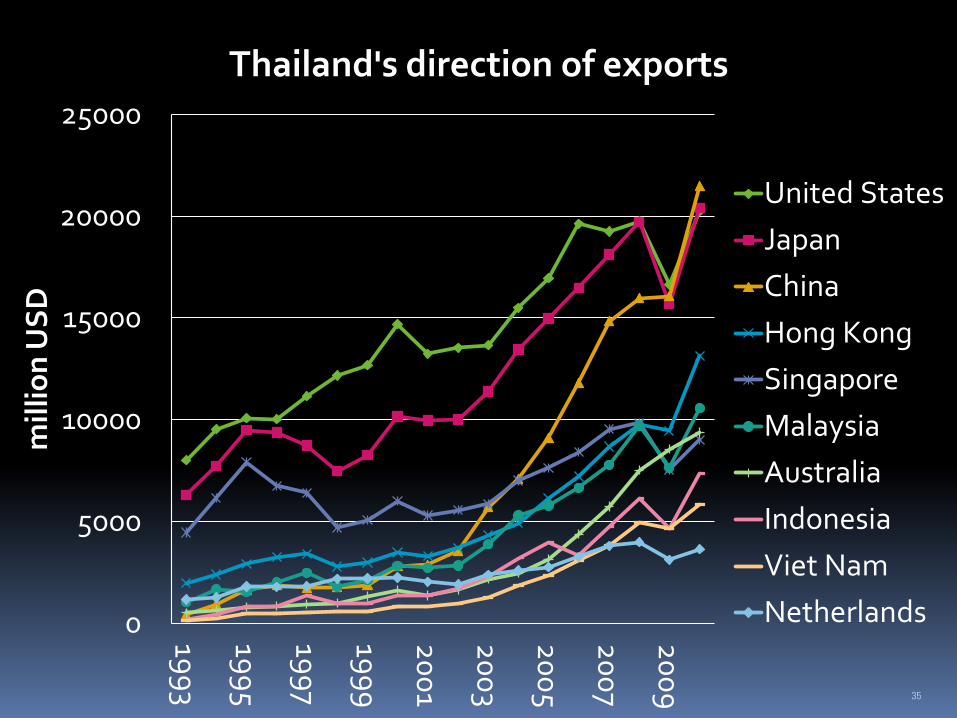
Thailand's direction of exports
United States
Japan
China
Hong Kong
Singapore
Malaysia
Australia
Indonesia
Viet Nam
Netherlands
36
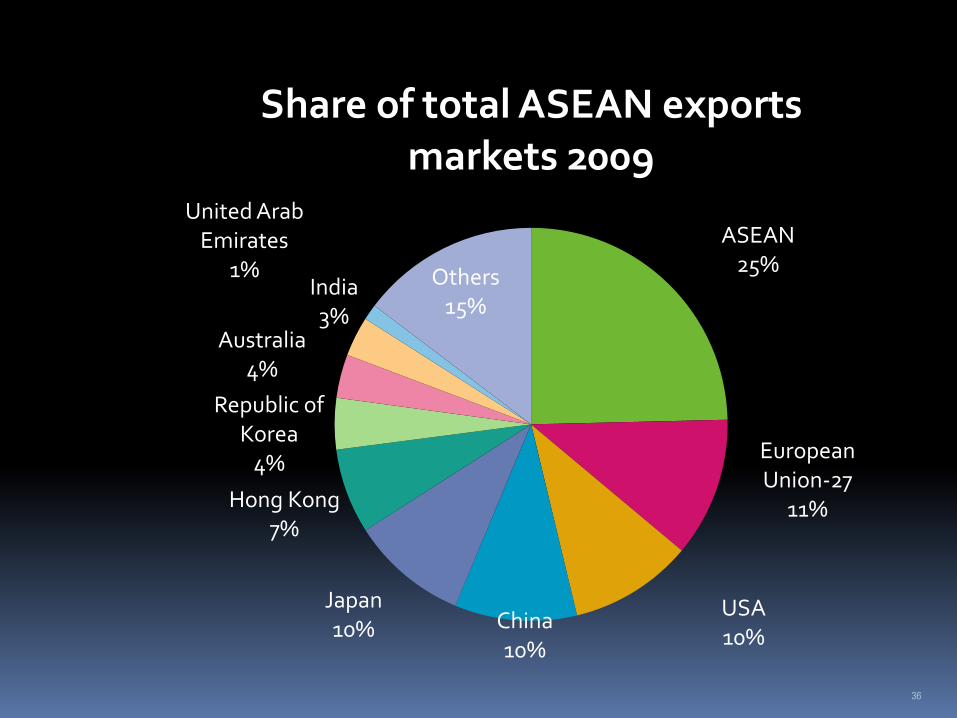
ASEAN 25%
European Union-27
11%
USA 10%
China 10%
Japan 10%
Hong Kong 7%
Republic of Korea
4%
Australia 4%
India 3%
United Arab Emirates
1% Others 15%
Share of total ASEAN exports markets 2009
37
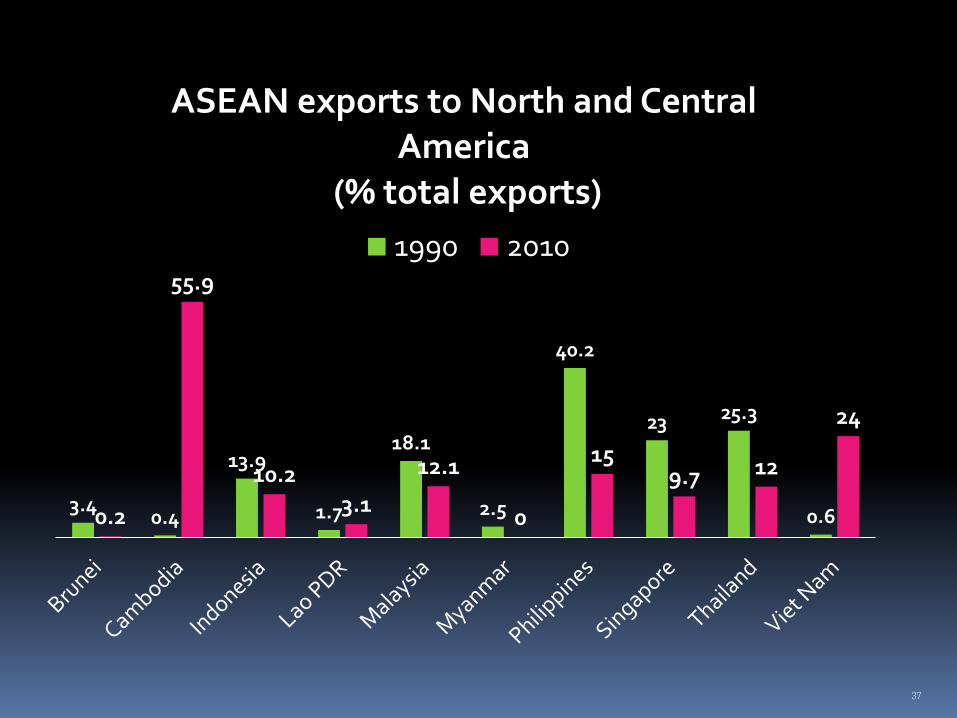
3.4 0.4
13.9
1.7
18.1
2.5
40.2
23 25.3
0.6 0.2
55.9
10.2 3.1
12.1
0
15 9.7 12
24
ASEAN exports to North and Central America
(% total exports)
1990 2010
38
0
5000
10000
15000
20000
25000
30000
35000
40000
45000
199
3
199
5
199
7
199
9
20
01
20
03
20
05
20
07
20
09
mill
ion
US
D
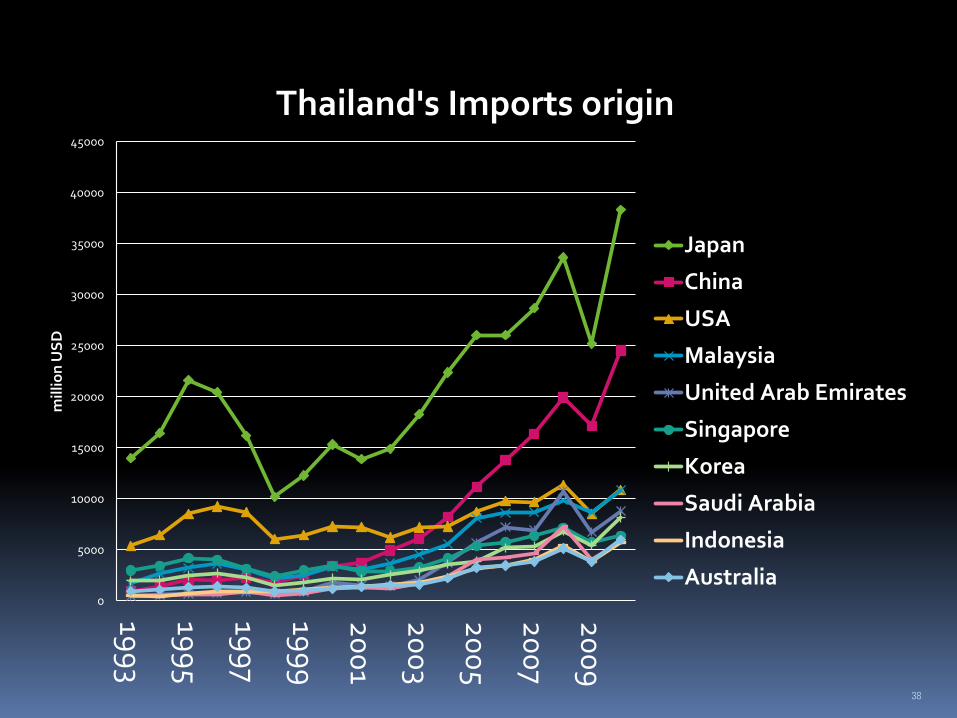
Thailand's Imports origin
Japan
China
USA
Malaysia
United Arab Emirates
Singapore
Korea
Saudi Arabia
Indonesia
Australia
39
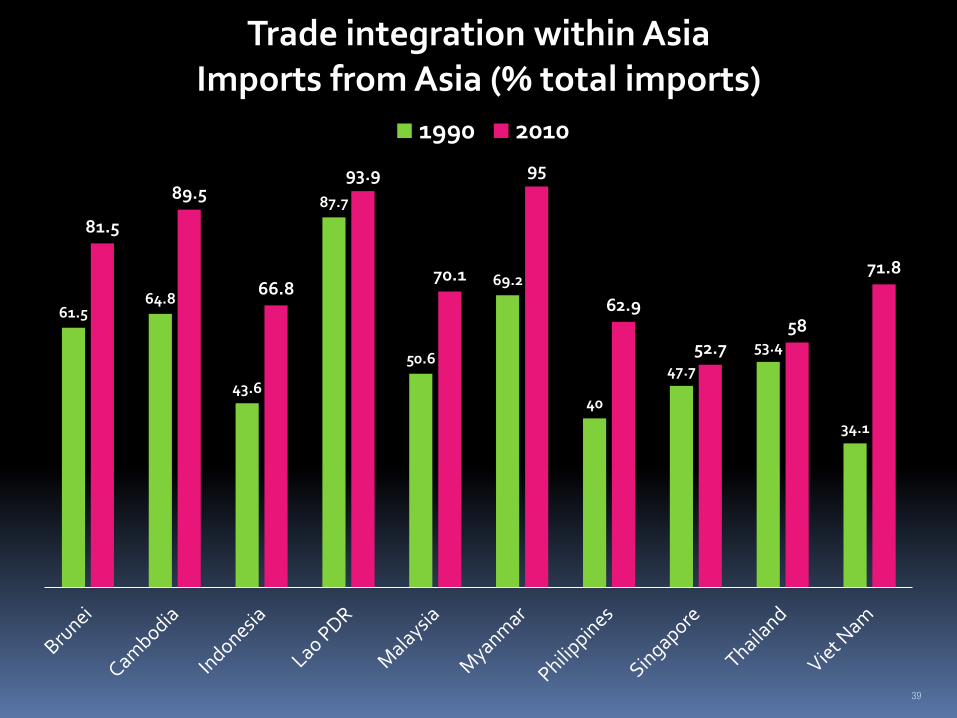
61.5 64.8
43.6
87.7
50.6
69.2
40
47.7
53.4
34.1
81.5
89.5
66.8
93.9
70.1
95
62.9
52.7 58
71.8
Trade integration within Asia Imports from Asia (% total imports)
1990 2010
40
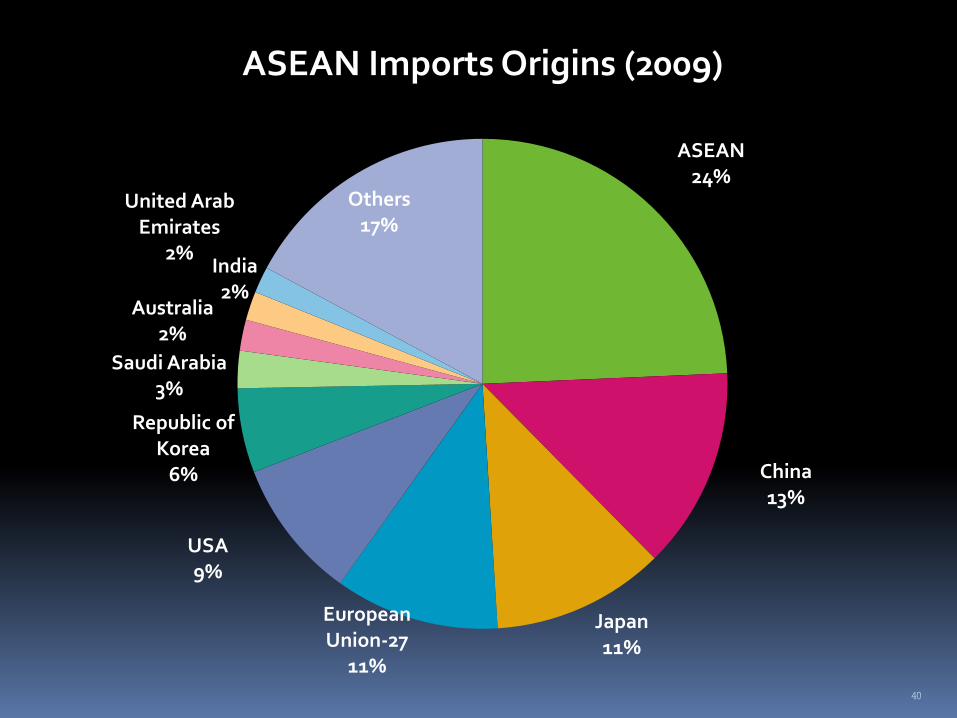
ASEAN 24%
China 13%
Japan 11%
European Union-27
11%
USA 9%
Republic of Korea
6%
Saudi Arabia 3%
Australia 2%
United Arab Emirates
2% India
2%
Others 17%
ASEAN Imports Origins (2009)
41
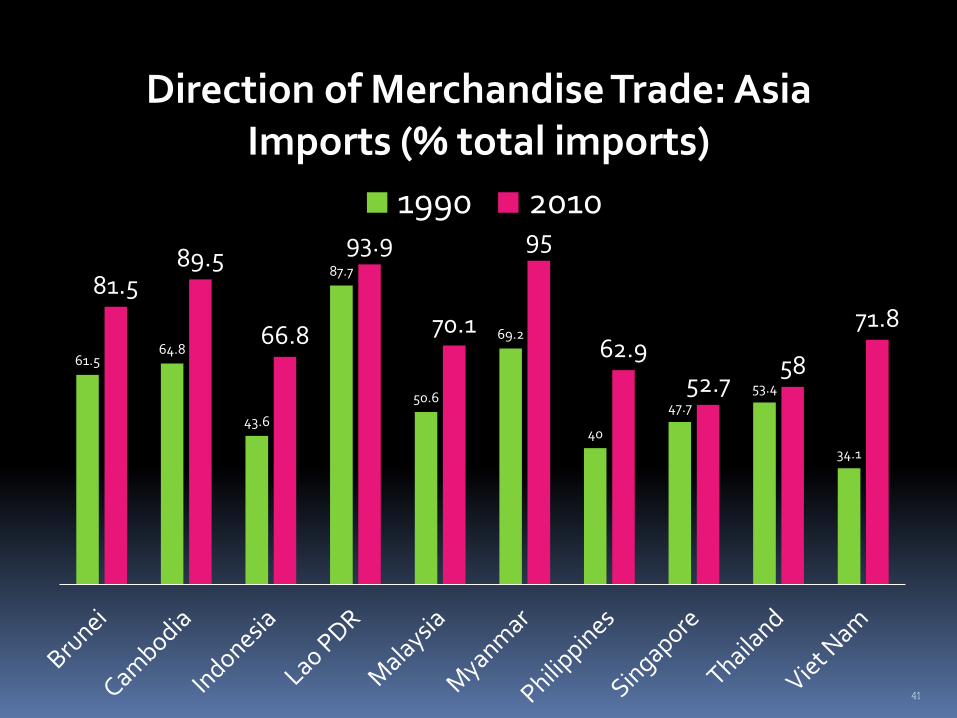
61.5 64.8
43.6
87.7
50.6
69.2
40
47.7
53.4
34.1
81.5 89.5
66.8
93.9
70.1
95
62.9
52.7 58
71.8
Direction of Merchandise Trade: Asia Imports (% total imports)
1990 2010
42
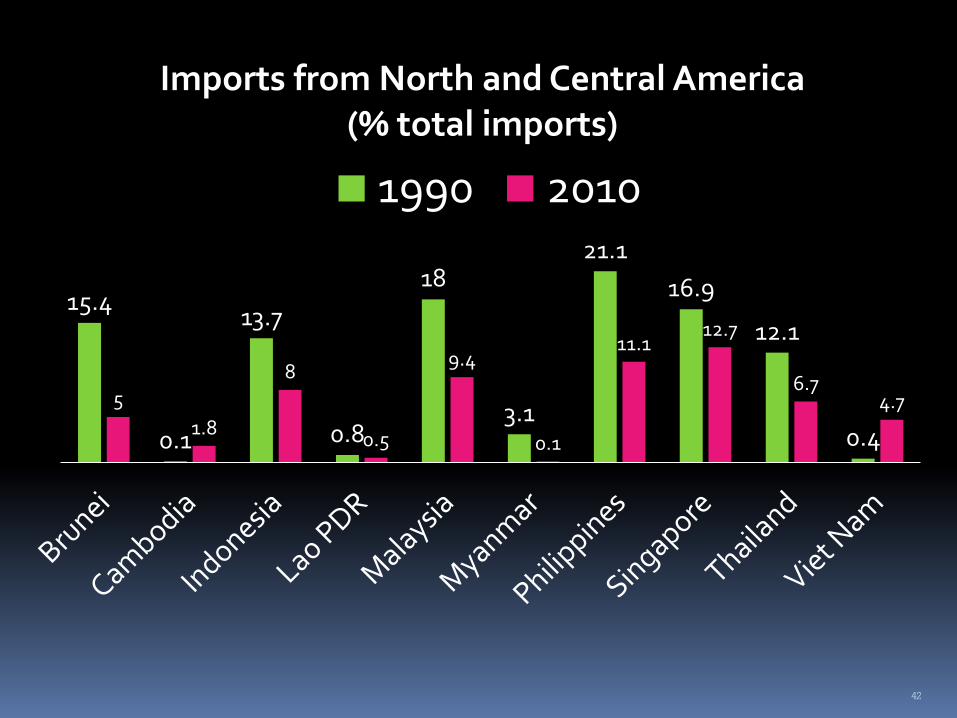
15.4
0.1
13.7
0.8
18
3.1
21.1
16.9
12.1
0.4
5
1.8
8
0.5
9.4
0.1
11.1 12.7
6.7 4.7
Imports from North and Central America (% total imports)
1990 2010
43
-15000
-10000
-5000
0
5000
10000
15000
20000
199
0
199
5
200
0
200
1
200
2
200
3
200
4
200
5
200
6
200
7
200
8
200
9m
illi
on
US
D
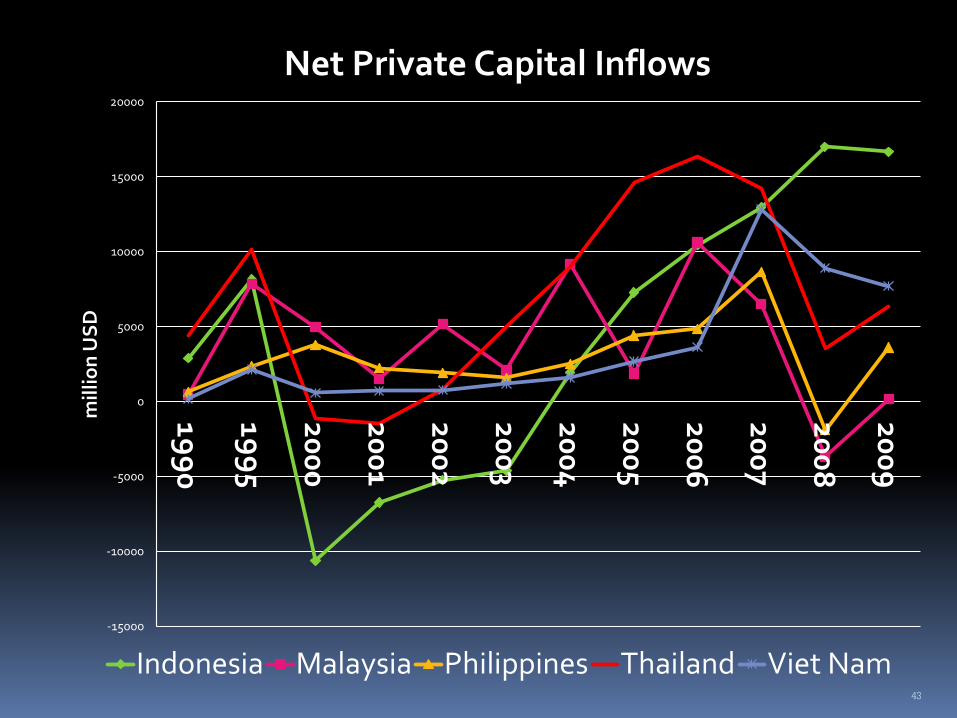
Net Private Capital Inflows
Indonesia Malaysia Philippines Thailand Viet Nam
Transmission of shocks: Capital market channel
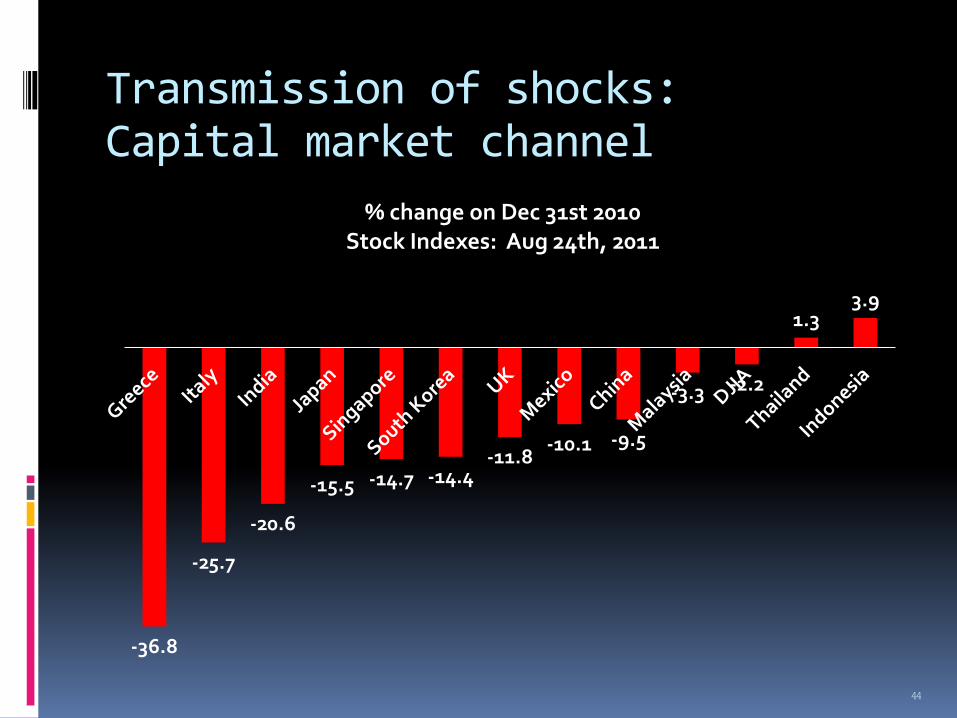
-36.8
-25.7
-20.6
-15.5 -14.7 -14.4 -11.8
-10.1 -9.5
-3.3 -2.2
1.3 3.9
% change on Dec 31st 2010 Stock Indexes: Aug 24th, 2011
44
45
46
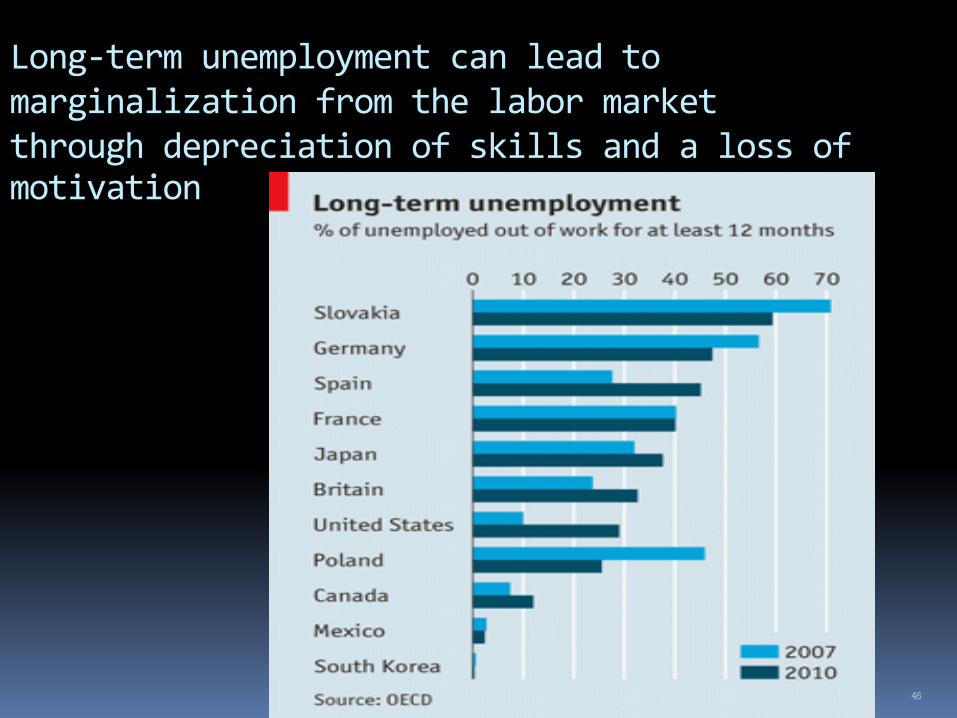
Long-term unemployment can lead to marginalization from the labor market through depreciation of skills and a loss of motivation
Tax reform
Reduction in corporate income tax rate affects the effectiveness of fiscal automatic stabilizers.
Tax revenue structure reflects output and employment structure.
Difficult to imitate tax structure in countries with higher level of development
47
Don’t say no to domestic reform
Integrating the Thai economy with the regional trade bloc can serve as an instrument to speed up domestic reform.
Temporary subsidies to adversely affected industries are required to ease adjustment costs.
Firm datelines imposed by AEC imply more enthusiastic efforts to carry out difficult reform.
48
The big push
Utilization of free trade provisions remain relatively low due to high marginal transaction costs imposed by Rules of Origin.
Watch out: Non-tariff barriers are substitutes for tariff reduction.
Sensitive commodities are dictated by political interest.
A surge in the number of Thailand’s FTA negotiations should not be interpreted as diminished commitment to the multilateralism.
49
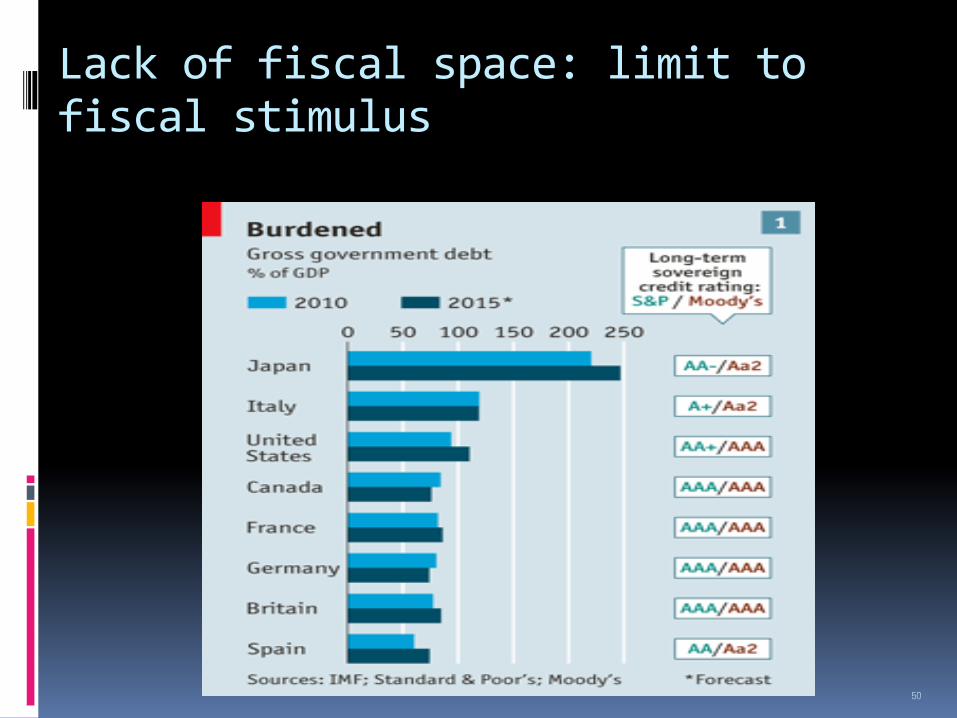
Lack of fiscal space: limit to fiscal stimulus
50

Fiscal expenditure
Productivity and human capital
Health capital
Focus spending on high-social rate of return
Avoid fiscal splurge
Spender of the last resort
51
Monetary space
Lender of the last resort: the role of central bank
Too big-to-fail syndrome
Inflation convergence
Monetary policy instruments
Monetary autonomy
Capital controls?
52
After 2015: Need prudential regulations
Internal and external shocks will be more frequent.
Maintain prudential rules and regulations to provide sufficient fiscal space when the time comes.
Reduce debt-to-GDP ratio to 40% during economic upturn to provide ample fiscal space for the next downturn.
53
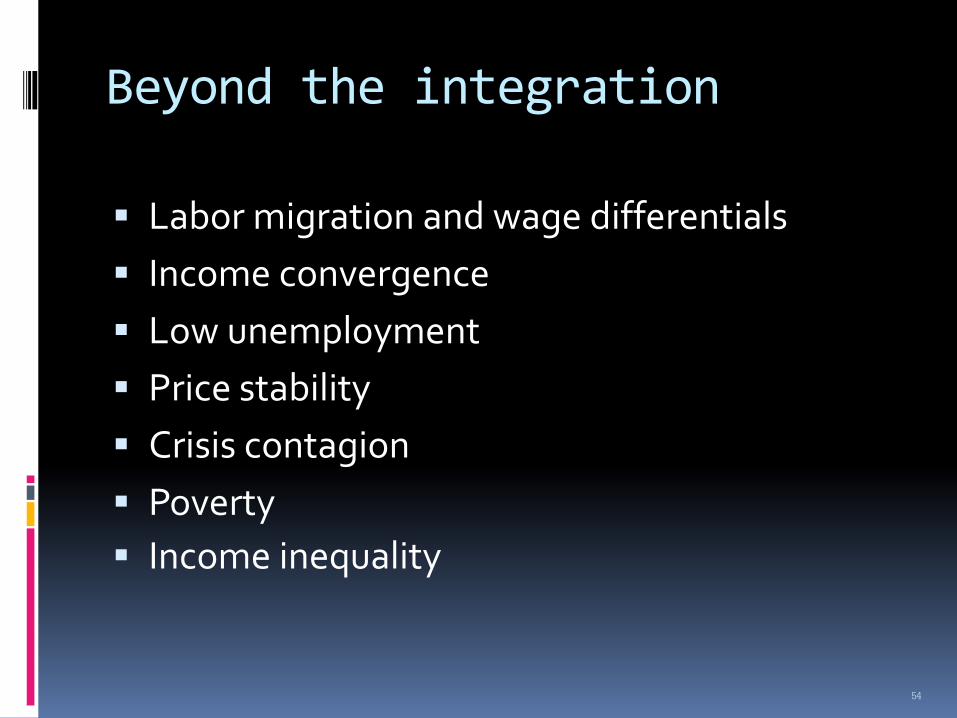
Beyond the integration
Labor migration and wage differentials
Income convergence
Low unemployment
Price stability
Crisis contagion
Poverty
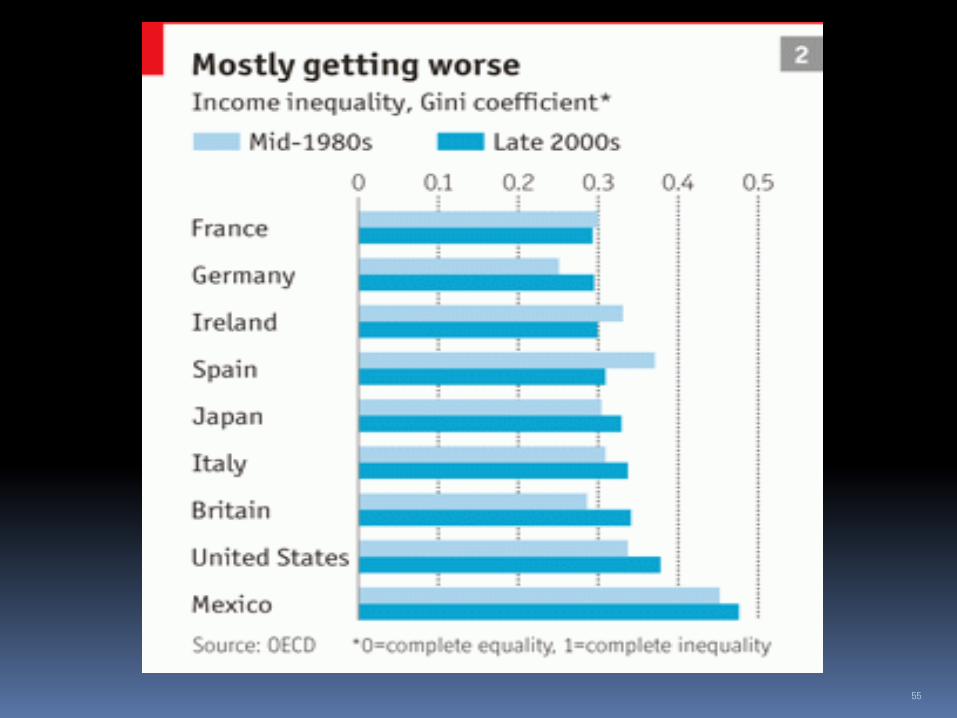
Income inequality
54
55
56
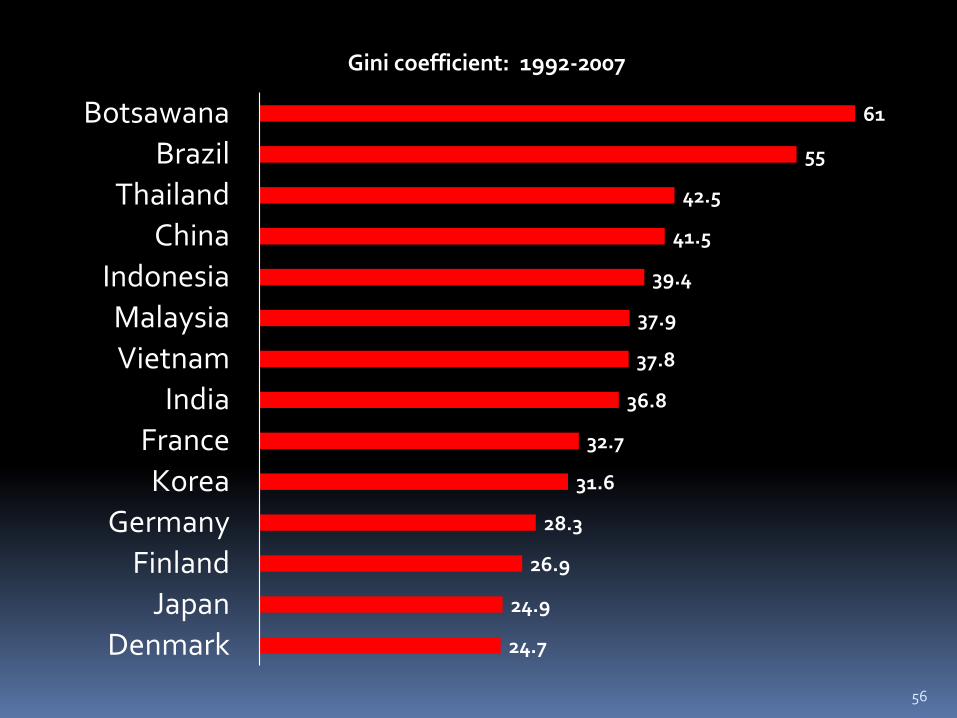
24.7
24.9
26.9
28.3
31.6
32.7
36.8
37.8
37.9
39.4
41.5
42.5
55
61
Denmark
Japan
Finland
Germany
Korea
France
India
Vietnam
Malaysia
Indonesia
China
Thailand
Brazil
Botsawana
Gini coefficient: 1992-2007
The way forward: After 2015
The baht exchange rate must be allowed to move more freely to cushion export fluctuations—less intervention.
Don’t have too much high hope on the Asian Economic Community
Its main benefit would be the breakup domestic monopoly power
Be cautiously optimistic
57
Conclusion
Integration of Thailand with ASEAN Economic Community is going ahead as scheduled.
Integration with Latin America is constrained by high transportation cost and imperfect information.
Direct investment can be promoted with revival of investment opportunity
Thailand and Mexico are facing similar economic problems: income distribution and monopoly.
Lessons can be learned from each other by examining policy mistakes in the past.
58