Condition of Nontidal Wetlands in the Nanticoke River Watershed, Maryland and …€¦ · ·...
73
Condition of Nontidal Wetlands in the Nanticoke River Watershed, Maryland and Delaware By Amy D. Jacobs 1 and David F. Bleil 2 1 Delaware Department of Natural Resources and Environmental Control Water Resources Division/Watershed Assessment Section Dover, DE 19904 2 Maryland Department of Natural Resources Ecosystem Analysis Division Tawes State Office Building E-2 Annapolis, MD 21401 September 2008
Transcript of Condition of Nontidal Wetlands in the Nanticoke River Watershed, Maryland and …€¦ · ·...
Condition of Nontidal Wetlands in the Nanticoke River Watershed,
Maryland and Delaware
By Amy D. Jacobs1 and David F. Bleil2
1 Delaware Department of Natural Resources and Environmental Control Water Resources Division/Watershed Assessment Section
Dover, DE 19904
2 Maryland Department of Natural Resources Ecosystem Analysis Division
Tawes State Office Building E-2 Annapolis, MD 21401
September 2008
The correct citation for this document is: Jacobs, A.D. and D.F. Bleil. 2008. Condition of nontidal wetlands in the Nanticoke River Watershed, Maryland and Delaware. Delaware Department of Natural Resources and Environmental Control, Watershed Assessment Section, Dover, DE 78pp.
Condition Nanticoke Watershed Wetlands Page ii
ACKNOWLEGMENTS
This report is a compilation of the efforts of many dedicated people who contributed substantial time and energy to further wetland science and protection in the Nanticoke River watershed. Funding was provided by EPA REMAP and Region III Wetland Program Development Grants as well as additional support from Smithsonian Environmental Research Center, The Nature Conservancy, Maryland Department of Natural Resources, and Delaware Department of Natural Resources and Environmental Control. Mary Kentula and Rich Sumner with EPA Office of Research and Development, Corvallis, OR and the late Art Spingarn had the vision to instigate this research and lent unending technical support. Dennis Whigham, Smithsonian Environmental Research Center was the principal investigator for the initial study of flat and riverine wetlands and provided excellent leadership to bring together the numerous cooperators on the project. Mark Zankel, The Nature Conservancy, initiated the outreach and field crew deployment for the initial study. Don Weller, Smithsonian Environmental Research Center, developed a process for predicting condition of wetlands based on surrounding land use features. Alan Herlihy, Oregon State University, provided statistical assistance for developing the Index of Wetland Condition and condition categories. Debora Fillis, Evan Rehm, and Erin McLaughlin provided comments that greatly improved this report. The field crews were the heart of the project and were lead by tireless biologists dedicated to wetland science and included field crew leaders Chris Bason and Abby Rokosh and the many field crew members including Rena Avalia, Lorie Beasley, Stephanie Behles, Eric Buehl, Jack and Jeanne Conner, Kevin R. Coyne, Gwen Dryden, Griff Gilbert, Pat Groller, Julie Hawkins, Jeff Lin, Jessica Lister, Micheal McNealy, Anne Patterson Niles Primrose, Bill Reybold, Bruce Vasilas, Ted Webber, Christine Whitcraft, Rebecca Zeiber.
Condition Nanticoke Watershed Wetlands Page iii
ACKNOWLEGMENTS............................................................................................................................................ iii
LIST OF MAPS ..........................................................................................................................................................vi
LIST OF TABLES.................................................................................................................................................... vii
LIST OF FIGURES................................................................................................................................................. viii
EXECUTIVE SUMMARY ....................................................................................X
INTRODUCTION....................................................................................................1
NANTICOKE RIVER WATERSHED..................................................................2
2.1 Ecological Significance ..........................................................................................................................................2
2.2 Hydrogeomorphology............................................................................................................................................4
2.3 Surface and Ground Water Quality.....................................................................................................................7
2.4 Land Use................................................................................................................................................................7
METHODS .............................................................................................................10
5.1 Determining Changes in Wetland Acreage .......................................................................................................10
5.2 Site Selection ........................................................................................................................................................11
5.3 Landowner Contact and Site Access .................................................................................................................11
5.4 Data Collection.....................................................................................................................................................12
5.5 Assessment Model Development.........................................................................................................................13
5.6 Function and IWC Scoring .................................................................................................................................16
5.7 Assigning Condition Categories .........................................................................................................................17
RESULTS AND DISCUSSION OF WETLAND CONDITION .......................19
6.1 Changes in Wetland Acreage..............................................................................................................................19
6.2 Present Wetland Condition.................................................................................................................................21 6.2.1. Flat Wetland Condition in the Nanticoke Watershed....................................................................................22 6.2.2 Riverine Wetland Condition in the Nanticoke Watershed..............................................................................26 6.2.3. Depressional Wetland Condition in the Nanticoke Watershed .....................................................................29 6.2.4. Farmed and excavated wetlands...................................................................................................................33 6.2.5. Restored Wetlands in the Nanticoke Watershed ...........................................................................................34
Condition Nanticoke Watershed Wetlands Page iv

6.2.6. Overall Condition of Nontidal Wetlands.......................................................................................................37
USING LANDSCAPE ANALYSIS TO PREDICT CONDITION OF WETLANDS...........................................................................................................40
7.1. Methods ...............................................................................................................................................................40
7.2. Application of Landscape Data .........................................................................................................................43
RECCOMENDATIONS FOR PRIORITIZING RESTORATION AND PROTECTION.......................................................................................................45
8.1 Identification of Management Responses ..........................................................................................................45
8.2 Integrating Protection and Restoration with Landscape Planning Efforts ....................................................49
8.3 Prioritizing Wetland Protection and Restoration Activities ............................................................................49 8.3.1. Protection......................................................................................................................................................49 8.3.2 Improvement of existing wetlands..................................................................................................................51 8.3.3 Restoration of former wetlands......................................................................................................................51
8.4 Evaluating Progress Towards Improving Wetland Condition ........................................................................51
LITERATURE CITED .........................................................................................52
APPENDIX A. WETLAND FUNCTIONS..........................................................57
Condition Nanticoke Watershed Wetlands Page v

LIST OF MAPS
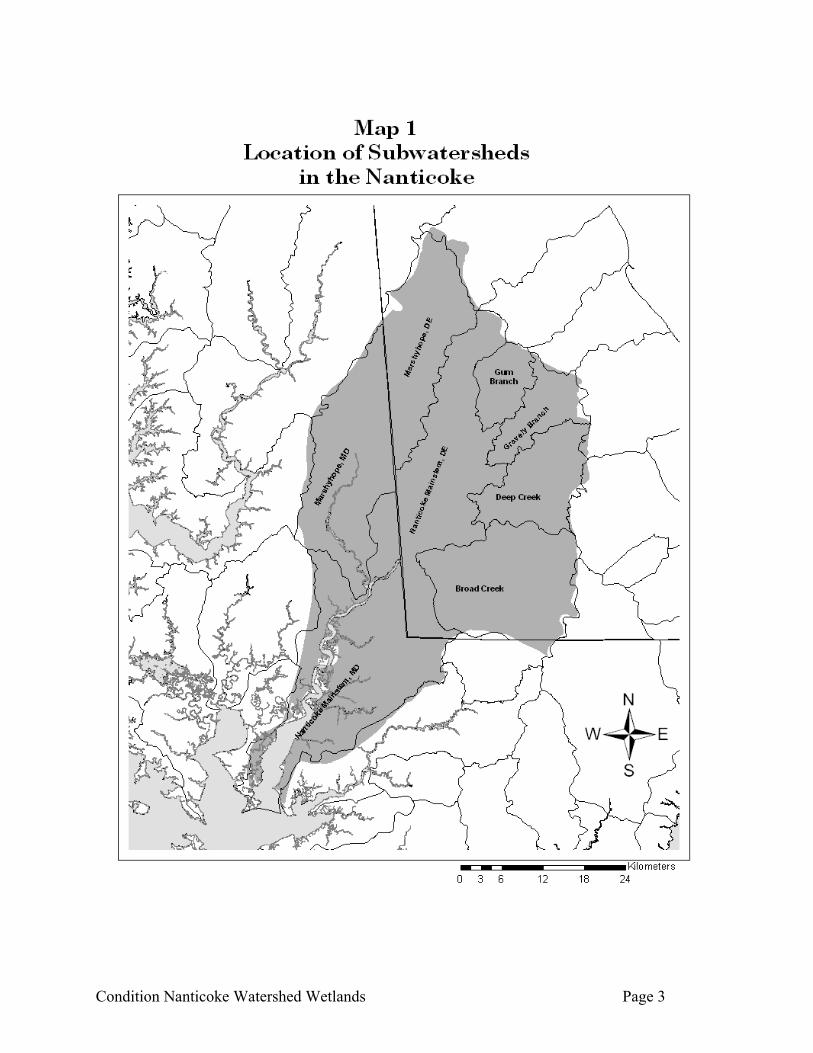
Map 1 Location of the subwatersheds in the Nanticoke River watershed…………….………………………………………………………..……...…3
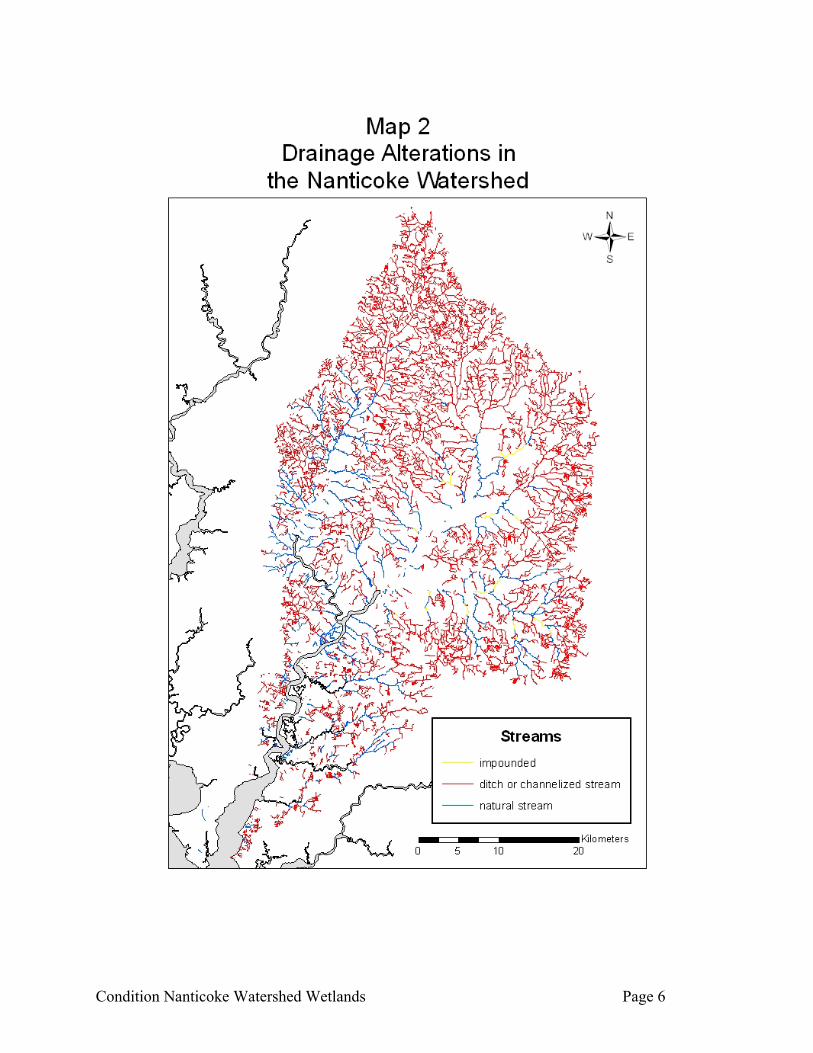
Map 2 Drainage alterations in the Nanticoke River watershed including impounded, ditched or
channelized, and natural streams………………………………………………………..…………………………6
Map 3 Land cover in the Nanticoke River watershed in 2001 based on NLCD land use
categories……………………………………………………………..…………………9 Map 4 Distribution of wetlands by HGM subclass in the Nanticoke River watershed pre-
European settlement……………………………………………………………...….… 20
Map 5 Distribution of wetlands by HGM subclass in the Nanticoke River watershed in 1998……………………………………………………………………………………..20
Map 6 Location of flat wetlands and streams in the Nanticoke River watershed in
1998……………………………………………………………………………………..23
Map 7 Location of riverine wetlands and streams in the Nanticoke River watershed in 1998……………………………………………………………………………………..27
Map 8 Location of depressional wetlands and streams in the Nanticoke River watershed in
1998……………………………………………………………………………………..31 Map 9 Green Infrastructure of the Nanticoke River watershed as identified by Maryland
Department of Natural Resources and the Delaware Department of Natural Resources and Environmental Control ………………………………………………………………………….………….…....50
Condition Nanticoke Watershed Wetlands Page vi
LIST OF TABLES Table 1. Variables that were responsive to disturbance and used in functional capacity indices
(FCI) for flat, riverine, and depressional wetlands in the Nanticoke River watershed. Variable name and abbreviation, variable definition, and field methods to collect data used to score the variable are provided……………………………………………………………………….……….14
Table 2. Functional capacity indices (FCI) functions for depression, flat and riverine wetlands in
the Nanticoke River watershed. FCIs are composed of variables that are scaled to reference site data….……………………………………………………..…………….16
Table 3. Index of wetland condition (IWC) function for depression, flat and riverine wetlands in
the Nanticoke River watershed. IWCs are composed of variables that are scaled to reference site data ………………………………………………………………………16
Table 4 Condition categories for depression, flat, and riverine wetlands in the Nanticoke River
watershed as determined by index of wetland condition (IWC) scores……………………………………………….…….. ……………………………18
Table 5 Functional capacity index (FCI) scores for 2 farmed wetlands in the Nanticoke River
watershed scored using the depression model……………………………………....….34 Table 6 Functional capacity index (FCI) scores for 4 excavated wetlands in the Nanticoke River
watershed scored using the depression model……………………………………..…...34 Table 7 Potential landscape indicators of wetland condition that were tested for use in a
multivariate equation to predict wetland condition using remote image data.................41 Table 8. Multiple regression equations predicting depression, flat, and riverine nontidal wetland
functional capacity index (FCI) scores in the Nanticoke River watershed using landscape indicators (Weller et al. 2007, Bleil 2004) ….……….…………………………………42
Table 9. Variance explained (R2) by regression models for predicting functional capacity index
(FCI) scores for flat, riverine, and depression nontidal wetlands in the Nanticoke River watershed using landscape indicators……………………..............................................43
Nanticoke Watershed Profile Page vii

LIST OF FIGURES Figure 1. Landowner access to private lands in the Nanticoke River watershed by HGM subclass
........................................................................................................................................... 12 Figure 2 Proportion of wetland area (a) and wetland area (b) of wetlands in the Nanticoke River
watershed by HGM subclass pre-settlement and 1998 based on data from Tiner and Bergquist (2003) ............................................................................................................... 19
Figure 3. Cumulative distribution function (CDF) for flat wetland Index of Wetland Condition
(IWC) in the Nanticoke River watershed in 2000.. .......................................................... 24 Figure 4. Condition of Flat wetlands in the Nanticoke Watershed in 2000 based on the Index of
Wetland Condition (IWC). Percentages represent percent of flat wetland area in the watershed. ......................................................................................................................... 24
Figure 5 Cumulative distribution function (CDF) for nontidal riverine wetland Index of Wetland
Condition (IWC) in the Nanticoke River watershed in 1999/2000 .................................. 28 Figure 6 Condition of riverine wetlands in the Nanticoke Watershed in 1999/2000 based on the
Index of Wetland Condition (IWC). Percentages represent percent of riverine wetland area in the watershed......................................................................................................... 28
Figure 7 Cumulative distribution function (CDF) for depressional wetland Index of Wetland
Condition (IWC) in the Nanticoke River watershed in 2003 ........................................... 32 Figure 8 Condition of depressional wetlands in the Nanticoke Watershed in 2003 based on the
Index of Wetland Condition (IWC). Percentages represent number of depressional wetlands in the watershed ................................................................................................. 32
Figure 9 Functional capacity index scores (FCI) for five wetland functions: maintaining
characteristic hydrology, biogeochemical cycling and storage, wildlife habitat integrity, plant community integrity, and buffer integrity for natural depressions (blue squares) and restored wetlands (yellow circles) in the Nanticoke River watershed in 2003................. 36
Figure 10 Mean functional capacity index (FCI) and index of wetland condition (IWC) scores for
farmed and restored wetlands in the Nanticoke Watershed in 2003. FCI sores are relative to depression reference standard condition....................................................................... 37
Figure 11 Condition of nontidal wetlands in the Nanticoke River watershed during the period of
1999-2003 based on the Index of Wetland Condition (IWC). Wetlands included in this analysis are flats, nontidal riverine, depressions, excavated, and farmed......................... 38
Figure 12 Mean functional capacity index (FCI) scores for five wetland functions: maintaining
characteristic hydrology, biogeochemical cycling and storage, wildlife habitat integrity, plant community integrity, and buffer integrity and the Index of Wetland Condition
Condition Nanticoke Watershed Wetlands Page viii
(IWC) for depression, flat and nontidal riverine wetlands in the Nanticoke River watershed. Scores on the y-axis are percent of reference standard condition. ................ 38
Figure 13 Comparison of field derived functional capacity index (FCI) scores (Flat PLANT) to
predicted landscape derived FCI scores (Predicted Flat PLANT) for flat plant community integrity (Weller et al. 2007)…………………………………………………………….44
Figure 14 Management response matrix (a) and percent of wetlands in 8 management categories
based on the maintenance of hydrology function, plant community integrity function, and wildlife habitat integrity function for flat (b), riverine (c) and depression (d) nontidal wetlands in the Nanticoke River watershed. Percent of wetlands for the flat and riverine subclasses are based on total area of wetland and depressions are based on the number of wetlands. ........................................................................................................................... 48
Condition Nanticoke Watershed Wetlands Page ix
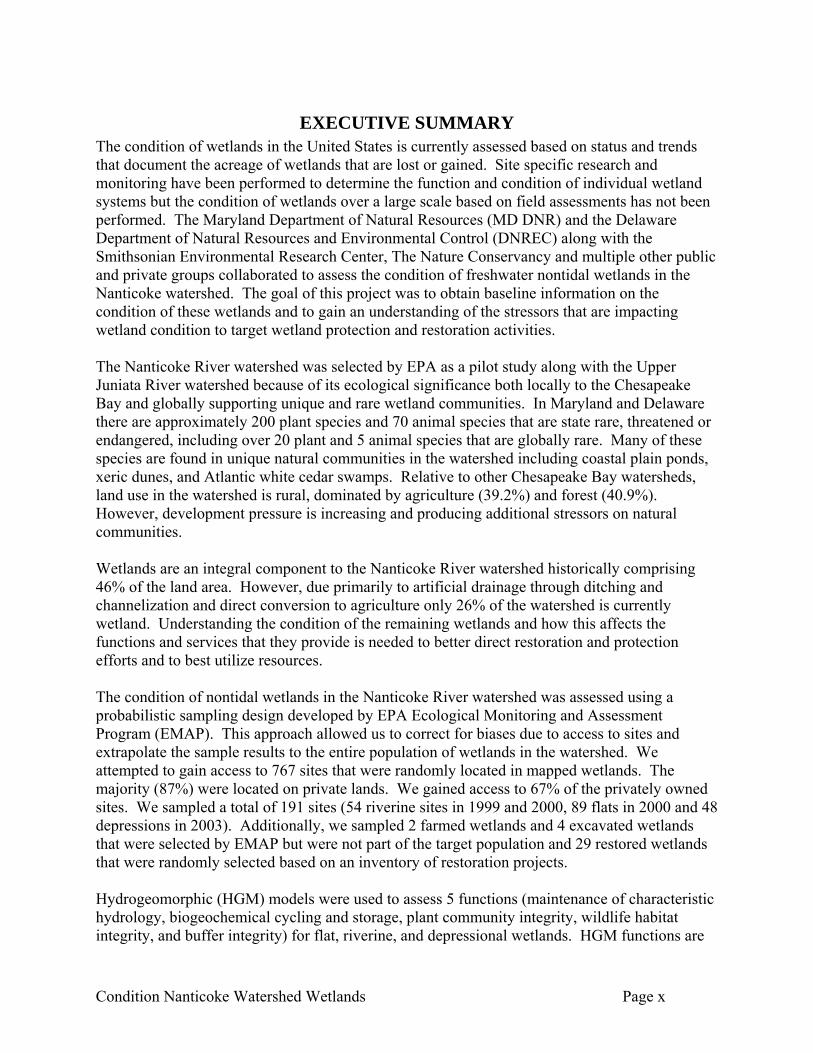
EXECUTIVE SUMMARY The condition of wetlands in the United States is currently assessed based on status and trends that document the acreage of wetlands that are lost or gained. Site specific research and monitoring have been performed to determine the function and condition of individual wetland systems but the condition of wetlands over a large scale based on field assessments has not been performed. The Maryland Department of Natural Resources (MD DNR) and the Delaware Department of Natural Resources and Environmental Control (DNREC) along with the Smithsonian Environmental Research Center, The Nature Conservancy and multiple other public and private groups collaborated to assess the condition of freshwater nontidal wetlands in the Nanticoke watershed. The goal of this project was to obtain baseline information on the condition of these wetlands and to gain an understanding of the stressors that are impacting wetland condition to target wetland protection and restoration activities.
The Nanticoke River watershed was selected by EPA as a pilot study along with the Upper Juniata River watershed because of its ecological significance both locally to the Chesapeake Bay and globally supporting unique and rare wetland communities. In Maryland and Delaware there are approximately 200 plant species and 70 animal species that are state rare, threatened or endangered, including over 20 plant and 5 animal species that are globally rare. Many of these species are found in unique natural communities in the watershed including coastal plain ponds, xeric dunes, and Atlantic white cedar swamps. Relative to other Chesapeake Bay watersheds, land use in the watershed is rural, dominated by agriculture (39.2%) and forest (40.9%). However, development pressure is increasing and producing additional stressors on natural communities.
Wetlands are an integral component to the Nanticoke River watershed historically comprising 46% of the land area. However, due primarily to artificial drainage through ditching and channelization and direct conversion to agriculture only 26% of the watershed is currently wetland. Understanding the condition of the remaining wetlands and how this affects the functions and services that they provide is needed to better direct restoration and protection efforts and to best utilize resources. The condition of nontidal wetlands in the Nanticoke River watershed was assessed using a probabilistic sampling design developed by EPA Ecological Monitoring and Assessment Program (EMAP). This approach allowed us to correct for biases due to access to sites and extrapolate the sample results to the entire population of wetlands in the watershed. We attempted to gain access to 767 sites that were randomly located in mapped wetlands. The majority (87%) were located on private lands. We gained access to 67% of the privately owned sites. We sampled a total of 191 sites (54 riverine sites in 1999 and 2000, 89 flats in 2000 and 48 depressions in 2003). Additionally, we sampled 2 farmed wetlands and 4 excavated wetlands that were selected by EMAP but were not part of the target population and 29 restored wetlands that were randomly selected based on an inventory of restoration projects. Hydrogeomorphic (HGM) models were used to assess 5 functions (maintenance of characteristic hydrology, biogeochemical cycling and storage, plant community integrity, wildlife habitat integrity, and buffer integrity) for flat, riverine, and depressional wetlands. HGM functions are
Condition Nanticoke Watershed Wetlands Page x
composed of variables that are scaled to reference conditions in the Nanticoke River watershed and surrounding areas. Additionally, and index of wetland condition (IWC) was produced that combined the strongest variables to produce an overall score of condition. Breakpoints in the IWC scores were determined to categorize sites into three condition classes: minimally or not stressed, moderately stressed, and highly stressed. Overall, only 17% of the nontidal wetlands in the Nanticoke River watershed are considered minimally or not stressed based on the IWC. Of the remaining wetlands, 48% were moderately stressed and 35% were highly stressed. Flats are the dominant wetland type comprising 71% of the wetlands in the watershed. Fifteen percent of flats were minimally or not stressed and 34% were highly stressed. The average functional scores varied with the plant community integrity having the lowest of 51% of reference condition whereas the buffer integrity function was performing the best at 90% of reference condition. The average wildlife habitat function score was 63.4 and the average plant community integrity function score was 50.5. Dominant stressors impacting wetlands and lowering condition were hydrology alterations due to ditching and vegetative alterations due to forestry practices, which alter species structure and composition. The IWC for riverine wetlands averaged 69 with 30% of the riverine wetlands considered minimally or not stressed and 25% highly stressed. Biogeochemical cycling was functioning the lowest at an average of 45% of reference while the plant community integrity had the highest average function of 84. The wildlife habitat integrity and plant community integrity were functioning at higher levels compared to the flats because of lower incidence of direct alteration by agriculture, forestry, and development. The dominant stressor to riverine wetlands was hydrologic alteration due to stream channelization. In the watershed, 86% of the nontidal streams are either channelized or ditched. Depressions had that highest levels of degradation compared to reference. They had an average IWC of 62 with only 22% of the wetlands minimally or not stressed and 44% highly stressed. The functions of depressions are significantly altered from reference standard condition with the average function values ranged from 58 for plant community integrity to 70 for buffer integrity. These low scores compared to reference standard condition for all functions are due to multiple stressors that are impacting depressions and affecting all parts of the system. All of the restored wetlands had increased function compared to farmed and excavated wetlands. However, the average IWC for restored wetlands was 26.5 and ranged from 10.0 to 47.8 which is a similar level of function as highly stressed natural wetlands. The low condition of restored wetlands reflects the lack of a mature vegetative community most notably trees due to the age of the sites (1 to 7 years post construction) or to the maintenance of early successional communities. We would expect the function scores to increase over time if natural successional processes are not inhibited. Using the field assessment data, landscape models were developed to predict wetland condition using remotely acquired information. Potential geographic metrics were derived from digital land cover, road, and wetland coverages. Variables that had significant univariate correlations with HGM functions were then used in a step-wise multiple regression analysis to develop the predictive model. The regression models were all highly significant (P<0.0001) and explained
Condition Nanticoke Watershed Wetlands Page xi
between 36 and 85% of the variance. Although the functions all had significant relationships, the confidence interval for predicting the function of individual wetlands was high. Therefore, we recommend that these models be used to predict the function of a group of wetlands where the confidence intervals are smaller, such as the subwatershed level as opposed to predicting the condition of individual sites. To provide wetland protection and restoration recommendations, we evaluated general patterns of wetland condition based on the scores of multiple functions at a site. Matrices, which were based on the function scores for maintenance of hydrology, plant community integrity, and wildlife habitat integrity, were developed to illustrate the percent of wetlands that occurred in 8 management response categories. The sites were stratified by hydrologic condition in 2 matrix columns and vegetative condition in 4 matrix rows. All wetland types had a low percent that were minimally altered for both hydrology and vegetation (16% of the riverine wetland area, 8% of flat wetland area, and 6% of depressions) indicating the need to prioritize protection efforts on the few minimally impacted wetlands that remain. Within flat wetlands, 58% of the wetland area has species composition and vegetative structure alterations that was not related to hydrologic alterations. Many of the vegetative alterations are due to the conversion of the native mixed hardwood forests to loblolly pine plantations, which alters species composition and structure of the vegetation community (Whigham et al. 2007). Restoration for the flats subclass should focus on restoring a native vegetative community with a hydrology that is sustainable given current landscape level alterations. Enhancement of existing wetlands and re-establishment of former wetlands should focus on improving and increasing areas within and adjacent to large forest blocks. The hydrology of 80% of the area of riverine wetlands is impacted largely due to channelization of streams, road crossings and dams. Of the riverine wetlands that had hydrologic impacts, 60% of these areas also had vegetative alterations. However, if the hydrology of the wetlands remained intact, only 4% of the wetlands had vegetative alterations. Therefore, riverine wetland restoration should focus foremost on hydrologic improvements. Sites that do not have species composition alterations (33%) should be targeted first to restore the hydrology before species composition shifts occur or non-native and invasive species become established. Depressions have the highest levels of hydrologic and vegetative stressors and thus lowest condition of non-tidal wetlands in the watershed. Forty-two percent of the wetlands had altered hydrology and vegetative structure, and species composition shifts. Many of these wetlands are impacted by major stressors such as excavation, plowing, or extensive ditching. Restoration of depressional wetlands should be targeted on an individual site basis and within a larger landscape context to support the unique amphibian and bird species that rely on these unique wetland habitats. Wetland restoration and protection activities need to be integrated into larger landscape level plans such as GreenInfrastructure and Wildlife Action Plans to ensure the ability of wetlands to perform functions and provide ecosystem services as well as support sustainable restoration activities. We recommend three strategies in the following priority: protection, improvement of existing wetlands, and restoration of former wetlands. Protecting wetlands through acquisitions
Condition Nanticoke Watershed Wetlands Page xii
and conservation easements should be the highest priority strategy for maintaining wetland functions and services in the Nanticoke River watershed. Integrating protection of wetlands that are minimally or least stressed and their associated buffers with existing landscape conservation plans will ensure that these systems will remain in tact and be able to provide associated functions. Enhancement activities should be used to improve the condition of these wetlands by reducing or eliminating the dominant stressors that are impacting different wetland types. These activities will likely produce a greater increase in function in the short term with less effort than attempting to restore former wetlands. Restoration of former wetlands is important because it is the only way that we will continue to increase the acreage of wetlands in the watershed. Restoration of former wetlands increases function from pre-restoration levels, however, more information is needed to understand the functions and services they provide and how these differ from natural wetlands. When restoring former wetlands, data from reference standard sites should be used as guidance during construction to ensure projects will be sustainable in the current landscape.
Condition Nanticoke Watershed Wetlands Page xiii
INTRODUCTION
The States of Maryland and Delaware are dedicated to protecting wetland resources through enhancement and restoration of previously impacted wetlands to achieve healthy habitat and waters of the State. In order to achieve this, the Maryland Department of Natural Resources (MD DNR) and the Delaware Department of Natural Resources and Environmental Control (DNREC) developed methods to assess the condition and function of wetlands on a watershed scale. This data helps resource managers and land use decision makers make informed decisions about their wetland resources. These methods have been applied to the Nanticoke River watershed to determine the condition of freshwater nontidal wetlands and the stressors that are impacting wetlands in the watershed.
Historically, wetland status and trends have been reported in terms of losses and gains of wetland acreage (Tiner 2001). This report expands our understanding of the resource by integrating wetland condition with changes in wetland acreage of the various wetland types. Wetlands are evaluated based on hydrogeomorphic (HGM) subclass, which classifies wetlands based on hydrology, geomorphology and landscape setting (Brinson 1993, Smith et al. 1995). By using an HGM approach we can summarize the condition of wetlands by functional types, measure how well they are able to perform functions and isolate the most common threats facing each wetland type in the watershed. Therefore, in the Nanticoke River watershed, specific restoration and management recommendations can be made based on the distribution of wetland acreage (existing and historic) and of their stressors. Information on wetland condition will supplement larger efforts in Maryland and Delaware such as Green Infrastructure and Wildlife Action Plans by providing more detailed, regionally specific scientific information on which to base management decisions.
This project is the result of the work of numerous organizations and agencies over a period of four years. We report on the three major classes of nontidal wetlands in the Nanticoke watershed.
Flats – located primarily in the head waters of the watershed and on interfluvs between major drainages. They have little slope and the dominate hydrology is a mix of precipitation that accumulates on the soil surface until it can evaporate or is absorbed into the soil and groundwater which rises in the winter and spring. Clay layers beneath the typically sandy soils retard the vertical movement of water and can keep some flat wetlands saturated for extended periods. Riverine – floodplains located along streams and rivers. In smaller systems the dominant hydrology is groundwater feeding the streams and associated wetlands and in larger systems the dominant hydrology is surface water from the associated stream during high water and storm events. Depressions – located throughout the watershed in low lying areas and topographical depressions. They accumulate surface water as well has ground water during winter and spring.
Condition Nanticoke Watershed Wetlands Page 1
Two levels of assessment techniques were used to assess the condition of each subclass, a landscape level assessment relied on mapping data and aerial photography and a comprehensive assessment used detailed field data collection following the hydro-geomorphic method model.
NANTICOKE RIVER WATERSHED The Nanticoke River is a major tributary of the Chesapeake Bay draining approximately 2,072 square kilometers (800 square miles) including approximately one quarter of Delaware (CBF 1996). The headwaters of the Nanticoke form in a band of wetlands along the western edge of the geographic divide, located in western Sussex County, Delaware. From Delaware, the main stem flows west into Maryland forming the boundary between Dorchester and Wicomico Counties. Marshyhope Creek forms in southwest Kent County, Delaware and flows through a section of Sussex, Delaware and Caroline, Maryland before joining the Nanticoke in Dorchester, MD (CBF 1996). There are two sub-watersheds included in Maryland and six sub-watersheds in Delaware (Map 1). The watershed is over 88.5 miles long and the total rise in elevation is only 19.8 feet, giving the river a very low gradient (Tiner et al. 2000). The river’s main stem is navigable up to Seaford Delaware but the upstream limits of estuarine or salt water seldom extends beyond six miles from the mouth. The river is tidal along the major channels up to dams on Broad Creek in Laurel, Delaware, and on Deep Creek in Concord, Delaware. The Marshyhope is tidal up to the dam in Federalsburg, Maryland. Much of the mainstem of the Nanticoke and its tributaries upstream of the dams have been altered by channelization and ditching (CBF 1996).
2.1 Ecological Significance The Nanticoke River watershed has been a focus for protection because of its wealth of rare fauna and flora and unique biological communities. The Nature Conservancy listed the Nanticoke as one of their “Last Great Places” and has targeted significant conservation efforts in this region (TNC 1998). In Maryland and Delaware there are approximately 200 plant species and 70 animal species that are state rare, threatened or endangered, including over 20 plant and 5 animal species that are globally rare (TNC 1998). Many of these species are found in rare natural communities in the watershed such as coastal plain ponds, xeric dunes, and Atlantic white cedar swamps. The Nanticoke is also important for waterfowl and is a focus area of the North American Waterfowl Management Plan. The river also supports a variety of fisheries and is a reintroduction site for American shad (Alosa sapidissima ).
Condition Nanticoke Watershed Wetlands Page 2
Condition Nanticoke Watershed Wetlands Page 3
2.2 Hydrogeomorphology The Nanticoke Watershed is entirely in the Outer Coastal Plain physiographic region. The Coastal Plain consists of layers of unconsolidated sediments eroded from the early Appalachian Mountains, which first formed in the Permian period around 240 million years before present. Soils are sand, silts and clays, which have been accumulating since the Eocene (from 33 million years ago). The major accumulations occurred during and following the Pleistocene glaciations (from 1.2 million years ago; Denver et al. 2004)
During the Pleistocene, a sediment-filled, paleo-channel of the Susquehanna River, now under layers of Quartenary deposits, crossed the course of the present day Nanticoke River at approximately the location of the town of Vienna. Much of the current soil was deposited from the runoff from the retreating glaciers of the Pleistocene flowing down the Susquehanna River. These sediments were re-worked by marine processes and have mixed with patches of marine clays. (Denver et al 2004)
An abundance of wetlands were formed throughout this landscape because of the ideal geomorphic and hydrologic conditions. Tiner and Bergquist (2003) estimated that 45% of the land area in the Nanticoke was wetland before European colonization. Water, under natural conditions, tends to move through the watershed encountering a chain of different wetland classes. Precipitation falling on the outer edge of the basin enters flats or interfluve wetlands, where the water remains until it percolates through the soil into the ground water or is evapotranspired into the atmosphere again. Water in the ground water layer moves laterally until it encounters a stream or ditch where it may re-emerge as baseflow to the surface drainage system or recharge the deep aquifer. In the process, it may flow laterally through a riverine wetland and a tidal wetland in succession.
The interaction of wetlands and ground water in the Nanticoke basin is complex and dependant on the structure of local soils. The majority of the Nanticoke watershed is in the poorly drained upland hyrdogeomorphic region (Phillips and Bachman 1996). The groundwater is usually within 3 meters of the surface and the soils are generally poorly drained because of the combination of high water tables, low stream gradients, and low rates of stream incision. Many of the wetlands are dependant on the high water table and low stream incision, which provides frequent over bank flooding and partial hydrology to the wetland. The wetlands in turn feed water to the surficial aquifer during seasonal dry periods. For example, the Nanticoke watershed receives on average 110.5 cm of precipitation per year, of which 20% runs off and 28% infiltrates to recharge the ground water. If not transmitted to the stream and ditch network via groundwater flow patterns, precipitation remaining in the soils is often lost through evapotranspiration and ground water withdrawals. Use of groundwater for agricultural purposes has changed in response to agricultural practices on the Delmarva. Initially, unfertilized tobacco agriculture shifted to other fertilized row crops, primarily vegetables. Recently grains such as corn, soybeans and wheat have become dominant. With these changes in agriculture has come increased mechanization and pump irrigation. In 1995, there were 3,713 houses and 3,621 agricultural irrigation wells withdrawing ground water (Ahl et al. 1996). The irrigation wells on an average year draw approximately 31,000 cubic
Condition Nanticoke Watershed Wetlands Page 4
meters from the surficial aquifer. Most of the pumped water is lost through direct evaporation by spray irrigation systems or subsequent evapo-transpiration from the crops. The increased mechanization of agriculture in the region has also led to the use of larger and heavier farm equipment. Efficient soil drainage became a priority to avoid losing such machinery in poorly drained fields. In 1951, special tax levies were instituted and the maintenance of the larger ditches was given the force of law. Drainage was no longer confined to the removal of water from relative low spots in farm fields. Natural stream channels were straightened and deepened to remove water as rapidly as possible. As a result of these efforts, 87.2% of the streams were channelized (Map 2; Tiner et al. 2000, Tiner 2004). Channelization impacts adjacent wetlands by reducing the residence time of water in these wetlands, and the channelization method of depositing spoils along stream channels further isolates flood plain wetlands by preventing overbank flooding.
Condition Nanticoke Watershed Wetlands Page 5
Condition Nanticoke Watershed Wetlands Page 6
2.3 Surface and Ground Water Quality The U.S. Geological Survey began a study of the water quality of the Delmarva Peninsula in 1999 to monitor trends in ground water quality and surface water quality. Domestic use wells in the rural areas had a median depth of 13.7 m, while municipal wells were deeper (median depth 24.4 m). Water in approximately one third of the domestic water supply wells had concentrations of nitrate above the EPA limit of 10 mg/l (Denver et al. 2004). Groundwater discharge is the primary source of nutrient and agricultural chemical movement to surface water in streams (Denver et al. 2004, CFB 1996). Most of the nitrogen reaching the streams of the Nanticoke River watershed is transported through groundwater in the form of nitrate (CBF 1996). Denver et al. (2004) found that nitrate concentrations are typically higher in ground water that is beneath well-oxygenated soils than in areas located under soils where dissolved oxygen concentrations are less than 1 mg/l. Low dissolved oxygen concentrations and organic matter accumulations are characteristic of hydric soils in wetlands. In addition, phosphorus concentrations are generally lower in ground water than in surface water on the Delmarva Peninsula because the major source of phosphorus is overland flow from agricultural fields. Under reducing conditions, phosphorus becomes mobilized and may be found in concentrations exceeding 1 mg/l in wetlands, an order of magnitude increase over the groundwater concentrations under oxygenated conditions (Denver et al. 2004). The Marshyhope Creek was initially listed on Maryland’s 303(d) list of impaired waters for nutrients. Analysis established that a phosphorus reduction could limit algal blooms. Therefore, limits were established only for phosphorus to decrease the severity of algal blooms and reduce the potential for failing the dissolved oxygen criterion. A nonpoint source allocation of 112.9 kg per month and a point source allocation of 188.2 kg per month have been proposed to ensure that the dissolved oxygen criterion for the Marshyhope Creek will be met. The State of Delaware has been monitoring water quality in the Nanticoke River for over 25 years. According to the Nanticoke watershed total maximum daily load (TMDL), several designated uses including fish and aquatic life, exceptional recreational and ecological significance, and primary contact have not been met because of reduced water quality from eurtrophication, low dissolved oxygen, high bacteria, and high water temperature. A TMDL was developed in 1998 for the watershed and requires several pollutant reduction measures to have the waters fulfill their designated uses. Among these measures are a 30% reduction of total nitrogen and a 50% reduction of total phosphorus from nonpoint sources (DE DNREC 1998). Progress toward meeting the TMDL is being made in the Nanticoke River watershed. At the end of 2004, the latest data available showed that through voluntary implementation of agriculture best management practices, septic system eliminations, regular pumpouts of septic systems, and implementation of storm water practices, the Broad Creek watershed, a subwatershed of the Nanticoke River watershed, achieved approximately 80% of its reduction goal established by the TMDL for total nitrogen and phosphorus. A draft Pollution Control Strategy for the Nanticoke River watershed is expected to be completed in 2007. (DE DNREC 1998). 2.4 Land Use Land use in the Nanticoke watershed is almost equally divided between agriculture (39.2%) and forest (40.9%, Map 3). In the Delaware portion of the watershed the ratio of natural vegetation to
Condition Nanticoke Watershed Wetlands Page 7
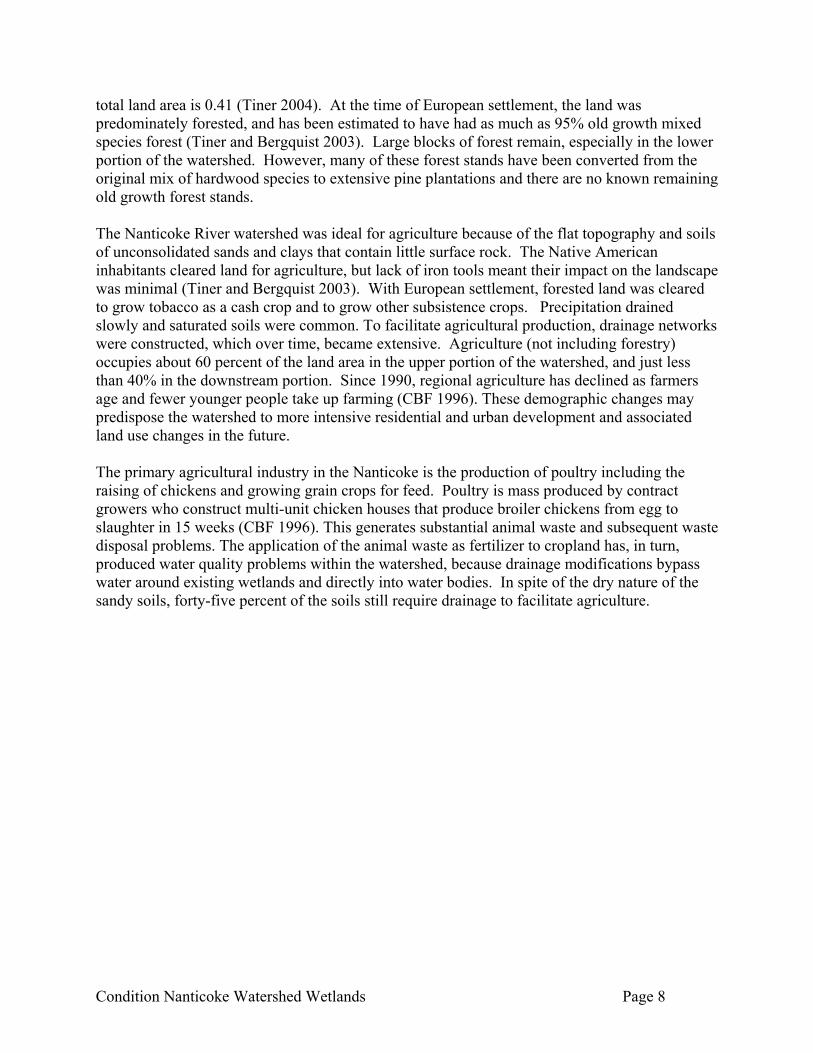
total land area is 0.41 (Tiner 2004). At the time of European settlement, the land was predominately forested, and has been estimated to have had as much as 95% old growth mixed species forest (Tiner and Bergquist 2003). Large blocks of forest remain, especially in the lower portion of the watershed. However, many of these forest stands have been converted from the original mix of hardwood species to extensive pine plantations and there are no known remaining old growth forest stands. The Nanticoke River watershed was ideal for agriculture because of the flat topography and soils of unconsolidated sands and clays that contain little surface rock. The Native American inhabitants cleared land for agriculture, but lack of iron tools meant their impact on the landscape was minimal (Tiner and Bergquist 2003). With European settlement, forested land was cleared to grow tobacco as a cash crop and to grow other subsistence crops. Precipitation drained slowly and saturated soils were common. To facilitate agricultural production, drainage networks were constructed, which over time, became extensive. Agriculture (not including forestry) occupies about 60 percent of the land area in the upper portion of the watershed, and just less than 40% in the downstream portion. Since 1990, regional agriculture has declined as farmers age and fewer younger people take up farming (CBF 1996). These demographic changes may predispose the watershed to more intensive residential and urban development and associated land use changes in the future. The primary agricultural industry in the Nanticoke is the production of poultry including the raising of chickens and growing grain crops for feed. Poultry is mass produced by contract growers who construct multi-unit chicken houses that produce broiler chickens from egg to slaughter in 15 weeks (CBF 1996). This generates substantial animal waste and subsequent waste disposal problems. The application of the animal waste as fertilizer to cropland has, in turn, produced water quality problems within the watershed, because drainage modifications bypass water around existing wetlands and directly into water bodies. In spite of the dry nature of the sandy soils, forty-five percent of the soils still require drainage to facilitate agriculture.
Condition Nanticoke Watershed Wetlands Page 8
Condition Nanticoke Watershed Wetlands Page 9
After traditional agriculture, forestry is the next major extractive land use within the watershed. Large tracts of land have been used for the continuous production of fiber from Loblolly pine (Pinus taeda). The production of pine for fiber (paper pulp) is an accepted use for some wetland classes. With the domestic paper market in decline, significant acreage of these managed pine plantations have transferred to public ownership within the past few years, and the management of these lands is evolving. MD DNR, DNREC and Delaware Department of Agriculture hold stewardship responsibility for these forest lands transferred to public ownership. The entire watershed was home to 77,000 people in 1995, primarily located in a few small towns. The total residential and urban developed land is about 2 percent of the watershed (CBF 1996). The watershed had 0.8 percent impervious surface cover in 1995.
METHODS
The information presented in this report is a compilation of the results of numerous projects. In 1999 and 2000, The Smithsonian Environmental Research Center (SERC) and The Nature Conservancy (TNC) conducted a study to evaluate the condition of flat and riverine wetlands in the Nanticoke River watershed. As part of this effort, level 3 comprehensive assessment methods and level 1 landscape assessment methods were developed and applied to wetlands in the watershed. In 2002 and 2003, to complete the assessment of all nontidal wetlands in the watershed, Maryland Department of Natural Resources (MD DNR) and Delaware Department of Natural Resources and Environmental Control (DE DNREC) collaborated to assess the condition of depressional wetlands. As part of the MD DNR/ DE DNREC project, restored wetlands were also evaluated.
In addition to the field projects, Ralph Tiner with U.S. Fish and Wildlife Service assessed changes in wetland acreage by HGM subclass from pre-colonial period to 1998. A study by DE DNREC and Oregon State University developed an Index of Wetland Condition (IWC) as an alternative reporting format to functions and defined breakpoints for condition classes. All of the above mentioned projects were funded by various U.S. Environmental Protection Agency (EPA) grants through the Regional Assessment and Monitoring Program (REMAP) and the State Wetland Program Development Grant Program.
For the purposes of this report, we present an overview of the wetland acreage change evaluation, assessment model development, site selection, landowner contact and access, data collection, and function and IWC scoring. Detailed descriptions of each of these components can be found in Whigham et al. (2007), Herlihy et al. (2006), Tiner (2005), Rokosch and Jacobs (2004), Whigham et al. (2003), and TNC (2000).
5.1 Determining Changes in Wetland Acreage Historic wetland acreage was determined by Tiner (2005) using U.S. Department of Agriculture Natural Resource Conservation Service soil maps. Hydric soil map units from soil survey data were
Condition Nanticoke Watershed Wetlands Page 10
identified as historic wetlands. This layer was then compared to existing National Wetland Inventory (NWI) data to detect any large wetland complexes that were not identified as hydric soils which were added to the historic coverage. Changes in estuarine wetlands also incorporated assumptions on the historic upstream limit of tidal influence based on an analysis of soil types (Tiner 2005). Present wetland acreage was based on an updated NWI for the watershed using 1998–1:40,000 black and white photography (Tiner 2005). Historic and present wetlands were classified with Cowardin classification system and an expanded set of modifiers for landscape position, landform, water flow path, and waterbody types (LLWW descriptors; Tiner 2005). The landscape position and landform modifiers were then used to classify wetlands into HGM subclasses of flats, riverine, and depressions. 5.2 Site Selection EPA’s Ecological Monitoring and Assessment Program (EMAP) in Corvallis, Oregon, assisted with selecting test and assessment sites using a generalized random tessellation stratified (GRTS) design (Stevens and Olsen 1999, 2000). The sites were selected from a target population of mapped wetlands. For the flats and riverine subclasses, state wetland maps were used except for a portion of the watershed that was not yet updated in MD, where NWI coverage was used. Assessment sites were located at points (lat/long) randomly selected, within wetland area within the watershed so each site had an equal probability of being selected. However, for depressions the updated wetlands layer with HGM modifiers (Tiner et al. 2000, 2001) was used to select sites, and we selected entire wetland polygons because the average depression size was smaller than the required assessment area. Although not part of our target population of depressions, we also sampled 2 farmed and 4 excavated wetlands to provide a general description of wetlands with these types of disturbance. Based on the field observations, there is not a lot of variation among farmed and excavated wetlands so we feel that even a small sample size can provide a general understanding of how these types of wetlands compare to reference standard conditions. Farmed and excavated wetlands were located selected as part of the EMAP sample described above.
Restoration sites were selected from an inventory of restored wetlands in the Nanticoke watershed. We located 47 sites and randomly selected 29 sites using a random number generator. 5.3 Landowner Contact and Site Access Landowner permission was obtained prior to accessing all study sites. Landowners were identified using county tax records. Initial landowner contact was attempted by mailing a packet that included a cover letter providing a brief description of the study goals, methods, and anticipated benefits, as well as a project brochure and a self-addressed reply card requesting landowner permission. If a phone number could be found, the mailing was followed with a phone call to secure permission and discuss details of the sampling visit. Landowners of flats and riverine sites were contacted by TNC, a non-profit agency; landowners of depression sites were contacted by State agency staff (MD DNR or DNREC). The biggest obstacle to gaining access was contacting the landowners. Of the 767 sites to which we attempted to gain access, 87% were located on private property. However, 38% of these landowners were unreachable.
Condition Nanticoke Watershed Wetlands Page 11
When we compared the results for gaining access to private lands between the two studies, the success rates were similar. In the SERC/TNC study, 67% of the private landowners granted site access (TNC 2000) compared to 65% access in the state-run depression study. The organization (i.e. state or private) requesting access appears to be of little importance to the landowners’ decision of permitting access. This is encouraging for states attempting to conduct a study in which the majority of sample sites are located on private property.
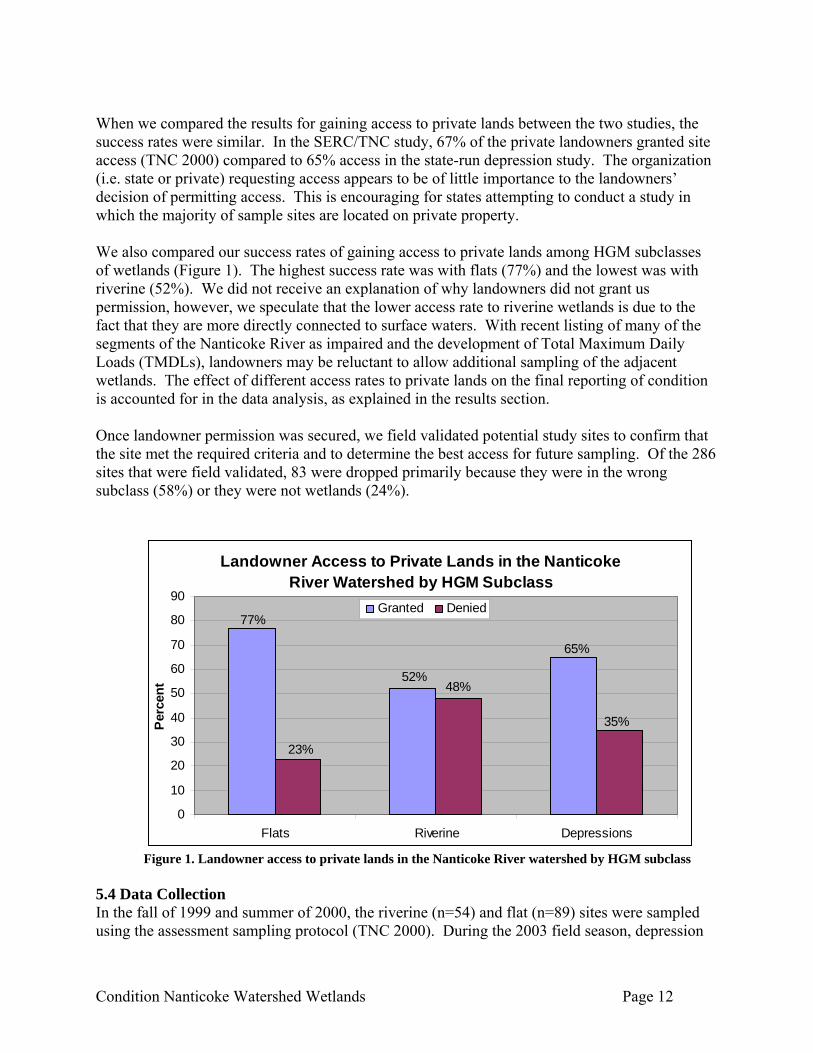
We also compared our success rates of gaining access to private lands among HGM subclasses of wetlands (Figure 1). The highest success rate was with flats (77%) and the lowest was with riverine (52%). We did not receive an explanation of why landowners did not grant us permission, however, we speculate that the lower access rate to riverine wetlands is due to the fact that they are more directly connected to surface waters. With recent listing of many of the segments of the Nanticoke River as impaired and the development of Total Maximum Daily Loads (TMDLs), landowners may be reluctant to allow additional sampling of the adjacent wetlands. The effect of different access rates to private lands on the final reporting of condition is accounted for in the data analysis, as explained in the results section. Once landowner permission was secured, we field validated potential study sites to confirm that the site met the required criteria and to determine the best access for future sampling. Of the 286 sites that were field validated, 83 were dropped primarily because they were in the wrong subclass (58%) or they were not wetlands (24%).
Landowner Access to Private Lands in the Nanticoke River Watershed by HGM Subclass
0
10
20
30
40
50
60
70
80
90
Flats Riverine Depressions
Perc
ent
Granted Denied77%
23%
52%48%
65%
35%
Figure 1. Landowner access to private lands in the Nanticoke River watershed by HGM subclass
5.4 Data Collection In the fall of 1999 and summer of 2000, the riverine (n=54) and flat (n=89) sites were sampled using the assessment sampling protocol (TNC 2000). During the 2003 field season, depression
Condition Nanticoke Watershed Wetlands Page 12
(n=48) sites were sampled using the DE Comprehensive Assessment Method (Rokosch and Jacobs 2004). Restored wetlands were assessed in 2003 using the same method used for the natural depression wetlands (Rokosch and Jacobs 2004). At each site, detailed information on the vegetation structure and species composition, soils, hydrology, dead wood, topography, and surrounding land use was collected to score the variables listed in Table 1. The time to sample a site with a field crew of 4-5 people ranged between 3-5 hours.
5.5 Assessment Model Development Hydrogeomorphic (HGM) models were developed for flats, riverine, and depressional wetlands to assess the condition of wetlands in the Nanticoke watershed. These models assess level of function relative to reference standard condition (i.e., a wetland that is least altered or disturbed by human activities). For each model, a group of wetland experts selected reference sites, evaluated variables and formulated functional condition indices (FCI). Reference sites span the range of anthropogenic alterations and ecological variation from highly disturbed to minimally impacted and include reference standard sites. The flat and riverine models were developed by an expert team lead by SERC composed of scientists from East Carolina University, EPA, TNC, SERC, U.S. Fish and Wildlife Service, and Virginia Institute of Marine Science (VIMS). The depressional model was developed by the Mid-Atlantic Depression Workgroup which was a team of wetland experts from U.S.D.A. Natural Resource Conservation Service (NRCS), SERC, EPA, DE DNREC, MD DNR, and VIMS.
Expert teams selected 25 flats, 19 riverine, and 26 depressional wetlands as reference sites. All the flat and riverine reference sites were located in the Nanticoke watershed, however, because of the low density of depressions in the Nanticoke watershed, depression reference sites were located across the outer Coastal Plain on the Eastern shore of Maryland and Delaware. The depression wetland subclass was the only wetland type that had more than one dominant plant community (forested, scrub-shrub, and emergent). Therefore, depression reference sites were selected over a range of human disturbance for each community. At each reference site, detailed data were collected for vegetation, soils, topography, hydrology and large downed wood in a 1-ha assessment area and surrounding buffer characteristics (TNC 2000, Rokosch and Jacobs 2004).
Data from the reference sites were used to develop models that were used to assess function and condition of depression, flat, and riverine wetlands. The models use metrics, variables, and functional condition indices (FCI).
Metric - a field measure that quantifies a site characteristic (e.g., tree basal area, species diversity) Variable - a metric that has been normalized on a scale of 0 to 100 to reflect a disturbance gradient (0 being highly disturbed and 100 being equal to a reference standard site) based on reference data. Variables can be scaled categorically or continuously based on the nature of the data Functional Condition Index (FCI) – a mathematical formula developed by expert scientists and constructed of variables that represents the capacity of a wetland to perform a function compared to reference standard condition. FCI scores range from 0 – 100 (0 being highly disturbed and 100 being equal to a reference standard site).
Condition Nanticoke Watershed Wetlands Page 13
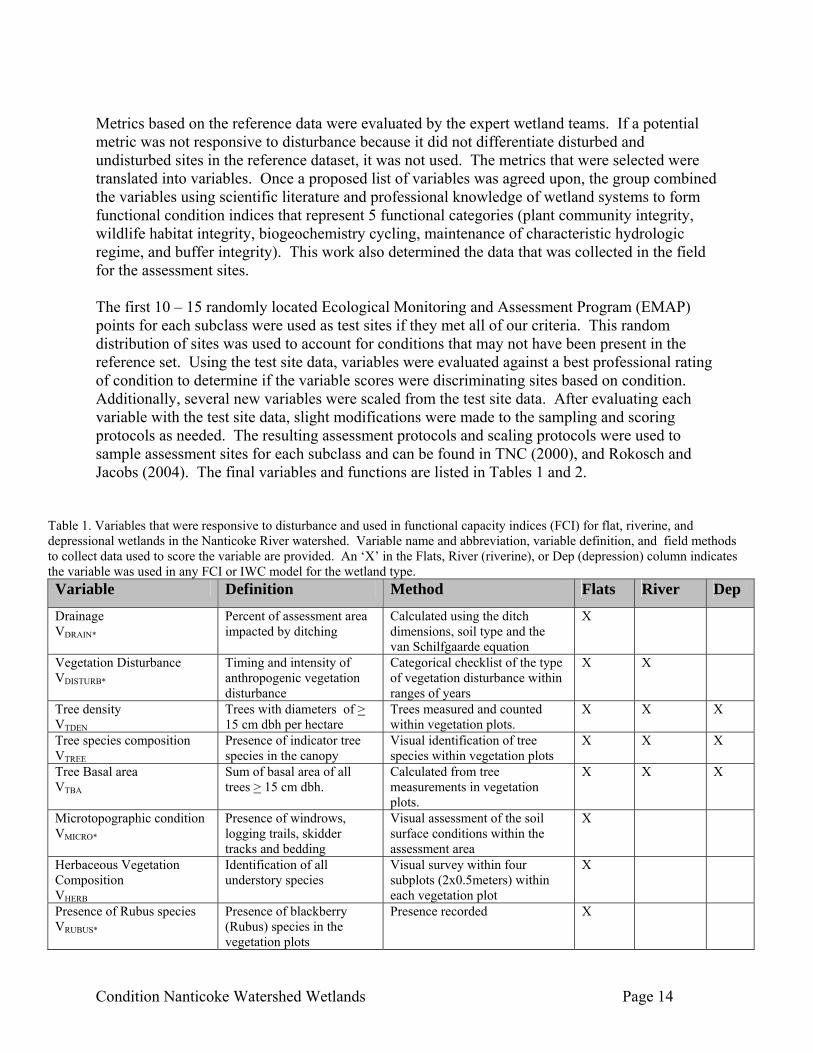
Metrics based on the reference data were evaluated by the expert wetland teams. If a potential metric was not responsive to disturbance because it did not differentiate disturbed and undisturbed sites in the reference dataset, it was not used. The metrics that were selected were translated into variables. Once a proposed list of variables was agreed upon, the group combined the variables using scientific literature and professional knowledge of wetland systems to form functional condition indices that represent 5 functional categories (plant community integrity, wildlife habitat integrity, biogeochemistry cycling, maintenance of characteristic hydrologic regime, and buffer integrity). This work also determined the data that was collected in the field for the assessment sites.
The first 10 – 15 randomly located Ecological Monitoring and Assessment Program (EMAP) points for each subclass were used as test sites if they met all of our criteria. This random distribution of sites was used to account for conditions that may not have been present in the reference set. Using the test site data, variables were evaluated against a best professional rating of condition to determine if the variable scores were discriminating sites based on condition. Additionally, several new variables were scaled from the test site data. After evaluating each variable with the test site data, slight modifications were made to the sampling and scoring protocols as needed. The resulting assessment protocols and scaling protocols were used to sample assessment sites for each subclass and can be found in TNC (2000), and Rokosch and Jacobs (2004). The final variables and functions are listed in Tables 1 and 2.
Table 1. Variables that were responsive to disturbance and used in functional capacity indices (FCI) for flat, riverine, and depressional wetlands in the Nanticoke River watershed. Variable name and abbreviation, variable definition, and field methods to collect data used to score the variable are provided. An ‘X’ in the Flats, River (riverine), or Dep (depression) column indicates the variable was used in any FCI or IWC model for the wetland type. Variable Definition Method Flats River Dep Drainage VDRAIN*
Percent of assessment area impacted by ditching
Calculated using the ditch dimensions, soil type and the van Schilfgaarde equation
X
Vegetation Disturbance VDISTURB*
Timing and intensity of anthropogenic vegetation disturbance
Categorical checklist of the type of vegetation disturbance within ranges of years
X X
Tree density VTDEN
Trees with diameters of > 15 cm dbh per hectare
Trees measured and counted within vegetation plots.
X X X
Tree species composition VTREE
Presence of indicator tree species in the canopy
Visual identification of tree species within vegetation plots
X X X
Tree Basal area VTBA
Sum of basal area of all trees > 15 cm dbh.
Calculated from tree measurements in vegetation plots.
X X X
Microtopographic condition VMICRO*
Presence of windrows, logging trails, skidder tracks and bedding
Visual assessment of the soil surface conditions within the assessment area
X
Herbaceous Vegetation Composition VHERB
Identification of all understory species
Visual survey within four subplots (2x0.5meters) within each vegetation plot
X
Presence of Rubus species VRUBUS*
Presence of blackberry (Rubus) species in the vegetation plots
Presence recorded X
Condition Nanticoke Watershed Wetlands Page 14

Shrub density VSHRUBDEN
Number of shrubs per hectare > 0.5 meters high (>1m high in depressions)
Calculated from number of shrubs within vegetation plots
X X X
Shrub Species Composition VSHRUBSPP
Presence of indicator shrub species
Visual identification of shrub species within vegetation plots
X
Anthropogenic sediment input VFILL*
Percent of assessment area covered by fill
Visual estimation by cover categories.
X
Standing dead trees VSNAG
Density of dead trees per hectare >15 cm dbh and ≥3 meters in height.
Calculated from counts of dead trees in assessment area.
X
Buffer vegetation near assessment area VNEARBUFFER
Vegetation cover type within 20 meters of the edge of floodplain
Visual determination X
Buffer vegetation away from assessment area VFARBUFFER
Vegetation cover type within 20 to 100 meters of the edge of flood- plain
Visual determination X
Floodplain condition VFLOODPLAIN
Presence of ditching, filling or excavation within the floodplain.
Visual determination X
Invasive species VINVASIVE*
Percent cover of invasive species
Visual survey within four subplots (2x0.5meters) within each vegetation plot
X
Stream condition outside assessment area VSTREAMOUT
Condition of stream channel within 500 meters of assessment area
Visual assessment of stream channel within 500m of assessment area
X
Stream condition inside assessment area VSTREAMIN
Condition of stream channel within 100 meters of assessment area
Visual assessment of stream channel within assessment area
X
Sapling species VSAPLING
Presence of sapling indicator species
Visual identification of species in 1/50th ha vegetation plots
X
Hydrologic alterations VHYDROALT*
Presence of ditches, excavation, filling and farming.
Visual determination within the assessment area
X
Distance to nearest road from wetland center VDIST ROADS
Straight line distance from wetland center to nearest mapped road.
Measured from GIS X
Percent cover natural land use VLAND%NATVEG
Percent of surrounding landscape, upland zone, within 240 meters of center of assessment area in natural land use (forest, wetland or open water)
Measured from GIS X
Sapling Density VSAPDEN
Density of trees less than 7.5 cm dbh and > 1 meter high, in the forested zone.
Calculated from number of saplings in vegetation plots
X
Percent native VNATIVE
Percent of understory species that are non-native
Visual survey within four subplots (2x0.5meters) within each vegetation plot
X
Coarse woody debris volume VWETCWD
Volume in cubic meters of coarse woody debris > 15 cm dbh in forested zone.
Measured all downed wood within vegetation plots
X
Canopy Tree basal area – Buffer plot
Basal area of all trees > 15 cm dbh in the forested buffer plots.
Calculated from measurements of trees > 15cm in buffer plots
X
Condition Nanticoke Watershed Wetlands Page 15
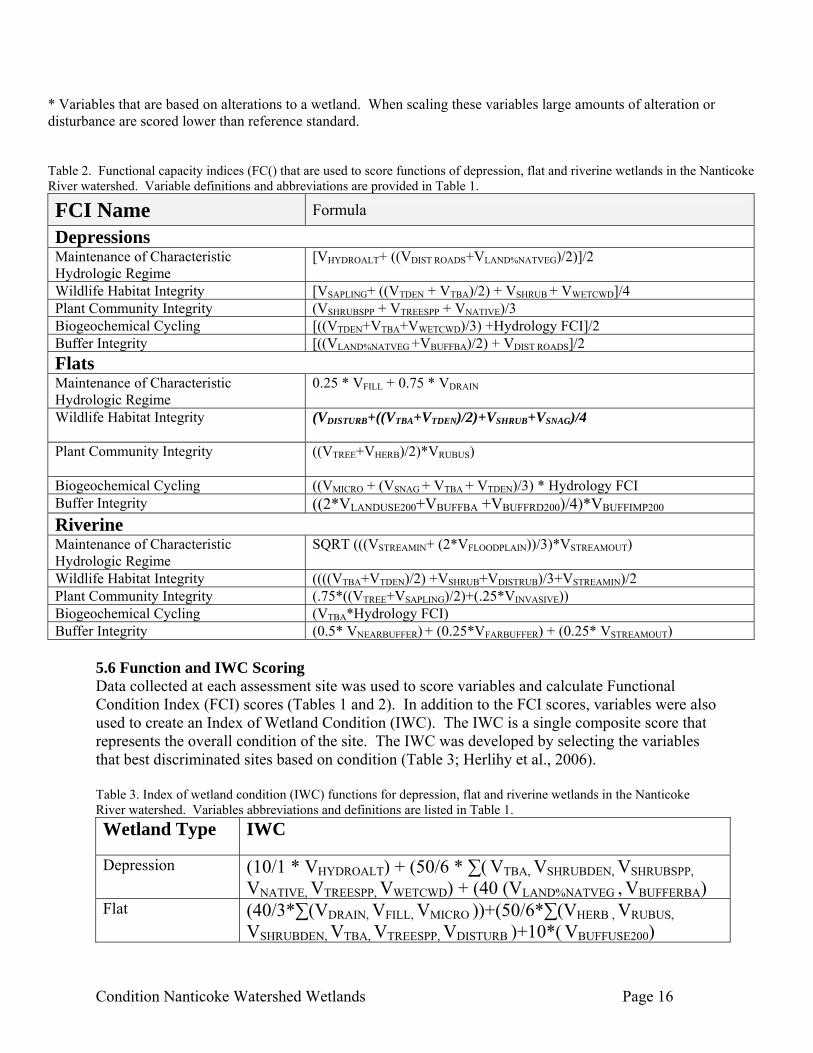
* Variables that are based on alterations to a wetland. When scaling these variables large amounts of alteration or disturbance are scored lower than reference standard.
Table 2. Functional capacity indices (FC() that are used to score functions of depression, flat and riverine wetlands in the Nanticoke River watershed. Variable definitions and abbreviations are provided in Table 1.
FCI Name Formula
Depressions Maintenance of Characteristic Hydrologic Regime
[VHYDROALT+ ((VDIST ROADS+VLAND%NATVEG)/2)]/2
Wildlife Habitat Integrity [VSAPLING+ ((VTDEN + VTBA)/2) + VSHRUB + VWETCWD]/4 Plant Community Integrity (VSHRUBSPP + VTREESPP + VNATIVE)/3 Biogeochemical Cycling [((VTDEN+VTBA+VWETCWD)/3) +Hydrology FCI]/2 Buffer Integrity [((VLAND%NATVEG +VBUFFBA)/2) + VDIST ROADS]/2 Flats Maintenance of Characteristic Hydrologic Regime
0.25 * VFILL + 0.75 * VDRAIN
Wildlife Habitat Integrity (VDISTURB+((VTBA+VTDEN)/2)+VSHRUB+VSNAG)/4
Plant Community Integrity ((VTREE+VHERB)/2)*VRUBUS)
Biogeochemical Cycling ((VMICRO + (VSNAG + VTBA + VTDEN)/3) * Hydrology FCI Buffer Integrity ((2*VLANDUSE200+VBUFFBA +VBUFFRD200)/4)*VBUFFIMP200
Riverine Maintenance of Characteristic Hydrologic Regime
SQRT (((VSTREAMIN+ (2*VFLOODPLAIN))/3)*VSTREAMOUT)
Wildlife Habitat Integrity ((((VTBA+VTDEN)/2) +VSHRUB+VDISTRUB)/3+VSTREAMIN)/2 Plant Community Integrity (.75*((VTREE+VSAPLING)/2)+(.25*VINVASIVE)) Biogeochemical Cycling (VTBA*Hydrology FCI) Buffer Integrity (0.5* VNEARBUFFER) + (0.25*VFARBUFFER) + (0.25* VSTREAMOUT)
5.6 Function and IWC Scoring Data collected at each assessment site was used to score variables and calculate Functional Condition Index (FCI) scores (Tables 1 and 2). In addition to the FCI scores, variables were also used to create an Index of Wetland Condition (IWC). The IWC is a single composite score that represents the overall condition of the site. The IWC was developed by selecting the variables that best discriminated sites based on condition (Table 3; Herlihy et al., 2006). Table 3. Index of wetland condition (IWC) functions for depression, flat and riverine wetlands in the Nanticoke River watershed. Variables abbreviations and definitions are listed in Table 1. Wetland Type IWC
Depression (10/1 * VHYDROALT) + (50/6 * ∑( VTBA, VSHRUBDEN, VSHRUBSPP, VNATIVE, VTREESPP, VWETCWD) + (40 (VLAND%NATVEG , VBUFFERBA)
Flat (40/3*∑(VDRAIN, VFILL, VMICRO ))+(50/6*∑(VHERB , VRUBUS, VSHRUBDEN, VTBA, VTREESPP, VDISTURB )+10*( VBUFFUSE200)
Condition Nanticoke Watershed Wetlands Page 16
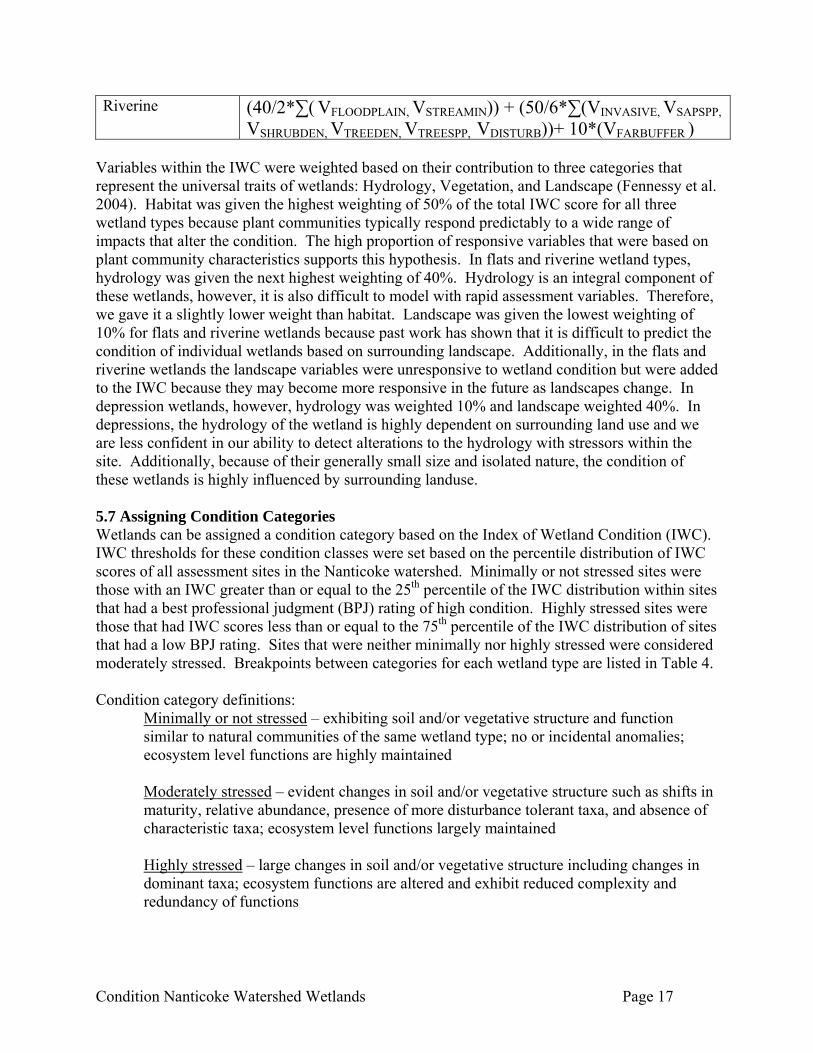
Riverine (40/2*∑( VFLOODPLAIN, VSTREAMIN)) + (50/6*∑(VINVASIVE, VSAPSPP, VSHRUBDEN, VTREEDEN, VTREESPP, VDISTURB))+ 10*(VFARBUFFER )
Variables within the IWC were weighted based on their contribution to three categories that represent the universal traits of wetlands: Hydrology, Vegetation, and Landscape (Fennessy et al. 2004). Habitat was given the highest weighting of 50% of the total IWC score for all three wetland types because plant communities typically respond predictably to a wide range of impacts that alter the condition. The high proportion of responsive variables that were based on plant community characteristics supports this hypothesis. In flats and riverine wetland types, hydrology was given the next highest weighting of 40%. Hydrology is an integral component of these wetlands, however, it is also difficult to model with rapid assessment variables. Therefore, we gave it a slightly lower weight than habitat. Landscape was given the lowest weighting of 10% for flats and riverine wetlands because past work has shown that it is difficult to predict the condition of individual wetlands based on surrounding landscape. Additionally, in the flats and riverine wetlands the landscape variables were unresponsive to wetland condition but were added to the IWC because they may become more responsive in the future as landscapes change. In depression wetlands, however, hydrology was weighted 10% and landscape weighted 40%. In depressions, the hydrology of the wetland is highly dependent on surrounding land use and we are less confident in our ability to detect alterations to the hydrology with stressors within the site. Additionally, because of their generally small size and isolated nature, the condition of these wetlands is highly influenced by surrounding landuse. 5.7 Assigning Condition Categories Wetlands can be assigned a condition category based on the Index of Wetland Condition (IWC). IWC thresholds for these condition classes were set based on the percentile distribution of IWC scores of all assessment sites in the Nanticoke watershed. Minimally or not stressed sites were those with an IWC greater than or equal to the 25th percentile of the IWC distribution within sites that had a best professional judgment (BPJ) rating of high condition. Highly stressed sites were those that had IWC scores less than or equal to the 75th percentile of the IWC distribution of sites that had a low BPJ rating. Sites that were neither minimally nor highly stressed were considered moderately stressed. Breakpoints between categories for each wetland type are listed in Table 4. Condition category definitions:
Minimally or not stressed – exhibiting soil and/or vegetative structure and function similar to natural communities of the same wetland type; no or incidental anomalies; ecosystem level functions are highly maintained Moderately stressed – evident changes in soil and/or vegetative structure such as shifts in maturity, relative abundance, presence of more disturbance tolerant taxa, and absence of characteristic taxa; ecosystem level functions largely maintained Highly stressed – large changes in soil and/or vegetative structure including changes in dominant taxa; ecosystem functions are altered and exhibit reduced complexity and redundancy of functions
Condition Nanticoke Watershed Wetlands Page 17

Table 4. Condition categories for depression, flat, and riverine nontidal wetlands in the Nanticoke River watershed as determined by index of wetland condition (IWC) scores.
Wetland Type Highly stressed IWC Scores
Moderately Stressed IWC
Scores
Minimally or Not Stressed IWC
Scores Depression <50.3 > 50.3 and < 82.7 > 82.7
Flat < 63.9 > 63.9 and < 88.5 > 88.5
Riverine < 53.8 > 53.8 and < 85.3 > 85.3
Condition Nanticoke Watershed Wetlands Page 18
Condition Nanticoke Watershed Wetlands Page 19
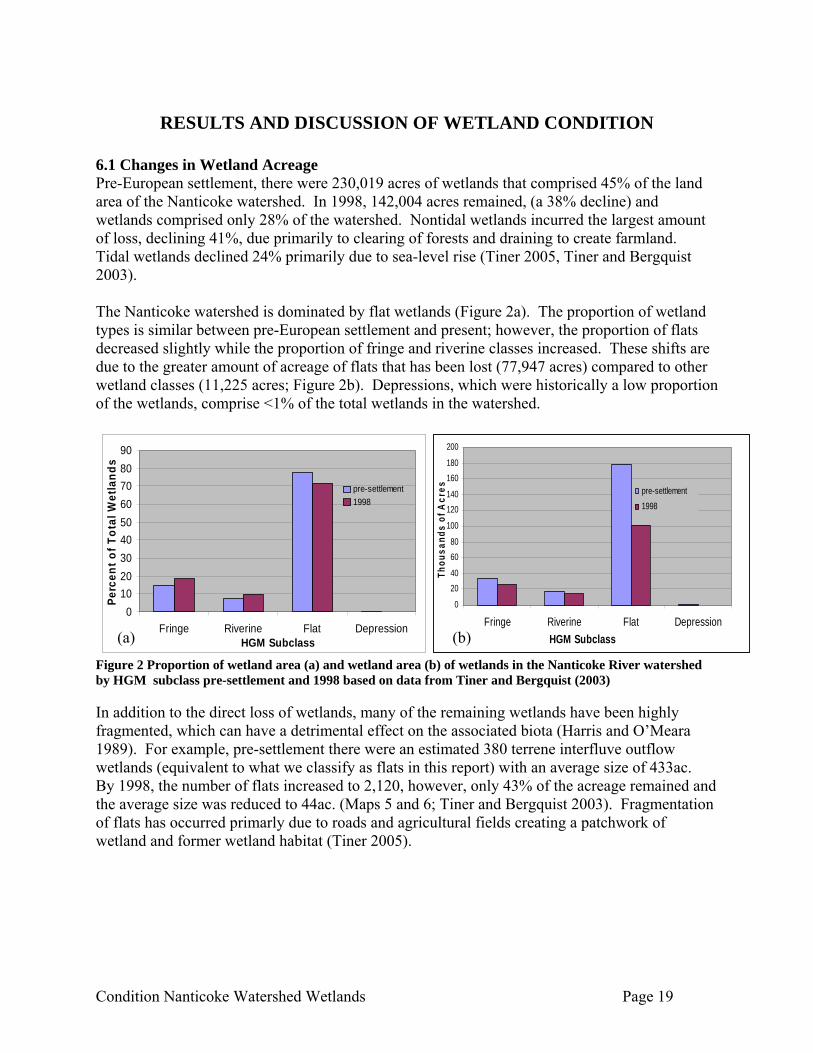
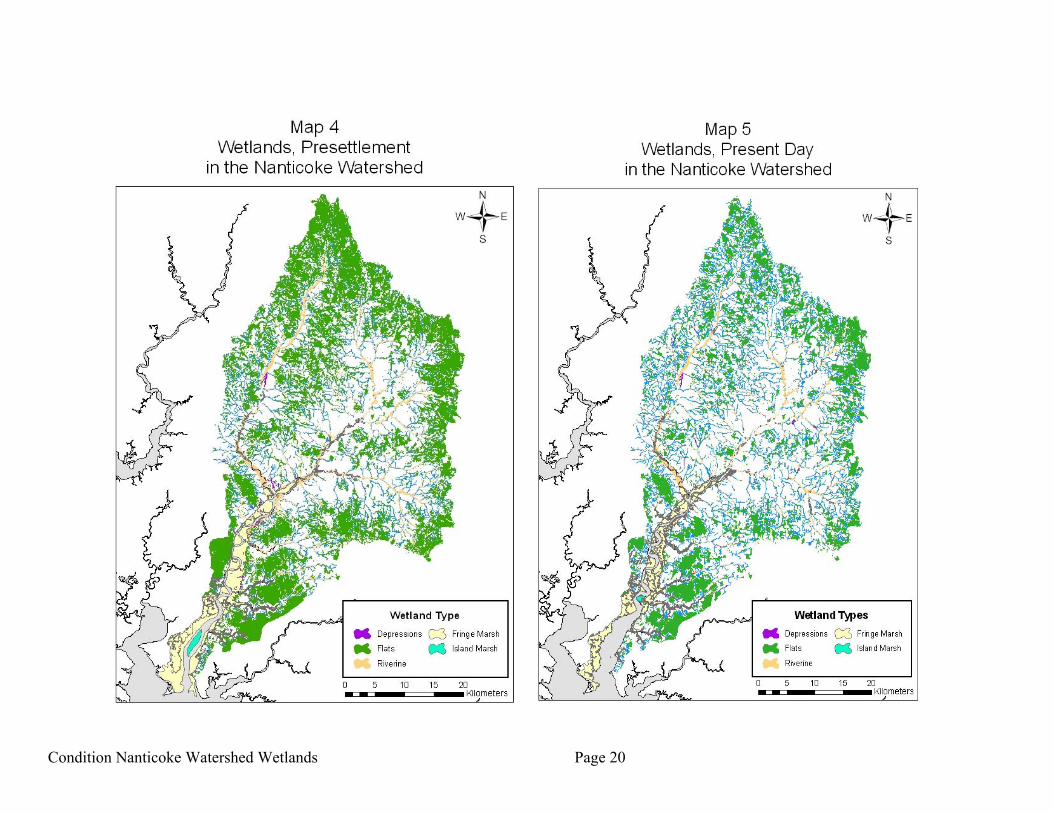
RESULTS AND DISCUSSION OF WETLAND CONDITION 6.1 Changes in Wetland Acreage Pre-European settlement, there were 230,019 acres of wetlands that comprised 45% of the land area of the Nanticoke watershed. In 1998, 142,004 acres remained, (a 38% decline) and wetlands comprised only 28% of the watershed. Nontidal wetlands incurred the largest amount of loss, declining 41%, due primarily to clearing of forests and draining to create farmland. Tidal wetlands declined 24% primarily due to sea-level rise (Tiner 2005, Tiner and Bergquist 2003). The Nanticoke watershed is dominated by flat wetlands (Figure 2a). The proportion of wetland types is similar between pre-European settlement and present; however, the proportion of flats decreased slightly while the proportion of fringe and riverine classes increased. These shifts are due to the greater amount of acreage of flats that has been lost (77,947 acres) compared to other wetland classes (11,225 acres; Figure 2b). Depressions, which were historically a low proportion of the wetlands, comprise <1% of the total wetlands in the watershed.
0102030405060708090
Fringe Riverine Flat DepressionHGM Subclass
Perc
ent o
f Tot
al W
etla
nds
pre-settlement1998
0
2040
6080
100
120140
160180
200
Fringe Riverine Flat
Thou
sand
s of
Acr
es
DepressionHGM Subclass
pre-settlement1998
Figure 2 Proportion of wetland area (a) and wetland area (b) of wetlands in the Nanticoke River watershed
addition to the direct loss of wetlands, many of the remaining wetlands have been highly
by HGM subclass pre-settlement and 1998 based on data from Tiner and Bergquist (2003) Infragmented, which can have a detrimental effect on the associated biota (Harris and O’Meara 1989). For example, pre-settlement there were an estimated 380 terrene interfluve outflow wetlands (equivalent to what we classify as flats in this report) with an average size of 433ac. By 1998, the number of flats increased to 2,120, however, only 43% of the acreage remained and the average size was reduced to 44ac. (Maps 5 and 6; Tiner and Bergquist 2003). Fragmentation of flats has occurred primarly due to roads and agricultural fields creating a patchwork of wetland and former wetland habitat (Tiner 2005).
(a) (b)
Condition Nanticoke Watershed Wetlands Page 20
6.2 Present Wetland Condition When evaluating the current status of wetland resources on the watershed level, it is important to not only consider losses in acreage, such as those presented with the historic and present landscape profiles, but also to understand the condition of the resource that remains. Lacking information on the condition of existing wetlands, resource managers and planners usually assume that the remaining wetland resources are performing their inherent functions at levels equal to wetlands without alteration. However, this is generally not the case. It is important to consider the stressors affecting the condition of the resource, as well as the acreage lost, in order to develop meaningful land use plans and restoration strategies. To conduct the condition assessment, the nontidal wetlands in the Nanticoke River watershed were categorized by hydrogeomorphic (HGM) subclass. HGM subclasses define each wetland type by landscape position and waterflow dynamics. The status of wetlands in the watershed was assessed using HGM functions and an overall index of wetland condition (IWC). Functions, IWC formulas and variable definitions are provided in Tables 1-3 in Chapter 5 (Methods). Function, IWC and variable scores range from 0 to 100, with 100 being equal to our reference standard sites (minimally disturbed) and 0 denoting a highly disturbed condition. Scores between 0 and 100 can be interpreted as functioning at that percent of a reference standard site (i.e., a site with a score of 80 is functioning at 80% of reference standard). The information collected describes the general condition of the wetlands based on the IWC and a detailed description of specific function performance. The HGM based approach provides simple methods to determine what components of the wetland are altered or exhibiting signs of stress. For example, if the IWC score is lower than reference standard, the FCI scores can be used to evaluate which wetland functions are scoring lower. More specific information can also be obtained by examining the variables that compose the IWC or a FCI score. Because variables are directly linked to field data, the variable scores will identify field metrics that are deviating from reference standard conditions and causing lower wetland function and IWC scores. For example, a site has a low Habitat Integrity FCI score. An examination of the variables shows the tree density and tree basal area variable scores are low, and reviewing the field metrics reveals that the variable scores are low because there is low density and basal area of trees due to a recent forestry operation. Evaluating wetland types separately provides information about the relation of wetland condition and landscape position. All of this information can then be used to develop meaningful restoration and protection strategies. Results are presented at the site and population level. Site level results are discussed by summarizing the range of FCI scores that were found in sampled sites of an HGM subclass (i.e., Habitat Integrity FCI scores ranged from 22 to 98). Population level results are presented using weighted means and standard deviations of wetlands in each wetland type (flat, riverine, and depression). Population results were determined using random site data and then adjusting for sampling bias and extrapolating to the watershed level. These results represent the total area of flat and riverine wetlands and the total number of depressional wetlands in the entire watershed. Continuous distribution function (CDF) graphs are used to illustrate the distribution of IWC scores for the population of wetlands in each subclass.
Condition Nanticoke Watershed Wetlands Page 21
6.2.1. Flat Wetland Condition in the Nanticoke Watershed Flats are the dominant wetland type in the Nanticoke watershed, comprising 71% of the wetlands in the watershed (Tiner and Bergquist 2003). They occur in areas where there is little slope over an extended area and the ground water table usually rises close to the surface during early winter to late spring. Precipitation accumulates on the soil surface until it can evaporate or is absorbed into the soil. Clay layers beneath the typically sandy soils retard the vertical movement of water and can keep some flat wetlands saturated for extended periods. Flat wetlands predominate on the periphery of the watershed and the broad, flat regions between the major sub-basins or interfluves (Map 6). ` Flats in the Nanticoke watershed span the range of condition from highly disturbed to minimally disturbed (i.e. equal to reference standard condition; Figure 3) with an average IWC of 71.9 ± 17.4. Sixteen percent (16%) of the population exhibited minimal or no stressors, 50% were moderately stressed, and 34% were highly stressed (Figure 4). The average FCI score for all functions was below reference standard condition. Plant Community Integrity was the most impacted function at an average of only 51% of reference standard condition. The Buffer Integrity function performed the highest with an average of 90% of reference standard condition. Thus, they remain in a fairly intact landscape position to allow for successful restoration. However, Tiner evaluated wetland buffers in the Delaware portion of the watershed and found that only 36% of the areas within 100m of wetlands was natural vegetation. One reason for the difference between our results and Tiner’s buffer results is that we evaluated the buffer surrounding our assessment sites which could be composed of surrounding wetland or upland. Conversely, Tiner assessed upland buffers surrounding entire wetland polygons. Therefore, some flat wetland area such as interiors of large forest blocks, but the areas on the edge of these forest blocks are not being buffered as well by the surrounding uplands due to changes in land use. There were no significant differences in wetland function scores among the sub-basins in the watershed (Whigham et al. 2007). Dominant stressors impacting wetlands and lowering condition were hydrology alterations due to ditching and vegetative alterations due to forestry practices, which alter species structure and composition.
Condition Nanticoke Watershed Wetlands Page 22
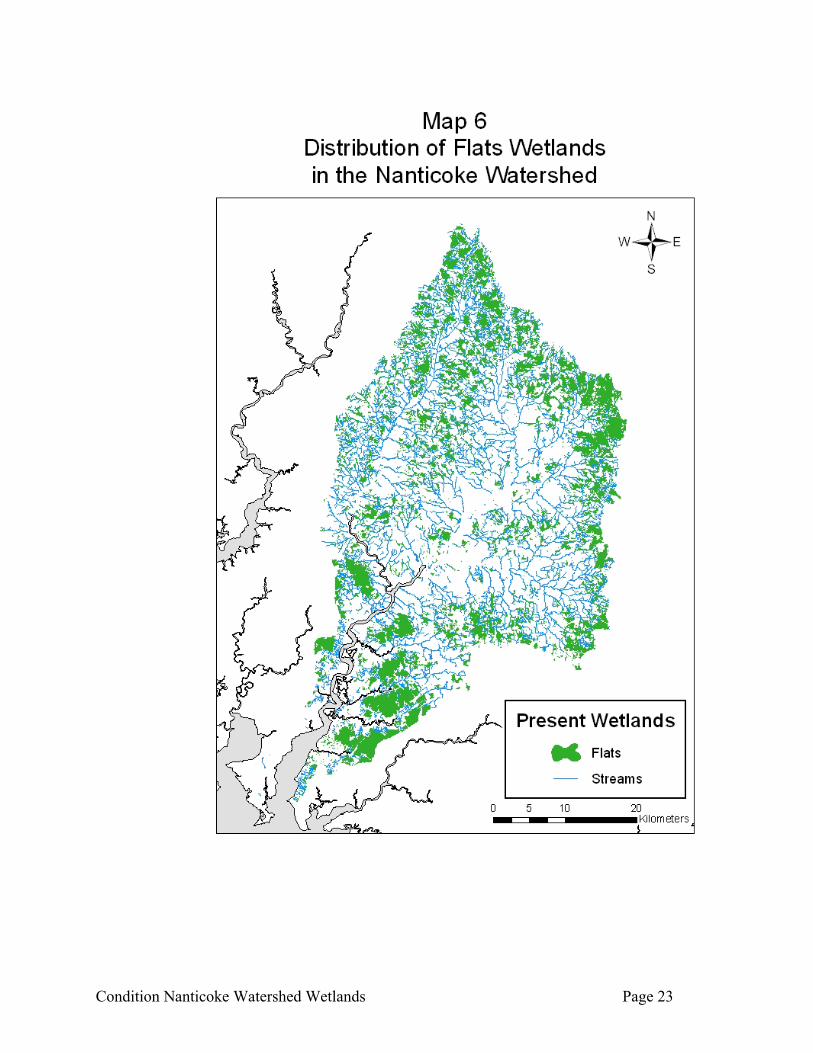
Condition Nanticoke Watershed Wetlands Page 23
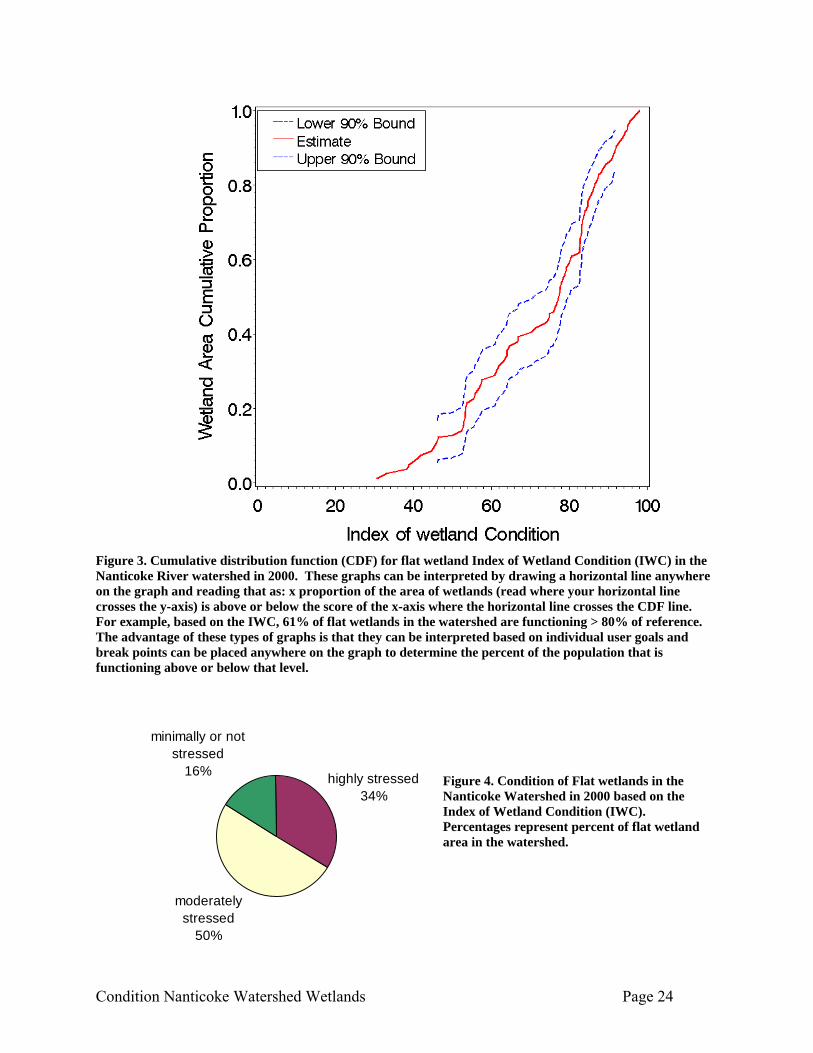
Figure 3. Cumulative distribution function (CDF) for flat wetland Index of Wetland Condition (IWC) in the Nanticoke River watershed in 2000. These graphs can be interpreted by drawing a horizontal line anywhere on the graph and reading that as: x proportion of the area of wetlands (read where your horizontal line crosses the y-axis) is above or below the score of the x-axis where the horizontal line crosses the CDF line. For example, based on the IWC, 61% of flat wetlands in the watershed are functioning > 80% of reference. The advantage of these types of graphs is that they can be interpreted based on individual user goals and break points can be placed anywhere on the graph to determine the percent of the population that is functioning above or below that level.
moderately stressed
50%
minimally or not stressed
16% highly stressed34%
Figure 4. Condition of Flat wetlands in the Nanticoke Watershed in 2000 based on the Index of Wetland Condition (IWC). Percentages represent percent of flat wetlandarea in the w
atershed.
Condition Nanticoke Watershed Wetlands Page 24

The average hydrology FCI score was 76.0 ± 5.1 and ranged from 20.0 to 100. Sites with no evidence of either filling or draining scored 100. Forty-seven percent of flats had some hydrologic alteration that reduced their functional capacity index scores. Ditching to drain flats for agriculture and forestry practices is widespread in the Nanticoke River watershed (Map 2). Weller et al. (2007) found that 94% of the flats in the Nanticoke watershed had an excavated ditch as the nearest surface water (not including ponds) and Tiner (2005) estimated that 87% of the area of flats has altered stream flow maintenance function due to ditching. However, it is not fully understood how extensive ditching has changed the hydroperiod and ponding of water in flats. We could not find a reference flat in the Nanticoke watershed that had no ditches in the surrounding landscape, hence it is possible that the hydrology of our reference standard sites have been impacted by ditching. If this is the case, we likely underestimated the effect of ditching on these systems (Whigham et al. 2007). The average biogeochemical cycling and storage FCI score was 52.8 ± 5.1 and ranged from 98.0 to 6.3. There was a nearly linear distribution of FCI scores across the population with no apparent thresholds (Whigham et al. 2007). The biogeochemistry function is modeled using the hydrology function and the maturity of tree cover. The combination of intact hydrology and a mature forest is indicative of reference standard conditions that promote optimum nutrient cycling, sediment retention and carbon storage in a wetland. All sites showed some degree of reduction in their level of function, and only 8% of the flats in the watershed were functioning at >90% of reference standard condition. Silviculture practices are common in the flats and have large effects on the biogeochemistry function by restricting the maximum age of the forest cover, and altering both microtopography and soil structure. The average habitat FCI score, which is composed of indicators of vegetative structure, was 63.4 ± 4.3 and ranged from 10.0 to 100. Only 16% of the area of flats wetlands was functioning at > 90% of reference standard condition while the rest showed greater amounts of alteration. The average plant community FCI is composed of variables which assess species composition of the vegetative community, and was lower than the habitat FCI with an average score of 50.6 ± 6.1. The primary stressor reducing habitat and plant community function in the Nanticoke is silvicultural practices. Most silviculture practiced in the Nanticoke produces pine plantations by clearcutting the native mixed hardwood forest, and either planting loblolly pine or encouraging the regeneration of a pine-dominated stand through the suppression of broad leaf species. Therefore, silviculture practices affect both forest structure (assessed with the habitat function) and species composition (assessed with the plant community function) of flats (Whigham et al. 2007). Weller et al. (2007) found that the presence of evergreen forest in the surrounding landscape was associated with lower condition of flat wetlands. The buffer integrity of flats was assessed by evaluating the surrounding landuse and road density within 200m of the assessment area. The average FCI was 90.4 ± 12.9 and ranged from 36.0 to 100. Sixty-six percent of the population is functioning at >90% of reference standard indicating that, in general, flats are well buffered from roads and developed landuses. However, this landscape function does not account for ditches outside of the assessment area and conversion of the forested buffers to pine plantations.
Condition Nanticoke Watershed Wetlands Page 25
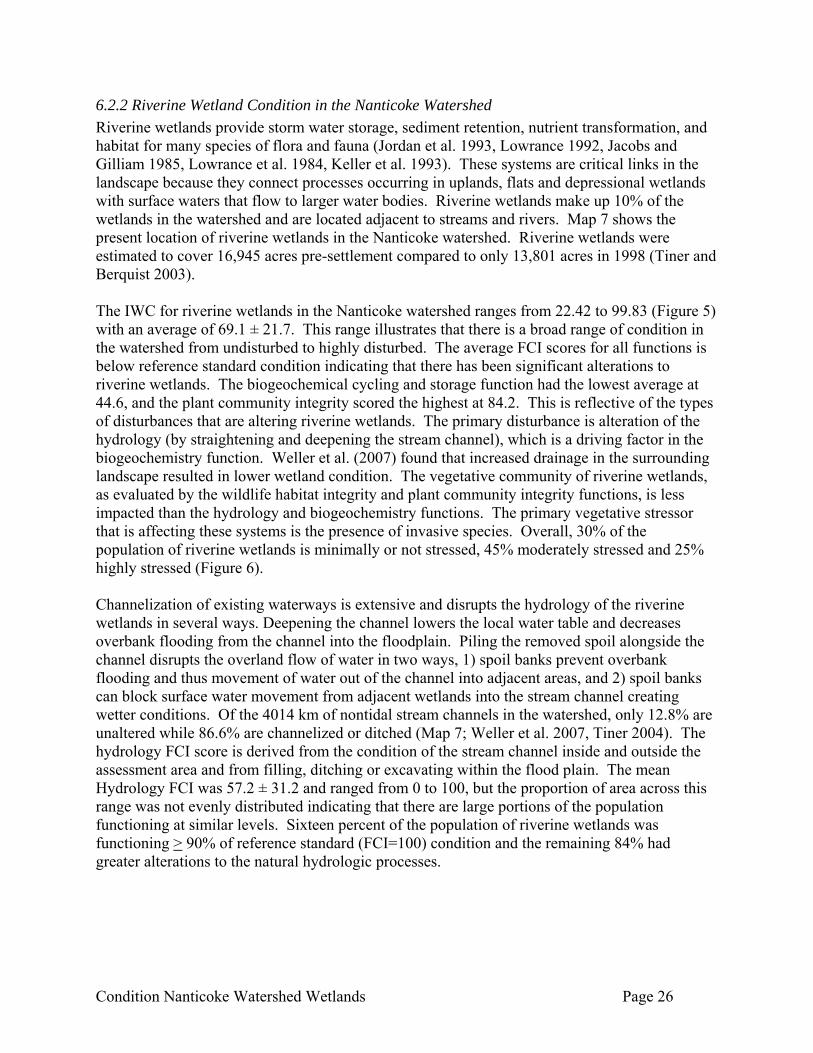
6.2.2 Riverine Wetland Condition in the Nanticoke Watershed Riverine wetlands provide storm water storage, sediment retention, nutrient transformation, and habitat for many species of flora and fauna (Jordan et al. 1993, Lowrance 1992, Jacobs and Gilliam 1985, Lowrance et al. 1984, Keller et al. 1993). These systems are critical links in the landscape because they connect processes occurring in uplands, flats and depressional wetlands with surface waters that flow to larger water bodies. Riverine wetlands make up 10% of the wetlands in the watershed and are located adjacent to streams and rivers. Map 7 shows the present location of riverine wetlands in the Nanticoke watershed. Riverine wetlands were estimated to cover 16,945 acres pre-settlement compared to only 13,801 acres in 1998 (Tiner and Berquist 2003). The IWC for riverine wetlands in the Nanticoke watershed ranges from 22.42 to 99.83 (Figure 5) with an average of 69.1 ± 21.7. This range illustrates that there is a broad range of condition in the watershed from undisturbed to highly disturbed. The average FCI scores for all functions is below reference standard condition indicating that there has been significant alterations to riverine wetlands. The biogeochemical cycling and storage function had the lowest average at 44.6, and the plant community integrity scored the highest at 84.2. This is reflective of the types of disturbances that are altering riverine wetlands. The primary disturbance is alteration of the hydrology (by straightening and deepening the stream channel), which is a driving factor in the biogeochemistry function. Weller et al. (2007) found that increased drainage in the surrounding landscape resulted in lower wetland condition. The vegetative community of riverine wetlands, as evaluated by the wildlife habitat integrity and plant community integrity functions, is less impacted than the hydrology and biogeochemistry functions. The primary vegetative stressor that is affecting these systems is the presence of invasive species. Overall, 30% of the population of riverine wetlands is minimally or not stressed, 45% moderately stressed and 25% highly stressed (Figure 6). Channelization of existing waterways is extensive and disrupts the hydrology of the riverine wetlands in several ways. Deepening the channel lowers the local water table and decreases overbank flooding from the channel into the floodplain. Piling the removed spoil alongside the channel disrupts the overland flow of water in two ways, 1) spoil banks prevent overbank flooding and thus movement of water out of the channel into adjacent areas, and 2) spoil banks can block surface water movement from adjacent wetlands into the stream channel creating wetter conditions. Of the 4014 km of nontidal stream channels in the watershed, only 12.8% are unaltered while 86.6% are channelized or ditched (Map 7; Weller et al. 2007, Tiner 2004). The hydrology FCI score is derived from the condition of the stream channel inside and outside the assessment area and from filling, ditching or excavating within the flood plain. The mean Hydrology FCI was 57.2 ± 31.2 and ranged from 0 to 100, but the proportion of area across this range was not evenly distributed indicating that there are large portions of the population functioning at similar levels. Sixteen percent of the population of riverine wetlands was functioning > 90% of reference standard (FCI=100) condition and the remaining 84% had greater alterations to the natural hydrologic processes.
Condition Nanticoke Watershed Wetlands Page 26

Condition Nanticoke Watershed Wetlands Page 27
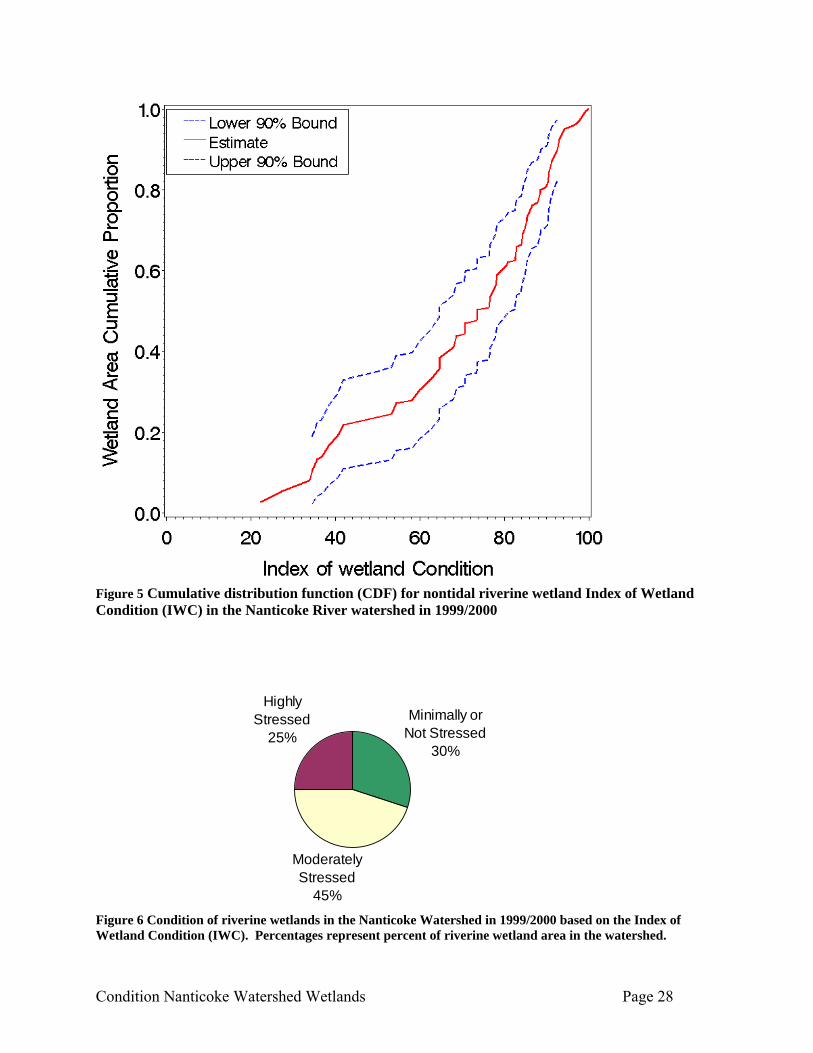
Figure 5 Cumulative distribution function (CDF) for nontidal riverine wetland Index of Wetland Condition (IWC) in the Nanticoke River watershed in 1999/2000
Minimally or Not Stressed
30%
Moderately Stressed
45%
Highly Stressed
25%
Figure 6 Condition of riverine wetlands in the Nanticoke Watershed in 1999/2000 based on the Index of Wetland Condition (IWC). Percentages represent percent of riverine wetland area in the watershed.
Condition Nanticoke Watershed Wetlands Page 28

The average biogeochemistry FCI in the Nanticoke River watershed was 44.6 ± 30.5 and ranged from 1.0 to 100% of reference standard condition. FCI scores were relatively evenly distributed over the population. Only 7% of the population was functioning at levels >90% of reference standard condition, while the remainder showed a range of condition with 10% of the population functioning at <10% of reference standard. The average habitat FCI for riverine wetlands, which measures the vegetative structure of wetlands and stream condition compared to reference sites, was 64.2 ± 30.4. Habitat FCIs ranged from 10.0 to 100. The average plant community FCI for riverine wetlands was 84.2 ± 16.4 and is based on the plant species composition of riverine wetlands compared to reference sites. Both functions had breakpoints around 80%; 56% of the population is functioning above 80% of reference for habitat, and 70% of the population is functioning above 80% of reference for plant community. The Buffer Integrity FCI, which measured the condition of the surrounding upland within 100m of the floodplain and the stream condition adjacent to the assessment area, averaged 68.4 ± 16.1. The buffer integrity FCI ranged from 26.7 to 100% of reference standard condition. Only 10% of the population of riverine wetlands in the Nanticoke watershed are functioning at >90% of reference standard condition, which illustrates the scarcity of intact buffers to protect these systems. In the Delaware portion of the watershed, the ratio of natural vegetation within 100m of either side of the stream to the total land area within 100m of the stream was 0.59, which is similar to our findings, however this includes riverine wetlands that are buffering the stream channel along larger streams and rivers. These results reflect the major stressors that are impacting riverine wetlands in the Nanticoke watershed, including hydrologic alterations through ditching, channelization of natural stream channels, and piling of spoil in the wetland, which subsequently isolates these wetlands from the stream. The habitat and plant community in riverine wetlands are in better condition compared to flats because farming and timber harvest is difficult in riverine wetlands. However, there was some evidence of disturbance in the plant community such as the presence of invasive species and shifts in the species composition. Invasive species are pervasive in riverine wetlands throughout the Nanticoke watershed even at our reference standard sites, which resulted in slightly higher plant community scores than if we were able to scale our models to a pristine wetland without any invasives. Furthermore, the dominant vegetation in these wetlands is comprised of facultative species that are adapted to withstand varying hydroperiods. Therefore, we may not be detecting the full impact of hydrology alterations on the vegetative community, but over time the changes in hydrology may lead to larger changes in species composition (Whigham et al. 2007).
6.2.3. Depressional Wetland Condition in the Nanticoke Watershed Depressions are low lying areas in the landscape that collect water from direct precipitation and surface runoff from the surrounding land. The dominant movement of water is vertical and includes inputs through precipitation, groundwater discharge and surface runoff, and outputs via evapotranspiration and seepage into the groundwater. However, many depressions also receive groundwater discharge, contribute groundwater recharge via lateral movements from the
Condition Nanticoke Watershed Wetlands Page 29
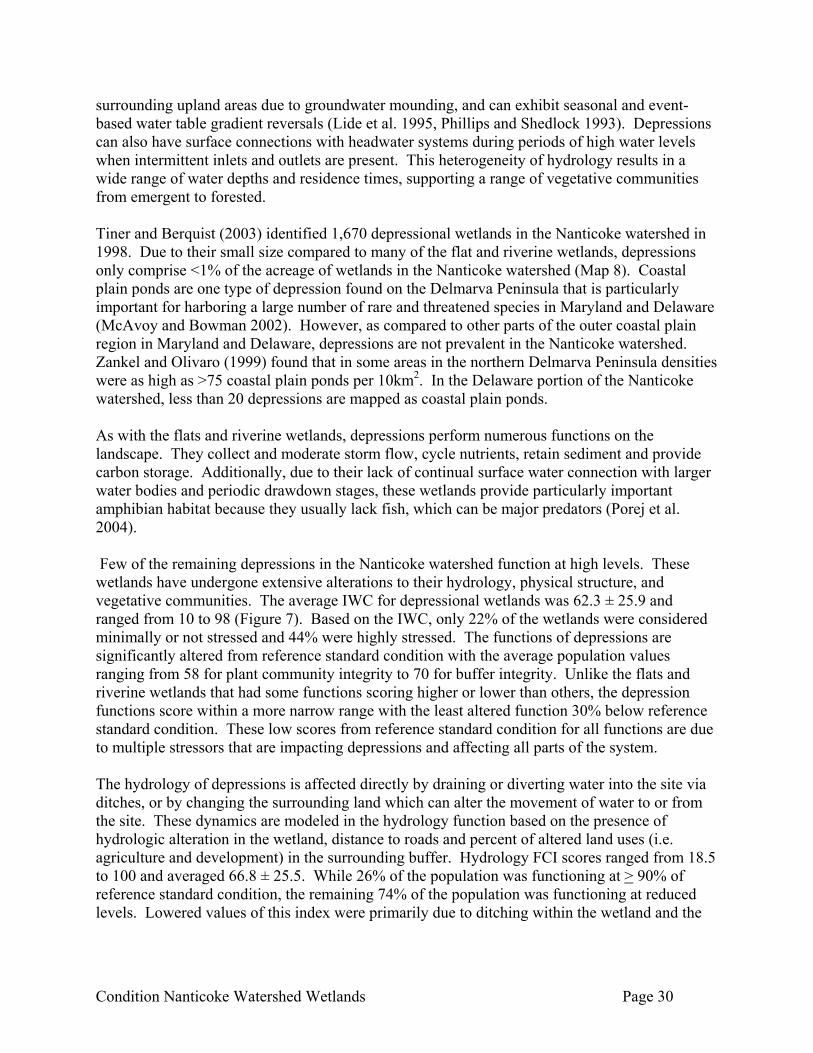
surrounding upland areas due to groundwater mounding, and can exhibit seasonal and event-based water table gradient reversals (Lide et al. 1995, Phillips and Shedlock 1993). Depressions can also have surface connections with headwater systems during periods of high water levels when intermittent inlets and outlets are present. This heterogeneity of hydrology results in a wide range of water depths and residence times, supporting a range of vegetative communities from emergent to forested. Tiner and Berquist (2003) identified 1,670 depressional wetlands in the Nanticoke watershed in 1998. Due to their small size compared to many of the flat and riverine wetlands, depressions only comprise <1% of the acreage of wetlands in the Nanticoke watershed (Map 8). Coastal plain ponds are one type of depression found on the Delmarva Peninsula that is particularly important for harboring a large number of rare and threatened species in Maryland and Delaware (McAvoy and Bowman 2002). However, as compared to other parts of the outer coastal plain region in Maryland and Delaware, depressions are not prevalent in the Nanticoke watershed. Zankel and Olivaro (1999) found that in some areas in the northern Delmarva Peninsula densities were as high as >75 coastal plain ponds per 10km2. In the Delaware portion of the Nanticoke watershed, less than 20 depressions are mapped as coastal plain ponds. As with the flats and riverine wetlands, depressions perform numerous functions on the landscape. They collect and moderate storm flow, cycle nutrients, retain sediment and provide carbon storage. Additionally, due to their lack of continual surface water connection with larger water bodies and periodic drawdown stages, these wetlands provide particularly important amphibian habitat because they usually lack fish, which can be major predators (Porej et al. 2004). Few of the remaining depressions in the Nanticoke watershed function at high levels. These wetlands have undergone extensive alterations to their hydrology, physical structure, and vegetative communities. The average IWC for depressional wetlands was 62.3 ± 25.9 and ranged from 10 to 98 (Figure 7). Based on the IWC, only 22% of the wetlands were considered minimally or not stressed and 44% were highly stressed. The functions of depressions are significantly altered from reference standard condition with the average population values ranging from 58 for plant community integrity to 70 for buffer integrity. Unlike the flats and riverine wetlands that had some functions scoring higher or lower than others, the depression functions score within a more narrow range with the least altered function 30% below reference standard condition. These low scores from reference standard condition for all functions are due to multiple stressors that are impacting depressions and affecting all parts of the system. The hydrology of depressions is affected directly by draining or diverting water into the site via ditches, or by changing the surrounding land which can alter the movement of water to or from the site. These dynamics are modeled in the hydrology function based on the presence of hydrologic alteration in the wetland, distance to roads and percent of altered land uses (i.e. agriculture and development) in the surrounding buffer. Hydrology FCI scores ranged from 18.5 to 100 and averaged 66.8 ± 25.5. While 26% of the population was functioning at > 90% of reference standard condition, the remaining 74% of the population was functioning at reduced levels. Lowered values of this index were primarily due to ditching within the wetland and the
Condition Nanticoke Watershed Wetlands Page 30

Condition Nanticoke Watershed Wetlands Page 31

Figure 7 Cumulative distribution function (CDF) for depressional wetland Index of Wetland Condition (IWC) in the Nanticoke River watershed in 2003
Miminally or not stressed
22%
Moderately stressed
34%
Highly stressed44%
Figure 8 Condition of depressional wetlands in the Nanticoke Watershed in 2003 based on the Index of Wetland Condition (IWC). Percentages represent number of depressional wetlands in the watershed
Condition Nanticoke Watershed Wetlands Page 32

presence of high percentages of agriculture in the surrounding landscape. The presence of agriculture in the surrounding landscape is an indicator of the presence of altered hydrology, which may either divert water away from the wetland through ditches or center pivot irrigation systems, or increase water into the wetland via surface runoff and contribute to higher evapotransporation in the wetland due to elevated water temperatures. The Biogeochemistry function, which is composed of metrics for tree size, large downed wood, and hydrology averaged 64.5 ± 23.3. Scores ranged from 24.6 to 100 with only 15% of the population functioning >90% of reference standard. Lower levels are due to alterations in the forested overstory in addition to hydrologic alterations. The wildlife habitat integrity function, which is composed of vegetative structural variables including tree, sapling, and shrub density, tree size, and large downed wood, and the plant community integrity function, which is comprised of metrics measuring the occurrence of characteristic species of shrubs, trees, and under story, had similar averages: 59.3 ± 28.9 for wildlife habitat integrity and 57.6 ± 28.5 for plant community integrity. Both functions exhibited a full range of scores across the population, however, only 13% of the population for habitat and 19% of the population for plant community was functioning >90% of reference standard. The remainder of the population was functioning at lower levels due to vegetative alterations in the wetlands. Vegetative stressors included both physical removal of vegetation and the occurrence of invasive species. The buffer integrity FCI averaged 69.9± 27.4 and ranged from 12.0 to 100. FCI values reflect the extent of natural vegetation, maturity of forest in the surrounding landscape and distance to the nearest road. Modified land uses and the presence of roads adversely impact habitat for amphibians and small mammals, which rely on surrounding upland for portions of their lifecycle and can promote the spread of non native and invasive plants (Haig et al. 1998, Hermann et al. 2005, Kolozsvary et al. 1999, Findlay and Houlahan 1996). Twenty-four percent of depressions were functioning at >90% of reference standard condition, however, the remaining 76% of depression were functioning at lower levels.
6.2.4. Farmed and excavated wetlands In the Nanticoke watershed, there are 3,527ac. of farmed wetlands and 108 ac. of excavated wetlands (Tiner and Bergquist 2003). Although these wetland types were excluded from this study’s target population, we sampled 2 farmed wetlands and 4 excavated wetlands to gain a general understanding of their function compared to reference. Despite the small number of sampling sites, these sites are representative of farmed and excavated wetlands in the watershed because the variability among sites is small due to multiple stressors having large impacts on the sites. Several programs are available to restore wetlands in agricultural settings (USDA Conservation Reserve Program and Wildlife Enhancement Program, and USFWS Partners for Wildlife Program), so having a baseline condition from which to measure change is valuable to assess the impact of these programs.
Condition Nanticoke Watershed Wetlands Page 33
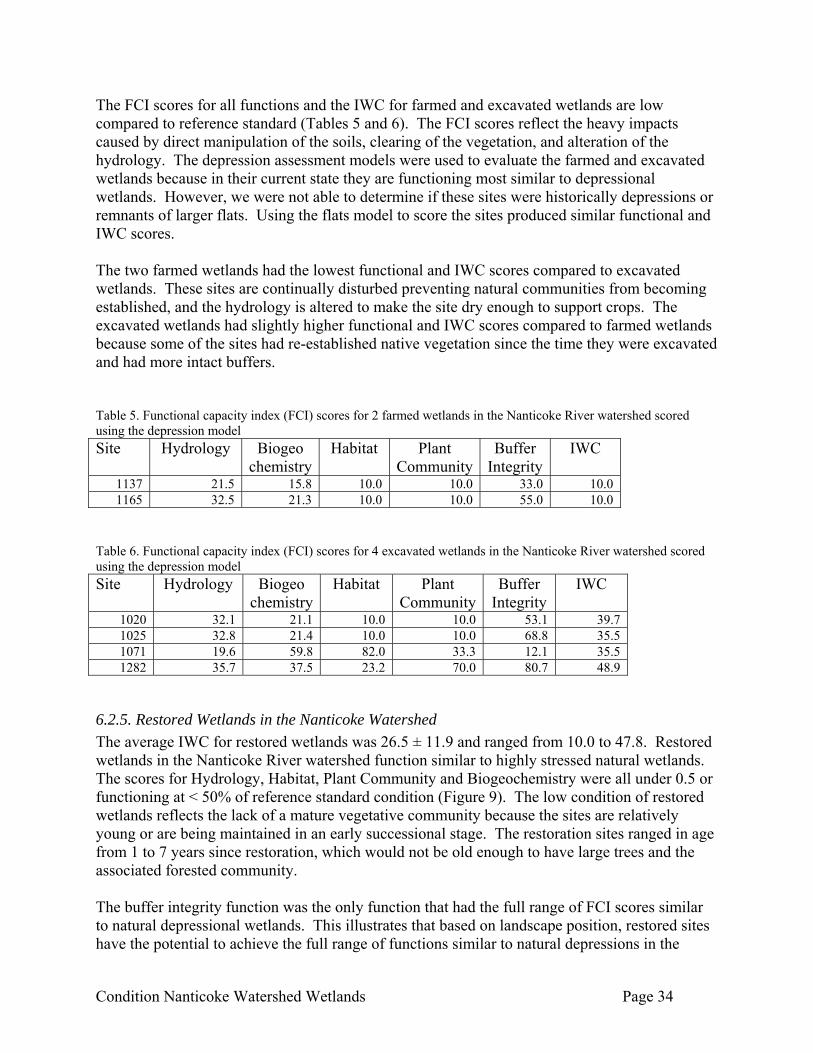
The FCI scores for all functions and the IWC for farmed and excavated wetlands are low compared to reference standard (Tables 5 and 6). The FCI scores reflect the heavy impacts caused by direct manipulation of the soils, clearing of the vegetation, and alteration of the hydrology. The depression assessment models were used to evaluate the farmed and excavated wetlands because in their current state they are functioning most similar to depressional wetlands. However, we were not able to determine if these sites were historically depressions or remnants of larger flats. Using the flats model to score the sites produced similar functional and IWC scores. The two farmed wetlands had the lowest functional and IWC scores compared to excavated wetlands. These sites are continually disturbed preventing natural communities from becoming established, and the hydrology is altered to make the site dry enough to support crops. The excavated wetlands had slightly higher functional and IWC scores compared to farmed wetlands because some of the sites had re-established native vegetation since the time they were excavated and had more intact buffers. Table 5. Functional capacity index (FCI) scores for 2 farmed wetlands in the Nanticoke River watershed scored using the depression model Site Hydrology Biogeo
chemistry Habitat Plant
CommunityBuffer
IntegrityIWC
1137 21.5 15.8 10.0 10.0 33.0 10.0 1165 32.5 21.3 10.0 10.0 55.0 10.0
Table 6. Functional capacity index (FCI) scores for 4 excavated wetlands in the Nanticoke River watershed scored using the depression model Site Hydrology Biogeo
chemistry Habitat Plant
CommunityBuffer
Integrity IWC
1020 32.1 21.1 10.0 10.0 53.1 39.7 1025 32.8 21.4 10.0 10.0 68.8 35.5 1071 19.6 59.8 82.0 33.3 12.1 35.5 1282 35.7 37.5 23.2 70.0 80.7 48.9
6.2.5. Restored Wetlands in the Nanticoke Watershed The average IWC for restored wetlands was 26.5 ± 11.9 and ranged from 10.0 to 47.8. Restored wetlands in the Nanticoke River watershed function similar to highly stressed natural wetlands. The scores for Hydrology, Habitat, Plant Community and Biogeochemistry were all under 0.5 or functioning at < 50% of reference standard condition (Figure 9). The low condition of restored wetlands reflects the lack of a mature vegetative community because the sites are relatively young or are being maintained in an early successional stage. The restoration sites ranged in age from 1 to 7 years since restoration, which would not be old enough to have large trees and the associated forested community. The buffer integrity function was the only function that had the full range of FCI scores similar to natural depressional wetlands. This illustrates that based on landscape position, restored sites have the potential to achieve the full range of functions similar to natural depressions in the
Condition Nanticoke Watershed Wetlands Page 34
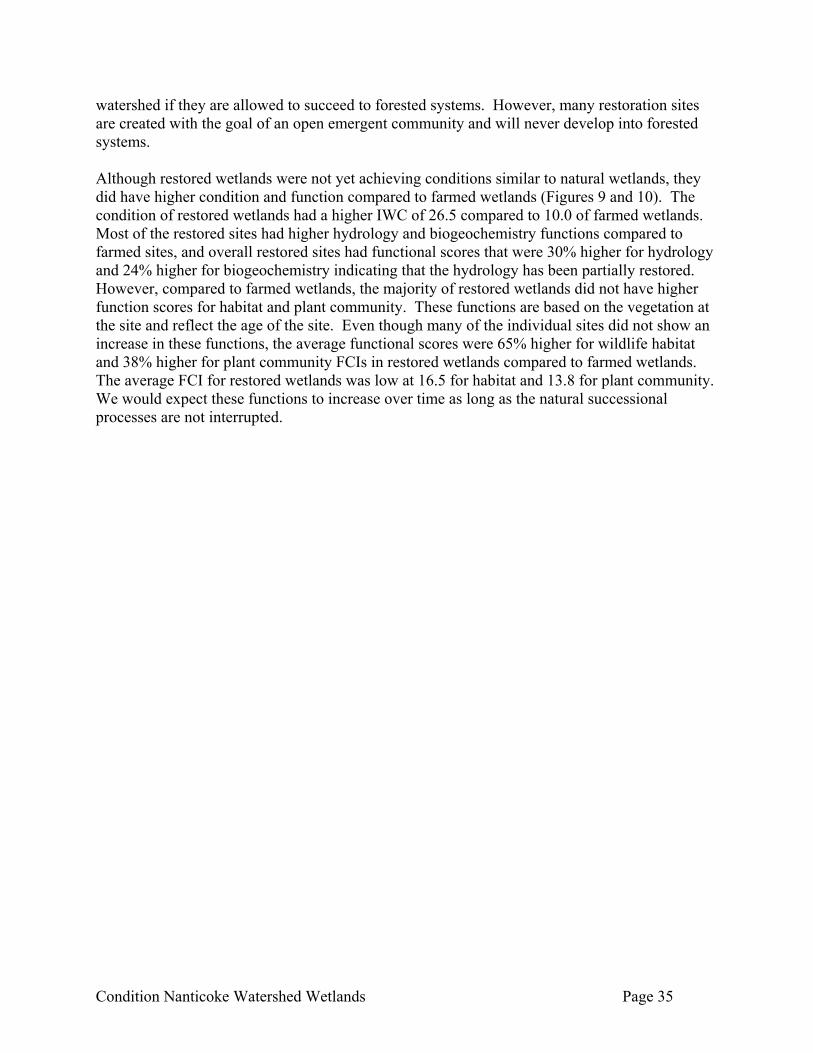
watershed if they are allowed to succeed to forested systems. However, many restoration sites are created with the goal of an open emergent community and will never develop into forested systems. Although restored wetlands were not yet achieving conditions similar to natural wetlands, they did have higher condition and function compared to farmed wetlands (Figures 9 and 10). The condition of restored wetlands had a higher IWC of 26.5 compared to 10.0 of farmed wetlands. Most of the restored sites had higher hydrology and biogeochemistry functions compared to farmed sites, and overall restored sites had functional scores that were 30% higher for hydrology and 24% higher for biogeochemistry indicating that the hydrology has been partially restored. However, compared to farmed wetlands, the majority of restored wetlands did not have higher function scores for habitat and plant community. These functions are based on the vegetation at the site and reflect the age of the site. Even though many of the individual sites did not show an increase in these functions, the average functional scores were 65% higher for wildlife habitat and 38% higher for plant community FCIs in restored wetlands compared to farmed wetlands. The average FCI for restored wetlands was low at 16.5 for habitat and 13.8 for plant community. We would expect these functions to increase over time as long as the natural successional processes are not interrupted.
Condition Nanticoke Watershed Wetlands Page 35
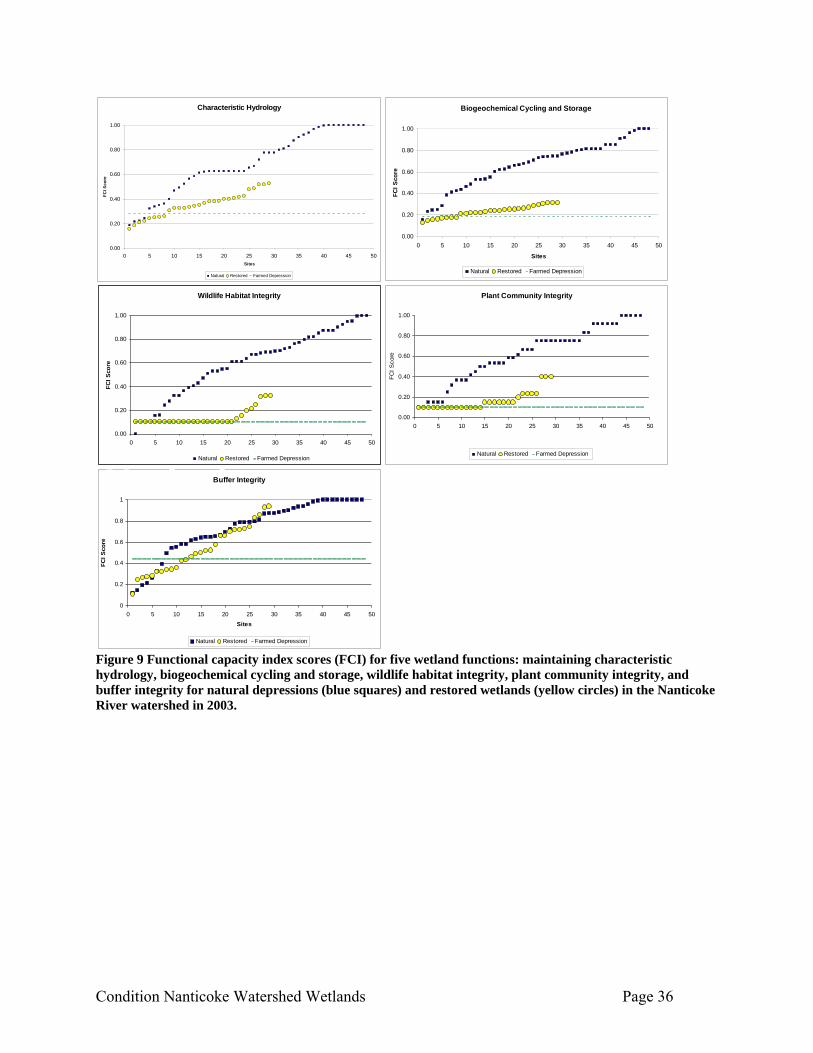
Characteristic Hydrology
0.00
0.20
0.40
0.60
0.80
1.00
0 5 10 15 20 25 30 35 40 45 50Sites
FCI S
core
Natural Restored Farmed Depression
Biogeochemical Cycling and Storage
0.00
0.20
0.40
0.60
0.80
1.00
0 5 10 15 20 25 30 35 40 45 50
Sites
FCI S
core
Natural Restored Farmed Depression
Wildlife Habitat Integrity
0.00
0.20
0.40
0.60
0.80
1.00
0 5 10 15 20 25 30 35 40 45 50
FCI S
core
Na ltura Restored Farmed Depression
Plant Community Integrity
0.00
0.20
0.40
0.60
0.80
1.00
0 5 10 15 20 25 30 35 40 45 50
FCI S
core
Natural Restored Farmed Depression
Buffer Integrity
0
0.2
0.4
0.6
0.8
0 5 10 15 20 25 30 35 40 45 50Sites
FCI S
core
1
Natural Restored Farmed Depression
H d l
Figure 9 Functional capacity index scores (FCI) for five wetland functions: maintaining characteristic hydrology, biogeochemical cycling and storage, wildlife habitat integrity, plant community integrity, and buffer integrity for natural depressions (blue squares) and restored wetlands (yellow circles) in the Nanticoke River watershed in 2003.
Condition Nanticoke Watershed Wetlands Page 36
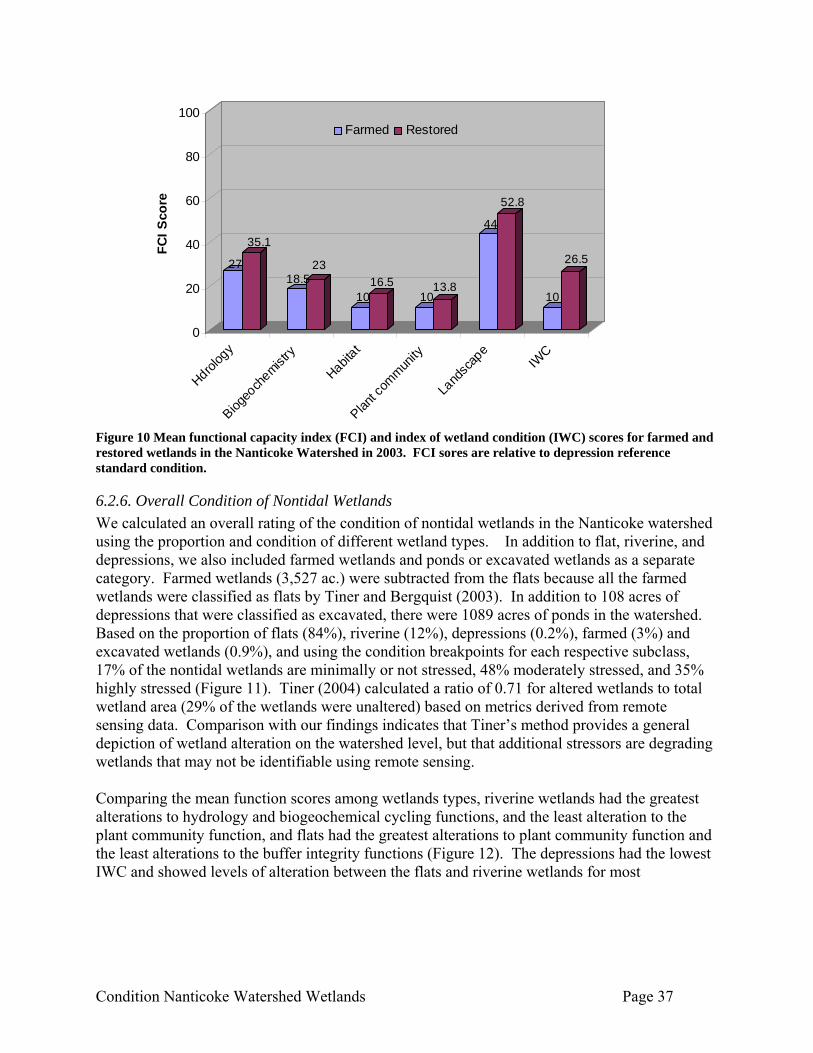
27
35.1
18.523
1016.5
1013.8
44
52.8
10
26.5
0
20
40
60
80
100
FCI S
core
Hdrolog
y
Biogeo
chemist
ry
Habitat
Plant c
ommun
ity
Land
scap
eIW
C
Farmed Restored
Figure 10 Mean functional capacity index (FCI) and index of wetland condition (IWC) scores for farmed and restored wetlands in the Nanticoke Watershed in 2003. FCI sores are relative to depression reference standard condition.
6.2.6. Overall Condition of Nontidal Wetlands We calculated an overall rating of the condition of nontidal wetlands in the Nanticoke watershed using the proportion and condition of different wetland types. In addition to flat, riverine, and depressions, we also included farmed wetlands and ponds or excavated wetlands as a separate category. Farmed wetlands (3,527 ac.) were subtracted from the flats because all the farmed wetlands were classified as flats by Tiner and Bergquist (2003). In addition to 108 acres of depressions that were classified as excavated, there were 1089 acres of ponds in the watershed. Based on the proportion of flats (84%), riverine (12%), depressions (0.2%), farmed (3%) and excavated wetlands (0.9%), and using the condition breakpoints for each respective subclass, 17% of the nontidal wetlands are minimally or not stressed, 48% moderately stressed, and 35% highly stressed (Figure 11). Tiner (2004) calculated a ratio of 0.71 for altered wetlands to total wetland area (29% of the wetlands were unaltered) based on metrics derived from remote sensing data. Comparison with our findings indicates that Tiner’s method provides a general depiction of wetland alteration on the watershed level, but that additional stressors are degrading wetlands that may not be identifiable using remote sensing. Comparing the mean function scores among wetlands types, riverine wetlands had the greatest alterations to hydrology and biogeochemical cycling functions, and the least alteration to the plant community function, and flats had the greatest alterations to plant community function and the least alterations to the buffer integrity functions (Figure 12). The depressions had the lowest IWC and showed levels of alteration between the flats and riverine wetlands for most
Condition Nanticoke Watershed Wetlands Page 37
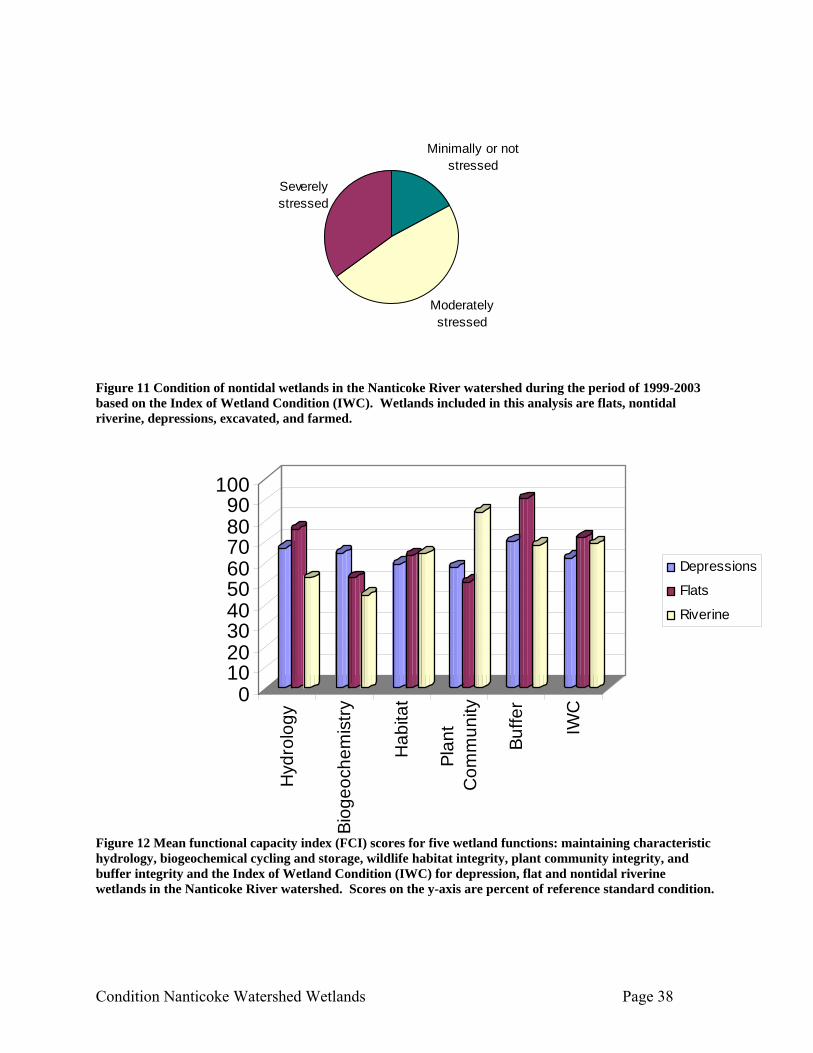
Minimally or not stressed
Moderately stressed
Severely stressed
Figure 11 Condition of nontidal wetlands in the Nanticoke River watershed during the period of 1999-2003 based on the Index of Wetland Condition (IWC). Wetlands included in this analysis are flats, nontidal riverine, depressions, excavated, and farmed.
0102030405060708090
100
Hyd
rolo
gy
Biog
eoch
emis
try
Hab
itat
Plan
tC
omm
unity
Buffe
r
IWC
Depressions
Flats
Riverine
Figure 12 Mean functional capacity index (FCI) scores for five wetland functions: maintaining characteristic hydrology, biogeochemical cycling and storage, wildlife habitat integrity, plant community integrity, and buffer integrity and the Index of Wetland Condition (IWC) for depression, flat and nontidal riverine wetlands in the Nanticoke River watershed. Scores on the y-axis are percent of reference standard condition.
Condition Nanticoke Watershed Wetlands Page 38
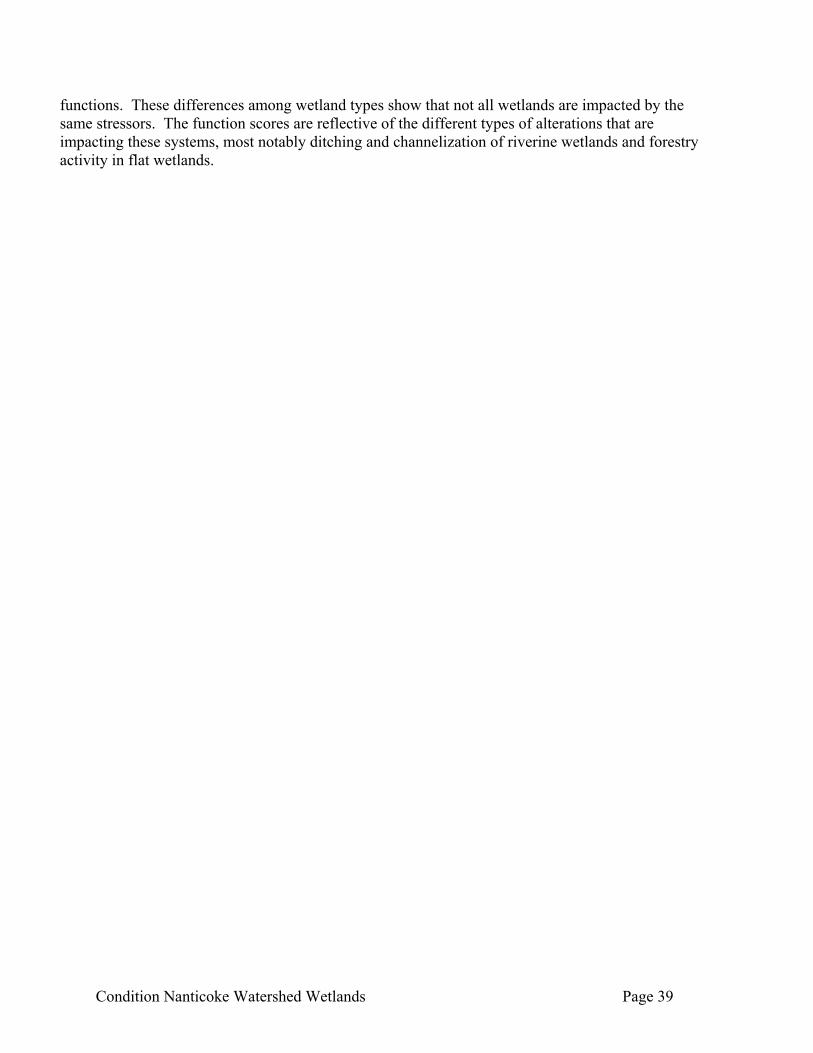
functions. These differences among wetland types show that not all wetlands are impacted by the same stressors. The function scores are reflective of the different types of alterations that are impacting these systems, most notably ditching and channelization of riverine wetlands and forestry activity in flat wetlands.
Condition Nanticoke Watershed Wetlands Page 39
USING LANDSCAPE ANALYSIS TO PREDICT CONDITION OF WETLANDS
The results of the probabilistic field surveys provides information on the function and condition of wetlands in the Nanticoke River watershed. These results represent the proportion (by acreage for flats and riverine wetlands and by number for depressions) of wetlands functioning at various levels in the watershed. A probabilistic survey provides a comprehensive assessment of wetlands on a large scale (i.e. watershed) without having to sample every wetland. This is especially important given the constraints of resources and access to private lands. One limitation to this approach is that although we know the proportion of wetlands that are functioning at a particular level, the probabilistic approach does not extrapolate the information to the wetlands that were not sampled. This locational information is important for targeting restoration and protection efforts on a local scale and to develop comprehensive watershed restoration strategies. Weller et al. (2007) developed tools for assessing the condition the wetlands using remote data. For more details on methods and results for flat and riverine wetlands refer to Weller et al. (2007). 7.1. Methods Using the information from the field surveys, SERC developed a validated landscape assessment method (Weller et al. 2007) that used surrounding land use features to remotely predict the FCI scores of flat and riverine wetlands. Similar methods were subsequently used to develop a landscape assessment method for depressions (Bleil 2004). Potential geographic metrics were derived from digital land cover (NLCD 2001), hydrology (Tiner et al. 2000, 2001), road (USDC 2001, ESRI 2005), and wetland coverages (Weller et al. 2007, Tiner and Bergquist 2003; Table 7). Landscape variables were evaluated in, 100m and 1km radii circles for flat and riverine wetlands and a 240m radius circle (Bleil 2004) for depressions. Univariate correlations were performed between geographic landscape variables (48 for flats and riverine wetlands and 25 for depressional wetlands) and the field-derived FCI scores. Variables that had significant relationships (p< 0.05) were then used in a step-wise multiple linear regression analysis to determine the strongest variables to include in the predictive model. The final predictive models were then determined using multivariate analysis (Table 8). The analyses for the flat and riverine wetlands produced coefficients for each variable which were then combined into a function whereas the analysis of the depression wetlands combined the variables first and then generated one coefficient for the entire function. The Functional Capacity Indices derived from the landscape variables are hereafter referred to as landscape functional capacity index or LFCI to differentiate them from the FCI scores derived from field data.
Condition Nanticoke Watershed Wetlands Page 40

Table 7. Potential landscape indicators of wetland condition. (a) denotes variables describing the distance from an assessment point to a road or stream. The remaining variables are percentages or densities quantified for the areas in (100 m and 1000 m radius for flat and riverine wetlands, respectively, and 240m for depressions) circles around assessment points (modified from Weller et al. 2007).
Variable Name Description Land cover categories from NLCD 2001 FORDEC Deciduous forest % FOREVER Evergreen forest % FORMIX Mixed forest % WOODWET Wooded wetland % FOREST Total forest % DEVTOT Total developed land % CROP Cropland % GRASS Grassland % CLEAR Cropland % + grassland % HERBWET Herbaceous wetland % BARE Barren land % OWATER Open water % (depressions only) NATCOV Sum FOREST, HERBWET, OWATER (depressions only) Pixel percentages from NLCD 2001 IMPMEAN Mean % impervious IMPZERO % with zero impervious TREEMEAN Mean % tree cover TREEZERO % with zero tree cover Nanticoke watershed stream and ditch map XSTRDENc Excavated stream density (km/km2) NSTRDEN Natural stream density (km/km2) TSTRDEN Total stream density (km/km2) STRCONDac Condition of nearest stream (0=excavated, 1=natural) STRDISa Distance (m) from assessment point to nearest stream STRDISMINac Minimum of STRDIS and STRDISNHD 1:24,000 National Hydrography Dataset (NHD) TSTRDENNHD Stream density (km/km2) ORDERac Strahler order of nearest stream STRDISNHDa Distance (m) from assessment point to nearest stream Roads from census TIGER files ROADDEN Road density (km/km2) ROADDISa Distance (m) from assessment point to nearest road Wetlands from NWI and states of MD and DE
Condition Nanticoke Watershed Wetlands Page 41
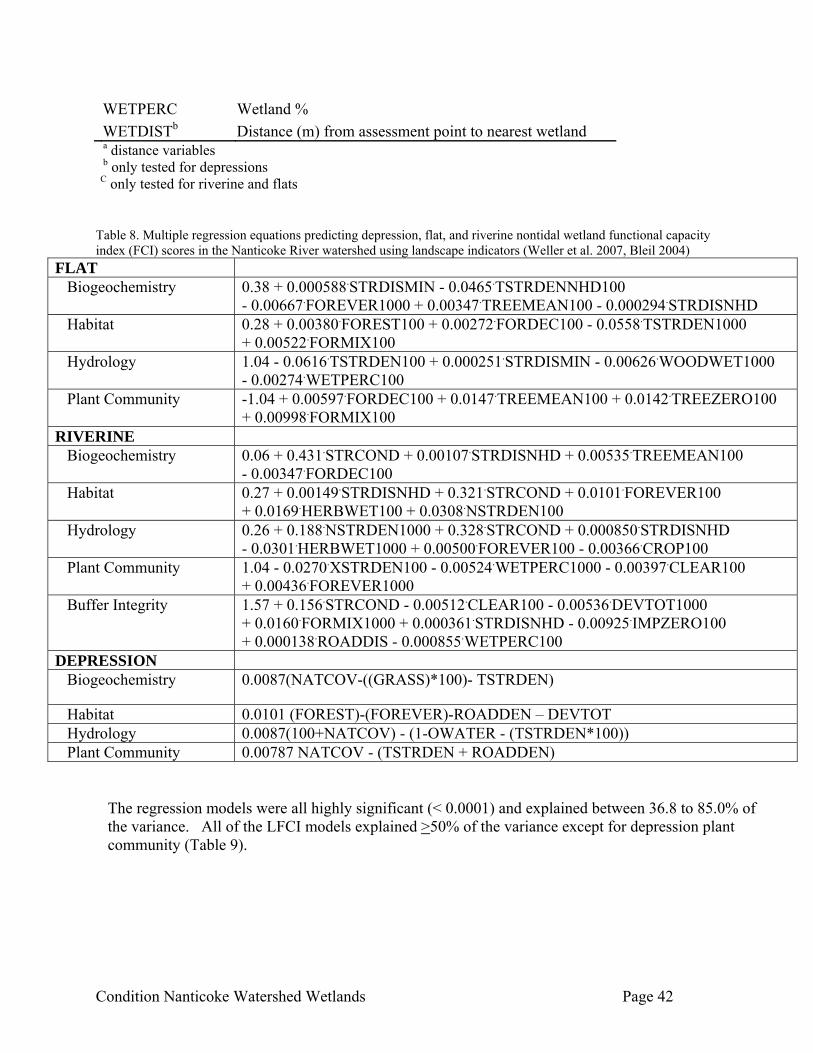
WETPERC Wetland % WETDISTb Distance (m) from assessment point to nearest wetland distance variables a
only tested for depressions b
C only tested for riverine and flats Table 8. Multiple regression equations predicting depression, flat, and riverine nontidal wetland functional capacity index (FCI) scores in the Nanticoke River watershed using landscape indicators (Weller et al. 2007, Bleil 2004)
FLAT Biogeochemistry 0.38 + 0.000588.STRDISMIN - 0.0465.TSTRDENNHD100
- 0.00667.FOREVER1000 + 0.00347.TREEMEAN100 - 0.000294.STRDISNHD Habitat 0.28 + 0.00380.FOREST100 + 0.00272.FORDEC100 - 0.0558.TSTRDEN1000
+ 0.00522.FORMIX100 Hydrology 1.04 - 0.0616.TSTRDEN100 + 0.000251.STRDISMIN - 0.00626.WOODWET1000
- 0.00274.WETPERC100 Plant Community -1.04 + 0.00597.FORDEC100 + 0.0147.TREEMEAN100 + 0.0142.TREEZERO100
+ 0.00998.FORMIX100 RIVERINE Biogeochemistry 0.06 + 0.431.STRCOND + 0.00107.STRDISNHD + 0.00535.TREEMEAN100
- 0.00347.FORDEC100 Habitat 0.27 + 0.00149.STRDISNHD + 0.321.STRCOND + 0.0101.FOREVER100
+ 0.0169.HERBWET100 + 0.0308.NSTRDEN100 Hydrology 0.26 + 0.188.NSTRDEN1000 + 0.328.STRCOND + 0.000850.STRDISNHD
- 0.0301.HERBWET1000 + 0.00500.FOREVER100 - 0.00366.CROP100 Plant Community 1.04 - 0.0270.XSTRDEN100 - 0.00524.WETPERC1000 - 0.00397.CLEAR100
+ 0.00436.FOREVER1000 Buffer Integrity 1.57 + 0.156.STRCOND - 0.00512.CLEAR100 - 0.00536.DEVTOT1000
+ 0.0160.FORMIX1000 + 0.000361.STRDISNHD - 0.00925.IMPZERO100 + 0.000138.ROADDIS - 0.000855.WETPERC100
DEPRESSION Biogeochemistry 0.0087(NATCOV-((GRASS)*100)- TSTRDEN)
Habitat 0.0101 (FOREST)-(FOREVER)-ROADDEN – DEVTOT Hydrology 0.0087(100+NATCOV) - (1-OWATER - (TSTRDEN*100)) Plant Community 0.00787 NATCOV - (TSTRDEN + ROADDEN)
The regression models were all highly significant (< 0.0001) and explained between 36.8 to 85.0% of the variance. All of the LFCI models explained >50% of the variance except for depression plant community (Table 9).
Condition Nanticoke Watershed Wetlands Page 42
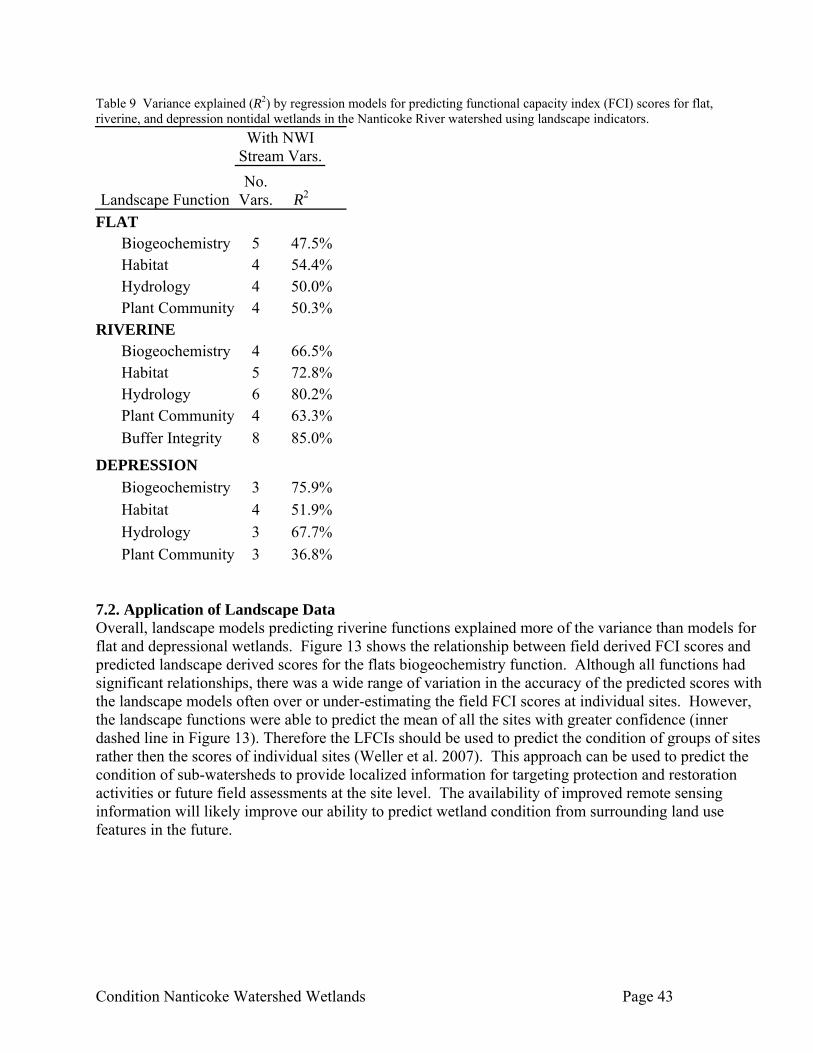
Table 9 Variance explained (R2) by regression models for predicting functional capacity index (FCI) scores for flat, riverine, and depression nontidal wetlands in the Nanticoke River watershed using landscape indicators.
With NWI
Stream Vars.
Landscape Function No.
Vars. R2 FLAT Biogeochemistry 5 47.5% Habitat 4 54.4% Hydrology 4 50.0% Plant Community 4 50.3% RIVERINE Biogeochemistry 4 66.5% Habitat 5 72.8% Hydrology 6 80.2% Plant Community 4 63.3% Buffer Integrity 8 85.0%
DEPRESSION Biogeochemistry 3 75.9% Habitat 4 51.9% Hydrology 3 67.7% Plant Community 3 36.8% 7.2. Application of Landscape Data Overall, landscape models predicting riverine functions explained more of the variance than models for flat and depressional wetlands. Figure 13 shows the relationship between field derived FCI scores and predicted landscape derived scores for the flats biogeochemistry function. Although all functions had significant relationships, there was a wide range of variation in the accuracy of the predicted scores with the landscape models often over or under-estimating the field FCI scores at individual sites. However, the landscape functions were able to predict the mean of all the sites with greater confidence (inner dashed line in Figure 13). Therefore the LFCIs should be used to predict the condition of groups of sites rather then the scores of individual sites (Weller et al. 2007). This approach can be used to predict the condition of sub-watersheds to provide localized information for targeting protection and restoration activities or future field assessments at the site level. The availability of improved remote sensing information will likely improve our ability to predict wetland condition from surrounding land use features in the future.
Condition Nanticoke Watershed Wetlands Page 43
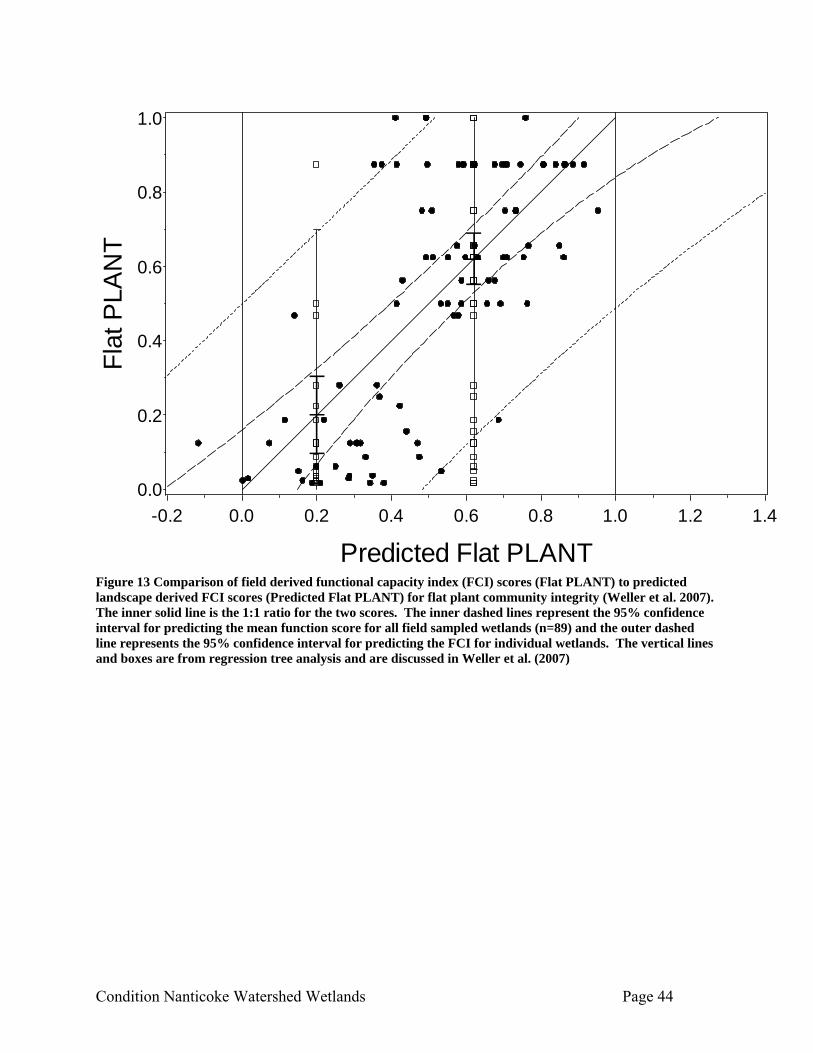
Flat
PLA
NT
0.0
0.2
0.4
0.6
0.8
1.0
Predicted Flat PLANT-0.2 0.0 0.2 0.4 0.6 0.8 1.0 1.2 1.4
Figure 13 Comparison of field derived functional capacity index (FCI) scores (Flat PLANT) to predicted landscape derived FCI scores (Predicted Flat PLANT) for flat plant community integrity (Weller et al. 2007). The inner solid line is the 1:1 ratio for the two scores. The inner dashed lines represent the 95% confidence interval for predicting the mean function score for all field sampled wetlands (n=89) and the outer dashed line represents the 95% confidence interval for predicting the FCI for individual wetlands. The vertical lines and boxes are from regression tree analysis and are discussed in Weller et al. (2007)
Condition Nanticoke Watershed Wetlands Page 44
RECCOMENDATIONS FOR PRIORITIZING RESTORATION AND PROTECTION
The majority of freshwater non-tidal wetlands in the Nanticoke River watershed have been degraded from reference condition. These wetland systems are vital components to the health of the Nanticoke watershed, its biodiversity and water quality. Prioritizing wetland restoration and protection efforts on the watershed level using wetland condition information will provide a proactive approach to improving the condition of wetlands by setting priorities for restoration and standards with which to evaluate if goals have been met (Kentula 2000, Bedford 1999). Ultimately these efforts will improve the condition of the Nanticoke River and its watershed and contribute to improved health of the Chesapeake Bay. In addition, prioritizing actions will provide direction for agencies and organizations performing restoration activities, ensuring projects are strategically completed, and resources and funding are effectively utilized. We have developed wetland protection and restoration recommendations by examining the condition of wetlands, evaluating changes in wetland acreage by wetland type from pre-European settlement to present, and assessing wetland functions that are being restored through existing programs. The recommendations focus on minimizing or eliminating stressors and prioritizing activities that will have the greatest impact on increasing overall wetland function and condition on the watershed level. The states of Maryland and Delaware are currently incorporating these recommendations into restoration strategies in Maryland and Delaware to target projects on the local level. 8.1 Identification of Management Responses To improve wetland condition in the Nanticoke watershed, the source of degradation (i.e. stressors) must be identified and then either eliminated or minimized. However, there are often multiple stressors and ranges of disturbance, so we evaluated general patterns of wetland condition based on the Functional Capacity Index (FCI) scores. We based this analysis on the three functions (maintenance of hydrology, plant community integrity, and wildlife habitat integrity) that best reflect the types of alterations (vegetation and hydrology alterations) that lowered wetland function and that had a direct and measurable management response. The biogeochemical cycling and storage function was excluded because it uses metrics that are also present in the hydrology and wildlife habitat functions. Buffer integrity will be incorporated during the prioritization phase once on-site management recommendations are developed. Matrices, which were based on the FCI scores described above, were developed to illustrate the percent of wetlands that occurred in 8 management response categories (Figure 14a). The sites are stratified by hydrologic condition in the 2 matrix columns based on the hydrology function and the following criteria:
Minimally altered – FCI of > 80 for hydrology function
Altered – FCI < 80
Condition Nanticoke Watershed Wetlands Page 45
The break point of 0.8 was used to reflect sites that were functioning similar to sites in the minimally or not stressed category. The matrix rows stratify sites based on the condition of the vegetation within the site as determined by the wildlife habitat integrity and plant community integrity functions. The primary difference between these two functions is that the wildlife habitat function is based on structural vegetation such as density and size of trees and density of shrubs. The plant community function is based on species composition variables such as the tree species present and non-native species. In the riverine subclass, the wildlife habitat integrity function includes a variable that categorizes the condition of the stream channel inside the assessment area. For these purposes, it was removed from the function so that only vegetation characteristics are used to categorize sites with this function. The following criteria were used to place sites into three categories:
Protection – FCI score of > 80 for BOTH Plant Community and Wildlife Habitat Functions Species composition altered - FCI score of > 80 for Wildlife Habitat function and Plant Community FCI of < 80 Species composition and structure altered - FCI score of < 80 for Wildlife Habitat function and Plant Community FCI Structure altered – FCI score of < 80 for Wildlife Habitat function and Plant Community FCI of > 80
The management response that is needed to improve the majority of sites in each of the three subclasses varies due to the different levels and combinations of degradation affecting wetlands (Figure 14b- d). All wetland types have a low percent that are minimally altered for both hydrology and vegetation (the upper left management box). Only 16% of the riverine wetland area, 8% of flat wetland area, and 6% of depressions had minimally altered vegetation and hydrology, indicating the need to prioritize protection efforts on the few minimally impacted wetlands that remain. Flat wetlands are the dominant wetland type comprising >70% of the wetlands in the watershed. These wetlands perform vital functions that contribute to maintaining a healthy watershed including nutrient cycling (Denver 2004) and providing large areas of wildlife habitat (Tiner et al. 2001). These wetlands also have been the most impacted by fragmentation in the landscape. The average size of flats was estimated to be 433 acres pre- colonial settlement and now the average size is only 44 acres (Tiner and Bergquist 2003). Of the flat wetland area that is remaining, 62% had minimal hydrologic impacts (scoring > 80% of reference for the maintenance of hydrology function). Conversely, only 8% of the sites had a minimally altered vegetation community as assessed with the wildlife habitat integrity and plant community integrity functions (Figure 14b). It is likely that the hydrology function for flats is underestimating the actual hydrologic impacts due to landscape level effects of drainage in the watershed (Whigham et al. 2007). The cumulative effect of extensive ditching has altered the natural hydrology of the watershed. Even
Condition Nanticoke Watershed Wetlands Page 46
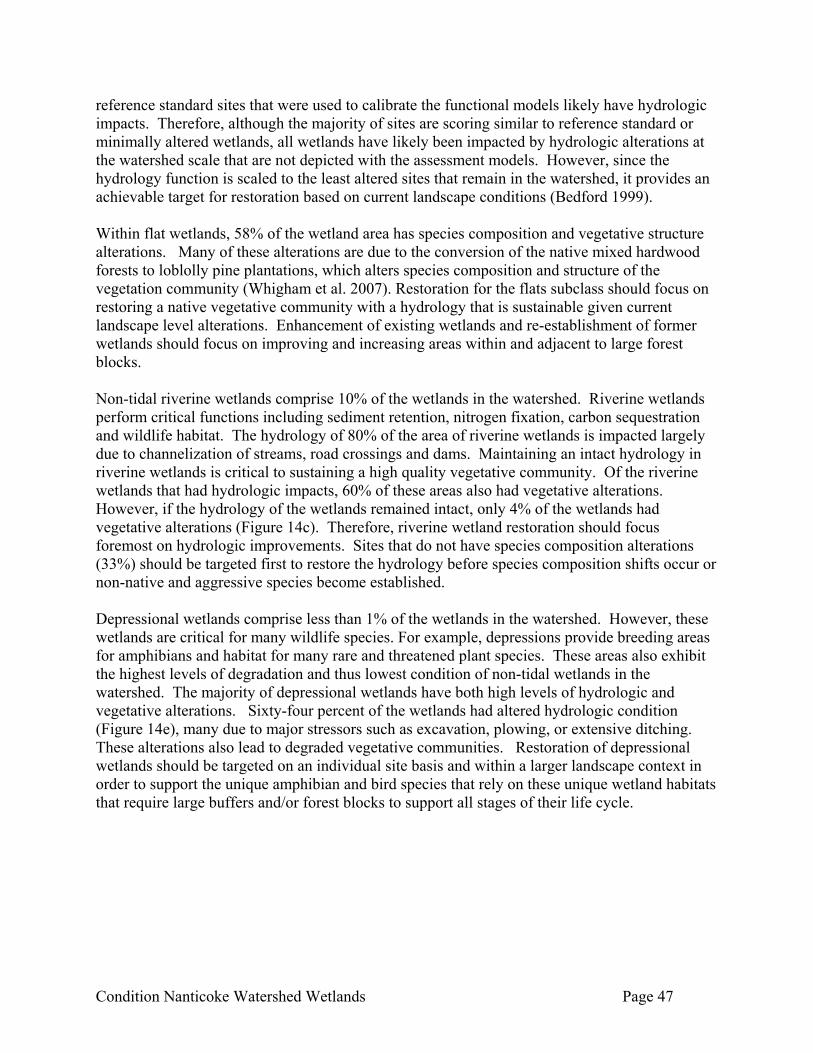
reference standard sites that were used to calibrate the functional models likely have hydrologic impacts. Therefore, although the majority of sites are scoring similar to reference standard or minimally altered wetlands, all wetlands have likely been impacted by hydrologic alterations at the watershed scale that are not depicted with the assessment models. However, since the hydrology function is scaled to the least altered sites that remain in the watershed, it provides an achievable target for restoration based on current landscape conditions (Bedford 1999). Within flat wetlands, 58% of the wetland area has species composition and vegetative structure alterations. Many of these alterations are due to the conversion of the native mixed hardwood forests to loblolly pine plantations, which alters species composition and structure of the vegetation community (Whigham et al. 2007). Restoration for the flats subclass should focus on restoring a native vegetative community with a hydrology that is sustainable given current landscape level alterations. Enhancement of existing wetlands and re-establishment of former wetlands should focus on improving and increasing areas within and adjacent to large forest blocks. Non-tidal riverine wetlands comprise 10% of the wetlands in the watershed. Riverine wetlands perform critical functions including sediment retention, nitrogen fixation, carbon sequestration and wildlife habitat. The hydrology of 80% of the area of riverine wetlands is impacted largely due to channelization of streams, road crossings and dams. Maintaining an intact hydrology in riverine wetlands is critical to sustaining a high quality vegetative community. Of the riverine wetlands that had hydrologic impacts, 60% of these areas also had vegetative alterations. However, if the hydrology of the wetlands remained intact, only 4% of the wetlands had vegetative alterations (Figure 14c). Therefore, riverine wetland restoration should focus foremost on hydrologic improvements. Sites that do not have species composition alterations (33%) should be targeted first to restore the hydrology before species composition shifts occur or non-native and aggressive species become established.
Depressional wetlands comprise less than 1% of the wetlands in the watershed. However, these wetlands are critical for many wildlife species. For example, depressions provide breeding areas for amphibians and habitat for many rare and threatened plant species. These areas also exhibit the highest levels of degradation and thus lowest condition of non-tidal wetlands in the watershed. The majority of depressional wetlands have both high levels of hydrologic and vegetative alterations. Sixty-four percent of the wetlands had altered hydrologic condition (Figure 14e), many due to major stressors such as excavation, plowing, or extensive ditching. These alterations also lead to degraded vegetative communities. Restoration of depressional wetlands should be targeted on an individual site basis and within a larger landscape context in order to support the unique amphibian and bird species that rely on these unique wetland habitats that require large buffers and/or forest blocks to support all stages of their life cycle.
Condition Nanticoke Watershed Wetlands Page 47
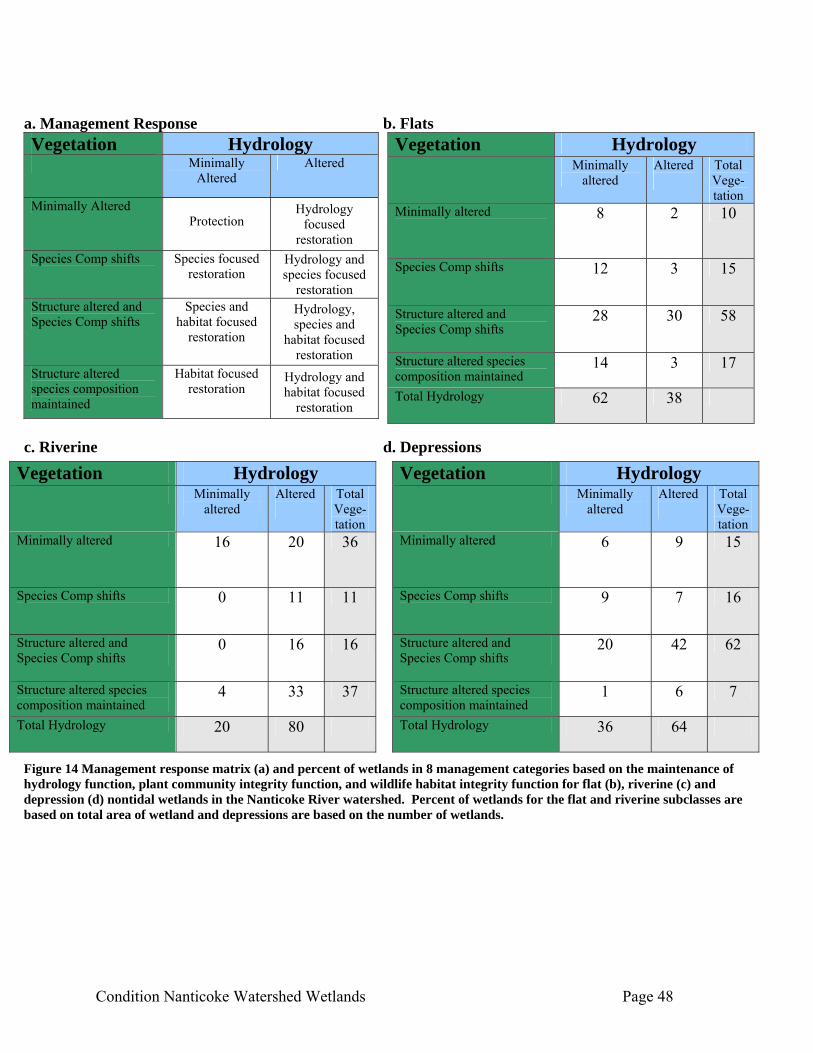
a. Management Response b. Flats Vegetation Hydrology
Minimally Altered
Altered
Minimally Altered Protection
Hydrology focused
restoration Species Comp shifts Species focused
restoration Hydrology and species focused
restoration Structure altered and Species Comp shifts
Species and habitat focused
restoration
Hydrology, species and
habitat focused restoration
Structure altered species composition maintained
Habitat focused restoration
Hydrology and habitat focused
restoration
Vegetation Hydrology Minimally
altered Altered
Total Vege-tation
Minimally altered 8 2 10
Species Comp shifts 12 3 15
Structure altered and Species Comp shifts
28 30 58
Structure altered species composition maintained
14 3 17
Total Hydrology 62 38
c. Riverine d. Depressions
Vegetation Hydrology Minimally
altered Altered
Total Vege-tation
Minimally altered 6 9 15
Species Comp shifts 9 7 16
Structure altered and Species Comp shifts
20 42 62
Structure altered species composition maintained
1 6 7
Total Hydrology 36 64
Vegetation Hydrology Minimally
altered Altered
Total Vege-tation
Minimally altered 16 20 36
Species Comp shifts 0 11 11
Structure altered and Species Comp shifts
0 16 16
Structure altered species composition maintained
4 33 37
Total Hydrology 20 80
Figure 14 Management response matrix (a) and percent of wetlands in 8 management categories based on the maintenance of hydrology function, plant community integrity function, and wildlife habitat integrity function for flat (b), riverine (c) and depression (d) nontidal wetlands in the Nanticoke River watershed. Percent of wetlands for the flat and riverine subclasses are based on total area of wetland and depressions are based on the number of wetlands.
Condition Nanticoke Watershed Wetlands Page 48
8.2 Integrating Protection and Restoration with Landscape Planning Efforts To maximize the benefit of restoration activities on the watershed scale, individual projects need to be placed with consideration of the surrounding landscape. Wetland condition and plant and animal communities in wetlands are affected by surrounding land use. Buffers of varying widths adjacent to wetlands have been recommended to minimize the impacts of surrounding land use practices on wetland condition, (Desbonnet et al. 1994, Castelle et al. 1994) amphibians and turtle habitat (Brown and Jung 2005, Burke and Gibbons 1995, Richter and Azous 1995, Semlitsch 1998) birds (Keller et al. 1993), and sediment retention and nutrient removal (Gilliam and Skaggs 1985, Spruill 2000). However, recent studies have indicated that the buffers alone may not be adequate enough to protect wetland biological integrity and water quality because influences of surrounding land use may extend thousands of meters from the edge of a wetland (Herrmann et al. 2005, Houlahan and Findlay 2004, Porej et al. 2004). In addition, simply protecting buffers does not account for the importance of protecting wetland complexes, which allow migration of wildlife between wetlands (Haig et al. 1998). Houlahan and Findlay (2004) recommend maintaining a heterogeneous landscape with significant amounts of forest and agricultural areas and utilizing best management practices such as large forested wetland buffers to protect the water quality. Protection of large tracts of upland and wetland complexes allow for dispersal and recolonization of plants, amphibians and birds (Herrmann et al. 2005, Haig et al. 1998, Ehrenfeld 1983). The MD DNR and DE DNREC have several landscape level assessments that can be used as a basis for targeting wetland protection and restoration efforts. Green Infrastructure maps were developed to identify the area of natural habitat remaining in the respective States and the location of the best corridors to connect them (http://www.dnr.state.md.us/greenways/greenprint/ and http://www.state.de.us/planning/strategies/strategies.shtml#gi_maps; Map9). Maryland and Delaware have also identified key wildlife habitats in the Maryland Wildlife Diversity Conservation Plan and the Delaware Wildlife Action Plans (http://dnr.maryland.gov/wildlife/divplan_wdcp.asp and http://www.dnrec.state.de.us/NHP/information/CWCS2.asp). Specific restoration activities recommended in this report are based on wetland condition and should be integrated with these other landscape level plans to maximize the benefits of wetland protection and restoration. 8.3 Prioritizing Wetland Protection and Restoration Activities The condition of wetlands in the Nanticoke River watershed can be improved using three strategies: protection, enhancement of existing wetlands, and restoration of former wetlands. Although these strategies are listed in order of priority, some funding programs are specific to one type of protection or restoration activity. Therefore, available resources should be used to maximize the environmental benefits of each program.
8.3.1. Protection – Protecting wetlands through acquisitions and conservation easements should be the highest priority strategy for maintaining wetland functions and services in the Nanticoke River watershed. Increasing development pressure threatens wetlands due to direct and indirect impacts from new houses, roads, and infrastructure. Integrating protection of wetlands that are minimally or least stressed and their associated buffers
Condition Nanticoke Watershed Wetlands Page 49
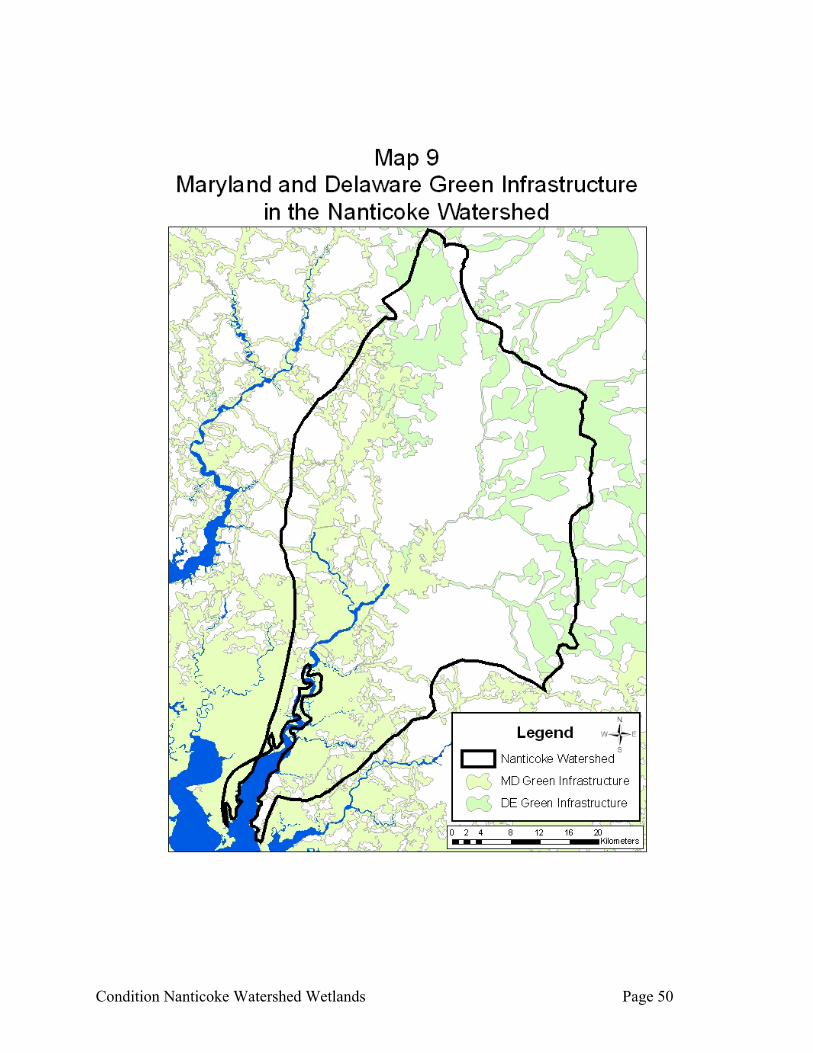
Condition Nanticoke Watershed Wetlands Page 50
with existing landscape conservation plans will ensure that these systems remain intact and provide associated functions. 8.3.2 Improvement of existing wetlands – Resources that are available for improving wildlife habitat or water quality and that can not be used for protection activities, should be targeted towards increasing the condition and function of existing wetlands. The majority of nontidal wetlands in the Nanticoke watershed have been degraded from reference condition with 86% either moderately or highly stressed. Improvement activities should be used to increase the condition of these wetlands by reducing or eliminating the dominant stressors that are impacting different wetland types. These activities will likely produce a greater increase in function in the short term with less effort than attempting to restore former wetlands.
8.3.3 Restoration of former wetlands - Restoring former wetlands is important because it is the only way that we will continue to increase the acreage of wetlands in the watershed. However, it is unknown how long it will take for these systems to function similar to natural wetlands. Restoration of former wetlands increases function from pre-restoration levels, however, more information is needed to understand what functions and services restored wetlands provide and how these functions and services differ from natural wetlands. Therefore, restoration of former wetlands such as in agricultural settings should be targeted with those funds that are restricted from being used for protection and enhancement activities. When restoring former wetlands, data from reference standard sites should be used as guidance during construction to ensure projects will be sustainable in the current landscape (Bedford 1999).
8.4 Evaluating Progress Towards Improving Wetland Condition The results from this work can be used as a baseline to measure future trends in wetland condition in the Nanticoke River watershed. Changes in the proportion of wetland types based on acreage can be assessed from 1998 proportions to determine if restoration and protection activities are restoring or creating new wetland types or favoring one wetland type over another (Gwin et al. 1999). Changes in wetland condition can be evaluated using landscape assessment methods or repeating an intensive field survey of wetland condition. Landscape models could be used to determine if changes in wetland condition are occurring on the watershed scale based on changes in land use patterns surrounding wetlands (Weller et al. 2007). If landscape changes are found, a more detailed assessment of wetland condition by performing another probabilistic survey using field assessment methods would determine if dominant stressors that are impacting wetlands have changed from previous surveys. Wetland restoration projects should continue to be monitored to determine the functions that they are performing and how these change over time.
Condition Nanticoke Watershed Wetlands Page 51
LITERATURE CITED
Ahl, J. M., J. M. Smith and D. Bleil. 1996. Watershed Environmental & Economic Data (WEED) Database. Maryland Department of Natural Resources. Unpublished. Bedford, B. L. 1999. Cumulative effects of wetland landscapes: links to wetland restoration in the United States and Southern Canada. Wetlands 19:775-788. Bleil, D. 2004. Wetland Profile of the Nanticoke River Watershed. Maryland Department of Natural Resources. Final report submitted to EPA Wetland Program Development Grant CD-98337701. 82p. Bried, J. T. and G. N. Ervin. 2006. Abundance patterns of dragonflies along a wetland buffer. Wetlands 26:878-883. Brinson, M. M. 1993. A hydrogeomorphic classification for wetlands. U.S. Army Engineers Waterways Experiment Staion, Vicksburg, MS, Technical Report WRP-DE-4. Brooks, R. T. 2000. Annual and seasonal variation and the effects of hydroperiod on benthic macroinvertebrates of seasonal forest ("vernal") ponds in central Massachusetts, USA. Wetlands 20:707-715. Brown, L. J. and R. E. Jung. 2005. An introduction to Mid-Atlantic seasonal pools. Ft. Meade, U.S. Environmental Protection Agency, Mid Atlantic Integrated Assessment. Burke, V. J. and J. W. Gibbons. 1995. Terrestrial buffer zones and wetland conservation: a case study of freshwater turtles in a carolina bay. Conservation Biology 9:1365-1369. Castelle, A. J., A. W. Johnson, and C. Conolly. 1994. Wetland and stream buffer size requirements - a review. Journal of Environmental Quality 23:878-882. Chesapeake Bay Foundation (CBF). 1996. Nanticoke River Watershed: Natural and Cultural Resources Atlas. Chesapeake Bay Foundation, Annapolis, MD. Craft, C. B., and W. P. Casey. 2000. Sediment and nutrient accumulation in floodplain and depressional freshwater wetlands of Georgia, USA. Wetlands 20:323-330. Darke, A. K., and M. R. Walbridge. 2000. Al and Fe biogeochemistry in a floodplain forest: implications for P retention. Biogeochemistry 51:1-32. DE NHP. 2003. Rare Vascular Plants of Delaware, 2003. Delaware Natural Heritage Program, Delaware Department of Natural Resources and Control, Dover, DE. DE DNREC. 1998. Total Maximum Daily Load (TMDL) Analysis for Nanticoke River and Broad Creek, Delaware. Delaware Department of Natural Resources and Environmental Control, Dover, DE. Denver, J. M., S. W. Ator, L. M. Debrewer, M. J. Ferrari, J. R. Barbaro, T. C. Hancock, M. J. Brayton, and R. M. Nardi. 2004. Water quality in the Delmarva Peninsula, Delaware, Maryland, and Virginia, 1999-2001. Reston, VA. U.S. Geological Survey Circular 1228.
Condition Nanticoke Watershed Wetlands Page 52
Desbonnet, A., P. Pogue, V. Lee, and N. Wolff. 1994. Vegetated buffers in the coastal zone. A summary review and bibliography. Coastal Resources Center, Rhode Island Sea Grant, University of Rhode Island, Narragansett, RI. Coastal Resources Center Technical Report 2064. Ehrenfeld, J. G. 1983. The effects of changes in land-use on swamps of the New Jersey Pine Barrens. Biological Conservation 25:353-375. ESRI. 2005. Census 2000 TIGER/line data. Data dowloadable from http://www.esri.com/data/download/census2000_tigerline/index.html. Fennessy, M. S., A. D. Jacobs, and M. E. Kentula. 2004. Review of Rapid Methods for Assessing Wetland Condition. U.S. Environmental Protection Agency, Washington, D.C. EPA/620/R-04/009. Findlay, C. S. and J. Houlahan. 1996. Anthropogenic correlates of species richness in southeastern Ontario wetlands. Conservation Biology 11:1000-1009. Forman, R. T. T. and L. E. Alexander. 1998. Roads and their major ecological effects. Annual Review of Ecology and Systematics 29:207-231. Gilliam, J. W. and R. W. Skaggs. 1985. Management of agricultural drainage water to minimize nutrient inputs to estuaries and bays. p. 21-30 In C. W. Coale et. al (ed.) Proceedings of Conference on Land Use and Chesapeake Bay. May 15-17. Fort Monroe, VA. Virginia Coop. Ext. Pub. No. 305-003. Gosselink, J. G. and R. E. Turner. 1979. The role of hydrology in freshwater wetland ecosystems. P. 63-78. In Good, R. E., D. F. Whigham, and R. L. Simpson (eds.) Freshwater Wetlands Ecological Processes and Management Potential. Academic Press, New York, NY USA. Gwin, S. E., Kentula, M. E. Shaffer, P. W. 1999. Evaulating the effects of wetland regulation through hydrogeomorphic classification and landscape profiles. Wetlands 19:477-489. Haig, S. M., D. W. Mehlman, and L. W. Oring. 1998. Avian movements and wetland connectivity in landscape conservation. Conservation Biology 12:749-758. Hanson, G. C., P. M. Groffman, and A. J. Gold. 1994. Denitrification in riparian wetlands receiving high and low groundwater nitrate inputs. Journal of Environmental Quality 23:917-922. Harris, L. D. and T. E. O’Meara. 1989. Changes in southeastern bottomland forests and impacts on vertebrate fauna. In R. R. Sharitz and J. W. Gibbons (eds.) Freshwater Wetlands and Wildlife DOE Symposium series no. 61. Herlihy, A., A. Jacobs, M. Kentula. 2006. Developing an Overall Indicator of Wetland Condition for the Major Wetland Types in the Nanticoke Basin. White Paper available through Delaware Department of Natural Resources and Environmental Control, Dover, DE 19904. Herrmann, H. L., K. J. Babbitt, M. J. Baber, and R. G. Congalton. 2005. Effects of landscape characteristics on amphibian distribution in a forest-dominated landscape. Biological Conservation 125:139-149. Houlahan, J. E., and C. S. Findlay. 2004. Estimating the 'critical' distance at which adjacent land-use degrades wetland water sediment quality. Landscape Ecology 19:677-690.
Condition Nanticoke Watershed Wetlands Page 53
Jacobs, A. D., 2004. Wetland Watershed Profile for the Nanticoke River Watershed. Delaware Department of Natural Resources and Environmental Control. Final Report to EPA for Assistance #CD-98338301-0 Jacobs, T. C. and J. W. Gilliam. 1985. Riparian losses of nitrate from agricultural drainage waters. Journal of Environmental Quality 14:472-478. Jordan, T. E., D. L. Correll, and D. E. Weller. 1993. Nutrient interception by a riparian forest receiving inputs from adjacent cropland. Journal of Environmental Quality 22:467-473. Keddy, P. A., H. T. Lee, I. C. Wisheu. 1993. Choosing indicators of ecosystem integrity: wetlands as a model system. p. 61-82. In Woodley, S., J. Kay, and G. Francis (Eds) Ecological integrity and the management of ecosystems. St. Lucie Press, Ottawa, Canada Keller, C. M. E., C. S. Robbins, and J. S. Hatfield. 1993. Avian communities in riparian forests of different widths in Maryland and Delaware. Wetlands 13:137-144. Kentula, M. E. 2000. Perspectives on setting success criteria for wetland restoration. Ecological Engineering 15:199-209. Kirkman, L. K., C. Goebel, L. West, M. B. Drew, B. J. Palik. 2000. Depressional wetland vegetation types: a question of plant community development. Wetlands 20:373-385. Kolozsvary, M. B. and R. K. Swihart. 1999. Habitat fragmentation and the distribution of amphibians: patch and landscape correlates in farmland. Canadian Journal of Zoology 77:1288-1299. Lide, R. F., V. G. Meentemeyer, J. E. Pinder III, and L. M. Beatty. 1995. Hydrology of a Carolina Bay located on the upper coastal plain of western South Carolina. Wetlands 15:47-57. Lockaby, B.G. and M.R. Walbridge. 1998. Biogeochemistry. p. 149-172 In Messina, M. G. and W. H. Conner (Eds) Southern Forested Wetlands: Ecology and Management. CRC Press, Boca Raton, FL, USA. Lowrance, R. 1992. Groundwater nitrate and dentrification in a coastal plain riparian forest. Journal of Environmental Quality 21:401-405. Lowrance, R. R., R. L. Todd, L. E. Asmussen. 1984. Nutrient cycling in an agricultural watershed: I. phreatic movement. Journal of Environmental Quality 13:22-27. McAvoy, W. A. and P. Bowman. 2002. The flora of coastal plain pond herbaceous communities on the Delmarva Peninsula. Bartonia 61:81-91. National Research Council. 1995. Wetlands Characteristics and Boundaries. National Academy Press, Washington, D.C., USA. NLCD 2001 land cover mapping team at the USGS EROS Data Center (EDC), Sioux Falls, SD (605) 594-6151 or [email protected]. Mitsch, W. J. and J. G. Gosselink. 1993. Wetlands, second edition. Van Nostrand Reinhold, New York, NY, USA.
Condition Nanticoke Watershed Wetlands Page 54
Pechmann, J. H. K., D. E. Scott, J. W. Gibbons, and R. D. Semlitsch. 1989. Influence of wetland hydroperiod on diversity and abundance of metamorphosing juvenile amphibians. Wetlands Ecology and Management 1:3-11. Phillips, P. J., and L. J. Bachman. 1996. Hydrologic landscapes on the delmarva peninsula Part1: drainage basin type and base-flow chemistry. Journal of the American Water Resources Association 32:767-778. Phillips, P. J., and R. J. Shedlock. 1993. Hydrology and chemistry of groundwater and seasonal ponds in the Atlantic Coastal Plain in Delaware, USA. Journal of Hydrology 141:157-178. Porej, D., M. Micacchion, and T. E. Hetherington. 2004. Core terrestrial habitat for conservation of local populations of salamanders and wood frogs in agricultural landscapes. Biological Conservation 120:399-409. Richardson, C. J. 1994. Ecological functions and human values in wetlands: a framework for assessing forestry impacts. Wetlands 14:1-9. Richter, K. O. and A. L. Azous. 1995. Amphibian occurrence and wetland characteristics in the Puget Sound basin. Wetlands 15:305-312. Rokosch, A. and A.Jacobs. 2004. Nanticoke Watershed Research Project: Development of a Wetland Watershed Profile for Use in Prioritizing Protection and Restoration Strategies in the Nanticoke River Watershed, Delaware. Field Operations Report 2002-2003. Delaware Department of Natural Resources and Environmental Control, Dover, DE. Semlitsch, R. D. 1998. Biological delineation of terrestrial buffer zones for pond-breeding salamanders. Conservation Biology 12:1113-1119. Smith, R. D., Amman, A., Bartoldus, C., Brinson, M. M. 1995. An approach for assessing wetland functions using hydrogeomorphic classification, reference wetlands, and functional indices. U.S. Army Engineer Waterways Experiment Station, Vicksburg, MS. Technical Report WRP-DE-9. Spruill, T. B. 2000. Statistical evaluation of effects of riparian buffers on nitrate and ground water quality. Journal of Environmental Quality 29:1523-1538. Stevens, D. L. Jr. and A. R. Olsen. 1999. Spatially restricted surveys over time for aquatic resources. Journal of Agricultural, Biological, and Environmental Statistics 4:415-428. Stevens, D. L. Jr. and A. R. Olsen. 2000. Spatially-restricted random sampling designs for design-based and model-based estimation. p. 609-616. In Accuracy 2000: Proceedings of the 4th International symposium on spatial accuracy assessment in natural resources and environmental sciences. Delft University Press, Delft, The Netherlands. Tiner, R. W. 2005. Assessing cumulative loss of wetland functions in the Nanticoke River watershed using enhanced national wetlands inventory data. Wetlands 25:405-419. Tiner, R. W. 2004. Remotely-sensed indicators for monitoring the general condition of “natural habitat” in watersheds: an application for Delaware’s Nanticoke River watershed. Ecological Indicators 4:227-243.
Condition Nanticoke Watershed Wetlands Page 55
Tiner, R. W. and Bergquist, J. Q. 2003. Historical Analysis of Wetlands and their Functions for the Nanticoke River Watershed. A Comparison between Pre-settlement and 1998 Conditions. U.S. Fish & Wildlife Service, National Wetlands Inventory, Hadley, MA. (www.mde.state.md.us/Programs/WaterPrograms/Wetlands _Waterways/). Tiner, R., H. C. Bergquist, J. Q. Swords and B. J. McClain. 2001. Watershed-based wetland characterization for Delaware's Nanticoke River watersheds: a preliminary assessment report. National Wetlands Inventory Report. U.S. Fish and Wildlife Service, Northeast Region, Hadley, MA, USA. Tiner, R. W., and D. G. Burke. 1995. Wetlands of Maryland. U.S. Fish and Wildlife Service, Ecological Services, Region 5, Hadley, MA and Maryland Department of Natural Resources, Annapolis, MD. Tiner, R., M. Starr, H. Berquist and J. Swords. 2000. Watershed-based wetland characterization for Maryland's Nanticoke River and Coastal Bays watersheds: a preliminary assessment report. National Wetlands Inventory report. U.S. Fish and Wildlife Service, Northeast Region, Hadley, MA, USA. TNC. 1998. Nanticoke River bioreserve strategic plan. The Nature Conservancy, Bethesda, MD, USA. TNC. 2000. Nanticoke Wetland Monitoring Study. Field Operations Report Year 2000 Field Season. Order No: 9D-1186-NTNX. The Nature Conservancy, Newark, DE. USDC. 2001. (U.S. Dept. of Commerce). TIGER/line files, redistricting census 2000. Metadata file at http://www.census.gov/geo/www/tiger/rd_2ktiger/tlrdmeta.txt. Walbridge, M. R. and J. P. Struthers. 1993. Phosphorus retention in non-tidal palustrine forested wetlands of the mid-Atlantic region. Wetlands 13:84-94. Wardrop, D. H., M. E. Kentula, D. L. Stevens, Jr., S. F. Jensen, and R. P. Brooks. 2007. Assessment of wetland condition: an example from the Upper Juniata Watershed in Pennsylvania, USA. Wetlands.
Weller, D. E., M. N. Snyder, D. F. Whigham, and A. D. Jacobs and T. E. Jordan. 2007. Landscape indicators of wetland condition in the Nanticoke River watershed, Maryland and Delaware, USA. Wetlands. Whigham, D. F., A. Deller Jacobs, D. E. Weller, T. E. Jordan, M. E. Kentula, S. F. Hornsby, and D. L. Stevens. 2007. Combining HGM and EMAP procedures to assess wetlands at the watershed scale-status of flats and non-tidal riverine wetlands in the Nanticoke River Watershed, Delaware and Maryland (USA). Wetlands. Whigham, D. F., D. E. Weller, A. Deller Jacobs, T. E. Jordan, M. E. Kentula. 2003. Assessing the ecological condition of wetlands at the catchment scale. Landschap 20:99-110. Whitmire, S. L., and S. K. Hamilton. 2005. Rapid removal of nitrate and sulfate in freshwater wetland sediments. Journal of Environmental Quality 34:2062-2071. Wigley, T. B. and R. A. Lancia. 1998. Wildlife Communities. P. 205-236. In Messina, M. G. and W. H. Conner (Eds) Southern Forested Wetlands: Ecology and Management. CRC Press, Boca Raton, FL, USA. Zankel, M. A. and A. Olivero. 1999. Mapping and assessing the conservation status of Delmarva Bay wetlands in Delaware. The Nature Conservancy, Newark, DE.
Condition Nanticoke Watershed Wetlands Page 56
APPENDIX A. WETLAND FUNCTIONS Wetlands have unique hydrology, plant communities, soils, and landscape position that allow them to perform a wide range of environmental functions. Functions include providing wildlife habitat, retaining sediments, sequestering nutrients, and storing flood waters. As wetlands are impacted their ability to perform these functions is also affected. These functions can be grouped into five categories: hydrologic flux and storage, biogeochemical cycling and storage, plant community integrity, wildlife habitat integrity, and buffer integrity (Richardson 1994). 3.1 Hydrologic flux and storage Hydrology is the driving force that maintains the unique characteristics of wetlands, including hydrophytic vegetation and hydric soils that differentiate wetlands from uplands. Consequently, hydrology affects most ecosystem functions (Gosselink and Turner 1978). For example, wetland hydrology is integral to supporting other functions such as species richness and composition of macroinvertebrates, vegetation, and amphibians (Brooks 2000, Kirkman et al. 2000, Pechmann et al. 1989), as well as primary productivity, organic deposition, and nutrient flux and cycling (Lockaby and Walbridge 1998). Alterations to a wetland’s natural hydrologic regime will reduce the wetland’s ability to maintain these functions. The hydrologic flux and storage functional category encompasses the ability of a wetland to maintain a characteristic hydrologic regime for a particular HGM subclass of wetland. Specific hydrologic functions that are encompassed within this category include short-term and long-term hydrologic storage, groundwater recharge, maintenance of a high water table, and hydrologic flux. Short-term and long-term storage and groundwater recharge occur when wetlands retain precipitation and surface water then the water is slowly released to the surface and/or ground water or held until it is transpired. By providing short and long-term water storage and groundwater recharge, wetlands reduce the duration and intensity of flooding downstream and maintain base flows of streams (National Research Council 1995). In addition, maintenance of a high water table and hydrologic flux by wetlands maintains the hydrophytic vegetation and hydric soils that differentiate wetlands from uplands. 3.2 Biogeochemical cycling and storage The biogeochemical cycling and storage functional category includes nitrogen transformation, phosphorus retention, sediment retention, and carbon storage. The magnitude of each of these functions is based on the wetland landscape position, morphology, and hydrodynamics but is dominated by inputs and outputs to and from associated streams and uplands (Lockaby and Walbridge 1998). Many biogeochemical functions are unique to wetlands because of the reducing soil conditions that are created due to saturated conditions and microorganisms that are adapted to these conditions. In an unaltered state, wetlands contribute to high water quality through the processes of removing nitrogen and phosphorus from waters before they reach streams and other surface water bodies (Gilliam and Skaggs 1985, Hanson et al. 1994, Jordan et al. 1993, Lowrance 1992, Jacobs and Gilliam 1985, Lowrance et al. 1984). Under anaroebic conditions, denitrification occurs. Denitrification is the process by which microoganisms reduce nitrite and nitrate into
Condition Nanticoke Watershed Wetlands Page 57
oxidized, gaseous forms of nitrogen. In riverine wetlands, this reaction removes nitrates from surface water received from overbank flooding and from groundwater from adjacent uplands. Additionally, in flat and depressional wetlands, denitrification occurs in intercepted ground water and precipitation before it infiltrates to the underlying aquifer (Whitmire and Hamilton 2005). On the Delaware Coastal Plain, nitrogen and phosphorus levels are elevated above EPA standards in many streams and surface waters (DE DNREC 1998, Denver et al. 2004). However, Denver et al. (2004) documented lower nitrate concentrations in ground water that occurred below poorly drained soils with anaerobic conditions than below well drained soils with aerobic conditions, indicating the denitrification process occurring in wetlands can improve water quality. Phosphorus is retained in wetlands through biological and geochemical pathways which trap phosphorus in plants, organic litter, and peat and inorganic sediments (Mitsch and Gosselink 1993, Walbridge and Struthers 1993). Biological pathways via uptake by plants and microorganisms in the soil can be very rapid and efficient, but when the cells die the phosphorus is released (Walbridge and Struthers 1993). However, geochemical processes provide for long-term storage when dissolved phosphate is bound by aluminum, iron and calcium soil minerals resulting in the precipitation of aluminum, iron, and calcium phosphates (Darke and Walbridge 2000, Walbridge and Struthers 1993). Sediment retention is performed when surface waters carrying sediment enter a wetland, the flow of water is slowed and dissipated in the wetland, and sediments precipitate out of the water column. This function is primarily associated with riverine wetlands (Gilliam and Skaggs 1985), however, flats and depressions can trap sediment from overland flow from surrounding uplands during storm events. Craft and Casey (2000) found no difference in sediment accumulation between riverine and depressional wetlands in Georgia and noted that degree of anthropogenic activity surrounding wetlands regulates wetland sediment accumulation. Wetlands provide carbon sequestration through the accumulation of organic carbon in soils and vegetation. This function is important to slow or reduce the emission of carbon dioxide (CO2), which is one of the greenhouse gases contributing to global warming. Alterations to the hydrology (i.e., draining) of a wetland or the removal of vegetation can cause the release of CO2 to the atmosphere when the sequestered organic carbon is oxidized. 3.3 Plant Community Integrity The plant community integrity functional group encompasses the maintenance of biological diversity, providing habitat for wildlife, and supporting biogeochemical cycling processes. The plant community of wetlands is unique because of the ability of species to adapt to anoxic conditions. Depending on the hydrology of a wetland, the plant community can range from being dominated by obligate wetland plants (those species found in wetlands >99% of the time) to a mix of facultative (those species that can be found in both wetlands and uplands). Furthermore, the unique habitats that wetlands support contain many rare plant species. In Delaware, 51 % of all native tidal and nontidal wetland plants are considered rare or uncommon by the Delaware Natural Heritage Program (DE NHP 2003).
Condition Nanticoke Watershed Wetlands Page 58

The individual plant species that have evolved and adapted to wetland systems are important because they support the life cycles of other species. Some species of animals are dependent on specific plant species for food, as a site to deposit eggs, or for materials to build their nests. For example, larvae of the mulberry winged butterfly only feed on Carex stricta, an obligate wetland plant. Additionally, wetland plants provide food for animals during different times of year, and support biogeochemical cycling via uptake, storage, translocation, and decomposition of nutrients and elements. These functions are influenced by the quality and species composition of the plants and leaf litter (Lockaby and Walbridge 1998). Therefore, alterations to the plant species composition affects the survival of numerous dependent organisms, and can change the rate of decomposition and nutrient availability for further biogeochemical cycles. The replacement of wetland species by invasive and/or non-wetland species can rapidly change the species composition of a wetland. 3.4 Wildlife Habitat Integrity Wetlands provide habitat for a diverse array of animals from large mammals to invertebrates in the soil. Some species spend their entire life in wetlands while others use wetlands for part of their life cycle, such as during breeding, nesting, or migration. These species are dependent on the availability of resources provided by the wetland including vegetative structure and standing water. The wildlife habitat integrity functional group encompasses dispersal of plant seeds, support of food webs, transport of energy to uplands and other ecosystems, and recolonization of surrounding wildlife populations (Wigley and Lancia 1998). Additionally, the wildlife communities that are supported provide valuable social and economic benefits to society through hunting and non-consumptive activities (e.g., bird watching). In the Nanticoke watershed, there are approximately 70 animal species that are rare, threatened, or endangered, of which five are globally rare (TNC 1998). Many of these species are found in unique wetland communities such as coastal plain ponds and Atlantic white cedar swamps. The Nanticoke watershed also provides important waterfowl habitat and is a focus area of the North American Waterfowl Management Plan. Tidal wetlands in the lower portion of the watershed also provide nursery areas for fish and shellfish. Wetlands provide unique hydrologic cycles of alternating flooded and dry periods that are important to amphibian communities. Amphibians require suitable upland and wetland habitat for reproduction, protection, and food, and juveniles require standing water until they metamorphose into adults. Additionally, amphibians often comprise a significant portion of the overall biomass of wetlands and are important to maintaining the balance of the system (Keddy et al. 1993). On the Delmarva Peninsula, there are 13 known species of salamanders and 17 species of frogs that depend on wetlands for completion of their life cycle. 3.5 Buffer Integrity Although not a function in and of itself that wetlands perform, the maintenance of an intact, high quality buffer is directly related to the ability of a wetland to perform other functions, and is important to consider when evaluating the overall condition of a site. Protection of a natural buffer surrounding wetlands can support the Maintenance of Characteristic Hydrology functional group by allowing natural hydrologic flow paths in and out of the wetland, and by maintaining interactions with surrounding habitats. For example, the infiltration of precipitation into the land
Condition Nanticoke Watershed Wetlands Page 59
surrounding riverine wetlands is important to feed the shallow aquifer that discharges to the floodplains and stream channels of these wetlands. If the surrounding landuse is altered and flow paths are changed to divert this water source, the wetland hydrology and all other functions that rely on this characteristic hydrology will be altered. In addition, roads in the surrounding landscape and road crossings over streams and floodplains can cause altered flow rates and limit drainage and infiltration by restricting stream migration (Forman and Alexander 1998). Wetland buffers can mediate the effects of alterations in the surrounding landscape on wetland water quality (Brown and Jung 2005, Houlahan and Findlay 2004). Hanson et al. (1994) found that nitrate levels were higher on the side of a riverine wetland that was adjacent to suburban development as compared to the side that was adjacent to undisturbed forest. Additionally, they found that upland areas adjacent to the wetland are important for removing nitrate before it reached the wetland. Roads can increase erosion, sedimentation, and runoff that may contain deicing salts and heavy metals including lead, zinc, chromium, copper, and cadmium (Forman and Alexander 1998). Buffers surrounding wetlands composed of native vegetation can minimize some of these impacts. Many wildlife species are dependent on buffers for breeding, juvenile, and adult habitat (Bried and Ervin 2006, Brown and Jung 2005). Buffers can also provide corridors to other wetlands, which allow dispersal and movement of wildlife (Haig et al. 1998). By connecting habitats, large intact areas are maintained, which is critical for mammals and avian species that have minimum area thresholds for establishing territories (Harris and O’Meara 1989) and for maintaining species richness on the landscape level (Hermann et al. 2005, Kolozsvary et al. 1999). Connecting habitats and producing large complexes can increase the amount of interior habitat and reduce the amount of edge between wetlands and agriculture or development.
Condition Nanticoke Watershed Wetlands Page 60