Concordance between the estimates of wasting measured by ...
10
RESEARCH ARTICLE Open Access Concordance between the estimates of wasting measured by weight-for-height and by mid-upper arm circumference for classification of severity of nutrition crisis: analysis of population-representative surveys from humanitarian settings Oleg Bilukha and Eva Leidman * Abstract Background: Despite frequent use of mid-upper arm circumference (MUAC) to assess populations at risk of nutrition emergencies, as well as evidence that measurement of children based on MUAC identifies different children than weight-for-height (WHZ) as wasted, no crisis classification thresholds based on prevalence of wasting by MUAC currently exist. Methods: We analyzed 733 population-representative anthropometric surveys from 41 countries conducted by Action Contre la Faim (ACF) and the United Nations High Commissioner for Refugees (UNHCR) between 2001 and 2016. Children aged 6–59 months were classified as wasted if they had a WHZ < − 2 and/or a MUAC < 125 mm. Prevalence of wasting as assessed by WHZ and by MUAC were compared using correlations and linear regression models adjusting for stunting prevalence, sex and age distribution of the sample. Median prevalence of wasting by MUAC corresponding to each of the WHZ-based crisis thresholds was examined. Results: Median prevalence of wasting by WHZ was 10.47% (IQR: 6.34–17.55%) and by MUAC was 6.66% (IQR:4.12–10.88%). Prevalence of wasting by WHZ exceeded prevalence by MUAC in 543 (74.1%) surveys and median prevalence by WHZ was greater in 30 (73.17%) countries. Prevalence of wasting by WHZ is poorly correlated with prevalence of wasting by MUAC (ρ = 0.55). R 2 was 0.36 for unadjusted and 0.45 for adjusted linear regression model. The difference between the prevalence by WHZ and by MUAC increased as the overall prevalence by WHZ increased (ρ = 0.69). Surveys with prevalence of wasting by WHZ approximately equal to thresholds for “poor” (5% ± 2.5%), “serious” (10% ± 2.5%), “emergency” (15% ± 2.5%), and “famine” (30% ± 2.5%) were observed to have median prevalence of wasting by MUAC of 4.51% (IQR: 2.73–6.81%), 6.67% (IQR: 4.27–10.03%), 8.15% (IQR: 5.11–11.86%), and 15.71% (IQR: 10.28–17.50%), respectively. There was a very substantial overlap of MUAC values across the threshold categories. Conclusions: Given a poor correlation between population prevalence of wasting by WHZ and by MUAC, classification of surveys based on prevalence of wasting by MUAC will result in poor concordance with current WHZ-based crisis thresholds, even if regional differences are considered, regardless of the cutoffs used. Keywords: Wasting, Survey, Nutrition, Humanitarian * Correspondence: [email protected] Emergency Response and Recovery Branch, Division of Global Health Protection, Center for Global Health, Centers for Disease Control, 1600 Clifton Road, Atlanta, GA 30329, USA © The Author(s). 2018 Open Access This article is distributed under the terms of the Creative Commons Attribution 4.0 International License (http://creativecommons.org/licenses/by/4.0/), which permits unrestricted use, distribution, and reproduction in any medium, provided you give appropriate credit to the original author(s) and the source, provide a link to the Creative Commons license, and indicate if changes were made. The Creative Commons Public Domain Dedication waiver (http://creativecommons.org/publicdomain/zero/1.0/) applies to the data made available in this article, unless otherwise stated. Bilukha and Leidman BMC Nutrition (2018) 4:24 https://doi.org/10.1186/s40795-018-0232-0
Transcript of Concordance between the estimates of wasting measured by ...

RESEARCH ARTICLE Open Access
Concordance between the estimates ofwasting measured by weight-for-heightand by mid-upper arm circumference forclassification of severity of nutrition crisis:analysis of population-representativesurveys from humanitarian settingsOleg Bilukha and Eva Leidman*
Abstract
Background: Despite frequent use of mid-upper arm circumference (MUAC) to assess populations at risk ofnutrition emergencies, as well as evidence that measurement of children based on MUAC identifies differentchildren than weight-for-height (WHZ) as wasted, no crisis classification thresholds based on prevalence of wastingby MUAC currently exist.
Methods: We analyzed 733 population-representative anthropometric surveys from 41 countries conducted byAction Contre la Faim (ACF) and the United Nations High Commissioner for Refugees (UNHCR) between 2001 and2016. Children aged 6–59 months were classified as wasted if they had a WHZ < − 2 and/or a MUAC < 125 mm.Prevalence of wasting as assessed by WHZ and by MUAC were compared using correlations and linear regressionmodels adjusting for stunting prevalence, sex and age distribution of the sample. Median prevalence of wasting byMUAC corresponding to each of the WHZ-based crisis thresholds was examined.
Results: Median prevalence of wasting by WHZ was 10.47% (IQR: 6.34–17.55%) and by MUAC was 6.66% (IQR:4.12–10.88%).Prevalence of wasting by WHZ exceeded prevalence by MUAC in 543 (74.1%) surveys and median prevalence by WHZwas greater in 30 (73.17%) countries. Prevalence of wasting by WHZ is poorly correlated with prevalence of wasting byMUAC (ρ = 0.55). R2 was 0.36 for unadjusted and 0.45 for adjusted linear regression model. The difference betweenthe prevalence by WHZ and by MUAC increased as the overall prevalence by WHZ increased (ρ = 0.69). Surveys withprevalence of wasting by WHZ approximately equal to thresholds for “poor” (5% ± 2.5%), “serious” (10% ± 2.5%),“emergency” (15% ± 2.5%), and “famine” (30% ± 2.5%) were observed to have median prevalence of wasting byMUAC of 4.51% (IQR: 2.73–6.81%), 6.67% (IQR: 4.27–10.03%), 8.15% (IQR: 5.11–11.86%), and 15.71% (IQR: 10.28–17.50%),respectively. There was a very substantial overlap of MUAC values across the threshold categories.
Conclusions: Given a poor correlation between population prevalence of wasting by WHZ and by MUAC, classificationof surveys based on prevalence of wasting by MUAC will result in poor concordance with current WHZ-based crisisthresholds, even if regional differences are considered, regardless of the cutoffs used.
Keywords: Wasting, Survey, Nutrition, Humanitarian
* Correspondence: [email protected] Response and Recovery Branch, Division of Global HealthProtection, Center for Global Health, Centers for Disease Control, 1600 CliftonRoad, Atlanta, GA 30329, USA
© The Author(s). 2018 Open Access This article is distributed under the terms of the Creative Commons Attribution 4.0International License (http://creativecommons.org/licenses/by/4.0/), which permits unrestricted use, distribution, andreproduction in any medium, provided you give appropriate credit to the original author(s) and the source, provide a link tothe Creative Commons license, and indicate if changes were made. The Creative Commons Public Domain Dedication waiver(http://creativecommons.org/publicdomain/zero/1.0/) applies to the data made available in this article, unless otherwise stated.
Bilukha and Leidman BMC Nutrition (2018) 4:24 https://doi.org/10.1186/s40795-018-0232-0
BackgroundPrevalence of acute malnutrition is commonly used tobenchmark the severity of a nutritional emergency to helpinform the scale and scope of humanitarian responseactivities. Prevalence in a given context is comparedwith global standard thresholds. The World HealthOrganization (WHO) initially outlined guidance on thesestandard thresholds in 1995, modifying guidance from a1992 consultation by the WHO Eastern Mediterranean re-gional office [1]. The guidance proposed classification of asituation using thresholds of less than 5% prevalence ofwasting (“acceptable”), less than 10% (“poor”), less than15% (“serious”) and equal to or greater than 15%(“critical”). The Management of Nutrition in MajorEmergencies, a joint guidance document drafted in 2000by WHO, United Nations High Commissioner forRefugees (UNHCR), International Federation of Red Cross(IFRC), and World Food Programme (WFP), includedthese same thresholds prompting a more universal adop-tion [2]. In 2004, the need for a higher, famine thresholdwas proposed by Howe and Devereux [3]. Currently, boththe Integrated Phase Classification (IPC) used in EastAfrica and Asia and the Cadre Harmonisé (CH) used inthe Sahel and West Africa use a cutoff of 30% prevalenceof wasting as a threshold for famine, such that prevalenceof wasting is used to classify a situation as Phase I (< 5%),Phase 2 (5- < 10%), Phase 3 (10- < 15%), Phase 4 (15- < 30%)or Phase 5 (≥ 30%) [4, 5].The above standard thresholds are all based on
prevalence of wasting as assessed by weight-for-height Zscores (WHZ) [1, 2, 4, 5]. In addition to WHZ, wastingcan be assessed using mid-upper arm circumference(MUAC). Since in 2005 WHO, WFP, United NationsChildren’s Fund (UNICEF), and the Standing Committeeon Nutrition (SCN) recommended MUAC as independ-ent measure of wasting used as a criterion for admissioninto selective nutrition feeding programs [6–8]. How-ever, separate thresholds for classifying a crisis based onprevalence of wasting as assessed by MUAC do not exist.Previous research demonstrating substantial discrepancyin diagnosis of children as wasted using WHZ andMUAC has prompted questions about the validity of ap-plying WHZ-based thresholds to estimates of wastingbased on MUAC. Based on an analysis of over 560 sur-veys from 31 countries, WHO estimated that only about4 in 10 children were identified as wasted by both WHZand MUAC, concluding that “the cases selected usingweight-for-height and MUAC were not the same” [6].Multi-country analysis by Grellety et al. using 1832 sur-veys from 47 countries similarly highlighted that a largeproportion of children were identified as wasted byMUAC but not WHZ and by WHZ but not MUAC,adding that the proportion of children in each of thesecategories varied widely by country [9]. Analysis by
Roberfroid et al. found that stunting, sex, and age all in-fluenced diagnosis of acute malnutrition by MUAC butnot WHZ [10]. However, while there is evidence to sug-gest poor correlation between WHZ and MUAC diagno-sis of individual children, whether or not this translatesinto population level differences in prevalence of wastingby WHZ and MUAC has yet to be evaluated.Mid-upper arm circumference is increasingly used to
measure wasting, especially as part of community-basedscreenings and at remote clinics where height boardsand other anthropometric equipment may not beavailable. Additionally, several studies suggest that lowMUAC better predicts mortality than low WHZ, as sum-marized by Briend et al [11]. MUAC only assessmentsare particularly common in humanitarian settings withextreme insecurity. In the absence of clear guidance onthresholds for classifying prevalence of acute malnutri-tion by MUAC, the WHZ-based thresholds have beenapplied in many contexts. The Cadre Harmonisé, for ex-ample, recommends this approach for the Sahel andWest Africa [4]. The Integrated Food Security andNutrition Phase Classification technical committee hasidentified the need for secondary analysis of existing sur-vey data to explore the possibility of deriving the thresh-olds for classifying severity of wasting at the populationlevel using prevalence of wasting by MUAC where WHZbased anthropometry data are not available.The objective of this research therefore was to explore
the concordance of the prevalence of wasting by WHZand MUAC at the population level and the possibility ofderiving MUAC-based crisis thresholds corresponding tothe existing WHZ-based thresholds. The focus of theanalysis was on total rather than severe wasting, asWHO-recommended emergency thresholds are basedon the prevalence of total wasting [1, 2]. To this aim, weassessed the correlation of prevalence of low MUAC andlow WHZ in survey samples globally, as well as de-scribed prevalence of wasting by MUAC in populationswith prevalence approximately equal to poor, serious,critical, and famine thresholds as determined by WHZ.
MethodsData included in these analyses were from small-scale fieldnutrition surveys conducted in humanitarian settings byAction Contre la Faim (ACF) International (an inter-national humanitarian non-governmental organizationfocused on nutrition in humanitarian settings worldwide)and by the United Nations High Commissioner forRefugees (UNHCR). Data were drawn from a database of808 population-representative cross sectional surveys con-ducted between 2001 and 2016 [12, 13]. Surveys withsample sizes smaller than 196 persons and cluster surveyswith fewer than 25 clusters were excluded a priori from allanalyses as they did not meet minimum standards for
Bilukha and Leidman BMC Nutrition (2018) 4:24 Page 2 of 10
small-scale cluster surveys [9]. Surveys that did not collectboth MUAC and weight-for-height (weight, height, ageand sex) were also excluded.Weight-for-Height Z-scores (WHZ) were calculated
for each child using the WHO 2006 growth standardsusing the WHO SAS macro [14]. Only children aged6–59 months were included in the analyses. Prevalence ofwasting by WHZ for each survey reflects the proportionof children with WHZ less than − 2. Outlier observationswere excluded from a survey if Z-score of a child fell out-side the flexible exclusion range of ±4 Z-scores from theobserved survey sample mean, as described by WHO [1].Prevalence of wasting by MUAC for each survey reflectsthe proportion of children with MUAC values less than125 mm. MUAC values less than 70 mm and greater than220 mm were excluded as outliers. Individual observationswithin each survey were also excluded from calculationsof wasting by WHZ for children without information onheight, weight, age or sex and from calculations of wastingby MUAC for children without information on MUACand age. Cases of bilateral pitting edema were notincluded in estimated prevalence of wasting by WHZ orMUAC; edema cases were relatively rare in all surveys,representing approximately 3 per 1000 (mean: 0.32%)sampled children.Countries where the surveys were conducted were cat-
egorized into seven geographical or country groupings(Latin America and the Caribbean; Eastern and SouthernAfrica; Democratic Republic of Congo (DRC); West andCentral Africa; South, Southeast Asia and Pacific; Sudan;Middle East and North Africa) as seen in Table 1. DRCand Sudan were analyzed as its own grouping given thelarge number of surveys conducted in both countries.The first aim of the analysis was to describe the rela-
tionship between prevalence of wasting as assessed byWHZ and the prevalence of wasting as assessed byMUAC on the same population. Spearman correlationswere therefore calculated to describe the correlation be-tween prevalence of wasting by WHZ and by MUAC, aswell as between the difference in prevalence by WHZand MUAC and the prevalence by each WHZ andMUAC survey. A multivariate model was then con-structed to explore the relationship of the prevalence byWHZ and by MUAC, controlling for key factors shownin previous research to be associated with the prevalenceof wasting by MUAC. These factors included stuntingprevalence, sex distribution, and age distribution of thesurvey sample [10]. Prevalence of wasting by MUAC asan outcome and all predictor variables were modeled ascontinuous linear terms. Sex ratio was calculated as theproportion of females in the survey sample. Age ratiowas calculated as the proportion of younger childrenaged 6–29 months in the survey sample. Observationswith significantly high leverage or Cook’s distance were
removed from the multivariable analyses. The regressionanalysis was repeated using logit-transformed independ-ent and dependent variables [15]. To assess the re-producibility of the results, analysis above was repeatedwith DRC included in the West and Central Africaregion and Sudan included in the Middle East NorthAfrica, and separately for surveys conducted by ACFand UNHCR.Second, we described the prevalence of wasting by
MUAC in surveys with the prevalence of wasting byWHZ corresponding to the existing WHZ-based crisisthresholds (5, 10, 15 and 30%) to assess the feasibility ofderiving corresponding thresholds using MUAC. Surveyswith prevalence of wasting by WHZ within ±2.5% of the5, 10, 15, and 30% crisis thresholds were included in theanalysis. For example, to explore prevalence of MUACthat may correspond to the 10% WHZ-based crisisthreshold we used surveys with a prevalence of wastingby WHZ between 7.5 and 12.5%. Median and interquar-tile range (IQR) for prevalence of wasting by MUACwere calculated for each of the sub-sets of surveys withprevalence approximately equal to the four thresholds,overall and by geographic region. The analysis wasrepeated using only the surveys within ±1.5% of thecrisis thresholds.Finally, we explored concordance of the possible
MUAC classification by determining the proportion ofsurveys that would be classified into the same crisiscategory if categorized separately based on prevalence ofwasting by WHZ and by MUAC. An example set ofMUAC thresholds was used for this classification,derived from the observed median values observed inthe previous stage analysis.All data were aggregated and cleaned using SAS
Version 9.3, analysis was performed in Stata IC Version 14.2,and figures were produced in JMP Version 13.0.0.
ResultsIn total, 808 surveys were reviewed for this study.Seventy-five surveys were excluded from the analysis: 60surveys did not collect MUAC measurements and an-other 15 had fewer than 25 clusters and/or had a samplesize smaller than 196 children, resulting in 733 surveysfrom 41 countries retained for analysis. As seen inTable 1, the countries with the largest number of sur-veys were Sudan (150 surveys), DRC (130), Chad (67),Ethiopia (59) and Kenya (46). All other countries had 32of fewer surveys each. Among selected surveys, 0.7% ofchildren aged 6–59 months were excluded due tomissing anthropometric values (sex, weight, height orMUAC) and an additional 0.4% were excluded due toout of range values for WHZ or MUAC. After exclu-sions, these surveys represent data from approximately550 thousand children.
Bilukha and Leidman BMC Nutrition (2018) 4:24 Page 3 of 10
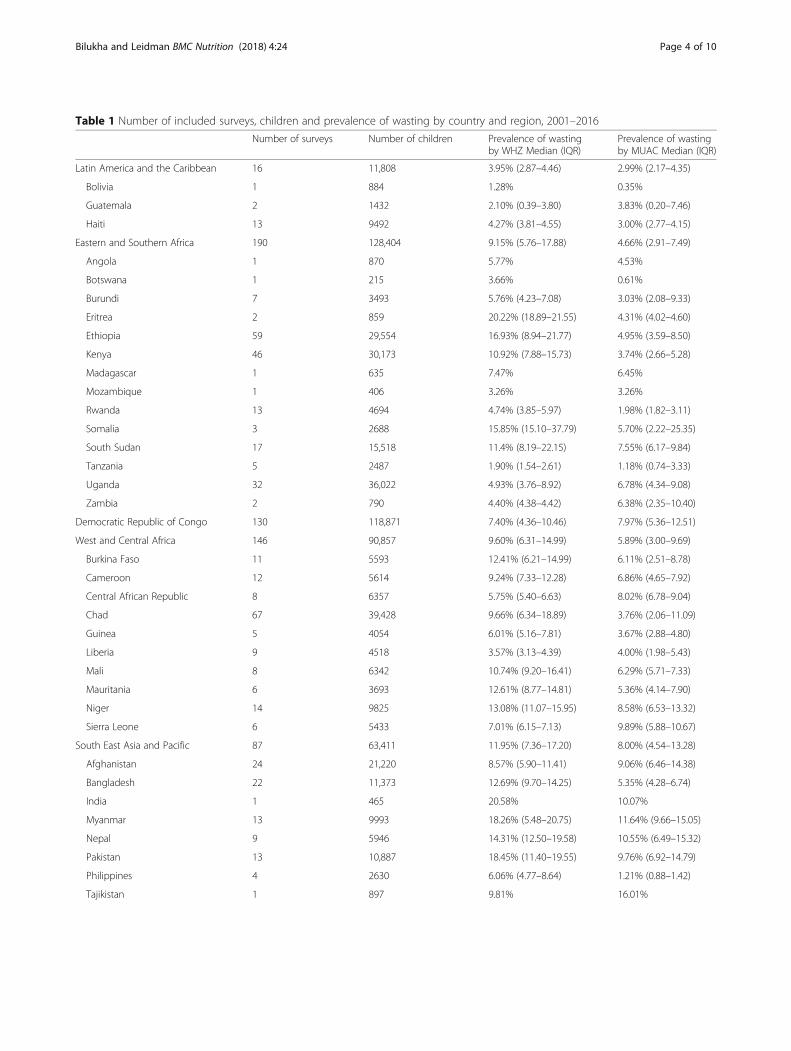
Table 1 Number of included surveys, children and prevalence of wasting by country and region, 2001–2016
Number of surveys Number of children Prevalence of wastingby WHZ Median (IQR)
Prevalence of wastingby MUAC Median (IQR)
Latin America and the Caribbean 16 11,808 3.95% (2.87–4.46) 2.99% (2.17–4.35)
Bolivia 1 884 1.28% 0.35%
Guatemala 2 1432 2.10% (0.39–3.80) 3.83% (0.20–7.46)
Haiti 13 9492 4.27% (3.81–4.55) 3.00% (2.77–4.15)
Eastern and Southern Africa 190 128,404 9.15% (5.76–17.88) 4.66% (2.91–7.49)
Angola 1 870 5.77% 4.53%
Botswana 1 215 3.66% 0.61%
Burundi 7 3493 5.76% (4.23–7.08) 3.03% (2.08–9.33)
Eritrea 2 859 20.22% (18.89–21.55) 4.31% (4.02–4.60)
Ethiopia 59 29,554 16.93% (8.94–21.77) 4.95% (3.59–8.50)
Kenya 46 30,173 10.92% (7.88–15.73) 3.74% (2.66–5.28)
Madagascar 1 635 7.47% 6.45%
Mozambique 1 406 3.26% 3.26%
Rwanda 13 4694 4.74% (3.85–5.97) 1.98% (1.82–3.11)
Somalia 3 2688 15.85% (15.10–37.79) 5.70% (2.22–25.35)
South Sudan 17 15,518 11.4% (8.19–22.15) 7.55% (6.17–9.84)
Tanzania 5 2487 1.90% (1.54–2.61) 1.18% (0.74–3.33)
Uganda 32 36,022 4.93% (3.76–8.92) 6.78% (4.34–9.08)
Zambia 2 790 4.40% (4.38–4.42) 6.38% (2.35–10.40)
Democratic Republic of Congo 130 118,871 7.40% (4.36–10.46) 7.97% (5.36–12.51)
West and Central Africa 146 90,857 9.60% (6.31–14.99) 5.89% (3.00–9.69)
Burkina Faso 11 5593 12.41% (6.21–14.99) 6.11% (2.51–8.78)
Cameroon 12 5614 9.24% (7.33–12.28) 6.86% (4.65–7.92)
Central African Republic 8 6357 5.75% (5.40–6.63) 8.02% (6.78–9.04)
Chad 67 39,428 9.66% (6.34–18.89) 3.76% (2.06–11.09)
Guinea 5 4054 6.01% (5.16–7.81) 3.67% (2.88–4.80)
Liberia 9 4518 3.57% (3.13–4.39) 4.00% (1.98–5.43)
Mali 8 6342 10.74% (9.20–16.41) 6.29% (5.71–7.33)
Mauritania 6 3693 12.61% (8.77–14.81) 5.36% (4.14–7.90)
Niger 14 9825 13.08% (11.07–15.95) 8.58% (6.53–13.32)
Sierra Leone 6 5433 7.01% (6.15–7.13) 9.89% (5.88–10.67)
South East Asia and Pacific 87 63,411 11.95% (7.36–17.20) 8.00% (4.54–13.28)
Afghanistan 24 21,220 8.57% (5.90–11.41) 9.06% (6.46–14.38)
Bangladesh 22 11,373 12.69% (9.70–14.25) 5.35% (4.28–6.74)
India 1 465 20.58% 10.07%
Myanmar 13 9993 18.26% (5.48–20.75) 11.64% (9.66–15.05)
Nepal 9 5946 14.31% (12.50–19.58) 10.55% (6.49–15.32)
Pakistan 13 10,887 18.45% (11.40–19.55) 9.76% (6.92–14.79)
Philippines 4 2630 6.06% (4.77–8.64) 1.21% (0.88–1.42)
Tajikistan 1 897 9.81% 16.01%
Bilukha and Leidman BMC Nutrition (2018) 4:24 Page 4 of 10

Prevalence of wasting by WHZ was higher than byMUAC for most surveys. Median prevalence of wastingby WHZ was 10.47% (IRQ: 6.34–17.55%) and by MUACwas 6.66% (IQR: 4.12–10.88%) (Table 1). Prevalence ofwasting by WHZ exceeded prevalence by MUAC in 543(74.1%) surveys and median prevalence by WHZ wasgreater in 30 (73.17%) countries. The difference inmedian prevalence was greatest among surveys in EastAfrica such as Eritrea (15.91%), Ethiopia (11.98%), andSomalia (10.15%) as well as in India (10.51%).The data suggest a positive but relatively weak mono-
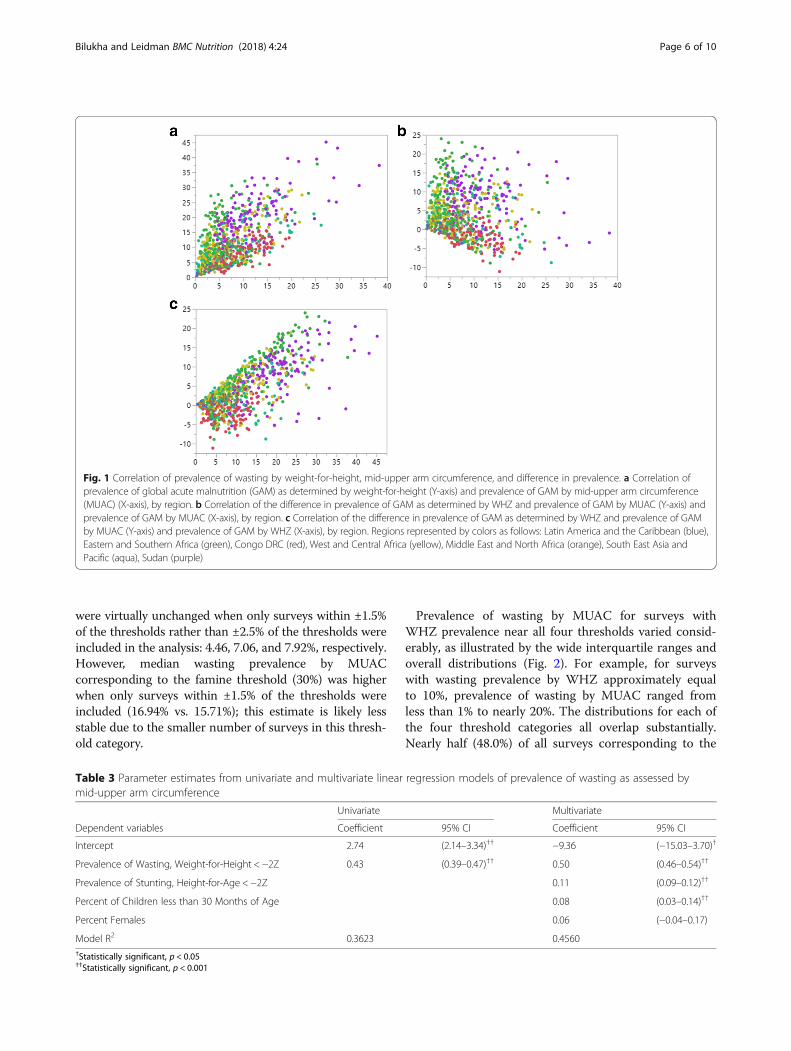
tonic correlation (ρ = 0.5485) between prevalence ofwasting by WHZ and by MUAC (Table 2 and Fig. 1a).By region, correlation was highest for the Middle Eastand North Africa (ρ = 0.8901) and DRC (ρ = 0.6822) andlowest for Eastern and Southern Africa (ρ = 0.3553). Rhofor all surveys was improved when prevalence of wastingby WHZ was correlated with the difference between theprevalence of wasting by WHZ and by MUAC (ρ = 0.6859).Notably, difference in prevalence by WHZ and by MUACwas greatest for surveys with higher prevalence of wastingby WHZ. Conversely, overall correlation was lowest whenprevalence of wasting by MUAC was correlated with thedifference between the prevalence of wasting by WHZ andby MUAC (ρ = − 0.1634). The strength of the correlationvaried by region (Table 2 and Fig. 1b, c). These correlationsdid not change markedly when surveys from ACF andUNHCR were analyzed separately (not presented).
R2 in the univariate linear model with prevalence ofWHZ as a predictor and prevalence by MUAC as anoutcome was 0.36. R2 in the multivariate model adjustedfor prevalence of stunting, the proportion of youngerchildren (aged 6–29 months of age), and the proportionof females, increased to 0.46 (Table 3). Multivariatemodel results suggest that a 1% increase in prevalence ofwasting by WHZ was associated with a 0.5% increase inprevalence of wasting by MUAC; this association washighly significant (p < 0.001). All other co-variates werealso positively associated with prevalence of wasting byMUAC. Prevalence of stunting and the proportion ofyounger children were both significant (p < 0.001 for both),whereas the proportion of females was not (p = 0.218)(Table 3). Logit transformation of all variables in the modeldid not improve fit of either univariate or multivariatemodels (R2 = 0.35 and 0.43, respectively).Table 4 and Fig. 2 present the median prevalence of
wasting by MUAC corresponding to each of theWHZ-based crisis thresholds (5, 10, 15, and 30%).Overall, median prevalence of wasting by MUAC was4.51% (IQR: 2.73–6.81%) for surveys near the “poor”threshold (5 ± 2.5%), 6.67% (IQR: 4.27–10.03%) forsurveys near the “serious” threshold (10 ± 2.5%), 8.15%(IQR: 5.11–11.86%) for surveys near the “emergency”threshold (15 ± 2.5%), and 15.71% (IQR: 10.28–17.50%)for surveys near the “famine” threshold (30 ± 2.5%).Median MUAC thresholds corresponding to 5, 10, 15%
Table 1 Number of included surveys, children and prevalence of wasting by country and region, 2001–2016 (Continued)
Number of surveys Number of children Prevalence of wastingby WHZ Median (IQR)
Prevalence of wastingby MUAC Median (IQR)
Sudan 150 130,735 18.96% (14.06–23.82) 10.21% (7.05–14.26)
Middle East North Africa 14 5602 6.69% (2.28–12.02) 3.46% (1.23–5.75)
Djibouti 6 2190 11.42% (10.39–13.84) 5.20% (3.78–7.27)
Iraq 1 575 2.28% 3.14%
Jordan 4 1610 1.18% (0.88–2.04) 1.01% (0.69–1.15)
Yemen 3 1227 5.59% (3.61–17.17) 4.14% (2.38–6.53)
All Surveys 733 549,688 10.47% (6.34–17.55) 6.66% (4.12–10.88)
Table 2 Spearman’s correlation (rho) for prevalence of wasting by weight-for-height and by mid-upper arm circumference overalland differences in prevalencea
WHZ v. MUAC (WHZ- MUAC) v MUAC (WHZ-MUAC) v WHZ
Latin America and Caribbean 0.3667 −0.6377 0.3726
Eastern and Southern Africa 0.3553 −0.1599 0.8279
Congo, DRC 0.6822 −0.4811 0.2513
West and Central Africa 0.6247 −0.0886 0.6652
Sudan 0.6187 −0.1317 0.6210
Middle East North Africa 0.8901 0.6352 0.8857
South East Asia and Pacific 0.5639 −0.4296 0.4501
All Surveys 0.5485 −0.1634 0.6859aRho values greater than 0.5 are indicated in bold
Bilukha and Leidman BMC Nutrition (2018) 4:24 Page 5 of 10
were virtually unchanged when only surveys within ±1.5%of the thresholds rather than ±2.5% of the thresholds wereincluded in the analysis: 4.46, 7.06, and 7.92%, respectively.However, median wasting prevalence by MUACcorresponding to the famine threshold (30%) was higherwhen only surveys within ±1.5% of the thresholds wereincluded (16.94% vs. 15.71%); this estimate is likely lessstable due to the smaller number of surveys in this thresh-old category.
Prevalence of wasting by MUAC for surveys withWHZ prevalence near all four thresholds varied consid-erably, as illustrated by the wide interquartile ranges andoverall distributions (Fig. 2). For example, for surveyswith wasting prevalence by WHZ approximately equalto 10%, prevalence of wasting by MUAC ranged fromless than 1% to nearly 20%. The distributions for each ofthe four threshold categories all overlap substantially.Nearly half (48.0%) of all surveys corresponding to the
Fig. 1 Correlation of prevalence of wasting by weight-for-height, mid-upper arm circumference, and difference in prevalence. a Correlation ofprevalence of global acute malnutrition (GAM) as determined by weight-for-height (Y-axis) and prevalence of GAM by mid-upper arm circumference(MUAC) (X-axis), by region. b Correlation of the difference in prevalence of GAM as determined by WHZ and prevalence of GAM by MUAC (Y-axis) andprevalence of GAM by MUAC (X-axis), by region. c Correlation of the difference in prevalence of GAM as determined by WHZ and prevalence of GAMby MUAC (Y-axis) and prevalence of GAM by WHZ (X-axis), by region. Regions represented by colors as follows: Latin America and the Caribbean (blue),Eastern and Southern Africa (green), Congo DRC (red), West and Central Africa (yellow), Middle East and North Africa (orange), South East Asia andPacific (aqua), Sudan (purple)
Table 3 Parameter estimates from univariate and multivariate linear regression models of prevalence of wasting as assessed bymid-upper arm circumference
Univariate Multivariate
Dependent variables Coefficient 95% CI Coefficient 95% CI
Intercept 2.74 (2.14–3.34)†† −9.36 (−15.03–3.70)†
Prevalence of Wasting, Weight-for-Height < −2Z 0.43 (0.39–0.47)†† 0.50 (0.46–0.54)††
Prevalence of Stunting, Height-for-Age < −2Z 0.11 (0.09–0.12)††
Percent of Children less than 30 Months of Age 0.08 (0.03–0.14)††
Percent Females 0.06 (−0.04–0.17)
Model R2 0.3623 0.4560†Statistically significant, p < 0.05††Statistically significant, p < 0.001
Bilukha and Leidman BMC Nutrition (2018) 4:24 Page 6 of 10
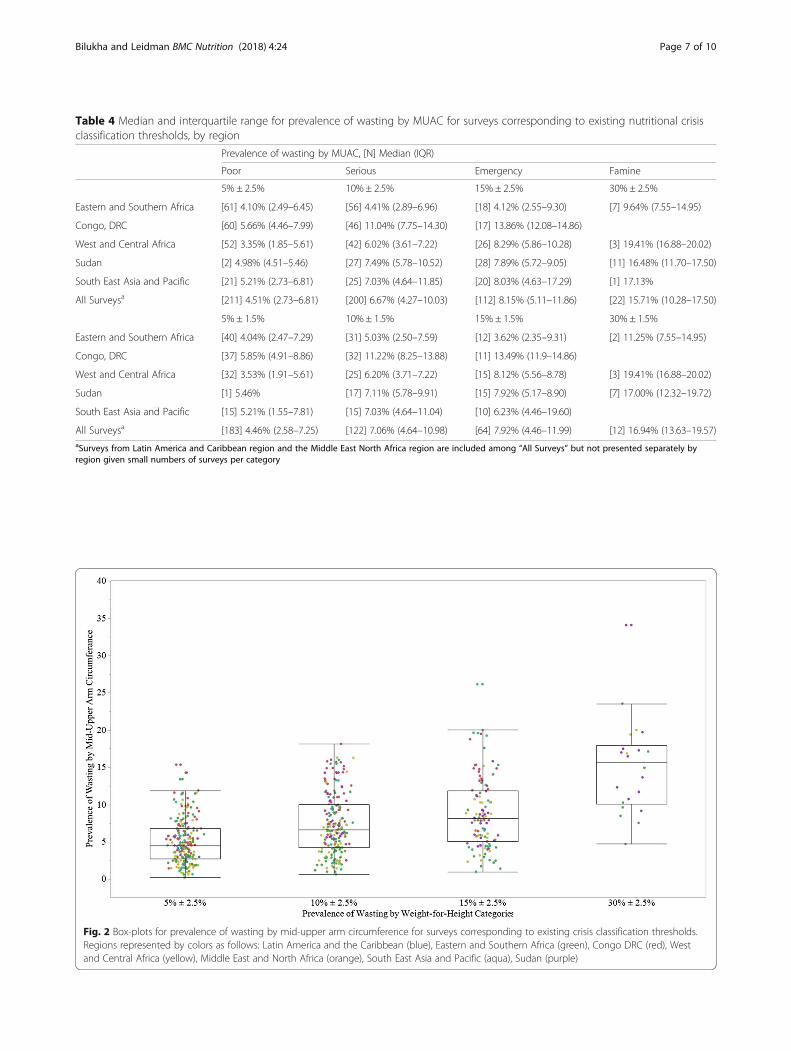
Table 4 Median and interquartile range for prevalence of wasting by MUAC for surveys corresponding to existing nutritional crisisclassification thresholds, by region
Prevalence of wasting by MUAC, [N] Median (IQR)
Poor Serious Emergency Famine
5% ± 2.5% 10% ± 2.5% 15% ± 2.5% 30% ± 2.5%
Eastern and Southern Africa [61] 4.10% (2.49–6.45) [56] 4.41% (2.89–6.96) [18] 4.12% (2.55–9.30) [7] 9.64% (7.55–14.95)
Congo, DRC [60] 5.66% (4.46–7.99) [46] 11.04% (7.75–14.30) [17] 13.86% (12.08–14.86)
West and Central Africa [52] 3.35% (1.85–5.61) [42] 6.02% (3.61–7.22) [26] 8.29% (5.86–10.28) [3] 19.41% (16.88–20.02)
Sudan [2] 4.98% (4.51–5.46) [27] 7.49% (5.78–10.52) [28] 7.89% (5.72–9.05) [11] 16.48% (11.70–17.50)
South East Asia and Pacific [21] 5.21% (2.73–6.81) [25] 7.03% (4.64–11.85) [20] 8.03% (4.63–17.29) [1] 17.13%
All Surveysa [211] 4.51% (2.73–6.81) [200] 6.67% (4.27–10.03) [112] 8.15% (5.11–11.86) [22] 15.71% (10.28–17.50)
5% ± 1.5% 10% ± 1.5% 15% ± 1.5% 30% ± 1.5%
Eastern and Southern Africa [40] 4.04% (2.47–7.29) [31] 5.03% (2.50–7.59) [12] 3.62% (2.35–9.31) [2] 11.25% (7.55–14.95)
Congo, DRC [37] 5.85% (4.91–8.86) [32] 11.22% (8.25–13.88) [11] 13.49% (11.9–14.86)
West and Central Africa [32] 3.53% (1.91–5.61) [25] 6.20% (3.71–7.22) [15] 8.12% (5.56–8.78) [3] 19.41% (16.88–20.02)
Sudan [1] 5.46% [17] 7.11% (5.78–9.91) [15] 7.92% (5.17–8.90) [7] 17.00% (12.32–19.72)
South East Asia and Pacific [15] 5.21% (1.55–7.81) [15] 7.03% (4.64–11.04) [10] 6.23% (4.46–19.60)
All Surveysa [183] 4.46% (2.58–7.25) [122] 7.06% (4.64–10.98) [64] 7.92% (4.46–11.99) [12] 16.94% (13.63–19.57)aSurveys from Latin America and Caribbean region and the Middle East North Africa region are included among “All Surveys” but not presented separately byregion given small numbers of surveys per category
Fig. 2 Box-plots for prevalence of wasting by mid-upper arm circumference for surveys corresponding to existing crisis classification thresholds.Regions represented by colors as follows: Latin America and the Caribbean (blue), Eastern and Southern Africa (green), Congo DRC (red), Westand Central Africa (yellow), Middle East and North Africa (orange), South East Asia and Pacific (aqua), Sudan (purple)
Bilukha and Leidman BMC Nutrition (2018) 4:24 Page 7 of 10

10% threshold (± 2.5%), have prevalence of wasting withinthe IQR for the 15% threshold (± 2.5%), too great an over-lap to allow for meaningful discriminatory power.Median prevalence of wasting by MUAC for each
threshold category varied by region, suggesting that re-gional variation contributed to the overall variability ob-served. For surveys with prevalence of wasting by WHZapproximately equal to the 5, 10 and 15% thresholds,median wasting prevalence by MUAC was greatest inthe DRC. Median wasting by MUAC in DRC was nearlydouble that of surveys from West and Central Africa forsurveys with wasting by WHZ of 5 ± 2.5 and 10% ±2.5%and more than triple that of surveys from Eastern andSouthern Africa with wasting prevalence by WHZ of15 ± 2.5%. Median prevalence of wasting by MUAC wasalso lowest in Eastern and Southern Africa for surveysnear the famine threshold (30 ± 2.5%).Due to the large observed variation in wasting
prevalence by MUAC corresponding to the currentWHZ-based crisis thresholds, classification of surveysbased on prevalence of MUAC and WHZ independentlyresulted in poor concordance regardless of the MUAC-based thresholds used. Table 5 presents as illustrationthe proportion of surveys that would be classified intothe same crisis category using a dozen MUAC thresholdcombinations derived based on analysis presented inTable 4 when compared with WHZ-categories of 5, 15and 30%. In all iterations, approximately 4 in 10 surveyswere classified into the same crisis category. No combin-ation of MUAC-based thresholds achieved greater than50% concordance. Notably, Table 5 only contains sug-gested MUAC thresholds corresponding to 5, 15 and30% WHZ thresholds. As shown in the previous ana-lyses, the overlap in MUAC values around 10 and 15%WHZ thresholds was too great to suggest a separate
meaningful MUAC threshold for 10% WHZ threshold.Including this threshold generally resulted in a lowerproportion of concordant surveys.
DiscussionAnalysis presented in this paper aimed to assess the feasi-bility of developing thresholds for determining the severityof a crisis in contexts where assessments of wasting usingweight-for-height, the indicator for which WHO recom-mended emergency thresholds exist, were not practicaland only mid-upper arm circumference could be mea-sured. However, analysis of survey data from over 700 sur-veys from more than 40 countries suggests that prevalenceof wasting as assessed by MUAC was poorly correlatedwith prevalence of wasting by WHZ. Correlation was notsubstantively improved when analysis was repeatedseparately by region; rho values for all regions were below0.7. Consistent with previous literature [10], multivariablemodel demonstrated that an increase in prevalence ofwasting by MUAC was significantly associated with an in-creased prevalence of stunting and an increased proportionof younger children (6 to 29 months of age) in the surveysample. Proportion of females in the sample was not sig-nificantly associated with the prevalence of wasting byMUAC. However, while prevalence of stunting and theproportion of younger children were both significant,including them in the model did not markedly improve fit(R2 multivariate = 0.46; R2 univariate = 0.36). A poorcorrelation of wasting prevalence as assessed by WHZand MUAC is consistent with previous literature oninconsistencies in diagnosis of individual children aswasted using WHZ and MUAC [6, 9, 10].Prevalence of wasting in most contexts was higher
when assessed by WHZ than MUAC, however the re-verse was true in approximately a quarter of all surveys.
Table 5 Classification into crisis categories surveys by prevalence of wasting by mid-upper arm circumference
Crisis categories based on prevalence of wasting by mid-upper arm circumference Percentconcordance(N = 733)
0- < 5%Acceptable
5- < 15%Poor/Serious
15- < 30%Emergency
≥ 30%Famine
1 < 4% 4- < 7% 7- < 16% ≥ 16% 41.88%
2 < 4% 4- < 7% 7- < 17% ≥ 17% 42.84%
3 < 4% 4- < 8% 8- < 16% ≥ 16% 44.75%
4 < 4% 4- < 8% 8- < 17% ≥ 17% 45.70%
5 < 4% 4- < 9% 9- < 16% ≥ 16% 46.38%
6 < 4% 4- < 9% 9- < 17% ≥ 17% 47.34%
7 < 5% 5- < 7% 7- < 16% ≥ 16% 37.93%
8 < 5% 5- < 7% 7- < 17% ≥ 17% 38.88%
9 < 5% 5- < 8% 8- < 16% ≥ 16% 40.79%
10 < 5% 5- < 8% 8- < 17% ≥ 17% 41.75%
11 < 5% 5- < 9% 9- < 16% ≥ 16% 42.43%
12 < 5% 5- < 9% 9- < 17% ≥ 17% 43.38%
Bilukha and Leidman BMC Nutrition (2018) 4:24 Page 8 of 10

The difference in prevalence of wasting by WHZ andMUAC varied considerably, even within the samecountry and region. Interestingly, our analysis suggestthat this difference in prevalence was more strongly cor-related with prevalence of wasting by WHZ (ρ = 0.69)than the correlation of the two prevalence estimates dir-ectly (ρ = 0.55). On the other hand, this difference inprevalence was poorly correlated with the prevalence ofwasting by MUAC (ρ = − 0.16). Given the main focus ofthis analysis on predicting prevalence of wasting byWHZ in contexts where only wasting by MUAC isknown, the high correlation of wasting by WHZ and thedifference in wasting prevalence has limited practical utility;wasting by MUAC has very little predictive power on thedifference between the prevalence by WHZ and MUAC.Developing an algorithm for conversion between
prevalence of wasting by MUAC and WHZ, or convert-ing WHZ-based thresholds to MUAC-based thresholds,is inadvisable given the observed correlation and highheteroscedasticity. Previous research deriving formulasfor converting between prevalence estimates have beenbased on much stronger correlations. For example, thealgorithm to convert from estimates of child malnutri-tion using the National Center for Health Statistics(NCHS) growth reference to estimates using the newWHO growth standards was based on a very high degreeof fit (R2 > 0.9) of the regression models used to deriveconversion formulas; R2 for wasting model was 0.96 [15].The follow-up analysis presented in Tables 4 and 5
and Fig. 2 illustrates how poor correlation betweenprevalence of wasting by WHZ and MUAC translatesinto frequent discordant classification using MUAC- andWHZ-based thresholds. For surveys with prevalence ofwasting by WHZ within ±1.5% of each of the crisisthresholds, the prevalence of wasting by MUAC variedby 15% points or more for each threshold. The box plotsfor wasting prevalence by MUAC for surveys nearthresholds of 10 and 15% as assessed by WHZ over-lapped almost entirely. Even when serious and emer-gency categories were combined, no combination ofthresholds resulted in concordant phase classification ofwasting by WHZ and MUAC for more than half of thesurveys. Further, the data do not support the develop-ment of region-specific thresholds. While median preva-lence of wasting by MUAC for surveys within ±1.5% ofeach of the crisis thresholds did vary by region, withinregions the variability of prevalence around the medianremained high. Findings on poor correlation betweenprevalence of wasting by WHZ and MUAC confirm thatMUAC-based thresholds cannot be derived from WHZ-based thresholds. They also highlight the broader issueof the lack of evidence that underlies the indicators cur-rently used to classify severity of emergencies. Furtherresearch would be needed to develop MUAC-based
thresholds that are independent of the current WHZ-based thresholds and objectively define crisis severity,potentially considering functional outcomes (e.g., mor-bidity, mortality), and response to treatment.This analysis is subject to several limitations. First, in-
cluded surveys disproportionately represent countrieswith refugees, displaced persons, and/or experiencingchronic nutrition emergencies—Democratic Republic ofCongo, Sudan, Chad, Ethiopia, Kenya. Surveys were allconducted by one of two agencies (ACF and UNHCR).This analysis includes only surveys made available foranalysis. If repeated on a different set of surveys, thisanalysis may yield slightly different estimates, howeverthe overall pattern of relationship is not likely to change.Second, the dataset contains relatively few surveys withvery high prevalence (near famine thresholds) reflectingthe fact that these contexts are fortunately relativelyrare. Estimates of wasting prevalence by MUAC corre-sponding with high wasting prevalence by WHZ aretherefore less stable compared with estimates for lowerprevalence thresholds. Finally, while available dataallowed for adjustment in regression analysis for keypredictors of MUAC such as stunting, age and sex distri-bution, data on sitting-to-standing height ratio, anothermoderately important predictor of wasting by MUACdiagnosis was not measured in the surveys [10].
ConclusionIn summary, estimates of wasting from MUAC-only as-sessments, such as those collected in humanitarian con-texts with great insecurity, cannot be reliably converted toestimates of wasting by WHZ as prevalence of wastingassessed by MUAC is poorly correlated with prevalencewasting assessed by WHZ. As such, data presented in thisanalysis does not support the development of MUAC-based crisis thresholds corresponding with the currentWHZ-based thresholds. In addition, applying currentWHZ-based thresholds (5, 10, 15, 30%) to prevalence ofwasting assessed by MUAC is not recommended, espe-cially in contexts with high prevalence of wasting byWHZ. As demonstrated, the difference in prevalence ofwasting as assessed by WHZ and by MUAC is greatest incrises when wasting becomes more prevalent, so the esti-mates from MUAC-only assessments will tend to providelower estimates of crisis severity than WHZ.
AbbreviationsACF: Action Contre la Faim; CH: Cadre Harmonisé; DRC: Democratic Republicof Congo; IFRC: International Federation of Red Cross; IPC: Integrated PhaseClassification; IQR: Interquartile range; MUAC: Mid-upper arm circumference;SCN: Standing Committee on Nutrition; UNHCR: United Nations HighCommissioner for Refugees; UNICEF: United Nations Children’s Fund;WHO: World Health Organization; WHZ: Weight-for-height Z scores
AcknowledgementsErin Hulland, CDC; Curtis Blanton, CDC; Rebecca Wee, CDC; Action Contre laFaim (ACF); United Nations High Commissioner for Human Rights (UNHCR).
Bilukha and Leidman BMC Nutrition (2018) 4:24 Page 9 of 10

Availability of data and materialsThe data that support the findings of this study are available from ActionContre la Faim and the United Nations High Commissioner for HumanRights but restrictions apply to the availability of these data, which wereused under license for the current study, and so are not publicly available.Data are however available from the authors upon reasonable request andwith permission of Action Contre la Faim and the United Nations HighCommissioner for Human Rights.
Authors’ contributionsBoth authors contributed equally to this study. EL, OB designed the study,EL, OB collected the data, EL, OB analyzed and interpreted the data, EL andOB drafted the manuscript, EL, OB critically revised the manuscript forimportant intellectual content. EL, OB read and approved the finalmanuscript. EL is a guarantor. Both authors have readand approved the manuscript, have full access to all of the data, and takeresponsibility for the integrity of the data and the accuracy of the data analysis.
Ethics approval and consent to participateNot applicable. Analysis based on secondary analysis of anonymized datawhere no individual data could be identified so formal ethical clearance wasnot required. Permission to use the data were obtained from theorganizations collecting the datasets.The findings and conclusions in this report are those of the authors and donot necessarily represent the official position of the Centers for DiseaseControl. UNHCR data is part of the Public Health Dataset. UNHCR does notwarrant in any way the accuracy of the data or information reproduced fromthe provided Public Health Dataset and may not be held liable for any losscaused by reliance on the accuracy or reliability thereof.
Competing interestsAll authors declare that they have no competing interests; no support fromany organization for the submitted work; no financial relationships with anyorganizations that might have an interest in the submitted work in theprevious 3 years; no other relationships or activities that could appear tohave influenced the submitted work.
Publisher’s NoteSpringer Nature remains neutral with regard to jurisdictional claims inpublished maps and institutional affiliations.
Received: 13 September 2017 Accepted: 8 May 2018
References1. World Health Organization. Physical status: the use and interpretation of
anthropometry. Geneva, Switzerland: Report of a WHO Expert Committee; 1995.2. World Health Organization. The management of nutrition in major
emergencies. Geneva, Switzerland: World Health Organization; 2000.3. Howe P, Devereux S. Famine intensity and magnitude scales: a proposal for
an instrumental definition of famine. Disasters. 2004;28(4):353–72.4. Cadre Harmonise. Identification and Analysis of Areas at Risk and
Populations Affected by Food and Nutrition Insecurity in the Sahel andWest Africa: Manual. Niamey, Niger; 2016. Available at: http://fscluster.org/nigeria/document/cadre-harmonise-manual-version-10.
5. Integrated Food Security Phase Classification Global Partners. Technicalmanual version 2.0: evidence and standards for better food securitydecisions. Rome, Italy: Food and Agriculture Organization; 2012. Available at:http://www.ipcinfo.org/fileadmin/user_upload/ipcinfo/docs/IPC-Manual-2-Interactive.pdf.
6. World Health Organization, United Nations Children's Fund. WHO childgrowth standards and the identification of severe acute malnutrition ininfants and children. Geneva, Switzerland: A Joint Statement; 2009.
7. World Health Organization, United Nations Children's Fund, StandingCommittee on Nutrition. Informal consultation on community-basedmanagement of severe malnutrition in children. Geneva, Switzerland:SCN Nutrition Policy; 2006.
8. World Health Organization, United Nations Children's Fund, World FoodProgramme, Standing Committee on Nutrition. Joint Statement.Community-based management of severe acute malnutrition. Geneva,New York, Rome; 2007.
9. Grellety EG, Golden MH. Weight-for-height and mid-upper-armcircumference should be used independently to diagnose acutemalnutrition: policy implications. BMC Nutrition. 2016;2:10.
10. Roberfroid D, Huybregts L, Lachat C, Vrijens F, Kolsteren P, Guesdon B.Inconsistent diagnosis of acute malnutrition by weight-for-height andmid-upper arm circumference: contributors in 16 cross-sectional surveys fromSouth Sudan, the Philippines, Chad, and Bangladesh. Nutr J. 2015;14:86.
11. Briend A, Mwangome M, Berkley J. (2017). Using Mid-Upper ArmCircumference to Detect High-Risk Malnourished Patients in Need ofTreatment. In Preedy VR, Patel VB (Eds.) Handbook of Famine, Starvation,and Nutrient Deprivation (pp 1–17). Springer international Publishing.
12. Action Contre la Faim. Anthropometric survey data, 2001–2013. Paris: ActionContre la Faim International; 2015.
13. United Nations High Commissioner for Refugees. Standardised expandednutrition survey, 2011–2016. Geneva: UNHCR; 2017.
14. WHO Multicentre Growth Reference Group. Child growth standards: length/height-for-age, weight-for-age, weight-for-length, weight-for-height andbody mass index-for-age: methods and development. Geneva, Switzerland:World Health Organization; 2006.
15. Yang H, de Onis M. Algorithms for converting estimates of childmalnutrition based on the NCHS reference into estimates based on theWHO child growth standards. BMC Pediatr. 2008;8:19.
Bilukha and Leidman BMC Nutrition (2018) 4:24 Page 10 of 10