
Computers and Chemical Engineeringjos/pbl/cche_bh.pdf · Direct simulations of spherical particle...
15
Please cite this article in press as: Prashant & Derksen, J J. Direct simulations of spherical particle motion in Bingham liquids. Computers and Chemical Engineering (2010), doi:10.1016/j.compchemeng.2010.09.002 ARTICLE IN PRESS G Model CACE-4122; No. of Pages 15 Computers and Chemical Engineering xxx (2010) xxx–xxx Contents lists available at ScienceDirect Computers and Chemical Engineering journal homepage: www.elsevier.com/locate/compchemeng Direct simulations of spherical particle motion in Bingham liquids Prashant, J.J. Derksen ∗ Chemical & Materials Engineering Department, University of Alberta, ECERF 7-028, Edmonton, Alberta T6G 2G6, Canada article info Article history: Received 21 October 2009 Received in revised form 3 September 2010 Accepted 6 September 2010 Available online xxx Keywords: Bingham liquid Simulation Lattice-Boltzmann Lid-driven cavity Sedimentation abstract The present work deals with the development of a direct simulation strategy for solving the motion of spherical particles in a Bingham liquid. The simulating strategy is based on a lattice-Boltzmann flow solver and the dual-viscosity Bingham model. Validation of the strategy is first performed for single phase (lid-driven cavity flow) and then for two phase flows. Lid-driven cavity flow results illustrate the flow’s response to an increase of the yield stress. We show how the settling velocity of a single sphere sedimenting in a Bingham liquid is influenced by the yield stress of the liquid. The hydrodynamic interactions between two spheres are studied at low and moderate Reynolds number. At low Reynolds number, two spheres settle with equal velocity. At moderate Reynolds number, the yield effects are softened and the trailing sphere approaches the leading sphere until collision occurs. © 2010 Elsevier Ltd. All rights reserved. 1. Introduction Bingham liquids, a special subclass of viscoplastic liquids, pos- sess a yield stress which must be exceeded before the liquid shows any significant deformation. By virtue of its yield stress, a Bingham liquid is capable of trapping an embedded particle for a long time. For example, drilling liquids used in petroleum industry posses a yield stress and prevent the settling of rock debris when their circu- lation is stopped (Peysson, 2004). The presence of a yield stress in various industrial liquids is critical to solid–liquid suspensions. In oil sand operations (Masliyah, Zhou, Xu, Czarnecki, & Hamza, 2004), clay particles get surface activated in the presence of water and make a complex clay–water suspension. This complex suspension possesses a yield stress which is relevant for the design, operation and efficiency of oil sands processing, especially in those parts of the process related to separation and to tailings. If the net gravity force acting on inert particles (sand, bitumen drops) is not enough to overcome the yield stress, they are trapped in the clay network hindering gravity based separation. Research studies focused on spheres sedimenting in Bing- ham liquids date back several decades. Ansley and Smith (1967) postulated the shape and extent of yielded/unyielded regions sur- rounding the sphere using slip line theory. In a classical work, Beris, Tsamopoulos, Armstrong, and Brown (1985) numerically deter- mined the velocity field, pressure field, shape of the yield surfaces and drag coefficient for the creeping flow around a sphere in an unbounded Bingham liquid. Blackery and Mitsoulis (1997) reported ∗ Corresponding author. Tel.: +1 780 492 5267; fax: +1 780 492 2881. E-mail address: [email protected] (J.J. Derksen). drag coefficients for bounded flows with various tube/sphere diam- eter ratios. More recently Liu, Muller, and Denn (2002) and Yu and Wachs (2007) obtained the shape and extent of yielded/unyielded regions for such flow systems. Turning the attention towards sed- imentation of more than one sphere, one finds few results for Bingham liquids, probably due to the complexity associated with two sphere motion in addition to the discontinuous nature of Bingham liquid model. Liu, Muller, and Denn (2003) numerically investigated the creeping flow of two identical spheres falling collinearly along the axis of a circular cylinder in a Bingham liq- uid. They calculated the yield surfaces as a function of the ratio of the center to center distance over the radius of the spheres and further predicted a plug like (unyielded) region between the two spheres along the symmetry axis. In an experimental work, Merkak, Jossic, and Magnin (2006) reported an appreciable hydrodynamic interaction between two spheres falling one above the other. They proposed drag coefficient correlations and showed that the yield effect of viscoplastic liquids reduces the degree of interaction com- pared to sedimentation in Newtonian liquid. Yu and Wachs (2007) examined the motion of two spheres translating along the axis of a tube at low Reynolds number and predicted a higher velocity of two spheres than a single sphere due to the hydrodynamic interaction. One of the difficulties encountered in implementing the Bing- ham model in a computer code is its non-differentiable form. There are mainly three approaches which have been used in the litera- ture to counter these problems: the dual-viscosity model (Beverly & Tanner, 1992; O’Donovan & Tanner, 1984), regularization meth- ods (Mitsoulis & Zisis, 2001; Papanastasiou, 1987), and variational inequality based methods (Vola, Boscardin, & Latche, 2003; Yu & Wachs, 2007). The first two methods approximate the Bingham model by considering the solid region as a highly viscous mate- 0098-1354/$ – see front matter © 2010 Elsevier Ltd. All rights reserved. doi:10.1016/j.compchemeng.2010.09.002
Transcript of Computers and Chemical Engineeringjos/pbl/cche_bh.pdf · Direct simulations of spherical particle...

G
C
D
PC
a
ARRAA
KBSLLS
1
salFylvocmpatfth
hprTmau
0d
ARTICLE IN PRESSModel
ACE-4122; No. of Pages 15
Computers and Chemical Engineering xxx (2010) xxx–xxx
Contents lists available at ScienceDirect
Computers and Chemical Engineering
journa l homepage: www.e lsev ier .com/ locate /compchemeng
irect simulations of spherical particle motion in Bingham liquids
rashant, J.J. Derksen ∗
hemical & Materials Engineering Department, University of Alberta, ECERF 7-028, Edmonton, Alberta T6G 2G6, Canada
r t i c l e i n f o
rticle history:eceived 21 October 2009eceived in revised form 3 September 2010ccepted 6 September 2010
a b s t r a c t
The present work deals with the development of a direct simulation strategy for solving the motion ofspherical particles in a Bingham liquid. The simulating strategy is based on a lattice-Boltzmann flowsolver and the dual-viscosity Bingham model. Validation of the strategy is first performed for singlephase (lid-driven cavity flow) and then for two phase flows. Lid-driven cavity flow results illustrate
vailable online xxx
eywords:ingham liquidimulationattice-Boltzmann
the flow’s response to an increase of the yield stress. We show how the settling velocity of a singlesphere sedimenting in a Bingham liquid is influenced by the yield stress of the liquid. The hydrodynamicinteractions between two spheres are studied at low and moderate Reynolds number. At low Reynoldsnumber, two spheres settle with equal velocity. At moderate Reynolds number, the yield effects aresoftened and the trailing sphere approaches the leading sphere until collision occurs.
id-driven cavityedimentation
. Introduction
Bingham liquids, a special subclass of viscoplastic liquids, pos-ess a yield stress which must be exceeded before the liquid showsny significant deformation. By virtue of its yield stress, a Binghamiquid is capable of trapping an embedded particle for a long time.or example, drilling liquids used in petroleum industry posses aield stress and prevent the settling of rock debris when their circu-ation is stopped (Peysson, 2004). The presence of a yield stress inarious industrial liquids is critical to solid–liquid suspensions. Inil sand operations (Masliyah, Zhou, Xu, Czarnecki, & Hamza, 2004),lay particles get surface activated in the presence of water andake a complex clay–water suspension. This complex suspension
ossesses a yield stress which is relevant for the design, operationnd efficiency of oil sands processing, especially in those parts ofhe process related to separation and to tailings. If the net gravityorce acting on inert particles (sand, bitumen drops) is not enougho overcome the yield stress, they are trapped in the clay networkindering gravity based separation.
Research studies focused on spheres sedimenting in Bing-am liquids date back several decades. Ansley and Smith (1967)ostulated the shape and extent of yielded/unyielded regions sur-ounding the sphere using slip line theory. In a classical work, Beris,
Please cite this article in press as: Prashant & Derksen, J J. Direct simulatChemical Engineering (2010), doi:10.1016/j.compchemeng.2010.09.002
samopoulos, Armstrong, and Brown (1985) numerically deter-ined the velocity field, pressure field, shape of the yield surfaces
nd drag coefficient for the creeping flow around a sphere in annbounded Bingham liquid. Blackery and Mitsoulis (1997) reported
∗ Corresponding author. Tel.: +1 780 492 5267; fax: +1 780 492 2881.E-mail address: [email protected] (J.J. Derksen).
098-1354/$ – see front matter © 2010 Elsevier Ltd. All rights reserved.oi:10.1016/j.compchemeng.2010.09.002
© 2010 Elsevier Ltd. All rights reserved.
drag coefficients for bounded flows with various tube/sphere diam-eter ratios. More recently Liu, Muller, and Denn (2002) and Yu andWachs (2007) obtained the shape and extent of yielded/unyieldedregions for such flow systems. Turning the attention towards sed-imentation of more than one sphere, one finds few results forBingham liquids, probably due to the complexity associated withtwo sphere motion in addition to the discontinuous nature ofBingham liquid model. Liu, Muller, and Denn (2003) numericallyinvestigated the creeping flow of two identical spheres fallingcollinearly along the axis of a circular cylinder in a Bingham liq-uid. They calculated the yield surfaces as a function of the ratio ofthe center to center distance over the radius of the spheres andfurther predicted a plug like (unyielded) region between the twospheres along the symmetry axis. In an experimental work, Merkak,Jossic, and Magnin (2006) reported an appreciable hydrodynamicinteraction between two spheres falling one above the other. Theyproposed drag coefficient correlations and showed that the yieldeffect of viscoplastic liquids reduces the degree of interaction com-pared to sedimentation in Newtonian liquid. Yu and Wachs (2007)examined the motion of two spheres translating along the axis of atube at low Reynolds number and predicted a higher velocity of twospheres than a single sphere due to the hydrodynamic interaction.
One of the difficulties encountered in implementing the Bing-ham model in a computer code is its non-differentiable form. Thereare mainly three approaches which have been used in the litera-ture to counter these problems: the dual-viscosity model (Beverly
ions of spherical particle motion in Bingham liquids. Computers and
& Tanner, 1992; O’Donovan & Tanner, 1984), regularization meth-ods (Mitsoulis & Zisis, 2001; Papanastasiou, 1987), and variationalinequality based methods (Vola, Boscardin, & Latche, 2003; Yu &Wachs, 2007). The first two methods approximate the Binghammodel by considering the solid region as a highly viscous mate-

IN PRESSG
C
2 d Chemical Engineering xxx (2010) xxx–xxx
rtL
casgabvmafid
dpbtsteic
2
2
qhldoddpcocnmiurta1btzsaa
2
eBtd
.
pμ
0μ.
0τ
τ
ARTICLEModel
ACE-4122; No. of Pages 15
Prashant, J.J. Derksen / Computers an
ial. The variational inequality method is rigorously equivalent tohe original Bingham model, and is implemented by introducingagrange multipliers.
The present work concentrates on the sedimentation of parti-les in Bingham liquid using the lattice-Boltzmann method (LBM)s flow solver. First we discuss and analyse the results of singlephere sedimentation at low Reynolds number. We then investi-ate the hydrodynamic interaction between the two spheres fallinglong the axis of symmetry at low and moderate Reynolds num-er. Hydrodynamic interaction is interpreted in terms of settlingelocity, flow field and attraction between the spheres. The (bench-ark) results presented in this paper are meant to assess the
ccuracy and potential of the computational method so that (inuture work) the method can be used for flow systems relevant tondustrial and environmental processes, such as the simulation ofense solid–liquid suspensions involving Bingham liquids.
This paper is organized as follows: in Section 2 a brief intro-uction to LBM, the Bingham model and dimensionless numbers isrovided. Validation of the numerical procedure is accomplishedy comparing results for lid-driven cavity flow with results fromhe literature (Section 3). In Section 4 we study the single sphereedimentation in Bingham liquid in a confined domain and reporthe effects of yield stress on the settling velocity. In Section 5, wexamine the sedimentation of two spheres (one above the other)n Bingham liquid at low and moderate Reynolds number. The con-luding remarks are provided in Section 6.
. Numerical model
.1. Flow solver
The lattice-Boltzmann method is a well established and fre-uently used method for simulating liquid flows. In principle itas a second order accuracy in space and time and is particu-
arly regarded an efficient flow solver for flows involving interfacialynamics and complex geometries (Chen & Doolen, 1998). LBMriginated from lattice gas automata in which liquid particles areistributed on a lattice of nodes. Each liquid particle has certainirections of velocities at each node. At each time step a liquidarticle is involved in two sequential processes: streaming andollision. In the streaming process, the liquid particle moves fromne node to the nearest node in the direction of its velocity and inollision it interacts with other liquid particles reaching the sameode and changes its velocity as per collision rules. In this work, weake use of the formulation by Eggels and Somers (1995) which
s a D3Q18 model (three-dimensional, 18 velocities). In LBM thenits of distance and time are the lattice spacing and the time step,espectively. All the liquid properties and flow variables are scaledo dimensionless quantities within certain ranges (e.g. for densitynd kinematic viscosity: �∼ 8, 0.25 >� > 10−5) (Eggels & Somers,995). The bounce-back scheme is a popular way to mimic no-slipoundary conditions at plane walls. In this scheme, the liquid par-icle is reflected back to the node it comes from. Explicitly applyingero velocity on boundaries is an alternative to retrieve the no-lip condition. No-slip boundary condition at a curved boundary ischieved by a forcing method (Derksen & Van den Akker, 1999),lso known as immersed boundary method.
.2. Bingham model
Please cite this article in press as: Prashant & Derksen, J J. Direct simulatChemical Engineering (2010), doi:10.1016/j.compchemeng.2010.09.002
Viscoplastic liquids possess a yield stress (�0) which must bexceeded before the fluid shows any significant deformation. Theingham model, one of the simplest rheological models, is usedo describe the flow properties of liquid with a yield stress �0. Theeformation rate remains zero and the material behaves like a solid
cγ γ
Fig. 1. One-dimensional representation of dual-viscosity Bingham model.
until the stress exceeds the yield limit of the liquid. In a general-ized manner, the constitutive equations for a Bingham liquid canbe written as
�ij = 2(�0
�̇+�p
)dij |�|> �0 (1)
dij = 0 |�|< �0 (2)
In the above expressions, �ij is deviatoric part of whole stress
tensor �ij, �̇ is the deformation rate (�̇ =√dijdij), dij is the rate
of deformation tensor [1/2(( ∂ ui/∂ xj) +(∂ uj/∂ xi))], �p is the plasticviscosity, and |�| is the magnitude of the shear stress (|�| = √
�ij�ij).In the present work, a dual-viscosity model is used to mimic
Bingham liquids (Beverly & Tanner, 1992) because of its lesscomplex structure and easy implementation within the lattice-Boltzmann scheme, which essentially is a viscous flow solver. Inthis model the region around zero shear rate is characterized bya highly viscous material with viscosity �0. At higher shear theactual Bingham rheology is represented by a much lower plasticviscosity �p. The one-dimensional dual-viscosity Bingham rheol-ogy is shown in Fig. 1. The transition (from high to low viscosity)gives rise to a critical shear rate �̇c = �0/(�0 −�p). When the shearrate (�̇) becomes greater than critical shear rate, material is consid-ered yielded. Thus the criterion of yielded and unyielded regions isdefined as
�̇ > �̇c → yielded (3)
�̇ ≤ �̇c → unyielded (4)
In the dual-viscosity model, the apparent viscosity (�a) andshear stress (�ij) of the material are written as
�a = �0 �̇ ≤ �̇c (5)
�a = �p + �0
�̇�̇ > �̇c (6)
�ij = 2�adij (7)
2.3. Dimensionless numbers
As the two dimensionless numbers that govern the Bingham
ions of spherical particle motion in Bingham liquids. Computers and
liquid flow system we chose a Reynolds number and a Binghamnumber:
Reynolds numberRe = �f UcLc�p
(8)
ARTICLE IN PRESSG Model
CACE-4122; No. of Pages 15
Prashant, J.J. Derksen / Computers and Chemical Engineering xxx (2010) xxx–xxx 3
z
x
H
u0
Fs
B
wtdi(t
fvn
U
wt
ofw(A
C
U
3
wldisctt
100
101
102
103
0.8
0.9
1
z/H
μ0/μ
p=250
μ0/μ
p=1250
μ0/μ
p=5000
μ0/μ
p=10000
μ0/μ
p=15000
the primary vortex center to observe the qualitative credibility ofour results. The center of the primary vortex is the point havingthe minimum value of the stream function ( ) which is calculatedthrough integration of the velocity field (ux = ∂ /∂ z, uz = − ∂ /∂ x).
0.8
0.9
1
z/H
21¥1¥21
41¥1¥41
61¥1¥61
81¥1¥81
101¥1¥101
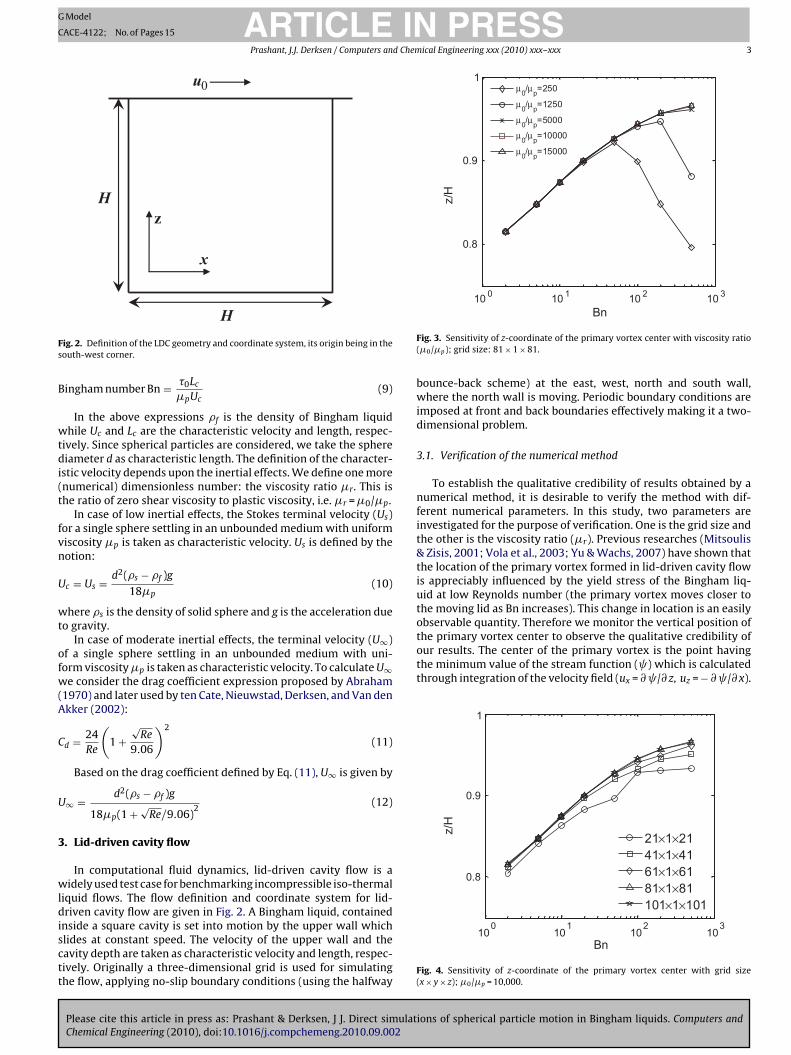
Hig. 2. Definition of the LDC geometry and coordinate system, its origin being in theouth-west corner.
ingham number Bn = �0Lc�pUc
(9)
In the above expressions �f is the density of Bingham liquidhile Uc and Lc are the characteristic velocity and length, respec-
ively. Since spherical particles are considered, we take the sphereiameter d as characteristic length. The definition of the character-
stic velocity depends upon the inertial effects. We define one morenumerical) dimensionless number: the viscosity ratio �r. This ishe ratio of zero shear viscosity to plastic viscosity, i.e. �r =�0/�p.
In case of low inertial effects, the Stokes terminal velocity (Us)or a single sphere settling in an unbounded medium with uniformiscosity �p is taken as characteristic velocity. Us is defined by theotion:
c = Us = d2(�s − �f )g18�p
(10)
here �s is the density of solid sphere and g is the acceleration dueo gravity.
In case of moderate inertial effects, the terminal velocity (U∞)f a single sphere settling in an unbounded medium with uni-orm viscosity�p is taken as characteristic velocity. To calculate U∞e consider the drag coefficient expression proposed by Abraham
1970) and later used by ten Cate, Nieuwstad, Derksen, and Van denkker (2002):
d = 24Re
(1 +
√Re
9.06
)2
(11)
Based on the drag coefficient defined by Eq. (11), U∞ is given by
∞ = d2(�s − �f )g18�p(1 + √
Re/9.06)2
(12)
. Lid-driven cavity flow
In computational fluid dynamics, lid-driven cavity flow is aidely used test case for benchmarking incompressible iso-thermal
iquid flows. The flow definition and coordinate system for lid-riven cavity flow are given in Fig. 2. A Bingham liquid, contained
Please cite this article in press as: Prashant & Derksen, J J. Direct simulatChemical Engineering (2010), doi:10.1016/j.compchemeng.2010.09.002
nside a square cavity is set into motion by the upper wall whichlides at constant speed. The velocity of the upper wall and theavity depth are taken as characteristic velocity and length, respec-ively. Originally a three-dimensional grid is used for simulatinghe flow, applying no-slip boundary conditions (using the halfway
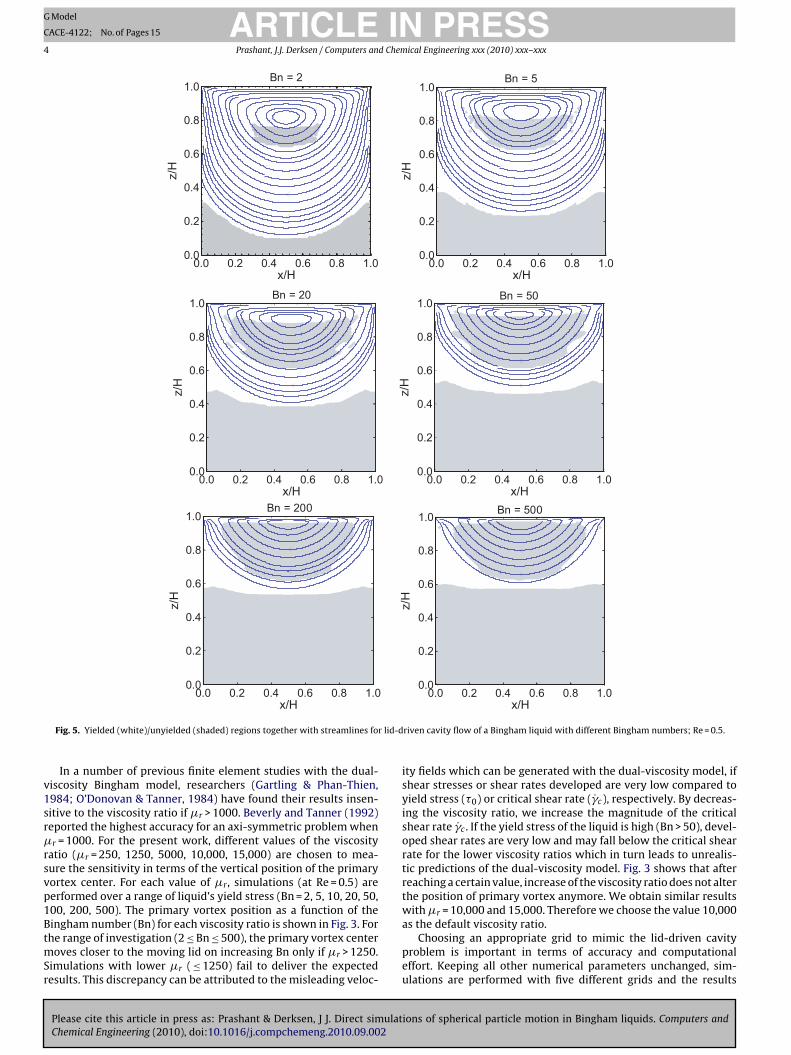
Bn
Fig. 3. Sensitivity of z-coordinate of the primary vortex center with viscosity ratio(�0/�p); grid size: 81 × 1 × 81.
bounce-back scheme) at the east, west, north and south wall,where the north wall is moving. Periodic boundary conditions areimposed at front and back boundaries effectively making it a two-dimensional problem.
3.1. Verification of the numerical method
To establish the qualitative credibility of results obtained by anumerical method, it is desirable to verify the method with dif-ferent numerical parameters. In this study, two parameters areinvestigated for the purpose of verification. One is the grid size andthe other is the viscosity ratio (�r). Previous researches (Mitsoulis& Zisis, 2001; Vola et al., 2003; Yu & Wachs, 2007) have shown thatthe location of the primary vortex formed in lid-driven cavity flowis appreciably influenced by the yield stress of the Bingham liq-uid at low Reynolds number (the primary vortex moves closer tothe moving lid as Bn increases). This change in location is an easilyobservable quantity. Therefore we monitor the vertical position of
ions of spherical particle motion in Bingham liquids. Computers and
100
101
102
103
Bn
Fig. 4. Sensitivity of z-coordinate of the primary vortex center with grid size(x × y × z); �0/�p = 10,000.
ARTICLE IN PRESSG Model
CACE-4122; No. of Pages 15
4 Prashant, J.J. Derksen / Computers and Chemical Engineering xxx (2010) xxx–xxx
x/H
z/H
Bn = 2
0.0 0.2 0.4 0.6 0.8 1.00.0
0.2
0.4
0.6
0.8
1.0
x/H
z/H
Bn = 5
0.0 0.2 0.4 0.6 0.8 1.00.0
0.2
0.4
0.6
0.8
1.0
x/H
z/H
Bn = 20
0.0 0.2 0.4 0.6 0.8 1.00.0
0.2
0.4
0.6
0.8
1.0
x/H
z/H
Bn = 50
0.0 0.2 0.4 0.6 0.8 1.00.0
0.2
0.4
0.6
0.8
1.0
z/H
Bn = 200
0.0 0.2 0.4 0.6 0.8 1.00.0
0.2
0.4
0.6
0.8
1.0
z/H
Bn = 500
0.0 0.2 0.4 0.6 0.8 1.00.0
0.2
0.4
0.6
0.8
1.0
r lid-d
v1sr�rsvp1BtmSr
x/H
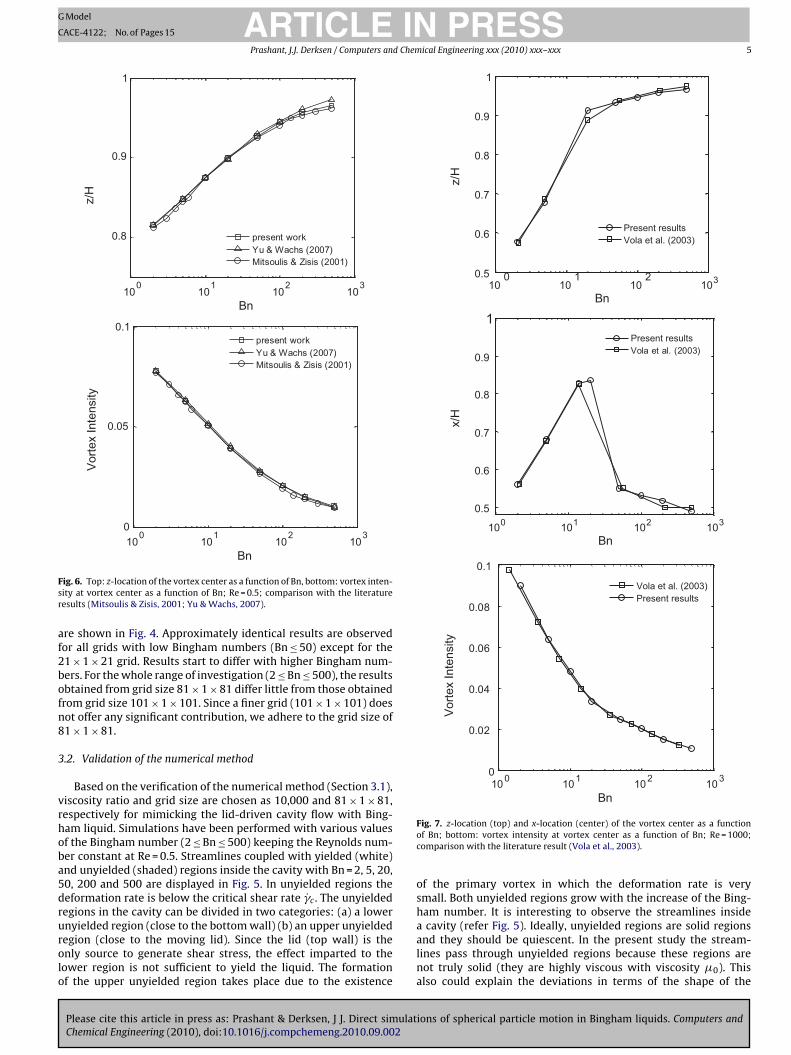
Fig. 5. Yielded (white)/unyielded (shaded) regions together with streamlines fo
In a number of previous finite element studies with the dual-iscosity Bingham model, researchers (Gartling & Phan-Thien,984; O’Donovan & Tanner, 1984) have found their results insen-itive to the viscosity ratio if �r > 1000. Beverly and Tanner (1992)eported the highest accuracy for an axi-symmetric problem whenr = 1000. For the present work, different values of the viscosity
atio (�r = 250, 1250, 5000, 10,000, 15,000) are chosen to mea-ure the sensitivity in terms of the vertical position of the primaryortex center. For each value of �r, simulations (at Re = 0.5) areerformed over a range of liquid’s yield stress (Bn = 2, 5, 10, 20, 50,00, 200, 500). The primary vortex position as a function of the
Please cite this article in press as: Prashant & Derksen, J J. Direct simulatChemical Engineering (2010), doi:10.1016/j.compchemeng.2010.09.002
ingham number (Bn) for each viscosity ratio is shown in Fig. 3. Forhe range of investigation (2 ≤ Bn ≤ 500), the primary vortex center
oves closer to the moving lid on increasing Bn only if �r > 1250.imulations with lower �r ( ≤ 1250) fail to deliver the expectedesults. This discrepancy can be attributed to the misleading veloc-
x/H
riven cavity flow of a Bingham liquid with different Bingham numbers; Re = 0.5.
ity fields which can be generated with the dual-viscosity model, ifshear stresses or shear rates developed are very low compared toyield stress (�0) or critical shear rate (�̇c), respectively. By decreas-ing the viscosity ratio, we increase the magnitude of the criticalshear rate �̇c . If the yield stress of the liquid is high (Bn > 50), devel-oped shear rates are very low and may fall below the critical shearrate for the lower viscosity ratios which in turn leads to unrealis-tic predictions of the dual-viscosity model. Fig. 3 shows that afterreaching a certain value, increase of the viscosity ratio does not alterthe position of primary vortex anymore. We obtain similar resultswith�r = 10,000 and 15,000. Therefore we choose the value 10,000
ions of spherical particle motion in Bingham liquids. Computers and
as the default viscosity ratio.Choosing an appropriate grid to mimic the lid-driven cavity
problem is important in terms of accuracy and computationaleffort. Keeping all other numerical parameters unchanged, sim-ulations are performed with five different grids and the results
ARTICLE IN PRESSG Model
CACE-4122; No. of Pages 15
Prashant, J.J. Derksen / Computers and Chemical Engineering xxx (2010) xxx–xxx 5
100
101
102
103
0.8
0.9
1z/H
present work
Yu & Wachs (2007)
Mitsoulis & Zisis (2001)
100
101
102
103
0
0.05
0.1
Vort
ex In
ten
sity
present work
Yu & Wachs (2007)
Mitsoulis & Zisis (2001)
Bn
Bn
Fsr
af2bofn8
3
vrhoba5drurolo
100
101
102
103
Bn
z/H
Present results
Vola et al. (2003)
100
101
102
103
1
Bn
x/H
Present results
Vola et al. (2003)
100
101
102
103
Bn
Vort
ex I
nte
nsity
Vola et al. (2003)
Present results
0.5
0.6
0.7
0.8
0.9
1
0.5
0.6
0.7
0.8
0.9
0
0.02
0.04
0.06
0.08
0.1
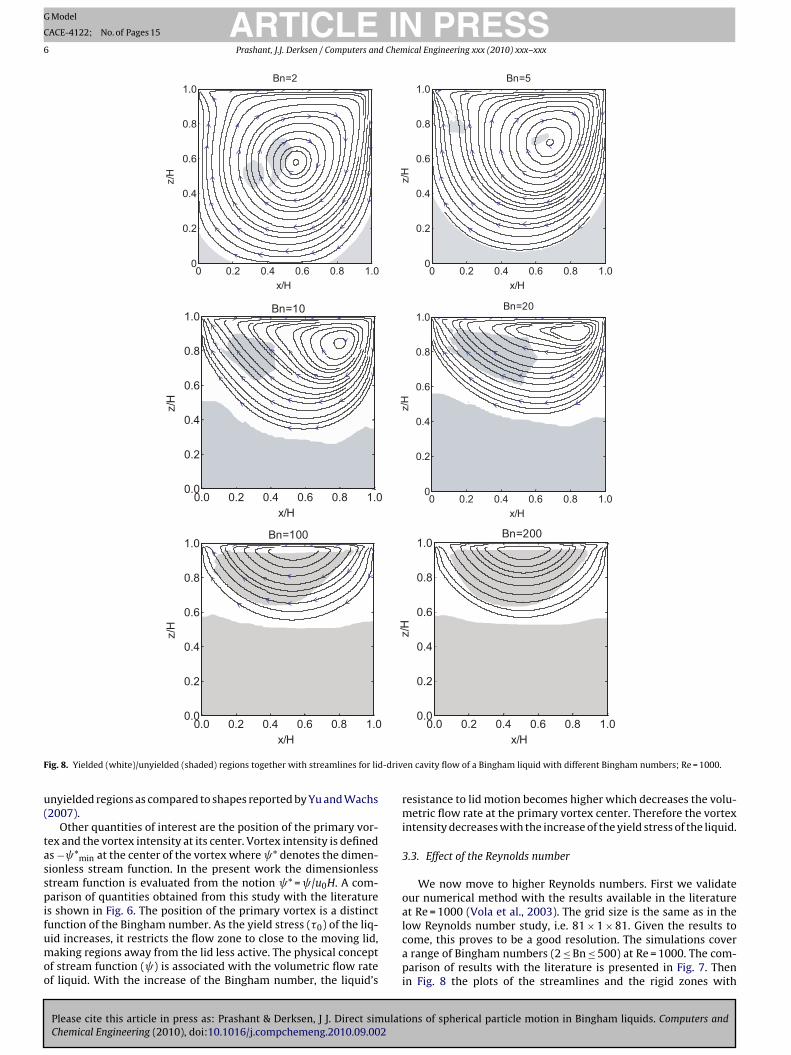
ig. 6. Top: z-location of the vortex center as a function of Bn, bottom: vortex inten-ity at vortex center as a function of Bn; Re = 0.5; comparison with the literatureesults (Mitsoulis & Zisis, 2001; Yu & Wachs, 2007).
re shown in Fig. 4. Approximately identical results are observedor all grids with low Bingham numbers (Bn ≤ 50) except for the1 × 1 × 21 grid. Results start to differ with higher Bingham num-ers. For the whole range of investigation (2 ≤ Bn ≤ 500), the resultsbtained from grid size 81 × 1 × 81 differ little from those obtainedrom grid size 101 × 1 × 101. Since a finer grid (101 × 1 × 101) doesot offer any significant contribution, we adhere to the grid size of1 × 1 × 81.
.2. Validation of the numerical method
Based on the verification of the numerical method (Section 3.1),iscosity ratio and grid size are chosen as 10,000 and 81 × 1 × 81,espectively for mimicking the lid-driven cavity flow with Bing-am liquid. Simulations have been performed with various valuesf the Bingham number (2 ≤ Bn ≤ 500) keeping the Reynolds num-er constant at Re = 0.5. Streamlines coupled with yielded (white)nd unyielded (shaded) regions inside the cavity with Bn = 2, 5, 20,0, 200 and 500 are displayed in Fig. 5. In unyielded regions theeformation rate is below the critical shear rate �̇c . The unyieldedegions in the cavity can be divided in two categories: (a) a lower
Please cite this article in press as: Prashant & Derksen, J J. Direct simulatChemical Engineering (2010), doi:10.1016/j.compchemeng.2010.09.002
nyielded region (close to the bottom wall) (b) an upper unyieldedegion (close to the moving lid). Since the lid (top wall) is thenly source to generate shear stress, the effect imparted to theower region is not sufficient to yield the liquid. The formationf the upper unyielded region takes place due to the existence
Fig. 7. z-location (top) and x-location (center) of the vortex center as a functionof Bn; bottom: vortex intensity at vortex center as a function of Bn; Re = 1000;comparison with the literature result (Vola et al., 2003).
of the primary vortex in which the deformation rate is verysmall. Both unyielded regions grow with the increase of the Bing-ham number. It is interesting to observe the streamlines insidea cavity (refer Fig. 5). Ideally, unyielded regions are solid regions
ions of spherical particle motion in Bingham liquids. Computers and
and they should be quiescent. In the present study the stream-lines pass through unyielded regions because these regions arenot truly solid (they are highly viscous with viscosity �0). Thisalso could explain the deviations in terms of the shape of the
ARTICLE IN PRESSG Model
CACE-4122; No. of Pages 15
6 Prashant, J.J. Derksen / Computers and Chemical Engineering xxx (2010) xxx–xxx
x/H
z/H
Bn=2
0 0.2 0.4 0.6 0.8 1.00
0.2
0.4
0.6
0.8
1.0
x/H
z/H
Bn=5
0 0.2 0.4 0.6 0.8 1.00
0.2
0.4
0.6
0.8
1.0
x/H
z/H
Bn=10
0.0 0.2 0.4 0.6 0.8 1.00.0
0.2
0.4
0.6
0.8
1.0
x/H
z/H
Bn=20
0 0.2 0.4 0.6 0.8 1.00
0.2
0.4
0.6
0.8
1.0
z/H
Bn=100
0.0 0.2 0.4 0.6 0.8 1.00.0
0.2
0.4
0.6
0.8
1.0
z/H
Bn=200
0.0 0.2 0.4 0.6 0.8 1.00.0
0.2
0.4
0.6
0.8
1.0
F -driv
u(
tasspifumoo
x/H
ig. 8. Yielded (white)/unyielded (shaded) regions together with streamlines for lid
nyielded regions as compared to shapes reported by Yu and Wachs2007).
Other quantities of interest are the position of the primary vor-ex and the vortex intensity at its center. Vortex intensity is defineds − *min at the center of the vortex where * denotes the dimen-ionless stream function. In the present work the dimensionlesstream function is evaluated from the notion * = /u0H. A com-arison of quantities obtained from this study with the literature
s shown in Fig. 6. The position of the primary vortex is a distinct
Please cite this article in press as: Prashant & Derksen, J J. Direct simulatChemical Engineering (2010), doi:10.1016/j.compchemeng.2010.09.002
unction of the Bingham number. As the yield stress (�0) of the liq-id increases, it restricts the flow zone to close to the moving lid,aking regions away from the lid less active. The physical concept
f stream function ( ) is associated with the volumetric flow ratef liquid. With the increase of the Bingham number, the liquid’s
x/H
en cavity flow of a Bingham liquid with different Bingham numbers; Re = 1000.
resistance to lid motion becomes higher which decreases the volu-metric flow rate at the primary vortex center. Therefore the vortexintensity decreases with the increase of the yield stress of the liquid.
3.3. Effect of the Reynolds number
We now move to higher Reynolds numbers. First we validateour numerical method with the results available in the literatureat Re = 1000 (Vola et al., 2003). The grid size is the same as in the
ions of spherical particle motion in Bingham liquids. Computers and
low Reynolds number study, i.e. 81 × 1 × 81. Given the results tocome, this proves to be a good resolution. The simulations covera range of Bingham numbers (2 ≤ Bn ≤ 500) at Re = 1000. The com-parison of results with the literature is presented in Fig. 7. Thenin Fig. 8 the plots of the streamlines and the rigid zones with

ARTICLE IN PRESSG Model
CACE-4122; No. of Pages 15
Prashant, J.J. Derksen / Computers and Chemical Engineering xxx (2010) xxx–xxx 7
0 1 2 30.5
0.6
0.7
0.8
0.9
1
Re=0.5
Re=10
Re=50
Re=200
Re=600
Re=1000
0 1 2 3
0.5
0.6
0.7
0.8
0.9Re=0.5
Re=10
Re=50
Re=200
Re=600
Re=1000z/H
x/H
cent
virtaBisiivtB
m5dwwetp
FV
10 10 10 10Bn
Fig. 9. z-location (left) and x-location (right) of the vortex
arious Bingham numbers are shown. It is observed that vortexntensities obtained from our simulations agree well with thoseeported by Vola et al. (2003). While comparing the results forhe vertical position of the primary vortex center, we see a devi-tion of around 3% and 1% with Vola et al. (2003) at Bn = 20 andn = 500, respectively. Comparison of the horizontal position data
s also in close agreement within the range of (2 ≤ Bn ≤ 100). Atmall Bingham numbers (Bn ≤ 20) the primary vortex shifts hor-zontally towards the east wall of the cavity. As the yield stresss increased further, the viscous effects dominate and the primaryortex moves back to the middle of the cavity. The primary vor-ex center attains the maximum horizontal position (x/H = 0.837) ifn = 20.
Fig. 9 shows the positions (horizontal and vertical) of the pri-ary vortex center with different Bingham numbers, at Re = 0.5, 10,
0, 200, 600 and 1000. The vertical position of the primary vortexoes not change significantly till Re = 50 (0.1% change from Re = 0.5
Please cite this article in press as: Prashant & Derksen, J J. Direct simulatChemical Engineering (2010), doi:10.1016/j.compchemeng.2010.09.002
ith Bn = 2). An appreciable change in vertical position is observedith low Bingham numbers at Re = 600 and 1000. When inertial
ffects are highly dominating, a Bingham liquid behaves like a New-onian liquid. At Re = 1000, the value of the vertical position of therimary vortex center at Bn = 2 (z/H = 0.577) obtained by this study
V
V
V=0
L
V V
d
fixed
H
ig. 10. Flow definition of a single sphere motion in a cylinder of square cross-section (L ×while sphere is fixed; (right) The sphere falls under the influence of gravity, the liquid a
10 10 10 10Bn
er as a function of Bn; Re = 0.5, 10, 50, 200, 600 and 1000.
is close to the value (z/H = 0.565) of the same quantity observedby Botella and Peyret (1998) with Newtonian liquid. As the yieldstress of the liquid increases, the inertial effects are softened andregions away from the moving lid get less active, drawing the vor-tex closer to the lid and we obtain results similar to those at lowReynolds number. The horizontal position of the primary vortexcenter is significantly affected with low yield stress liquids beyondRe = 10. A definite trend is observed in the variation of horizontalposition with Bingham number until Re is 50. With Re = 600 and1000, a huge deviation is observed from the trend. Within a certainrange of Bingham number (Bn ≤ 20 for Re = 1000 and Bn ≤ 10 forRe = 600) the vortex center travels towards the east wall irrespec-tive of the increase of yield stress. As yield stress further increases,inertial effects are softened and the horizontal position follows thetrend observed at low Re. It is interesting to note here that thehorizontal position of the primary vortex center is more sensitive(as compared to vertical position) to the Reynolds number. More-
ions of spherical particle motion in Bingham liquids. Computers and
over, there seems to be a critical Bingham number at a particularReynolds number where the flow abruptly changes its behavior. Inthe present study, this critical Bingham number lies in the rangeof 20 ≤ Bn ≤ 50 if Re = 1000. If Re = 600 the critical Bingham numberlies in the range of 10 ≤ Bn ≤ 20.
g
L
d
moving
zx
L) filled with Bingham liquid; (left) The liquid and cylinder walls move with velocitynd cylinder walls are stationary.
IN PRESSG
C
8 d Chemical Engineering xxx (2010) xxx–xxx
4
ciweaosfivndSn
ccct5apt
4
ddltcils(rm(vptrttdcstGDta2trtraraop
L/d
H/d
BnT=0.1
0 1 2 3 40
1
2
3
4
5
6
L/d
H/d
BnT=1
0 1 2 3 40
1
2
3
4
5
6
L/d
H/d
BnT=5
0 1 2 3 40
1
2
3
4
5
6
L/d
H/d
BnT=50
0 1 2 3 40
1
2
3
4
5
6
A quantitative comparison of our results with the literature isshown in Fig. 12. If we increase the yield stress of the liquid, itassists the resistance offered by the fixed sphere to the motion ofthe liquid. Since the liquid travels with a constant velocity V in
100
102
100
101
102
103
Ve
locity r
atio, v r
Blackery and Mitsoulis (1997)
Present result
ARTICLEModel
ACE-4122; No. of Pages 15
Prashant, J.J. Derksen / Computers an
. Single sphere sedimentation
The interaction of a single sphere with Bingham liquid inside aylinder has been dealt with in two ways. In the first way the spheres assumed stationary while the liquid and the cylinder walls move
ith a constant velocity (flow past fixed sphere). This scheme isasier to implement since it eliminates the time dependence associ-ted with a sphere moving relative to the computational grid. In thether scheme, the liquid and cylinder walls are stationary while thephere falls in the cylinder under the influence of an external bodyorce. We study both cases here. Their flow definitions are shownn Fig. 10. In the case of the fixed sphere problem, the imposedelocity V is taken as the characteristic velocity and dimensionlessumbers are suffixed with the letter T (e.g. ReT, BnT). While han-ling the problem of a moving sphere, the characteristic velocity istokes settling velocity Us (considering �=�p) and dimensionlessumbers are suffixed with the letter S (e.g. ReS, BnS).
In our simulations the spheres fall in cylinders with squareross-sections whereas most literature results deal with roundross-sections. For Newtonian fluids at low Reynolds numberonditions differences between the two situations have been quan-ified by Miyamura, Iwasaki, and Ishii (1981). They report typically% differences in terms of settling velocities. For Bingham liquidst low Reynolds numbers we expect smaller differences given theresence of unyielded regions away from the sphere and close tohe cylinder walls.
.1. Fixed sphere case
Before demonstrating the results, we revisit the flow definitionepicted by Fig. 10. A sphere remains fixed inside a three-imensional square cylinder which moves along with Bingham
iquid with a uniform velocity V. This velocity V is taken as theerminal velocity of the sphere in Bingham liquid. The boundaryonditions are, uniform velocity V along the cylinder walls and atnlet–outlet while no-slip at the surface of sphere. Once V and otheriquid parameters (�f, �p and �0) are fixed, one can set the dimen-ionless numbers ReT and BnT. In a number of previous studiesBeris et al., 1985; Blackery & Mitsoulis, 1997; Yu & Wachs, 2007)esearchers have measured the ratio of Stokes velocity over ter-inal velocity (termed as Stokes drag coefficient by Beris et al.
1985)) as a function of the yield stress of a Bingham liquid atery low Reynolds number. In this case too, for the sake of com-arison, we solve for the drag force (D) exerted on the sphere byhe liquid and further calculate the Stokes velocity (U∞) using theelation D = 3d�U∞ (with viscosity�=�p). To avoid conflict withhe classical drag coefficient definition, we refrain from using theerm Stokes drag coefficient and call it the velocity ratio which isefined as vr = U∞/V. To have creeping flow, the Reynolds numberhosen is very small (Re = 0.001) and we use a square cylinder withize 4 × 4 × 6 (L/d × L/d × H/d). The spatial resolution of the simula-ions is such that the sphere diameter d spans 12 lattice spacings.rid effect studies in earlier work (Derksen & Sundaresan, 2007;erksen, 2008) showed that (at least at lower Reynolds numbers)
his is sufficient resolution. The simulations are performed overrange of yield stresses such that BnT = 0.1, 1, 5, 10, 20, 50, 100,
00. The velocity ratio is calculated for each case. A depiction ofhe effect of the yield stress is presented in Fig. 11. The unyieldedegions grow with the increase of yield stress and the interaction ofhe yielded Bingham liquid with the cylinder walls decreases. Theseesults qualitatively agree with the results reported by Blackery
Please cite this article in press as: Prashant & Derksen, J J. Direct simulatChemical Engineering (2010), doi:10.1016/j.compchemeng.2010.09.002
nd Mitsoulis (1997). The occurrence of polar caps (two unyieldedegions at stagnation points), observed by both Beris et al. (1985)nd Blackery and Mitsoulis (1997), and solid regions on either sidef sphere with BnT = 5, 50 found by Ansley and Smith (1967) sup-orts the validity of our results.
Fig. 11. The yielded (white) and unyielded (black) regions for flow of a Binghamliquid around a fixed sphere contained in a square cylinder with 4:1 ratio of L/d.
ions of spherical particle motion in Bingham liquids. Computers and
BnT
Fig. 12. Velocity ratio (vr) as a function of Bingham number (BnT) when sphereremains fixed; ReT = 0.001; comparison with the literature results (Blackery &Mitsoulis, 1997).
ARTICLE IN PRESSG Model
CACE-4122; No. of Pages 15
Prashant, J.J. Derksen / Computers and Chemical Engineering xxx (2010) xxx–xxx 9
Table 1Velocity ratio (vr) as a function of Bingham number (BnT).
101818
4
awtTBswaectcbtra
wfiwkdstwtv
BnT 0.1 1vr (Blackery and Mitsoulis) 2.24 3.92vr (Present work) 2.10 4.06% difference [(R2 − R1)/R2] × 100 −6.66 3.45
ll the simulations, the drag force exerted on the sphere increasesith increase of the yield stress. This increased drag force leads
o the increased Stokes velocity and thus increased velocity ratio.here is a slight difference between the flow definitions used by us.lackery and Mitsoulis (1997) used a cylinder with circular cross-ection whose diameter is four times the diameter of sphere whilee have used a cylinder with square cross-section whose sides
re four times the diameter of the sphere. In a square cylinder wexpect the retardation effect of the walls to be less than the cir-ular cylinder and we expect smaller velocity ratios (U∞/V) thanhose obtained by Blackery and Mitsoulis (1997). One should beritical about the apparent excellent agreement of results obtainedy both the studies (refer Fig. 12). It is important to note that bothhe axes are logarithmic which hides the minor deviation in theesults. The actual deviations between the results shown in Fig. 12re displayed in Table 1.
Miyamura et al. (1981) performed experiments to calculate theall factors of a single solid sphere settling in a square cylinderlled with a Newtonian liquid and then compared them with theall factors obtained with circular cylinder (Iwaoka & Ishii, 1979)
eeping other parameters unchanged. They reported that the retar-ation effect on the terminal velocity due to wall proximity is less
Please cite this article in press as: Prashant & Derksen, J J. Direct simulatChemical Engineering (2010), doi:10.1016/j.compchemeng.2010.09.002
evere with square cylinder and the sphere settles with a greatererminal velocity which is around 5% higher than that measuredith circular cylinder. Close to the Newtonian limit (BnT = 0.1), we
oo observe a 6.6% lesser velocity ratio (i.e. 6.6% higher terminalelocity) which is in close agreement with the results reported by
0 2 4 60
0.1
0.2
0.3
tUs/d
V/U
s
0 2 4 62.5
3.5
4.5
tUs/d
H/d
Fig. 13. Time series of settling velocity (V) and distance traveled in Bingh
20 50 200.04 33.13 74.11 250.25 R1.84 33.47 74.77 252.96 R2.25 1.02 0.88 1.07
Miyamura et al. (1981). Once the yield stress of the liquid is appre-ciably high (BnT > 0.1), the unyielded region around the spheregrows progressively (refer Fig. 11) which restricts the interactionof the flow field with the walls. Therefore in this scenario, it isexpected that the effects of the difference in cylinder geometry getsmaller at higher yield stress. This is well supported by the minordeviations (shown in Table 1) observed with higher yield stress flowsimulations.
4.2. Moving sphere case
We now turn our attention to the problem with a different flowdefinition where the sphere falls in a stationary square cylinderfilled with Bingham liquid under the influence of gravitational force(refer Fig. 10). A zero velocity boundary condition is imposed alongall boundaries and the no-slip boundary condition is considered forthe surface of the sphere. The numerical parameters and grid sizeused in this case remain the same as with the fixed sphere and mov-ing walls (Section 4.1). It is important to mention here that in thiscase our objective is to obtain the terminal velocity V of the spheresettling in a Bingham liquid. The gravitational force is set in sucha way that Reynolds number ReS = 1. The primary reason of choos-
ions of spherical particle motion in Bingham liquids. Computers and
ing this relatively high Reynolds number is the availability of workin the literature with which we want to compare our simulations.Also, by choosing ReS = 1, the effective Reynolds numbers (based onthe actual terminal velocity of the sphere and �p) are of the orderof 10−1 to 10−2 which are still fairly low Reynolds numbers.
0 5 100
0.01
0.03
0.05
tUs/d
V/U
s
0 5 102.5
3.5
4.5
tUs/d
H/d
am liquid with BnS = 0.21 (left panel) and 0.53 (right panel); ReS = 1.
ARTICLE IN PRESSG Model
CACE-4122; No. of Pages 15
10 Prashant, J.J. Derksen / Computers and Chemical Engineering xxx (2010) xxx–xxx
ctors f
sshotrasiaBrstat&
Fig. 14. Yielded (white)/unyielded (black) region together with velocity ve
The simulations are performed with various values of the yieldtress of the liquid (BnS = 0.05, 0.21, 0.36, 0.53, 0.60, 0.66, 0.72). Theettling velocity and distance travelled by a sphere falling in a Bing-am liquid with BnS = 0.21, 0.53 are plotted in Fig. 13 as a functionf time. Clearly, the terminal velocity decreases with increase inhe yield stress of the Bingham liquid. The unyielded and yieldedegions and steady state velocity vectors are shown in Fig. 14. Aslready observed with the fixed sphere, the confinement of thephere by the unyielded region increases progressively with thencrease of the yield stress. The shape and extent of these regionsre in qualitative agreement with the literature (Beris et al., 1985;lackery & Mitsoulis, 1997; Liu et al., 2002; Yu & Wachs, 2007). Theecirculating regions observed on both sides of the sphere are con-
Please cite this article in press as: Prashant & Derksen, J J. Direct simulatChemical Engineering (2010), doi:10.1016/j.compchemeng.2010.09.002
equences of the finite size of the square cylinder. It is clear thathe centers of recirculating regions shift closer to the sphere withn increase of the Bingham number which is qualitatively similaro the results reported in the literature (Beris et al., 1985; Blackery
Mitsoulis, 1997).
or a sphere settling in a square cylinder filled with Bingham liquid; ReS = 1.
A quantitative comparison of our results with those reportedin the literature is shown through the variation of the velocityratio (U∞/V) with Bingham number (BnS) in Fig. 15. The resultsshow some variability; with our results slightly (but systemati-cally) higher than those from the available literature (that are notconclusive as well) especially at moderate to high Bingham num-bers (BnS > 0.36). The possibility of considerable influence due tothe cylinder walls is quite unlikely at such high Bingham num-bers (BnS = BnT/vr, and thus BnS = 0.36 corresponds to BnT = 2.4) asdiscussed for the fixed sphere cases.
5. Double sphere sedimentation
ions of spherical particle motion in Bingham liquids. Computers and
In this section, we investigate the hydrodynamic interactionbetween the two spheres falling along the axis of symmetry of asquare cylinder at low and moderate Reynolds number. Hydrody-namic interaction is interpreted in terms of settling velocity, flow
ARTICLE ING Model
CACE-4122; No. of Pages 15
Prashant, J.J. Derksen / Computers and Chem
0 0.2 0.4 0.6 0.810
0
101
102
103
Bns
Ve
locity r
atio, v r
Present work
Yu and Wachs (2007)
Blackery and Mitsoulis (1997)
Fs(
fiiZs
5
Ts(p2tcb
Fc
ig. 15. Velocity ratio (vr) as a function of Bingham number (BnS) when sphereettles under the effect of gravity; ReS = 1; comparison with the literature resultsBlackery & Mitsoulis, 1997; Yu & Wachs, 2007).
eld and relative velocity of the spheres. The flow definition for sed-mentation of two spheres in Bingham liquid is shown in Fig. 16.ero velocity conditions are applied on all boundaries while thephere surface follows the no-slip condition.
.1. Hydrodynamic interaction with low Re
In the first instance inertial effects are considered low, i.e. Re = 1.he Bingham number has a fixed value (Bn = 0.36) and the gridize chosen for the simulations is 4 × 4 × 16 (L/d × L/d × H/d) withagain) d = 12 as the spatial resolution. Initially the spheres arelaced along the axis of symmetry with trailing sphere’s location
Please cite this article in press as: Prashant & Derksen, J J. Direct simulatChemical Engineering (2010), doi:10.1016/j.compchemeng.2010.09.002
× 2 × 10 (L/d × L/d × H/d). To examine the hydrodynamic interac-ion, the numerical experiments are performed with a range ofenter to center distances (W/d = 1.0, 1.25, 1.5, 2.0, 2.5, 3.0, 3.5)etween the two spheres. How we evolve to a steady settling veloc-
ig. 16. Flow definition of sedimentation of two spheres in a cylinder of squareross-section (L × L) filled with Bingham liquid.
PRESSical Engineering xxx (2010) xxx–xxx 11
ity is shown in Fig. 17 for some W/d ratios. It is obvious from thefigure that both the spheres initially accelerate with equal rateand ultimately move with equal terminal velocity. Therefore itis concluded that both the spheres maintain the initial distancethroughout their motion and the trailing sphere does not approachthe leading sphere. Fig. 17 also reveals that the terminal velocity ofthe spheres becomes higher as their separation distance decreases.The terminal velocity of two spheres is always equal or higher thanthe terminal velocity of a single sphere settling under the sameconditions. The leading sphere behaves as a shield to the trailingsphere which experiences a smaller drag force as compared to theleading sphere. Treating the two spheres like a single body, themass and thus the weight of the whole body is doubled howeverthe drag force on the whole body is much less than twice the dragforce experienced by a single sphere. Therefore one obtains a higherterminal velocity of the sphere doublet in comparison to that of asingle sphere settling under similar conditions.
A quantitative depiction of the hydrodynamic interaction (interms of terminal velocity of two spheres) with W/d ratio is shownin Fig. 18 where U1 and U2 are the terminal velocities of a singlesphere and two spheres, respectively settling in a finite size con-tainer filled with Bingham liquid under similar conditions. Whenthe two spheres are at a large distance (W/d > 3.5), they hardlyinteract and the terminal velocity of either sphere is equal to theterminal velocity of single sphere settling under the same condi-tions. Our results show the same pattern as observed by Yu andWachs (2007). The deviations appearing in the figure are most likelydue to the difference in geometry. Yu and Wachs (2007) used acylinder with circular cross-section whose diameter is four timesthe diameter of sphere while we have used a cylinder with squarecross-section whose sides are four times the diameter of the sphere.Due to this geometry difference, we observe less pronounced walleffects. The new force balance equation for a single sphere sedi-mentation in a finite size container is written as
FG = FD + FB + FW (13)
where FG, FD, FB and FW are gravitational force, drag force, buoyancyforce and force due to wall effects on a single sphere, respectively. Incase of two identical spheres (one above the other) sedimentation,the force balance equation is
2FG = F ′D + 2FB + F ′
W (14)
with F ′D and F ′
W being the drag force and force due to walls, respec-tively on the sphere doublet. Combining Eqs. (13) and (14) weobtain:
F ′W = 2FW + 2FD − F ′
D (15)
If the two spheres are not very far from each other, the dragforce on the sphere doublet F ′
D is less than the twice the drag forceon a single sphere, i.e. 2FD − F ′
D > 0. Using this condition one candeduce that F ′
W > 2FW . Therefore it is concluded that each sphereof a sphere doublet, settling in a finite size container, experiencesa higher retardation effect due to wall in comparison to a singlesphere sedimenting alone in same conditions. This implies that thevalue of U1/U2 increases with stronger wall effects. This is sup-ported by the fact that values of U1/U2 obtained by our simulationsare approximately 7% (on average) lower than those obtained byYu and Wachs (2007).
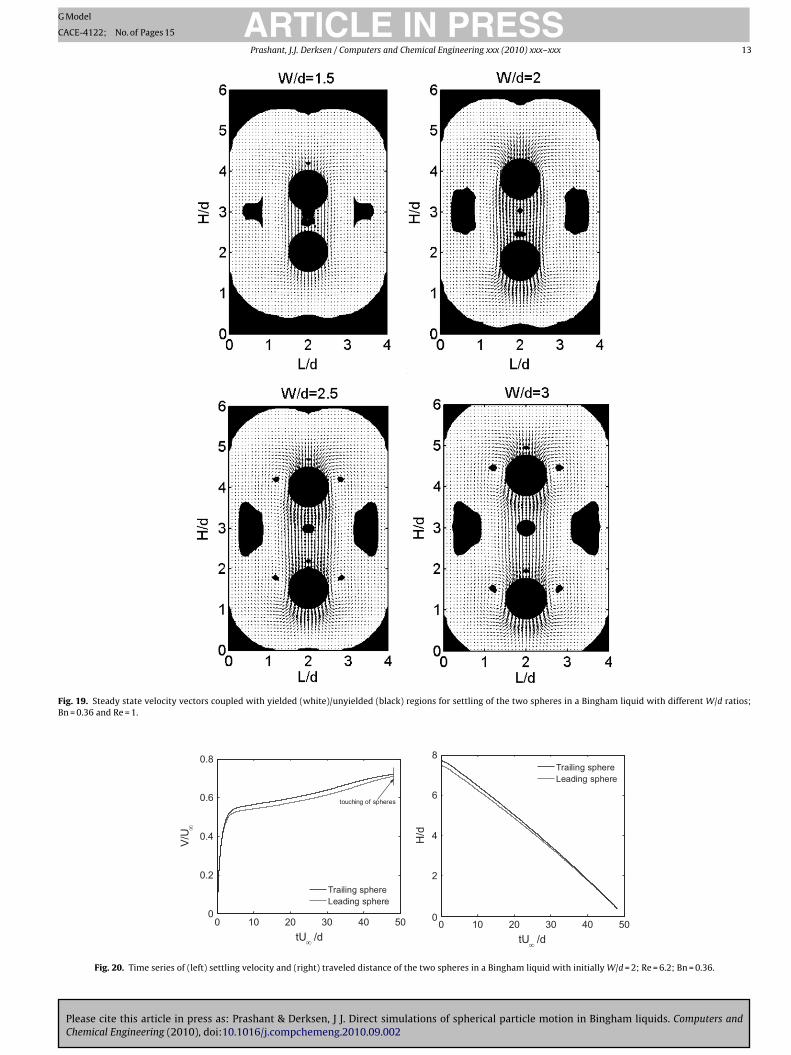
In Fig. 19 we display the steady state velocity vectors coupledwith yielded and unyielded regions for various W/d ratios. Whenthe two spheres are at distances of 2.5d and 3d, the flow field and
ions of spherical particle motion in Bingham liquids. Computers and
yielded envelope around a sphere is similar to those observed witha single sphere. Apart from the islands of unyielded regions appear-ing on either side of a sphere, there are other unyielded regions inthe yielded envelop. They include the regions along the mid plane;along the axis of symmetry between the spheres and on the poles of

ARTICLE IN PRESSG Model
CACE-4122; No. of Pages 15
12 Prashant, J.J. Derksen / Computers and Chemical Engineering xxx (2010) xxx–xxx
0 5 100
0.1
0.2
0.3
tUs/d
V/U
s
W/d=1.5
Trailing sphere
0 5 100
0.05
0.15
0.25
tUs/d
V/U
s
W/d=2
Trailing sphere
Leading sphere
0 5 100
0.05
0.1
0.15
0.2
V/U
s
W/d=2.5
Trailing sphere
Leading sphere
0 5 100
0.05
0.1
0.15
0.2
V/U
s
W/d=3
Trailing sphere
Leading sphere
Bing
ttcpoar
FiW
tUs/d
Fig. 17. Time series of settling velocities of two spheres in
he spheres. The unyielded regions along the mid plane and symme-ry axis are caused by the re-circulation which is essential for mass
Please cite this article in press as: Prashant & Derksen, J J. Direct simulatChemical Engineering (2010), doi:10.1016/j.compchemeng.2010.09.002
onservation within the yielded envelope. We do not observe theolar caps on both sides of the spheres which are expected becausef the stagnation points. Liu et al. (2003) and Yu and Wachs (2007)lso reported the disappearance of polar caps in their numericalesults. The reason, as pointed out by Liu et al. (2003), is that the
1 1.5 2 2.5 3 3.50.4
0.5
0.6
0.7
0.8
0.9
1
1.1
W/d
U1/U
2
Present work
Yu and Wachs (2007)
ig. 18. U1/U2 as a function of W/d ratio; U1 is settling velocity of single sphere; U2
s settling velocity of sphere doublet; comparison with the literature result (Yu &achs, 2007).
tUs/d
ham liquid with different W/d ratios; Re = 1 and Bn = 0.36.
polar cap regions are too small to be detected in the simulationswith the present grid size. Use of a finer grid may shed some insightinto the issue. The size of the unyielded regions along the planesdecreases with the decrease of separation distance. The unyieldedregions situated between the spheres along the axis of symmetryalso decrease in size with decreasing separation distance. However,it becomes larger after bringing the spheres still closer (see theW/d = 1.5 panel of Fig. 19). The small islands of unyielded regionsat either side of spheres vanish with decreasing separation dis-tance. The flow field and yielded/unyielded regions reported in thepresent work are in good agreement with the literature (Liu et al.,2003; Yu & Wachs, 2007).
5.2. Hydrodynamic interaction with moderate Re
We do some simulations to see what happens when two spheresfall one above the other in Bingham liquid at moderate Reynoldsnumber. For this case the Reynolds number (Re) is 6.2, Bing-ham number (Bn) is 0.36 and the grid size used is 4 × 4 × 80(L/d × L/d × H/d) with d = 12. The two spheres, placed initially at acenter to center distance of 2d along the axis of symmetry fall inBingham liquid under the influence of gravity. The starting posi-tion of the trailing sphere is kept as 2 × 2 × 58 (L/d × L/d × H/d). Thetime series of settling velocity of the spheres and the distance cov-
ions of spherical particle motion in Bingham liquids. Computers and
ered by them are displayed in Fig. 20. It is obvious from the figurethat the trailing sphere moves faster than the leading sphere. Thevelocity vectors and yielded/unyielded regions are drawn at threedifferent times (tU∞/d = 0.43, 22, 48) and shown in Fig. 21. Duringthe initial stages (e.g. tU∞/d = 0.43) when the flow is partially devel-
Please cite this article in press as: Prashant & Derksen, J J. Direct simulations of spherical particle motion in Bingham liquids. Computers andChemical Engineering (2010), doi:10.1016/j.compchemeng.2010.09.002
ARTICLE IN PRESSG Model
CACE-4122; No. of Pages 15
Prashant, J.J. Derksen / Computers and Chemical Engineering xxx (2010) xxx–xxx 13
Fig. 19. Steady state velocity vectors coupled with yielded (white)/unyielded (black) regions for settling of the two spheres in a Bingham liquid with different W/d ratios;Bn = 0.36 and Re = 1.
0 10 20 30 40 500
0.2
0.4
0.6
0.8
tU /d
V/U
Trailing sphere
Leading sphere
touching of spheres
0 10 20 30 40 500
2
4
6
8
tU /d
H/d
Trailing sphere
Leading sphere
∞
∞
∞
Fig. 20. Time series of (left) settling velocity and (right) traveled distance of the two spheres in a Bingham liquid with initially W/d = 2; Re = 6.2; Bn = 0.36.

ARTICLE IN PRESSG Model
CACE-4122; No. of Pages 15
14 Prashant, J.J. Derksen / Computers and Chemical Engineering xxx (2010) xxx–xxx
F settlint
oatouosriiss
6
cFltaslotnaaeRfr
ibdi
ig. 21. Velocity vectors coupled with yielded (white)/unyielded (black) regions forU∞/d = 25 (right) tU∞/d = 48; Re = 6.2; Bn = 0.36.
ped and the spheres are far from each other, the unyielded regionsppear along the mid plane, along the axis of symmetry betweenhe spheres and at either side of each sphere. As the flow devel-ps, the yield effects are softened due to the inertial forces and thenyielded regions along the axis of symmetry and on either sidef the sphere vanish. At this moment this system behaves like twopheres sedimenting in a Newtonian liquid where the low pressureegion in the vicinity of leading sphere’s wake draws the trail-ng sphere towards itself. In case of low Reynolds number theres an unyielded region along the axis of symmetry between thepheres which prevents the trailing sphere to approach the leadingphere.
. Concluding remarks
A direct simulation strategy for solving the motion of spheri-al particles in Bingham liquid has been presented in this paper.irst, the implementation of Bingham rheology is validated withid-driven cavity flow as a benchmark. At low Reynolds number,he vertical position of the primary vortex and the vortex intensityre functions of the Bingham number. In this respect, our resultshowed good quantitative agreement with those reported in theiterature (Mitsoulis & Zisis, 2001; Yu & Wachs, 2007) that werebtained with different numerical methods. The horizontal posi-ion of the primary vortex remains insensitive at low Reynoldsumber. At higher Reynolds number, the yield effects are softenednd vertical as well as horizontal positions of primary vortex areppreciably affected (again in agreement with the literature, Volat al., 2003). While studying the lid-driven cavity flow at differenteynolds numbers, the horizontal position of the primary vortex is
ound to be more sensitive (as compared to vertical position) withespect to Reynolds number.
Please cite this article in press as: Prashant & Derksen, J J. Direct simulatChemical Engineering (2010), doi:10.1016/j.compchemeng.2010.09.002
Applying the simulation strategy to two phase systems, thenteraction of a sphere with Bingham liquid at low Reynolds num-er is strongly affected by the yield stress of the liquid. Therag force calculated in case of Bingham flow past a fixed sphere
ncreases with increase of yield stress, largely in quantitative agree-
g of the two spheres in a Bingham liquid at time periods (left) tU∞/d = 0.43 (middle)
ment with results due to Blackery and Mitsoulis (1997). Deviationscould be attributed to differences in the flow geometry (round ver-sus square containers).
Similarly the settling velocity of a single sphere sedimentingin Bingham liquid is a distinct function of liquid’s yield stress. Itdecreases with the increase of yield stress. In case of a single spherefalling in Bingham liquid under the effect of gravity, we observesome quantitative deviations from the literature (viz. Blackery &Mitsoulis, 1997; Yu & Wachs, 2007) at moderate to high Binghamnumbers. These deviations could be partly due to the differences innumerical methods and partly due to the differences in the shapeof the flow domain (rectangular versus circular cross-section).
A low Reynolds number study of sedimentation of two spheresin Bingham liquid suggests the increased hydrodynamic interac-tion with decrease in separation distance between the spheres.There exists an unyielded region between the two spheres due towhich the spheres do not approach each other. The spheres movewith equal settling velocity which is always equal or greater thanthe settling velocity of single sphere sedimenting under the sameconditions. We observe some quantitative deviations with the liter-ature (Yu & Wachs, 2007). However these deviations are due to thedifferent geometries and are explained by considering wall effects.With increase of inertial forces (moderate Re), the unyielded regionbetween the two spheres vanishes. Due to the interaction withwake of the leading sphere, the trailing sphere approaches the lead-ing sphere, just as it does in the Newtonian case (Fortes, Joseph, &Lundgren, 1987).
In future it would be interesting to implement a collision modelwhich allows for a proper resolution of particle–particle interaction– in line with the recent paper by Wachs (2009) – and then exam-ine the tumbling behavior of the two spheres and check whetherthey aggregate or not. The hydrodynamic interaction between morethan two particles is a desirable condition to asses the role of multi-
ions of spherical particle motion in Bingham liquids. Computers and
particle interactions on the settling velocity. Therefore it is requiredto carry out the simulations with more than two particles withdifferent orientations. Further as a generalization of the numeri-cal tool, various particle shapes can be considered and the impactof their hydrodynamic interactions on the setting velocity can be
ING
C
d Chem
dt
R
A
A
B
B
B
B
C
D
D
D
E
F
G
ARTICLEModel
ACE-4122; No. of Pages 15
Prashant, J.J. Derksen / Computers an
etermined so that (eventually) we will be able to directly simulatehe dynamics of dense suspensions involving Bingham liquids.
eferences
braham, F. (1970). Functional dependence of drag coefficient of a sphere onReynolds number. Physics of Fluids, 13, 2194.
nsley, R. W., & Smith, T. N. (1967). Motion of spherical particles in a Bingham plastic.AICHE Journal, 13, 1193.
eris, A. N., Tsamopoulos, J. A., Armstrong, R. C., & Brown, R. A. (1985). Creepingmotion of a sphere through a Bingham plastic. Journal of Fluid Mechanics, 158,219.
everly, C. R., & Tanner, R. I. (1992). Numerical analysis of three-dimensional Bing-ham plastic flow. Journal of Non-Newtonian Fluid Mechanics, 42, 85.
lackery, J., & Mitsoulis, E. (1997). Creeping motion of a sphere in tubes filled witha Bingham plastic material. Journal of Non-Newtonian Fluid Mechanics, 70, 59.
otella, O., & Peyret, R. (1998). Benchmark spectral results on the lid-driven cavityflow. Computers & Fluids, 27(4), 421.
hen, S., & Doolen, G. D. (1998). Lattice Boltzmann method for fluid flows. AnnualReview of Fluid Mechanics, 30, 329.
erksen, J. J. (2008). Flow-induced forces in sphere doublets. Journal of Fluid Mechan-ics, 608, 337.
erksen, J. J., & Sundaresan, S. (2007). Direct numerical simulations of dense sus-pensions: Wave instabilities in liquid-fluidized beds. Journal of Fluid Mechanics,587, 303.
erksen, J., & Van den Akker, H. E. A. (1999). Large eddy simulations on the flowdriven by a rushton turbine. AIChE Journal, 45, 209.
ggels, J. G. M., & Somers, J. A. (1995). Numerical simulation of free convective flowusing the lattice-Boltzmann scheme. International Journal of Heat and Fluid Flow,
Please cite this article in press as: Prashant & Derksen, J J. Direct simulatChemical Engineering (2010), doi:10.1016/j.compchemeng.2010.09.002
16, 357.ortes, A., Joseph, D. D., & Lundgren, T. (1987). Nonlinear mechanics of fluidization
of beds of spherical particles. Journal of Fluid Mechanics, 177, 467.artling, D. K., & Phan-Thien, N. (1984). Numerical simulation of a plastic fluid
in a parallel-plate plastometer. Journal of Non-Newtonian Fluid Mechanics, 14,347.
PRESSical Engineering xxx (2010) xxx–xxx 15
Iwaoka, M., & Ishii, T. (1979). Experimental wall correction factors of single solidspheres in circular cylinders. Journal of Chemical and Engineering Japan, 12, 3.
Liu, B. T., Muller, S. J., & Denn, M. M. (2002). Convergence of a regularization methodfor creeping flow of a Bingham material about a rigid sphere. Journal of Non-Newtonian Fluid Mechanics, 102, 179.
Liu, B. T., Muller, S. J., & Denn, M. M. (2003). Interactions of two rigid spheres translat-ing collinearly in creeping flow in a Bingham material. Journal of Non-NewtonianFluid Mechanics, 113, 49.
Masliyah, J., Zhou, Z. J., Xu, Z., Czarnecki, J., & Hamza, H. (2004). Understanding water-based bitumen extraction from Athabasca oil sands. Canadian Journal of ChemicalEngineering, 82, 628.
Merkak, O., Jossic, L., & Magnin, A. (2006). Spheres and interactions between spheresmoving at very low velocities in a yield stress fluid. Journal of Non-NewtonianFluid Mechanics, 133, 99.
Mitsoulis, E., & Zisis, Th. (2001). Flow of Bingham plastics in a lid-driven squarecavity. Journal of Non-Newtonian Fluid Mechanics, 101, 173.
Miyamura, A., Iwasaki, S., & Ishii, T. (1981). Experimental wall correction factorsof single solid spheres in triangular and square cylinders, and parallel plates.International Journal of Multiphase Flow, 7, 41.
O’Donovan, E. J., & Tanner, R. I. (1984). Numerical study of the Bingham squeeze filmproblem. Journal of Non-Newtonian Fluid Mechanics, 15, 75.
Papanastasiou, T. C. (1987). Flow of materials with yield. Journal of Rheology, 31, 385.Peysson, Y. (2004). Solid/liquid dispersions in drilling and production. Oil Gas Science
and Technology Reviews IFP, 59, 11.ten Cate, A., Nieuwstad, C. H., Derksen, J. J., & Van den Akker, H. E. A. (2002). Particle
imaging velocimetry experiments and lattice-Boltzmann simulations on a singlesphere settling under gravity. Physics of Fluids, 14, 4012.
Vola, D., Boscardin, L., & Latche, J. C. (2003). Laminar unsteady flows of Bingham flu-ids: A numerical strategy and some benchmark results. Journal of ComputationalPhysics, 187, 441.
ions of spherical particle motion in Bingham liquids. Computers and
Wachs, A. (2009). A DEM-DLM/FD method for direct numerical simulation of par-ticulate flows: Sedimentation of polygonal isometric particles in a Newtonianfluid with collisions. Computers & Fluids, 38, 1608.
Yu, Z., & Wachs, A. (2007). A fictitious domain method for dynamic simulation of par-ticle sedimentation in Bingham fluids. Journal of Non-Newtonian Fluid Mechanics,145, 78.