
Computer Vision -...
35
Computer Vision Colorado School of Mines Colorado School of Mines Computer Vision Professor William Hoff Dept of Electrical Engineering &Computer Science http://inside.mines.edu/~whoff/ 1
Transcript of Computer Vision -...

Computer VisionColorado School of Mines
Colorado School of Mines
Computer Vision
Professor William HoffDept of Electrical Engineering &Computer Science
http://inside.mines.edu/~whoff/ 1

Computer VisionColorado School of Mines
Finding a Checkerboard
2

Computer VisionColorado School of Mines
Checkerboard Calibration Patterns
3
• Most approaches in the literature are focused on finding checkerboards used for camera calibration
• These are very clean images, and a variety of methods work well
• The methods may not work well for actual images of checkers and chess games

Computer VisionColorado School of Mines4
Real game images

Computer VisionColorado School of Mines
Finding Checker/Chess Gameboards
• Potential problems– Board may be partially occluded or out of field of view– Lighting problems: glare, shadows– There may be pieces partially covering the squares
• Helpful facts– Lines are prominent (long lines, high contrast edge points)– Geometry is known (9x9 lines, pattern of b/w squares)
• Assumptions– Board is almost all visible (there isn’t much occlusion)
5

Computer VisionColorado School of Mines
Approach: Find Squares
• Threshold image• Find contours around white regions; approximate with line segments; keep those with 4 sides
6

Computer VisionColorado School of Mines
Approach: Find Squares
• This is how OpenCV’s “findChessboardCorners” works
• Doesn’t work so well with actual game images
7

Computer VisionColorado School of Mines
Approach: Look for corners
• Convolve image with templates for the corners
• Fit to a grid• Matlab’s“detectCheckerboardPoints” function
8
Geiger, Andreas, et al. "Automatic camera and range sensor calibration using a single shot." Robotics and Automation (ICRA), 2012 IEEE International Conference on. IEEE, 2012.

Computer VisionColorado School of Mines
Approach: Look for the corners
9
clear variablesclose all
% Open movie file.movieObj = VideoReader('checkers2.mp4');
nFrames = movieObj.NumberOfFrames;fprintf('Opening movie file with %d images\n', nFrames);
% Go through movie. We don't need to process every frame.for iFrame=1:10:nFrames
I = read(movieObj,iFrame);fprintf('Frame %d\n', iFrame);
% Reduce image size; is faster and we don't need full size to find board.if size(I,2)>640
I = imresize(I, 640/size(I,2));end
figure(1), imshow(I), title(sprintf('Frame %d', iFrame));
[imagePoints,boardSize] = detectCheckerboardPoints(I);hold on; plot(imagePoints(:,1), imagePoints(:,2), 'go');
pause(0.1);end
Example use of Matlab’s“detectCheckerboardPoints”

Computer VisionColorado School of Mines
Approach: Look for the corners
• Works better … but if any corners are missed, the whole pattern is rejected
10

Computer VisionColorado School of Mines
Approach: Hough Lines
• Use Hough transform to find long lines• Then try to match the detected lines to the known model, consisting of a set of 9x9 lines
• Note that the image of the board can be mapped to a reference image via a homography
• This helps to verify that the true lines are found
11

Computer VisionColorado School of Mines
Matlab Code
• Enter the Matlab code on the next couple of pages– A main program, save it as “main.m”– A function, save it as “findCheckerBoard.m”
• Get the test video called “board.mp4”
• Run the code ‐ it should read every 10th image and detect edges
12

Computer VisionColorado School of Mines13
clear variablesclose all
% Open movie file.movieObj = VideoReader('board.mp4');
nFrames = movieObj.NumberOfFrames;fprintf('Opening movie file with %d images\n', nFrames);
% Go through movie. We don't need to process every frame.for iFrame=1:10:nFrames
I = read(movieObj,iFrame);fprintf('Frame %d\n', iFrame);
% Reduce image size; is faster and we don't need full size to find board.if size(I,2)>640
I = imresize(I, 640/size(I,2));end
figure(1), imshow(I), title(sprintf('Frame %d', iFrame));
% Find the checkerboard. Return the four outer corners as a 4x2 array,% in the form [ [x1,y1]; [x2,y2]; ... ].[corners, nMatches, avgErr] = findCheckerBoard(I);
pause;end
Main program

Computer VisionColorado School of Mines14
Function “findCheckerBoard”
function [corners, nMatches, avgErr] = findCheckerBoard(I)% Find a 8x8 checkerboard in the image I. % Returns:% corners: the locations of the four outer corners as a 4x2 array, in % the form [ [x1,y1]; [x2,y2]; ... ].% nMatches: number of matching points found (ideally is 81)% avgErr: the average reprojection error of the matching points% Return empty if not found.
corners = [];nMatches = [];avgErr = [];
if size(I,3)>1I = rgb2gray(I);
end
% Do edge detection.E = edge(I, 'canny');figure(10), imshow(E), title('Edges');
end

Computer VisionColorado School of Mines
Look at Edge Output Images
• There are too many edges – we only need the edge points on the board, not all the ones in the background
• The edges on the board should be relatively strong• Raise Canny threshold and run again
– ReplaceE = edge(I, 'canny');
– with[~,thresh] = edge(I, 'canny'); % First get the automatic thresholdE = edge(I, 'canny', 5*thresh); % Raise the threshold
15

Computer VisionColorado School of Mines
Hough Transform
• Add this code to do the Hough transform on the edge image E and extract peaks
16
% Do Hough transform to find lines.[H,thetaValues,rhoValues] = hough(E);
% Extract peaks from the Hough array H. Parameters for this:% houghThresh: Minimum value to be considered a peak. Default% is 0.5*max(H(:))% NHoodSize: Size of suppression neighborhood. Default is% [size(H,1)/50, size(H,2)/50]. Must be odd numbers.myThresh = ceil(0.5*max(H(:)));NHoodSize = ceil([size(H,1)/50, size(H,2)/50]);% Force odd sizeif mod(NHoodSize(1),2)==0 NHoodSize(1) = NHoodSize(1)+1; endif mod(NHoodSize(2),2)==0 NHoodSize(2) = NHoodSize(2)+1; endpeaks = houghpeaks(H, ...
30, ... % Maximum number of peaks to find'Threshold', myThresh, ... % Threshold for peaks'NHoodSize', NHoodSize); % Default = floor(size(H)/50);

Computer VisionColorado School of Mines
Display lines
• Add this code to mark the peaks on the Hough array
• Add this code to display all lines. This calls a function “drawLines” to draw lines on the edge image
• Also, add the function “drawLines” on the next page, at the end of file “findCheckerBoard”.
17
% Show all lines.figure(10), imshow(E), title('All lines');drawLines( ...
rhoValues(peaks(:,1)), ... % rhos for the linesthetaValues(peaks(:,2)), ... % thetas for the linessize(E), ... % size of image being displayed'y'); % color of line to display
% Display Hough array and draw peaks on Hough array.figure(11), imshow(H, []), title('Hough'), impixelinfo;for i=1:size(peaks,1)
rectangle('Position', ...[peaks(i,2)-NHoodSize(2)/2, peaks(i,1)-NHoodSize(1)/2, ...NHoodSize(2), NHoodSize(1)], 'EdgeColor', 'r');
end

Computer VisionColorado School of Mines18
function drawLines(rhos, thetas, imageSize, color)% This function draws lines on whatever image is being displayed.% Input parameters:% rhos,thetas: representation of the line (theta in degrees)% imageSize: [height,width] of image being displayed% color: color of line to draw
% Equation of the line is rho = x cos(theta) + y sin(theta), or% y = (rho - x*cos(theta))/sin(theta)
for i=1:length(thetas)if abs(thetas(i)) > 45
% Line is mostly horizontal. Pick two values of x,% and solve for y = (-ax-c)/bx0 = 1;y0 = (-cosd(thetas(i))*x0+rhos(i))/sind(thetas(i));x1 = imageSize(2);y1 = (-cosd(thetas(i))*x1+rhos(i))/sind(thetas(i));
else% Line is mostly vertical. Pick two values of y,% and solve for x = (-by-c)/ay0 = 1;x0 = (-sind(thetas(i))*y0+rhos(i))/cosd(thetas(i));y1 = imageSize(1);x1 = (-sind(thetas(i))*y1+rhos(i))/cosd(thetas(i));
end
line([x0 x1], [y0 y1], 'Color', color);text(x0,y0,sprintf('%d', i), 'Color', color);
end
end
Function “drawLines”

Computer VisionColorado School of Mines
Hough Transform
• Look at detected lines. Some important ones aren’t detected.
• Too few edge points on those lines … peaks are too low.
• Lower Hough peak threshold – change
• To
• Verify that important lines are now detected.19
myThresh = ceil(0.5*max(H(:)));
myThresh = ceil(0.05*max(H(:)));
Computer VisionColorado School of Mines
“Orthogonal” Lines
• Now find the two (approximately orthogonal) sets of lines.
• We’ll search for the two largest peaks in the histogram of line angles.– (Note – a better way is to find the two “vanishing points” … see Szeliski book section 4.3.3)
• Keep only those lines that are near the angles corresponding to the two largest peaks
• Enter the code on the next few pages to find the lines and show them
20

Computer VisionColorado School of Mines
“Orthogonal” Lines
• This goes just after finding the code to display all the lines. – It calls a function “findOrthogonalLines” (see next page)
21
% Find two sets of orthogonal lines.[lines1, lines2] = findOrthogonalLines( ...
rhoValues(peaks(:,1)), ... % rhos for the linesthetaValues(peaks(:,2))); % thetas for the lines
% Show the two sets of lines.figure(12), imshow(E), title('Orthogonal lines');drawLines( ...
lines1(2,:), ... % rhos for the lineslines1(1,:), ... % thetas for the linessize(E), ... % size of image being displayed'g'); % color of line to display
drawLines( ...lines2(2,:), ... % rhos for the lineslines2(1,:), ... % thetas for the linessize(E), ... % size of image being displayed'r'); % color of line to display

Computer VisionColorado School of Mines22
%%%%%%%%%%%%%%%%%%%%%%%%%%%%%%%%%%%%%%%%%%%%%%%%% Find two sets of orthogonal lines.% Inputs:% rhoValues: rho values for the lines% thetaValues: theta values (should be from -90..+89 degrees)% Outputs:% lines1, lines2: the two sets of lines, each stored as a 2xN array,% where each column is [theta;rho]function [lines1, lines2] = findOrthogonalLines( ...
rhoValues, ... % rhos for the linesthetaValues) % thetas for the lines
% Find the largest two modes in the distribution of angles.bins = -90:10:90; % Use bins with widths of 10 degrees[counts, bins] = histcounts(thetaValues, bins); % Get histogram[~,indices] = sort(counts, 'descend');
% The first angle corresponds to the largest histogram count.a1 = (bins(indices(1)) + bins(indices(1)+1))/2; % Get first angle
% The 2nd angle corresponds to the next largest count. However, don't% find a bin that is too close to the first bin.for i=2:length(indices)
if (abs(indices(1)-indices(i)) <= 2) || ...(abs(indices(1)-indices(i)+length(indices)) <= 2) || ...(abs(indices(1)-indices(i)-length(indices)) <= 2)
continue;else
a2 = (bins(indices(i)) + bins(indices(i)+1))/2;break;
endendfprintf('Most common angles: %f and %f\n', a1, a2);
Function “findOrthogonalLines” (1 of 2)
Put this at the end of the file “findCheckerBoard.m”

Computer VisionColorado School of Mines23
% Get the two sets of lines corresponding to the two angles. Lines will% be a 2xN array, where% lines1[1,i] = theta_i% lines1[2,i] = rho_ilines1 = [];lines2 = [];for i=1:length(rhoValues)
% Extract rho, theta for this liner = rhoValues(i);t = thetaValues(i);
% Check if the line is close to one of the two angles.D = 25; % threshold difference in angleif abs(t-a1) < D || abs(t-180-a1) < D || abs(t+180-a1) < D
lines1 = [lines1 [t;r]];elseif abs(t-a2) < D || abs(t-180-a2) < D || abs(t+180-a2) < D
lines2 = [lines2 [t;r]];end
end
end
Function “findOrthogonalLines” (1 of 2)

Computer VisionColorado School of Mines
Sorting Lines
• Sort lines from top to bottom, left to right• Strategy:
– if lines are mostly horizontal, sort on vertical position.– If lines are mostly vertical, sort on horizontal position.
• Insert this code just after the call to “findOrthogonalLines”– It calls “sortLines” (on the next page)
• Note that indices are (almost) in order now.
24
% Sort the lines, from top to bottom (for horizontal lines) and left to% right (for vertical lines).lines1 = sortLines(lines1, size(E));lines2 = sortLines(lines2, size(E));
Computer VisionColorado School of Mines
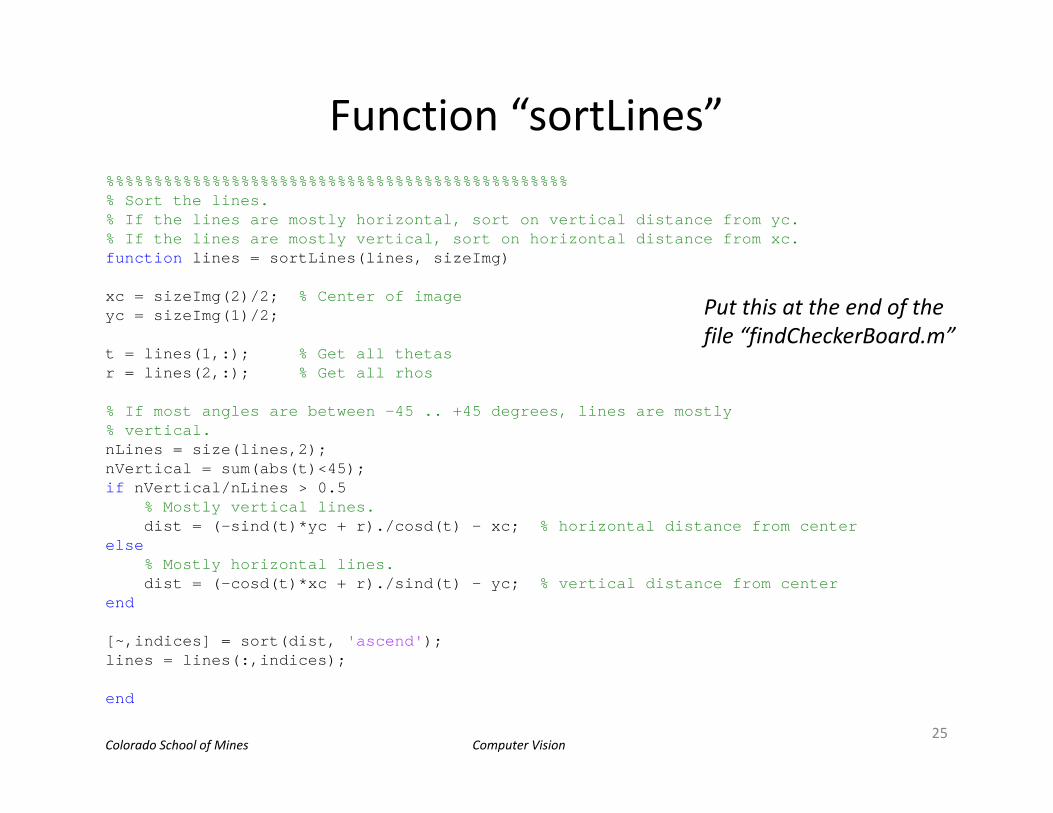
Function “sortLines”
25
%%%%%%%%%%%%%%%%%%%%%%%%%%%%%%%%%%%%%%%%%%%%%%%%% Sort the lines.% If the lines are mostly horizontal, sort on vertical distance from yc.% If the lines are mostly vertical, sort on horizontal distance from xc.function lines = sortLines(lines, sizeImg)
xc = sizeImg(2)/2; % Center of imageyc = sizeImg(1)/2;
t = lines(1,:); % Get all thetasr = lines(2,:); % Get all rhos
% If most angles are between -45 .. +45 degrees, lines are mostly% vertical.nLines = size(lines,2);nVertical = sum(abs(t)<45);if nVertical/nLines > 0.5
% Mostly vertical lines.dist = (-sind(t)*yc + r)./cosd(t) - xc; % horizontal distance from center
else% Mostly horizontal lines.dist = (-cosd(t)*xc + r)./sind(t) - yc; % vertical distance from center
end
[~,indices] = sort(dist, 'ascend');lines = lines(:,indices);
end
Put this at the end of the file “findCheckerBoard.m”

Computer VisionColorado School of Mines
Find Intersections
• Calculate all possible intersections between the two sets of lines.
• Note – the intersection of two lines can be found as follows (see Szeliski book section 2.1.1)– A line is represented by the parameters (a,b,c), where the equation of
the line is ax+by+c = 0– If , , and , , , the point of intersection is
the cross product
26
% Intersect every pair of lines, one from set 1 and one from set 2.% Output is the x,y coordinates of the intersections:% xIntersections(i1,i2): x coord of intersection of i1 and i2% yIntersections(i1,i2): y coord of intersection of i1 and i2[xIntersections, yIntersections] = findIntersections(lines1, lines2);
% Plot all measured intersection points.hold onplot(xIntersections(:),yIntersections(:),'yd');hold off

Computer VisionColorado School of Mines27
%%%%%%%%%%%%%%%%%%%%%%%%%%%%%%%%%%%%%%%%%%%%%%%%%%%%%%%%%%%%%%%%%%%% Intersect every pair of lines, one from set 1 and one from set 2.% Output arrays contain the x,y coordinates of the intersections of lines.% xIntersections(i1,i2): x coord of intersection of i1 and i2% yIntersections(i1,i2): y coord of intersection of i1 and i2function [xIntersections, yIntersections] = findIntersections(lines1, lines2)N1 = size(lines1,2);N2 = size(lines2,2);
xIntersections = zeros(N1,N2);yIntersections = zeros(N1,N2);for i1=1:N1
% Extract rho, theta for this liner1 = lines1(2,i1);t1 = lines1(1,i1);
% A line is represented by (a,b,c), where ax+by+c=0.% We have r = x cos(t) + y sin(t), or x cos(t) + y sin(t) - r = 0.l1 = [cosd(t1); sind(t1); -r1];
for i2=1:N2% Extract rho, theta for this liner2 = lines2(2,i2);t2 = lines2(1,i2);
l2 = [cosd(t2); sind(t2); -r2];
% Two lines l1 and l2 intersect at a point p where p = l1 cross l2p = cross(l1,l2);p = p/p(3);
xIntersections(i1,i2) = p(1);yIntersections(i1,i2) = p(2);
endend
end
Function “findIntersections”
Put this at the end of the file “findCheckerBoard.m”

Computer VisionColorado School of Mines
Strategy
• If we can find the four outer lines, their intersections define the outer corners of the board.
• If they are correct, we can predict the intersections of all 9x9 lines.
• We’re going to need a reference image that is a model of what we are looking for. – Define a reference image of size 100x100
28
% Define a "reference" image.IMG_SIZE_REF = 100; % Reference image is IMG_SIZE_REF x IMG_SIZE_REF
% Get predicted intersections of lines in the reference image.[xIntersectionsRef, yIntersectionsRef] = createReference(IMG_SIZE_REF);

Computer VisionColorado School of Mines29
%%%%%%%%%%%%%%%%%%%%%%%%%%%%%%%%%%%%%%%%%%%%%%%%%%%%%%%%%%%%%%%%%%%% Get predicted intersections of lines in the reference image.function [xIntersectionsRef, yIntersectionsRef] = createReference(sizeRef)
sizeSquare = sizeRef/8; % size of one square
% Predict all line intersections.[xIntersectionsRef, yIntersectionsRef] = meshgrid(1:9, 1:9);xIntersectionsRef = (xIntersectionsRef-1)*sizeSquare + 1;yIntersectionsRef = (yIntersectionsRef-1)*sizeSquare + 1;
% Draw reference image.Iref = zeros(sizeRef+1, sizeRef+1);figure(13), imshow(Iref), title('Reference image');
% Show all reference image intersections.hold onplot(xIntersectionsRef, yIntersectionsRef, 'y+');hold off
end
Function “createReference”
Put this at the end of the file “findCheckerBoard.m”

Computer VisionColorado School of Mines
Finding Correspondence
• Now, search for correspondences between the points from the input image and the reference image
• Given correspondences of the four points representing the outside corners of the board, we can compute a homographybetween the input image and the reference image.– We can then predict the locations of all interior points.– The best fit has the most matches with lowest projection error.
30
% Find the best correspondence between the points in the input image and% the points in the reference image. If found, the output is the four% outer corner points from the image, represented as a a 4x2 array, in the% form [ [x1,y1]; [x2,y2]; ... ].[corners, nMatches, avgErr] = findCorrespondence( ...
xIntersections, yIntersections, ... % Input image pointsxIntersectionsRef, yIntersectionsRef, ... % Reference image pointsI);

Computer VisionColorado School of Mines31
% Find the best correspondence between the points in the input image and% the points in the reference image. If found, the output is the four% outer corner points from the image, represented as a a 4x2 array, in the% form [ [x1,y1]; [x2,y2], ... ].function [corners, nMatchesBest, avgErrBest] = findCorrespondence( ...
xIntersections, yIntersections, ... % Input image pointsxIntersectionsRef, yIntersectionsRef, ... % Reference image pointsI)
% Get the coordinates of the four outer corners of the reference image,% in clockwise order starting from the top left.pCornersRef = [ ...
xIntersectionsRef(1,1), yIntersectionsRef(1,1);xIntersectionsRef(1,end), yIntersectionsRef(1,end);xIntersectionsRef(end,end), yIntersectionsRef(end,end);xIntersectionsRef(end,1), yIntersectionsRef(end,1) ];
M = 4; % Number of lines to search in each directionDMIN = 4; % To match, a predicted point must be within this distance
nMatchesBest = 0; % Number of matches of best candidate found so faravgErrBest = 1e9; % The average error of the best candidate
N1 = size(xIntersections,1);N2 = size(xIntersections,2);
for i1a=1:min(M,N1)for i1b=N1:-1:max(N1-M,i1a+1)
for i2a=1:min(M,N2)for i2b=N2:-1:max(N2-M,i2a+1)
% Get the four corners corresponding to the intersections% of lines (1a,2a), (1a,2b), (1b,2b, and (1b,2a).pCornersImg = zeros(4,2);pCornersImg(1,:) = [xIntersections(i1a,i2a) yIntersections(i1a,i2a)];pCornersImg(2,:) = [xIntersections(i1a,i2b) yIntersections(i1a,i2b)];pCornersImg(3,:) = [xIntersections(i1b,i2b) yIntersections(i1b,i2b)];pCornersImg(4,:) = [xIntersections(i1b,i2a) yIntersections(i1b,i2a)];
% Make sure that points are in clockwise order.% If not, exchange points 2 and 4.
Function “findCorrespondence” (1 of 3)
Put this at the end of the file “findCheckerBoard.m”

Computer VisionColorado School of Mines32
v12 = pCornersImg(2,:) - pCornersImg(1,:);v13 = pCornersImg(3,:) - pCornersImg(1,:);if v12(1)*v13(2) - v12(2)*v13(1) < 0
temp = pCornersImg(2,:);pCornersImg(2,:) = pCornersImg(4,:);pCornersImg(4,:) = temp;
end
% Fit a homography using those four points.T = fitgeotrans(pCornersRef, pCornersImg, 'projective');
% Transform all reference points to the image.pIntersectionsRefWarp = transformPointsForward(T, ...
[xIntersectionsRef(:) yIntersectionsRef(:)]);
% For each predicted reference point, find the closest% detected image point.dPts = 1e6 * ones(size(pIntersectionsRefWarp,1),1);for i=1:size(pIntersectionsRefWarp,1)
x = pIntersectionsRefWarp(i,1);y = pIntersectionsRefWarp(i,2);d = ((x-xIntersections(:)).^2 + (y-yIntersections(:)).^2).^0.5;dmin = min(d);dPts(i) = dmin;
end
% If the distance is less than DMIN, count it as a match.nMatches = sum(dPts < DMIN);
% Calculate the avg error of the matched points.avgErr = mean(dPts(dPts < DMIN));
% Keep the best combination found so far, in terms of% the number of matches and the minimum error.if nMatches < nMatchesBest
continue;endif (nMatches == nMatchesBest) && (avgErr > avgErrBest)
continue;end
Function “findCorrespondence” (2 of 3)

Computer VisionColorado School of Mines33
% Got a better combination; save it.avgErrBest = avgErr;nMatchesBest = nMatches;corners = pCornersImg;
% Display the predicted and measured points.figure(14), imshow(I,[]);title('Predicted and measured points');hold onplot(xIntersections(:), yIntersections(:), 'g.');plot(pIntersectionsRefWarp(:,1), pIntersectionsRefWarp(:,2), 'yo');hold off
rectangle('Position', [pCornersImg(1,1)-10 pCornersImg(1,2)-10 20 20], ...'Curvature', [1 1], 'EdgeColor', 'r', 'LineWidth', 2);
rectangle('Position', [pCornersImg(2,1)-10 pCornersImg(2,2)-10 20 20], ...'Curvature', [1 1], 'EdgeColor', 'g', 'LineWidth', 2);
rectangle('Position', [pCornersImg(3,1)-10 pCornersImg(3,2)-10 20 20], ...'Curvature', [1 1], 'EdgeColor', 'b', 'LineWidth', 2);
rectangle('Position', [pCornersImg(4,1)-10 pCornersImg(4,2)-10 20 20], ...'Curvature', [1 1], 'EdgeColor', 'y', 'LineWidth', 2);
fprintf(' Found %d matches, average error = %f\n', ...nMatchesBest, avgErrBest);
pauseend
endend
end
end
Function “findCorrespondence” (3 of 3)

Computer VisionColorado School of Mines
Displaying the Board
• In the main program, check the number of matches returned by “findCheckerBoard”. – The ideal number is 81. – If the number found is much less than this, the board was probably not found.
• Then you can draw lines around the four outer corners.
34
% Find the checkerboard. Return the four outer corners as a 4x2 array,% in the form [ [x1,y1]; [x2,y2]; ... ].
[corners, nMatches, avgErr] = findCheckerBoard(I);

Computer VisionColorado School of Mines
Displaying the Board
• Convert the image of the board to an “orthophoto”.• Define the ideal corners in the orthophoto:
• Call fitgeotrans to compute the homography:
• Then call “imwarp” to warp the input image to the output orthophoto:
35
% Define the outside corners for a square "reference" image, size LxL.cornersRef = [ 1,1; L,1; L,L; 1,L ];
% Fit a projective transform that will map image to reference.T = fitgeotrans(corners, cornersRef, 'projective');
% Create an "orthophoto" of the image of the board.Iboard = imwarp(I, T, 'OutputView', imref2d([L L], [1 L], [1 L]));