Computer Graphics - cs.princeton.edu · Electrostatic printer Pen plotter Image Resolution •...
9
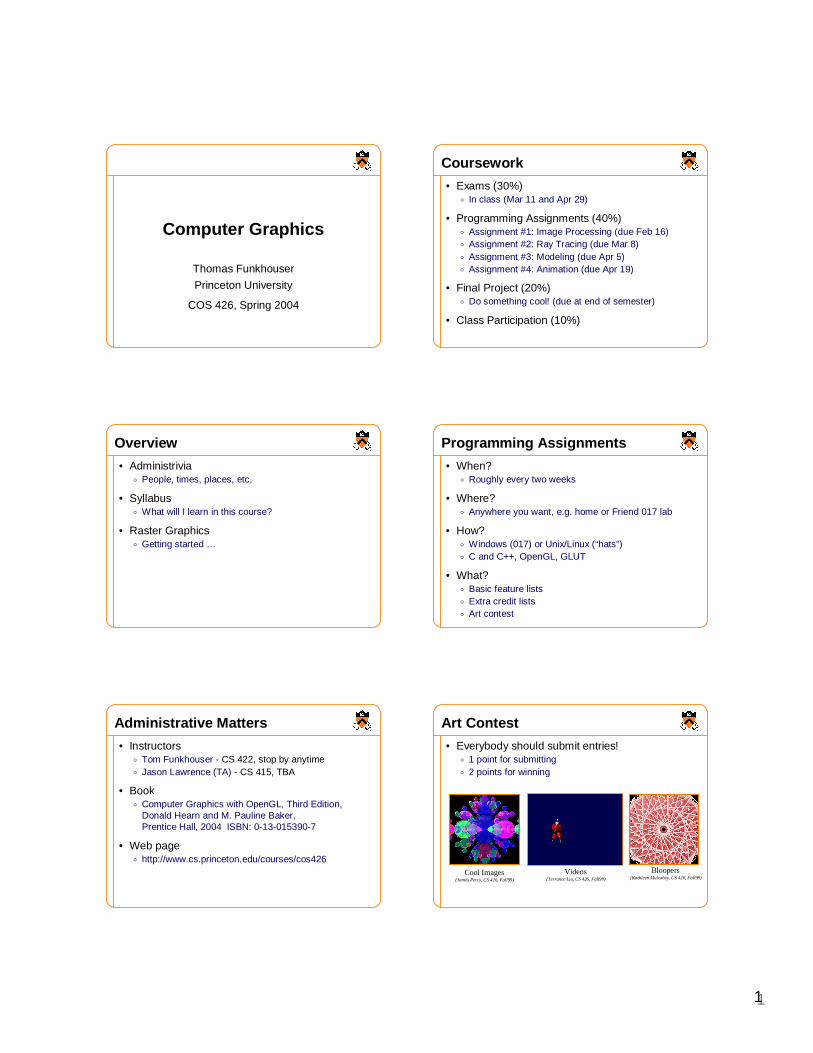
1 1 Computer Graphics Thomas Funkhouser Princeton University COS 426, Spring 2004 Overview • Administrivia People, times, places, etc. • Syllabus What will I learn in this course? • Raster Graphics Getting started … Administrative Matters • Instructors Tom Funkhouser - CS 422, stop by anytime Jason Lawrence (TA) - CS 415, TBA • Book Computer Graphics with OpenGL, Third Edition, Donald Hearn and M. Pauline Baker, Prentice Hall, 2004 ISBN: 0-13-015390-7 • Web page http://www.cs.princeton.edu/courses/cos426 Coursework • Exams (30%) In class (Mar 11 and Apr 29) • Programming Assignments (40%) Assignment #1: Image Processing (due Feb 16) Assignment #2: Ray Tracing (due Mar 8) Assignment #3: Modeling (due Apr 5) Assignment #4: Animation (due Apr 19) • Final Project (20%) Do something cool! (due at end of semester) • Class Participation (10%) Programming Assignments • When? Roughly every two weeks • Where? Anywhere you want, e.g. home or Friend 017 lab • How? Windows (017) or Unix/Linux (“hats”) C and C++, OpenGL, GLUT • What? Basic feature lists Extra credit lists Art contest Art Contest • Everybody should submit entries! 1 point for submitting 2 points for winning Bloopers (Kathleen Mulcahey, CS 426, Fall99) Cool Images (James Percy, CS 426, Fall99) Videos (Terrance Liu, CS 426, Fall99)
Transcript of Computer Graphics - cs.princeton.edu · Electrostatic printer Pen plotter Image Resolution •...
11
Computer Graphics
Thomas Funkhouser
Princeton University
COS 426, Spring 2004
Overview
• Administrivia� People, times, places, etc.
• Syllabus� What will I learn in this course?
• Raster Graphics� Getting started …
Administrative Matters
• Instructors� Tom Funkhouser - CS 422, stop by anytime� Jason Lawrence (TA) - CS 415, TBA
• Book� Computer Graphics with OpenGL, Third Edition,
Donald Hearn and M. Pauline Baker,Prentice Hall, 2004 ISBN: 0-13-015390-7
• Web page� http://www.cs.princeton.edu/courses/cos426
Coursework
• Exams (30%)� In class (Mar 11 and Apr 29)
• Programming Assignments (40%)� Assignment #1: Image Processing (due Feb 16) � Assignment #2: Ray Tracing (due Mar 8) � Assignment #3: Modeling (due Apr 5) � Assignment #4: Animation (due Apr 19)
• Final Project (20%)� Do something cool! (due at end of semester)
• Class Participation (10%)
Programming Assignments
• When?� Roughly every two weeks
• Where?� Anywhere you want, e.g. home or Friend 017 lab
• How?� Windows (017) or Unix/Linux (“hats”)� C and C++, OpenGL, GLUT
• What?� Basic feature lists� Extra credit lists� Art contest
Art Contest
• Everybody should submit entries!� 1 point for submitting� 2 points for winning
Bloopers(Kathleen Mulcahey, CS 426, Fall99)
Cool Images(James Percy, CS 426, Fall99)
Videos(Terrance Liu, CS 426, Fall99)
22
Collaboration Policy
• Overview:� You must write your own code (no credit for other code)� You must reference your sources of any ideas/code
• It’s OK to …� Talk with other students about ideas, approaches, etc.� Get ideas from information in books, web sites, etc.� Get “support” code from example programs
» But, you must reference your sources
• It’s NOT OK to …� Share code with another student� Use ideas or code acquired from another sources
without attribution
Precepts
• Schedule?
Overview
• Administrivia� People, times, places, etc.
Ø Syllabus� What will I learn in this course?
• Raster Graphics� Getting started …
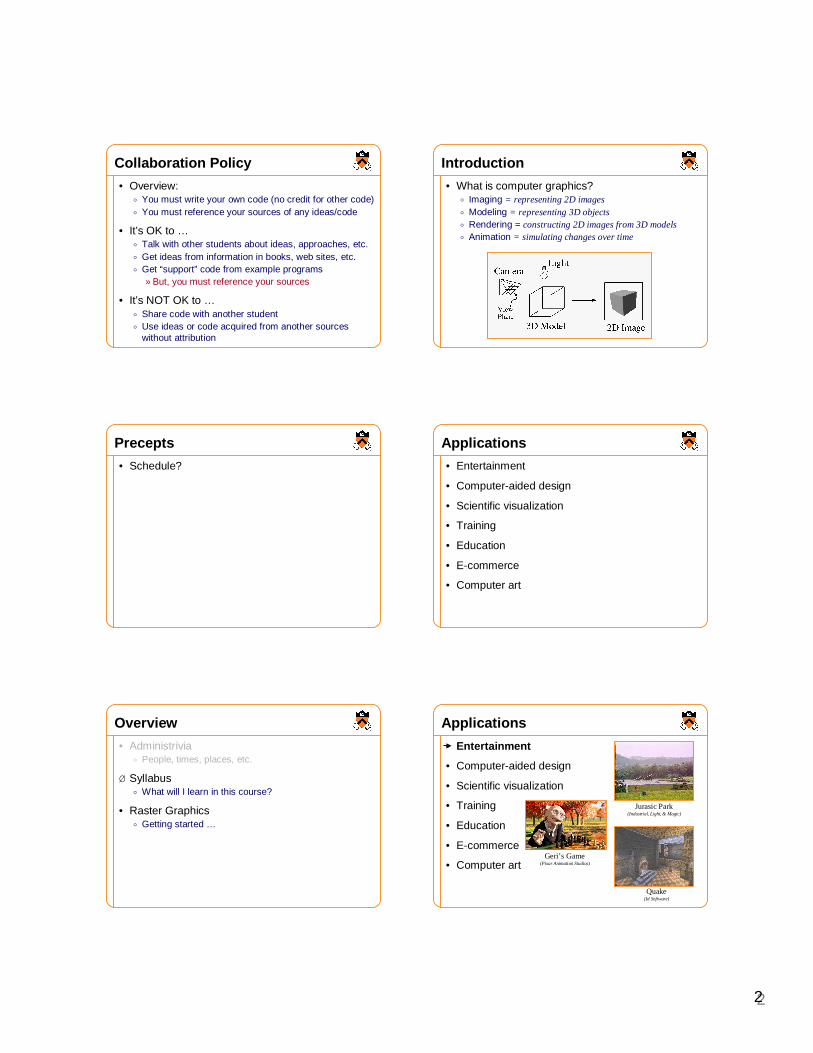
Introduction
• What is computer graphics?� Imaging = representing 2D images� Modeling = representing 3D objects� Rendering = constructing 2D images from 3D models� Animation = simulating changes over time
Applications
• Entertainment
• Computer-aided design
• Scientific visualization
• Training
• Education
• E-commerce
• Computer art
Applications
• Entertainment
• Computer-aided design
• Scientific visualization
• Training
• Education
• E-commerce
• Computer art
Jurasic Park(Industrial, Light, & Magic)
Quake(Id Software)
Geri’s Game(Pixar Animation Studios)
33
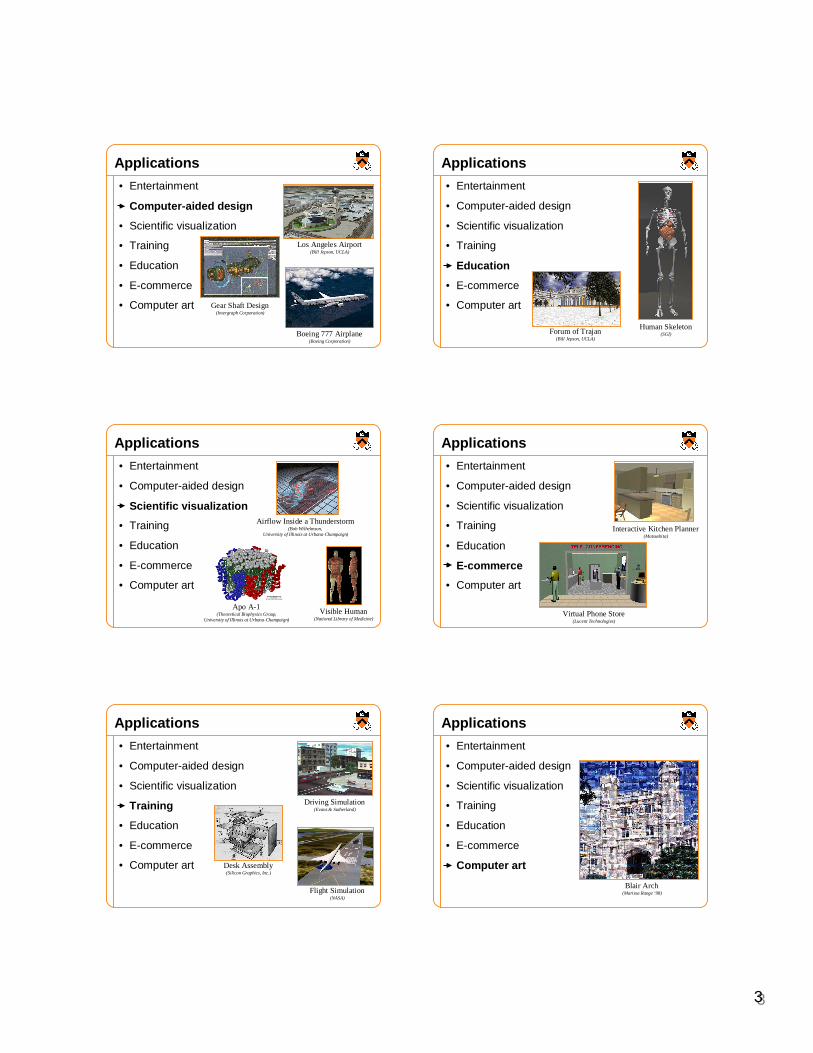
Applications
• Entertainment
• Computer-aided design
• Scientific visualization
• Training
• Education
• E-commerce
• Computer art Gear Shaft Design(Intergraph Corporation)
Boeing 777 Airplane(Boeing Corporation)
Los Angeles Airport(Bill Jepson, UCLA)
Applications
• Entertainment
• Computer-aided design
• Scientific visualization
• Training
• Education
• E-commerce
• Computer art
Apo A-1(Theoretical Biophysics Group,
University of Illinois at Urbana-Champaign)
Visible Human(National Library of Medicine)
Airflow Inside a Thunderstorm(Bob Wilhelmson,
University of Illinois at Urbana-Champaign)
Applications
• Entertainment
• Computer-aided design
• Scientific visualization
• Training
• Education
• E-commerce
• Computer art
Driving Simulation(Evans & Sutherland)
Flight Simulation(NASA)
Desk Assembly(Silicon Graphics, Inc.)
Applications
• Entertainment
• Computer-aided design
• Scientific visualization
• Training
• Education
• E-commerce
• Computer art
Human Skeleton(SGI)Forum of Trajan
(Bill Jepson, UCLA)
Applications
• Entertainment
• Computer-aided design
• Scientific visualization
• Training
• Education
• E-commerce
• Computer art
Interactive Kitchen Planner(Matsushita)
Virtual Phone Store(Lucent Technologies)
Applications
• Entertainment
• Computer-aided design
• Scientific visualization
• Training
• Education
• E-commerce
• Computer art
Blair Arch(Marissa Range ‘98)
44
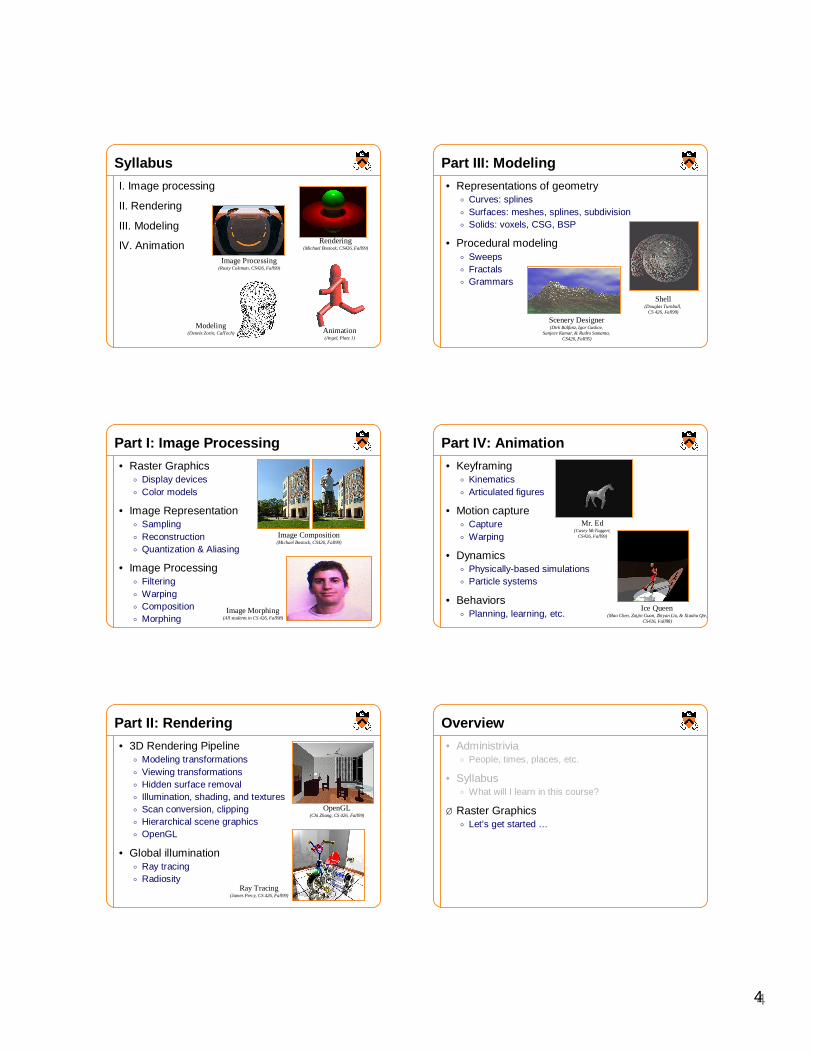
Syllabus
I. Image processing
II. Rendering
III. Modeling
IV. AnimationImage Processing
(Rusty Coleman, CS426, Fall99)
Modeling(Dennis Zorin, CalTech) Animation
(Angel, Plate 1)
Rendering(Michael Bostock, CS426, Fall99)
Part I: Image Processing
• Raster Graphics� Display devices� Color models
• Image Representation� Sampling � Reconstruction� Quantization & Aliasing
• Image Processing� Filtering� Warping� Composition� Morphing
Image Composition(Michael Bostock, CS426, Fall99)
Image Morphing(All students in CS 426, Fall98)
Part II: Rendering
• 3D Rendering Pipeline� Modeling transformations� Viewing transformations� Hidden surface removal� Illumination, shading, and textures� Scan conversion, clipping� Hierarchical scene graphics� OpenGL
• Global illumination� Ray tracing� Radiosity
OpenGL(Chi Zhang, CS 426, Fall99)
Ray Tracing(James Percy, CS 426, Fall99)
Part III: Modeling
• Representations of geometry� Curves: splines� Surfaces: meshes, splines, subdivision� Solids: voxels, CSG, BSP
• Procedural modeling� Sweeps� Fractals � Grammars
Scenery Designer(Dirk Balfanz, Igor Guskov,
Sanjeev Kumar, & Rudro Samanta, CS426, Fall95)
Shell(Douglas Turnbull,
CS 426, Fall99)
Part IV: Animation
• Keyframing� Kinematics� Articulated figures
• Motion capture� Capture� Warping
• Dynamics� Physically-based simulations� Particle systems
• Behaviors� Planning, learning, etc.
Ice Queen(Mao Chen, Zaijin Guan, Zhiyan Liu, & Xiaohu Qie,
CS426, Fall98)
Mr. Ed(Casey McTaggert,
CS426, Fall99)
Overview
• Administrivia� People, times, places, etc.
• Syllabus� What will I learn in this course?
Ø Raster Graphics� Let’s get started …
55
Raster Graphics
• Images� What is an image?� How are images displayed?
• Colors� How do we perceive colors?� How do we represent colors in a computer?
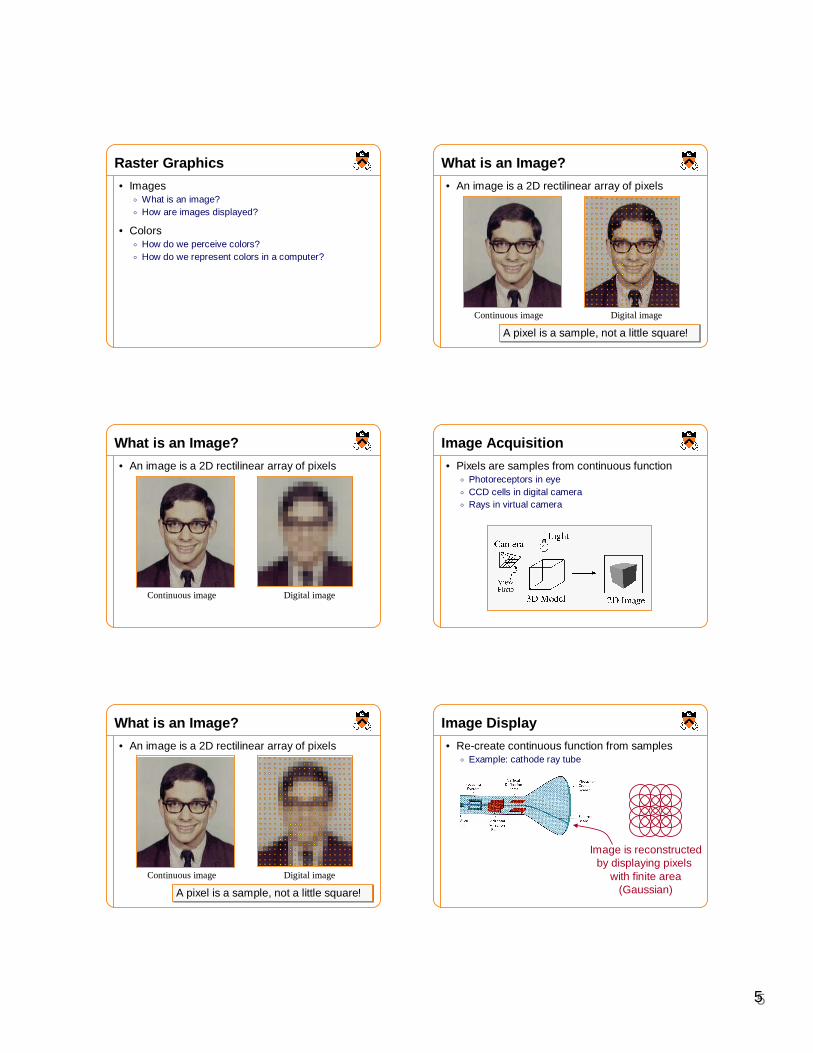
What is an Image?
• An image is a 2D rectilinear array of pixels
Continuous image Digital image
What is an Image?
• An image is a 2D rectilinear array of pixels
Continuous image Digital image
A pixel is a sample, not a little square!A pixel is a sample, not a little square!
What is an Image?
• An image is a 2D rectilinear array of pixels
A pixel is a sample, not a little square!A pixel is a sample, not a little square!
Continuous image Digital image
Image Acquisition
• Pixels are samples from continuous function� Photoreceptors in eye� CCD cells in digital camera� Rays in virtual camera
Image Display
• Re-create continuous function from samples� Example: cathode ray tube
Image is reconstructedby displaying pixels
with finite area(Gaussian)
66
Liquid Crystal Display (LCD)
Figure 2.16 from H&B
Display Hardware
• Video display devices» Cathode Ray Tube (CRT)» Liquid Crystal Display (LCD)� Plasma panels� Thin-film electroluminescent displays� Light-emitting diodes (LED)
• Hard-copy devices� Ink-jet printer� Laser printer� Film recorder� Electrostatic printer� Pen plotter
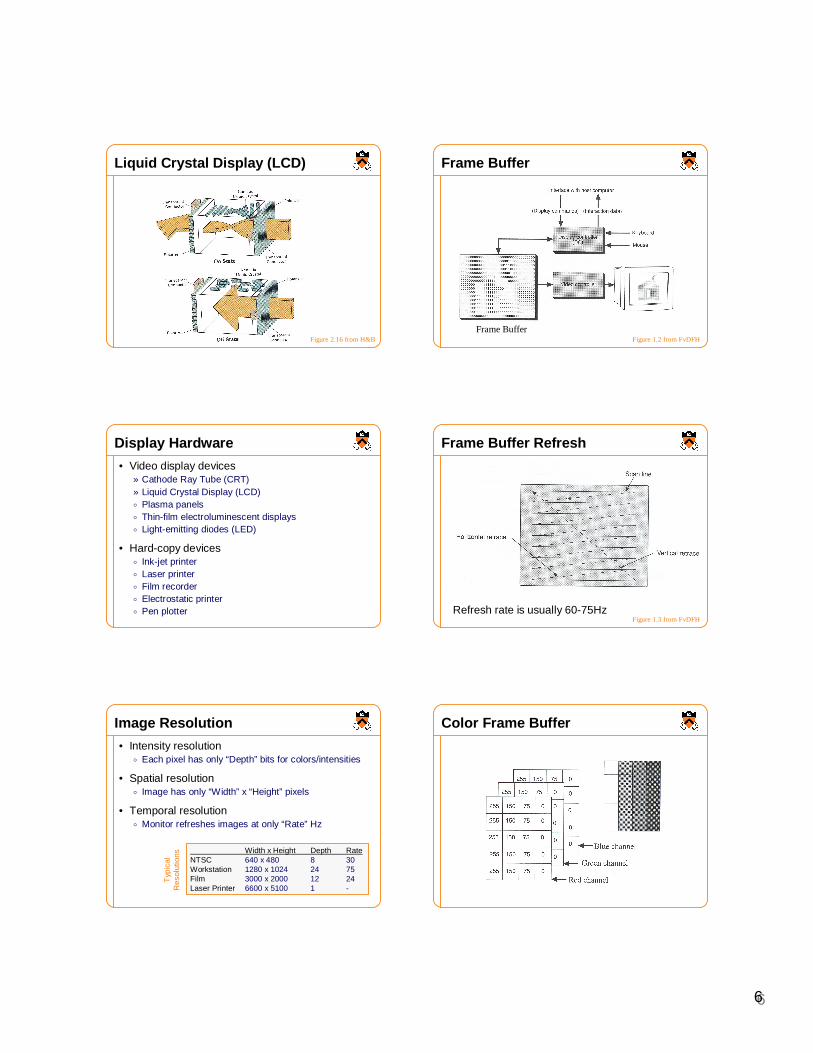
Image Resolution
• Intensity resolution� Each pixel has only “Depth” bits for colors/intensities
• Spatial resolution� Image has only “Width” x “Height” pixels
• Temporal resolution� Monitor refreshes images at only “Rate” Hz
Width x Height Depth Rate NTSC 640 x 480 8 30Workstation 1280 x 1024 24 75Film 3000 x 2000 12 24Laser Printer 6600 x 5100 1 -
Typ
ical
Res
olut
ions
Frame Buffer
Frame BufferFigure 1.2 from FvDFH
Frame Buffer Refresh
Figure 1.3 from FvDFH Refresh rate is usually 60-75Hz
Color Frame Buffer
77
Color CRT
Figure 2.8 from H&B
Raster Graphics
• Images� What is an image?� How are images displayed?
Ø Colors� How do we perceive colors?� How do we represent colors in a computer?
Electromagnetic Spectrum
• Visible light frequencies range between ...� Red = 4.3 x 10¹⁴ hertz (700nm)� Violet = 7.5 x 10¹⁴ hertz (400nm)
Figures 15.1 from H&B
Visible Light
• The color of light is characterized by …� Hue = dominant frequency (highest peak)� Saturation = excitation purity (ratio of highest to rest)� Lightness = luminance (area under curve)
White Light Orange Light
Figures 15.3-4 from H&B
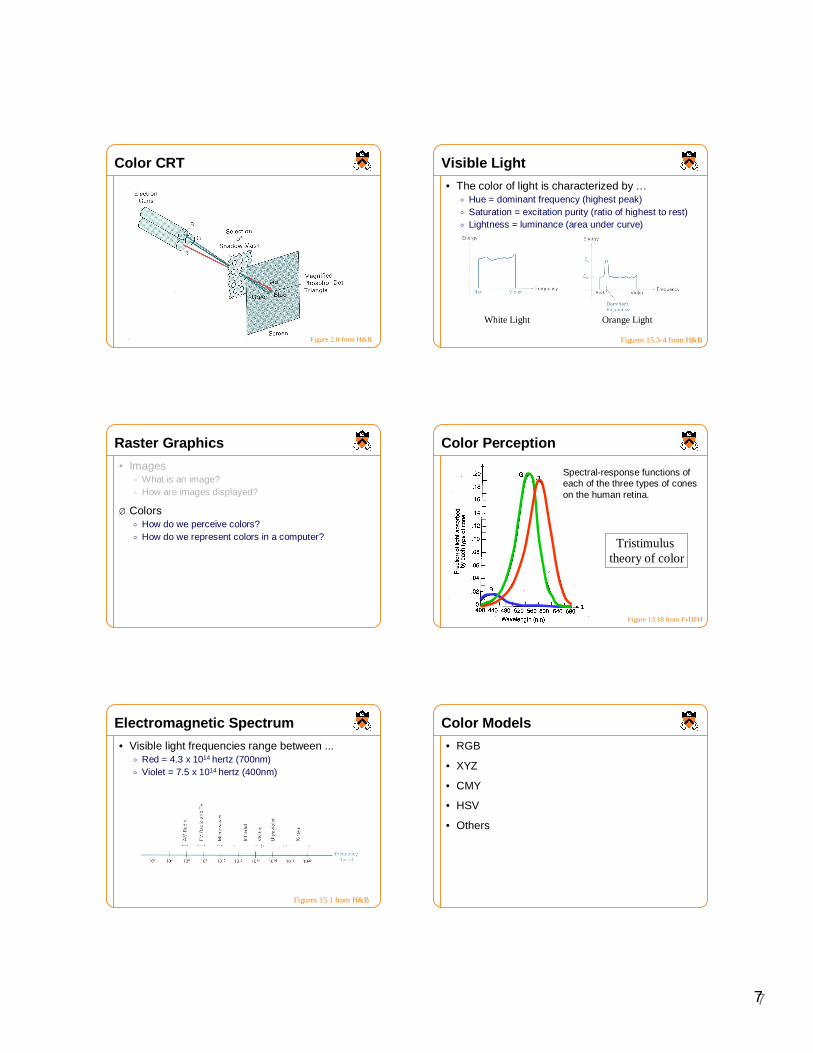
Color Perception
Figure 13.18 from FvDFH
Spectral-response functions of each of the three types of cones on the human retina.
Tristimulus theory of color
Color Models
• RGB
• XYZ
• CMY
• HSV
• Others
88
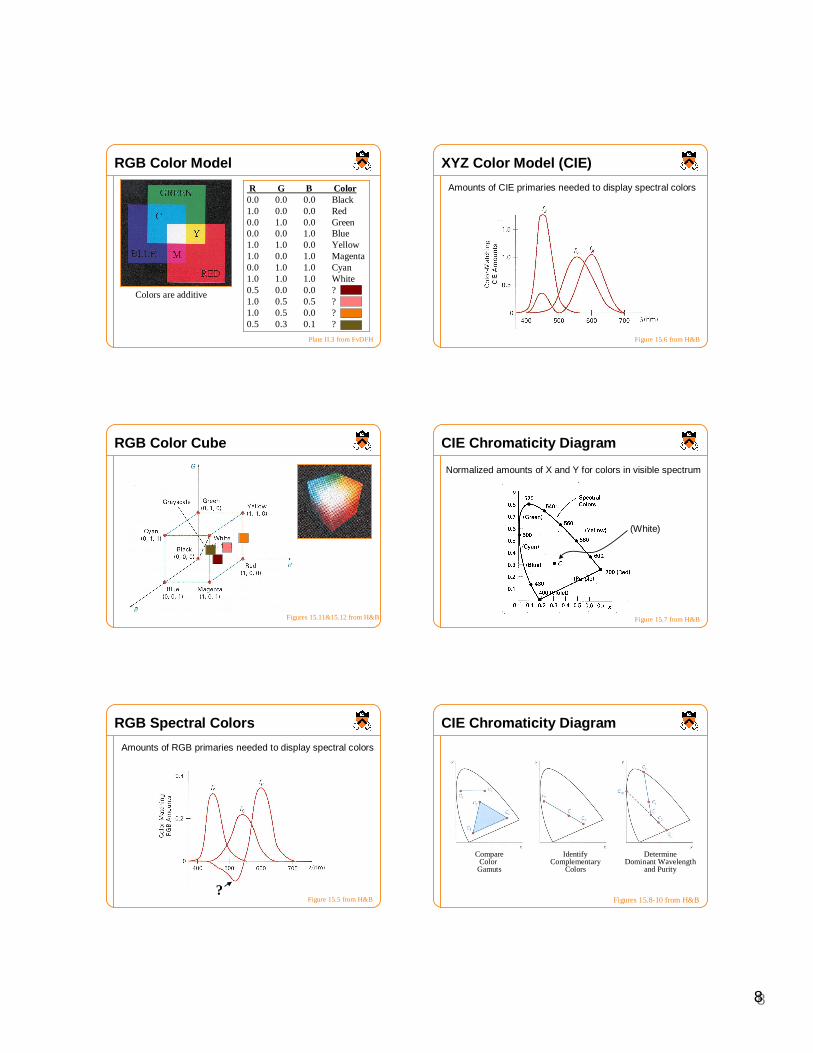
RGB Color Model
Plate II.3 from FvDFH
R G B Color 0.0 0.0 0.0 Black1.0 0.0 0.0 Red0.0 1.0 0.0 Green0.0 0.0 1.0 Blue1.0 1.0 0.0 Yellow1.0 0.0 1.0 Magenta0.0 1.0 1.0 Cyan1.0 1.0 1.0 White0.5 0.0 0.0 ?1.0 0.5 0.5 ?1.0 0.5 0.0 ?0.5 0.3 0.1 ?
Colors are additive
RGB Color Cube
Figures 15.11&15.12 from H&B
RGB Spectral Colors
Amounts of RGB primaries needed to display spectral colors
?Figure 15.5 from H&B
XYZ Color Model (CIE)
Amounts of CIE primaries needed to display spectral colors
Figure 15.6 from H&B
CIE Chromaticity Diagram
Normalized amounts of X and Y for colors in visible spectrum
Figure 15.7 from H&B
(White)
CIE Chromaticity Diagram
Figures 15.8-10 from H&B
CompareColor Gamuts
IdentifyComplementary
Colors
DetermineDominant Wavelength
and Purity
99
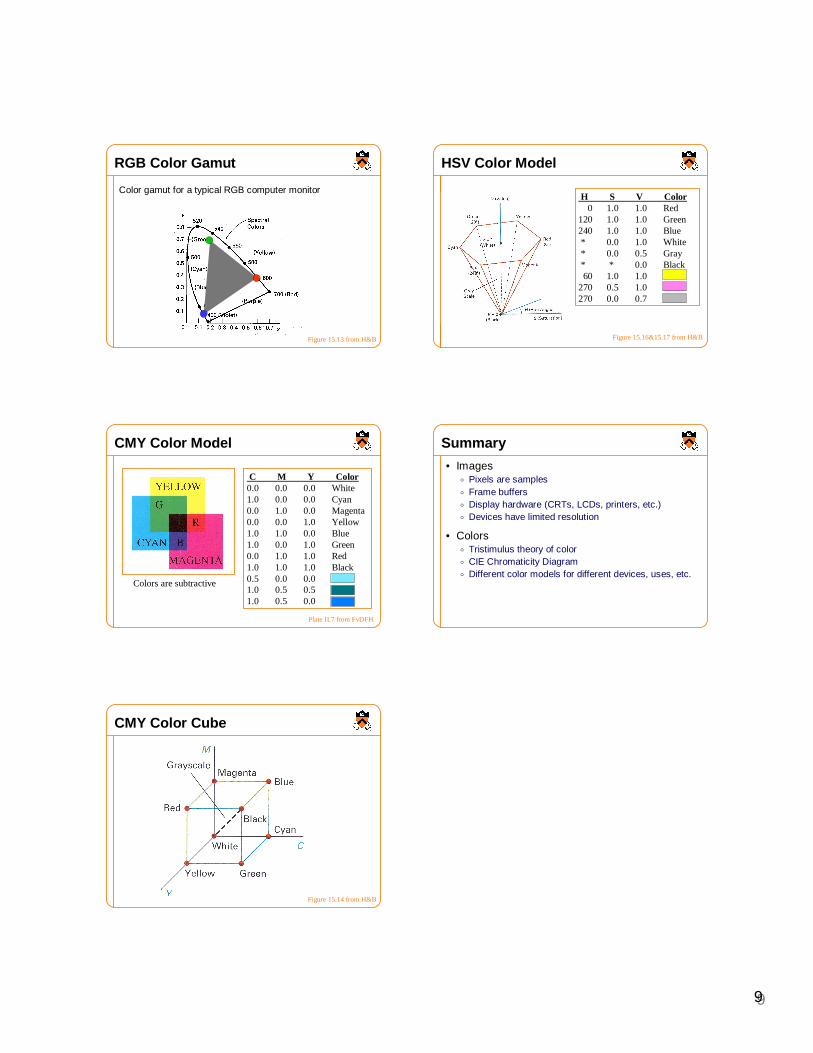
RGB Color Gamut
Color gamut for a typical RGB computer monitor
Figure 15.13 from H&B
CMY Color Model
Plate II.7 from FvDFH
C M Y Color 0.0 0.0 0.0 White1.0 0.0 0.0 Cyan0.0 1.0 0.0 Magenta0.0 0.0 1.0 Yellow1.0 1.0 0.0 Blue1.0 0.0 1.0 Green0.0 1.0 1.0 Red1.0 1.0 1.0 Black0.5 0.0 0.0 ?1.0 0.5 0.5 ?1.0 0.5 0.0 ?
Colors are subtractive
CMY Color Cube
Figure 15.14 from H&B
HSV Color Model
Figure 15.16&15.17 from H&B
H S V Color 0 1.0 1.0 Red
120 1.0 1.0 Green240 1.0 1.0 Blue* 0.0 1.0 White* 0.0 0.5 Gray* * 0.0 Black60 1.0 1.0 ?
270 0.5 1.0 ?270 0.0 0.7 ?
Summary
• Images� Pixels are samples� Frame buffers� Display hardware (CRTs, LCDs, printers, etc.)� Devices have limited resolution
• Colors� Tristimulus theory of color� CIE Chromaticity Diagram� Different color models for different devices, uses, etc.


![Edible Landscaping Intro.ppt [Last saved by user]](https://static.fdocuments.us/doc/165x107/61faadec5ba4d75fa25a2668/edible-landscaping-introppt-last-saved-by-user.jpg)