Computer 8 Nitrate copy Evaluation - · PDF fileThe percentage of various land types ......
14
Computer 8 Water Quality with Vernier 8 - 1 Nitrate INTRODUCTION The tests described here are used to measure the concentration of nitrate ions, NO 3 – , in a water sample. The concentration of nitrate will be expressed throughout this section in units of mg/L NO 3 – -N. The unit, NO 3 – -N, means simply “nitrogen that is in the form of nitrate.” Nitrate ions found in freshwater samples result from a variety of natural and manmade sources. Nitrates are an important source of nitrogen necessary for plants and animals to synthesize amino acids and proteins. Most nitrogen on earth is found in the atmosphere in the form of nitrogen gas, N 2 . Through a process called the nitrogen cycle, 1 nitrogen gas is changed into forms that are useable by plants and animals. These conversions include industrial production of fertilizers, as well as natural processes, such as legume-plant nitrogen fixation, plant and animal decomposition, and animal waste. Although nitrate levels in freshwater are usually less than 1 mg/L, manmade sources of nitrate may elevate levels above 3 mg/L. These sources include animal feedlots, runoff from fertilized fields, or treated municipal wastewater being returned to streams. Levels above 10 mg/L in drinking water can cause a potentially fatal disease in infants called methemoglobinemia, or Blue-Baby Syndrome. In this disease, nitrate converts hemoglobin into a form that can no longer transport oxygen. High nitrate concentrations also contribute to a condition in lakes and ponds called eutrophication, the excessive growth of aquatic plants and algae. Unpleasant odor and taste of water, as well as reduced clarity, often accompany this process. Eventually, dead biomass accumulates in the bottom of the lake, where it decays and compounds the problem by recycling nutrients. If other necessary nutrients are present, algal blooms can occur in a lake with as little as 0.50 mg/L NO 3 – -N. Nitrate pollution of surface and groundwater has become a major ecological problem in some agricultural areas. Although fertilizer in runoff is most often blamed, there is evidence that concentration of livestock in feedlots is now the major source of agricultural nitrate pollution. Runoff from fertilized fields is still a significant source of nitrate, although fertilizer use peaked in 1981 and has remained fairly constant since. 1 See Test 10: Ammonium Nitrogen, p. 10-1, for further information on the nitrogen cycle. Sources of Nitrate Ions • Agriculture runoff • Urban runoff • Animal feedlots and barnyards • Municipal and industrial wastewater • Automobile and industrial emissions • Decomposition of plants and animals Evaluation copy
Transcript of Computer 8 Nitrate copy Evaluation - · PDF fileThe percentage of various land types ......
Computer
8
Water Quality with Vernier 8 - 1
Nitrate
INTRODUCTION The tests described here are used to measure the concentration of nitrate ions, NO3
–, in a water sample. The concentration of nitrate will be expressed throughout this section in units of mg/L NO3
–-N. The unit, NO3–-N, means simply “nitrogen that is in the form of nitrate.”
Nitrate ions found in freshwater samples result from a variety of natural and manmade sources. Nitrates are an important source of nitrogen necessary for plants and animals to synthesize amino acids and proteins. Most nitrogen on earth is found in the atmosphere in the form of nitrogen gas, N2. Through a process called the nitrogen cycle,1 nitrogen gas is changed into forms that are useable by plants and animals. These conversions include industrial production of fertilizers, as well as natural processes, such as legume-plant nitrogen fixation, plant and animal decomposition, and animal waste.
Although nitrate levels in freshwater are usually less than 1 mg/L, manmade sources of nitrate may elevate levels above 3 mg/L. These sources include animal feedlots, runoff from fertilized fields, or treated municipal wastewater being returned to streams. Levels above 10 mg/L in drinking water can cause a potentially fatal disease in infants called methemoglobinemia, or Blue-Baby Syndrome. In this disease, nitrate converts hemoglobin into a form that can no longer transport oxygen.
High nitrate concentrations also contribute to a condition in lakes and ponds called eutrophication, the excessive growth of aquatic plants and algae. Unpleasant odor and taste of water, as well as reduced clarity, often accompany this process. Eventually, dead biomass accumulates in the bottom of the lake, where it decays and compounds the problem by recycling nutrients. If other necessary nutrients are present, algal blooms can occur in a lake with as little as 0.50 mg/L NO3
–-N.
Nitrate pollution of surface and groundwater has become a major ecological problem in some agricultural areas. Although fertilizer in runoff is most often blamed, there is evidence that concentration of livestock in feedlots is now the major source of agricultural nitrate pollution. Runoff from fertilized fields is still a significant source of nitrate, although fertilizer use peaked in 1981 and has remained fairly constant since.
1 See Test 10: Ammonium Nitrogen, p. 10-1, for further information on the nitrogen cycle.
Sources of Nitrate Ions
• Agriculture runoff
• Urban runoff
• Animal feedlots and barnyards
• Municipal and industrial wastewater
• Automobile and industrial emissions
• Decomposition of plants and animals
Evalua
tion co
py
Computer 8
8 - 2 Water Quality with Vernier
Expected Levels The nitrate level in freshwater is usually found in the range of 0.1 to 4 mg/L NO3
–-N. Unpolluted waters generally have nitrate levels below 1 mg/L. The effluent of some sewage treatment plants may have levels in excess of 20 mg/L.
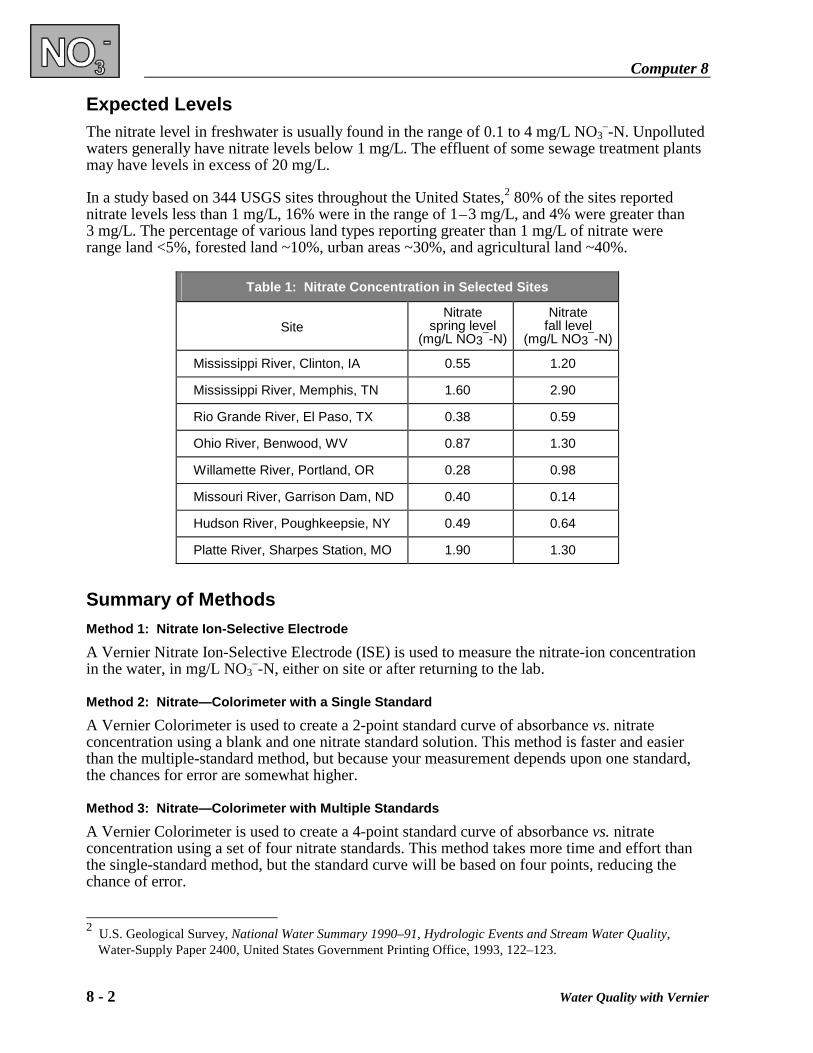
In a study based on 344 USGS sites throughout the United States,2 80% of the sites reported nitrate levels less than 1 mg/L, 16% were in the range of 1 – 3 mg/L, and 4% were greater than 3 mg/L. The percentage of various land types reporting greater than 1 mg/L of nitrate were range land <5%, forested land ~10%, urban areas ~30%, and agricultural land ~40%.
Table 1: Nitrate Concentration in Selected Sites
Site Nitrate
spring level (mg/L NO3
–-N)
Nitrate fall level
(mg/L NO3–-N)
Mississippi River, Clinton, IA 0.55 1.20
Mississippi River, Memphis, TN 1.60 2.90
Rio Grande River, El Paso, TX 0.38 0.59
Ohio River, Benwood, WV 0.87 1.30
Willamette River, Portland, OR 0.28 0.98
Missouri River, Garrison Dam, ND 0.40 0.14
Hudson River, Poughkeepsie, NY 0.49 0.64
Platte River, Sharpes Station, MO 1.90 1.30
Summary of Methods Method 1: Nitrate Ion-Selective Electrode
A Vernier Nitrate Ion-Selective Electrode (ISE) is used to measure the nitrate-ion concentration in the water, in mg/L NO3
–-N, either on site or after returning to the lab.
Method 2: Nitrate—Colorimeter with a Single Standard
A Vernier Colorimeter is used to create a 2-point standard curve of absorbance vs. nitrate concentration using a blank and one nitrate standard solution. This method is faster and easier than the multiple-standard method, but because your measurement depends upon one standard, the chances for error are somewhat higher.
Method 3: Nitrate—Colorimeter with Multiple Standards
A Vernier Colorimeter is used to create a 4-point standard curve of absorbance vs. nitrate concentration using a set of four nitrate standards. This method takes more time and effort than the single-standard method, but the standard curve will be based on four points, reducing the chance of error.
2 U.S. Geological Survey, National Water Summary 1990–91, Hydrologic Events and Stream Water Quality, Water-Supply Paper 2400, United States Government Printing Office, 1993, 122–123.
Nitrate
Water Quality with Vernier 8 - 3
Method 1: NITRATE ION-SELECTIVE ELECTRODE
Materials Checklist
___ computer ___ Low Standard (1 mg/L NO3–-N)
___ Vernier computer interface ___ High Standard (100 mg/L NO3–-N)
___ Logger Pro ___ wash bottle with distilled water ___ Nitrate Ion-Selective Electrode ___ small paper or plastic cup (optional) ___ tissues
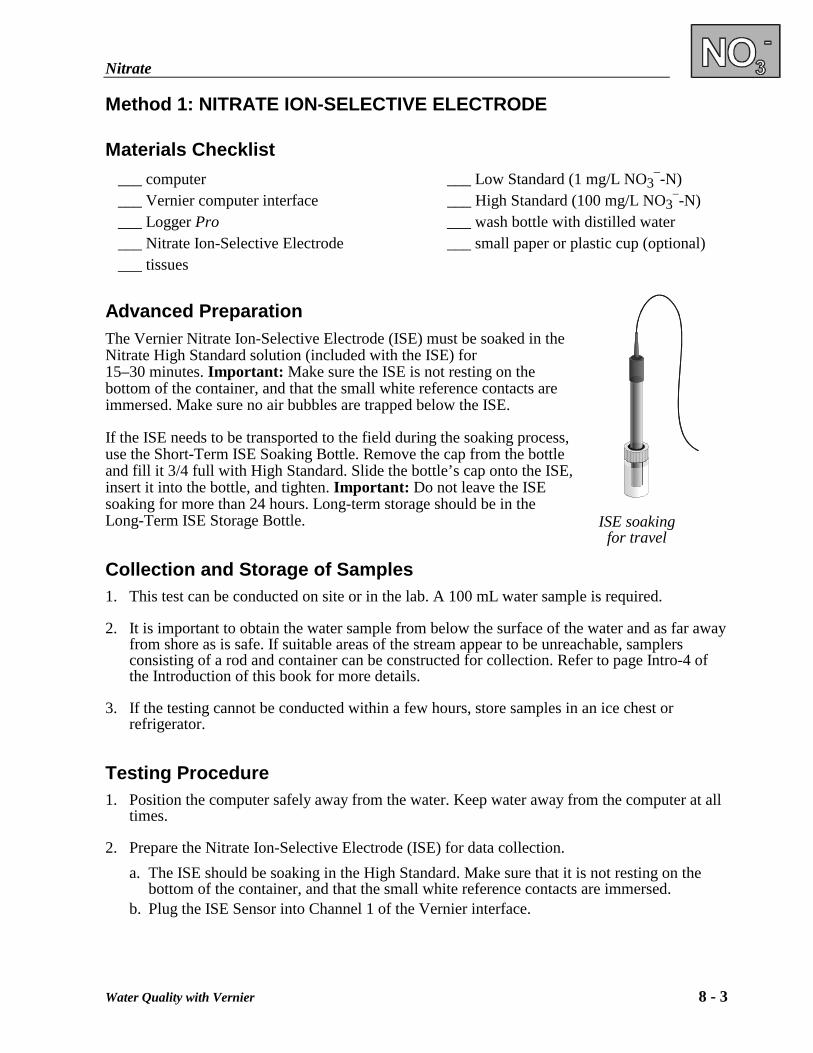
Advanced Preparation The Vernier Nitrate Ion-Selective Electrode (ISE) must be soaked in the Nitrate High Standard solution (included with the ISE) for 15–30 minutes. Important: Make sure the ISE is not resting on the bottom of the container, and that the small white reference contacts are immersed. Make sure no air bubbles are trapped below the ISE.
If the ISE needs to be transported to the field during the soaking process, use the Short-Term ISE Soaking Bottle. Remove the cap from the bottle and fill it 3/4 full with High Standard. Slide the bottle’s cap onto the ISE, insert it into the bottle, and tighten. Important: Do not leave the ISE soaking for more than 24 hours. Long-term storage should be in the Long-Term ISE Storage Bottle.
Collection and Storage of Samples 1. This test can be conducted on site or in the lab. A 100 mL water sample is required.
2. It is important to obtain the water sample from below the surface of the water and as far away from shore as is safe. If suitable areas of the stream appear to be unreachable, samplers consisting of a rod and container can be constructed for collection. Refer to page Intro-4 of the Introduction of this book for more details.
3. If the testing cannot be conducted within a few hours, store samples in an ice chest or refrigerator.
Testing Procedure 1. Position the computer safely away from the water. Keep water away from the computer at all
times.
2. Prepare the Nitrate Ion-Selective Electrode (ISE) for data collection.
a. The ISE should be soaking in the High Standard. Make sure that it is not resting on the bottom of the container, and that the small white reference contacts are immersed.
b. Plug the ISE Sensor into Channel 1 of the Vernier interface.
ISE soaking for travel
Computer 8
8 - 4 Water Quality with Vernier
3. Prepare the computer for data collection by opening the file “08 Nitrate ISE” from the Water Quality with Vernier folder of Logger Pro.
4. You are now ready to calibrate the Nitrate ISE.
First Calibration Point
a. Choose Calibrate � CH1: Nitrate ISE (mg/L) from the Experiment menu and then click .
b. Type 100 (the concentration in mg/L NO3–-N) in the edit box.
c. When the displayed voltage reading for Reading 1 stabilizes, click .
Second Calibration Point
d. Rinse the ISE thoroughly with distilled water and gently blot it dry with a tissue. Be very gentle when blotting the membrane. Important: Failure to carefully rinse and dry the ISE will contaminate the standard.
e. Place the tip of the ISE into the Low Standard (1 mg/L NO3–-N). Be sure that the ISE is
not resting on the bottom of the bottle and that the small white reference contacts are immersed. Make sure no air bubbles are trapped below the ISE.
f. After briefly swirling the solution, hold the ISE still and wait approximately 30 seconds for the voltage reading displayed on the computer screen to stabilize.
g. Enter 1 (the concentration in mg/L NO3–-N) in the edit box.
h. When the displayed voltage reading for Reading 2 stabilizes, click , then click .
5. You are now ready to collect nitrate concentration data.
a. Rinse the ISE with distilled water and gently blot it dry. b. Place the tip of the ISE into the stream at Site 1, or into a cup with sample water from the
stream. Make sure the ISE is not resting on the bottom and that the small white reference contacts are immersed. Make sure that no air bubbles are trapped below the ISE.
c. Click to begin data collection. d. Click to begin a 10 s sampling run. Important: Leave the probe tip submerged for
the 10 seconds that data is being collected. e. When the sampling run is complete, stop data collection and record the mean nitrate
concentration value on the Data & Calculations sheet.
6. Return to Step 5 to obtain a second reading.

Nitrate
Water Quality with Vernier 8 - 5
DATA & CALCULATIONS
Method 1: Nitrate Ion-Selective Electrode Stream or lake: ____________________________ Time of day: ____________________________
Site name: ________________________________ Student name: __________________________
Site number: ______________________________ Student name: __________________________
Date: ____________________________________ Student name: __________________________
Column A
Reading Nitrate (mg/L NO3
–-N)
1
2
Average
Column Procedure:
A. Record the nitrate concentration from the computer, in mg/L NO3–-N.
Field Observations (e.g., weather, geography, vegetation along stream) ___________________________
____________________________________________________________________________________
____________________________________________________________________________________
____________________________________________________________________________________
Test Completed: ________________ Date: ______
Computer 8
8 - 6 Water Quality with Vernier
Method 2: NITRATE—COLORIMETER WITH A SINGLE STANDARD
Materials Checklist
___ computer ___ wash bottle with distilled water ___ Vernier computer interface ___ two 10 mL pipets (or graduated cylinders) ___ Logger Pro ___ pipet pump or pipet bulb ___ Vernier Colorimeter ___ one 125 mL Erlenmeyer flask per test ___ Mixed Acid Reagent ___ one rubber stopper per Erlenmeyer flask ___ Nitrate Reducing Reagent ___ tissues (preferably lint-free) ___ nitrate standard (2.5 mg/L NO3
–-N) ___ 0.1 g plastic measuring spoon ___ one cuvette
Collection and Storage of Samples 1. This test can be conducted on site or in the lab. A 100 mL water sample is required.
2. It is important to obtain the water sample from below the surface of the water and as far away from shore as is safe. If suitable areas of the stream appear to be unreachable, samplers consisting of a rod and container can be constructed for collection. Refer to page Intro-4 of the Introduction of this book for more details.
3. If the testing cannot be conducted within a few hours, refrigerate the samples. Do not keep samples more than 24 hours.
Testing Procedure 1. Obtain collection site samples and standard for testing.
a. Label one Erlenmeyer flask for each of the collection site samples you will be testing. b. Measure 5 mL of sample into each corresponding Erlenmeyer flask. c. Label one Erlenmeyer flask for the nitrate standard solution (2.5 mg/L) and measure 5 mL
of standard into the flask. 2. Prepare the collection site samples for testing.
a. Add 5 mL of Mixed Acid Reagent to each flask (also to the 2.5 mg/L nitrate standard). Stopper each flask and shake. Wait 2 minutes for a complete reaction to occur.
b. Use the 0.1 g plastic spoon to add two spoonfuls (~0.2 g) of Nitrate Reducing Reagent to each of the flasks.
c. Stopper the flasks and invert at a rate of 50 – 60 times per minute for 2 minutes. Wait 12 minutes for a complete reaction. During the 12 minute reaction period, proceed to Step 3. Note: Any undissolved portion of Nitrate Reducing Agent that remains in the bottom of the tube will not adversely affect results.
3. Position the computer safely away from the water. Keep water away from the computer at all
times.

Nitrate
Water Quality with Vernier 8 - 7
4. Plug the Colorimeter into Channel 1 of the Vernier interface
5. Prepare the computer for data collection by opening the file “08 Nitrate Colorimeter” from the Water Quality with Vernier folder of Logger Pro.
6. Prepare a blank by filling an empty cuvette ¾ full with distilled water. Seal the cuvette with a lid. To correctly use a colorimeter cuvette, remember:
• All cuvettes should be wiped clean and dry on the outside with a tissue. • Handle cuvettes only by the top edge of the ribbed sides. • All solutions should be free of bubbles. • Always position the cuvette with its reference mark facing toward the white reference mark
at the top of the cuvette slot on the colorimeter.
7. Calibrate the Colorimeter.
a. Open the Colorimeter lid. b. Holding the cuvette by the upper edges, place it in the cuvette slot of the Colorimeter.
Close the lid. c. If your Colorimeter has a CAL button, Press the < or > button on the Colorimeter to select
a wavelength of 565 nm (Green) for this experiment. Press the CAL button until the red LED begins to flash. Then release the CAL button. When the LED stops flashing, the calibration is complete.
8. After the 12 minute reaction period has ended, you are ready to collect absorbance-
concentration data for the blank and the nitrate standard (2.5 mg/L). This process will create a standard curve that will be used to determine the nitrate concentrations of the samples.
a. Click to start data collection. b. While the blank is still in the Colorimeter, wait for the absorbance value displayed in the
meter to stabilize, then click . c. Type 0 (the concentration in mg/L NO3
–-N) in the edit box, then press ENTER. d. Discard the water in the cuvette. Using the 2.5 mg/L nitrate standard, rinse the cuvette
twice with ~1-mL amounts and then fill it ¾ full. After closing the lid, wait for the percent transmittance value displayed on the computer screen to stabilize. Click .
e. Type 2.5 (the concentration in mg/L NO3–-N) in the edit box, then press ENTER.
f. Click when you have finished. g. Dispose of the remaining solution in the flask as directed by your instructor. CAUTION:
Any remaining solid particles in the flask are cadmium, a toxic metal. 9. Examine the graph of absorbance vs. concentration. To see the relationship between these
two variables, click on the Linear Fit button, . A linear regression line will be displayed on your graph.
10. Find the absorbance of the sample.
a. Rinse the cuvette twice with solution from the first sample flask and fill it about ¾ full. Wipe the outside of the cuvette, place it into the Colorimeter and close the lid.
b. Monitor the absorbance value in the meter. When the absorbance value has stabilized, record it on the Data & Calculations sheet.
11. Use the following method to determine the unknown concentration. With the linear
regression curve still displayed on your graph, choose Interpolate from the Analyze menu. A

Computer 8
8 - 8 Water Quality with Vernier
vertical cursor now appears on the graph. The cursor’s x and y coordinates are displayed in a floating box. Move the cursor along the regression line until the absorbance (y) value is approximately the same as the absorbance value you recorded in Step 9. The corresponding x value is the concentration of the unknown solution in mg/L NO3
–-N. Record it on the Data & Calculations sheet.
12. Repeat Steps 10–11 for each of the remaining flasks.

Nitrate
Water Quality with Vernier 8 - 9
DATA & CALCULATIONS
Method 2: Nitrate—Colorimeter with a Single Standard Stream or lake: ____________________________ Time of day: ____________________________
Site name: ________________________________ Student name: __________________________
Site number: ______________________________ Student name: __________________________
Date: ____________________________________ Student name: __________________________
Column A B
Reading Absorbance NO3–-N
(mg/L)
1
2
Average Nitrate
(mg/L NO3–-N)
Column Procedure:
A. Record the absorbance value from the computer. B. Record the NO3
–-N concentration as determined by interpolation of the standard curve.
Field Observations (e.g., weather, geography, vegetation along stream) ___________________________
____________________________________________________________________________________
____________________________________________________________________________________
____________________________________________________________________________________
Test Completed: ________________ Date: ______

Computer 8
8 - 10 Water Quality with Vernier
Method 3: NITRATE—COLORIMETER WITH MULTIPLE STANDARDS
Materials Checklist
___ computer ___ two 10 mL pipets ___ Vernier computer interface ___ pipet pump or pipet bulb ___ Logger Pro ___ distilled water ___ Vernier Colorimeter ___ tissues (preferably lint-free) ___ Mixed Acid Reagent ___ one 125 mL Erlenmeyer flask per test ___ Nitrate Reducing Reagent ___ one rubber stopper per Erlenmeyer flask ___ nitrate standard (2.5 mg/L NO3
–-N) ___ 0.1 g plastic measuring spoon ___ 10 mL graduated cylinder ___ stirring rod
Collection and Storage of Samples 1. This test can be conducted on site or in the lab. A 100 mL water sample is required.
2. It is important to obtain the water sample from below the surface of the water and as far away from shore as is safe. If suitable areas of the stream appear to be unreachable, samplers consisting of a rod and container can be constructed for collection. Refer to page Intro-4 of the Introduction of this book for more details.
3. If the testing cannot be conducted within a few hours, refrigerate the samples.
Testing Procedure 1. Add about 30 mL of 2.5 mg/L NO3
–-N standard solution to a 100 mL beaker. Obtain about 30 mL of distilled water in another 100 mL beaker.
2. Label four clean, dry, Erlenmeyer flasks 1 – 4. Pipet 4, 6, 8 and 10 mL of 2.5 mg/L NO3–-N
solution into Flasks 1 – 4, respectively. With a second pipet, deliver 6, 4, and 2 mL of distilled water into Flasks 1 – 3, respectively. (Flask 4 has no distilled water added to it.) Thoroughly mix each solution with a stirring rod. Clean and dry the stirring rod between stirrings. Volumes and concentrations for the trials are summarized below:
Flask number
2.5 mg/L NO3–-N
(mL) Distilled H2O
(mL) Concentration (mg/L NO3
–-N)
1 4 6 1.0 2 6 4 1.5 3 8 2 2.0 4 ~10 0 2.5
3. Measure 5 mL of the standard from Flask 1 into a graduated cylinder. Discard the solution
remaining in the flask as directed by your instructor.
4. Add 5 mL of Mixed Acid Reagent to the graduated cylinder containing the standard from Flask 1, to bring the volume to a total of 10 mL.
5. Pour the contents of the graduated cylinder back into the flask. Stopper each flask and shake.

Nitrate
Water Quality with Vernier 8 - 11
6. Repeat Steps 3 – 5 for each of the remaining standards.
7. Use the 0.1 g plastic spoon to add two spoonfuls (~0.2 g) of Nitrate Reducing Reagent to each of the flasks.
8. Stopper the flasks and invert at a rate of 50 – 60 times per minute for 2 minutes. Wait 12 minutes for a complete reaction and best test results. During the 12 minute reaction period, proceed to Step 9 to continue with lab preparation. Note: Any undissolved portion of Nitrate Reducing Agent that remains in the bottom of the tube will not adversely affect results.
9. Position the computer safely away from the water. Keep water away from the computer at all times.
10. Plug the Colorimeter into Channel 1 of the Vernier interface.
11. Prepare the computer for data collection by opening the file “08 Nitrate Colorimeter” from the Water Quality with Vernier folder of Logger Pro.
12. Prepare a blank by filling an empty cuvette ¾ full with distilled water. Seal the cuvette with a lid. To correctly use a colorimeter cuvette, remember:
• All cuvettes should be wiped clean and dry on the outside with a tissue. • Handle cuvettes only by the top edge of the ribbed sides. • All solutions should be free of bubbles. • Always position the cuvette with its reference mark facing toward the white reference mark
at the top of the cuvette slot on the colorimeter.
13. Calibrate the Colorimeter.
a. Open the Colorimeter lid. b. Holding the cuvette by the upper edges, place it in the cuvette slot of the Colorimeter.
Close the lid. c. If your Colorimeter has a CAL button, Press the < or > button on the Colorimeter to select
a wavelength of 565 nm (Green) for this experiment. Press the CAL button until the red LED begins to flash. Then release the CAL button. When the LED stops flashing, the calibration is complete.
14. After the 12 minute reaction period has ended, you are ready to collect absorbance-
concentration data for the four nitrate standard solutions. This process will create a standard curve that will be used to determine the nitrate concentrations of the samples.
a. Click to start data collection. b. Empty the water from the cuvette. Using the solution in Flask 1, rinse the cuvette twice
with ~1 mL amounts and then fill it ¾ full. Wipe the outside with a tissue and place it in the Colorimeter. After closing the lid, wait for the absorbance value displayed on the computer screen to stabilize.
c. When the absorbance value has stabilized, click . d. Type 1.0 (the concentration in mg/L NO3
–-N) in the edit box, then press ENTER. e. Discard the cuvette contents as directed by your teacher. Using the solution in Flask 2,
rinse the cuvette twice with ~1 mL amounts and then fill it 3/4 full. After closing the lid, wait for the absorbance value displayed on the computer screen to stabilize.
f. When the absorbance readings have stabilized, click . g. Type 1.5 (the concentration in mg/L NO3
–-N) in the edit box, the press ENTER.

Computer 8
8 - 12 Water Quality with Vernier
h. Repeat for Flask 3 (2.0 mg/L NO3–-N) and Flask 4 (2.5 mg/L NO3
–-N). i. Click when you have finished. j. Discard the standard solutions, as directed by your instructor. CAUTION: Any remaining
solid particles in the flask are cadmium, a toxic metal.
15. Examine the graph of absorbance vs. concentration. To see if the curve represents a direct relationship between these two variables, click on the Linear Fit button, . A best-fit linear regression line will be shown for your data points. This line should pass near or through the data points and the origin of the graph. (Note: Another options is to choose Curve Fit from the Analyze menu, and then select Proportional. The Proportional fit, (y=Ax) has a y-intercept value equal to 0; therefore, this regression line will always pass through the origin of the graph).
16. Prepare the water samples for testing. Repeat Steps 3 – 8 using samples from each of the collection sites you will be testing. If necessary, obtain more flasks and label them appropriately.
17. Find the absorbance of the sample.
a. After the 12 minute reaction period has finished, rinse the cuvette twice with solution from the flask and fill it about ¾ full. Wipe the outside of the cuvette, place it into the Colorimeter, and close the lid.
b. Watch the absorbance value in the meter. When the absorbance value has stabilized, record it on the Data & Calculations sheet.
18. Use the following method to determine the unknown concentration. With the linear
regression curve still displayed on your graph, choose Interpolate from the Analyze menu. A vertical cursor now appears on the graph. The cursor’s x and y coordinates are displayed in a floating box. Move the cursor along the regression line until the absorbance (y) value is approximately the same as the absorbance value you recorded in Step 16. The corresponding x value is the concentration of the unknown solution in mg/L NO3
–-N. Record it on the Data & Calculations sheet.
19. Repeat Steps 17 – 18 for the remaining flasks.

Nitrate
Water Quality with Vernier 8 - 13
DATA & CALCULATIONS
Method 3: Nitrate—Colorimeter with Multiple Standards Stream or lake: ____________________________ Time of day: ____________________________
Site name: ________________________________ Student name: __________________________
Site number: ______________________________ Student name: __________________________
Date: ____________________________________ Student name: __________________________
Column A B
Reading Absorbance NO3–-N
(mg/L)
1
2
Average Nitrate
(mg/L NO3–-N)
Column Procedure:
A. Record the absorbance value from the computer. B. Record the NO3
–-N concentration as determined by interpolation of the standard curve.
Field Observations (e.g., weather, geography, vegetation along stream) ___________________________
____________________________________________________________________________________
____________________________________________________________________________________
____________________________________________________________________________________
Test Completed: ________________ Date: ______

Vernier Lab Safety Instructions Disclaimer
THIS IS AN EVALUATION COPY OF THE VERNIER STUDENT LAB. This copy does not include:
Safety information Essential instructor background information Directions for preparing solutions Important tips for successfully doing these labs
The complete Water Quality with Vernier lab manual includes 16 water quality tests and essential teacher information. The full lab book is available for purchase at: http://www.vernier.com/cmat/wqv.html
Vernier Software & Technology
13979 S.W. Millikan Way • Beaverton, OR 97005-2886 Toll Free (888) 837-6437 • (503) 277-2299 • FAX (503) 277-2440
[email protected] • www.vernier.com